Putnam Sustainable Retirement 2065 Fund seeks capital appreciation and current income consistent with a decreasing emphasis on capital appreciation and an increasing emphasis on current income as it approaches its target date.
The following tables describe the fees and expenses you may pay if you buy, hold, and sell shares of the fund. You may pay other fees, such as brokerage commissions and other fees to financial intermediaries, which are not reflected in the tables and examples below. You may qualify for sales charge discounts if you and your family invest, or agree to invest in the future, at least $50,000 in Putnam funds. More information about these and other discounts is available from your financial professional and in How do I buy fund shares? beginning on page 227 of the fund’s prospectus, in the Appendix to the fund’s prospectus, and in How to buy shares beginning on page II-3 of the fund’s statement of additional information (“SAI”).
Shareholder Fees - Putnam Sustainable Retirement 2065 Fund |
Class A 2065 |
Class C 2065 |
Class R 2065 |
Class R3 2065 |
Class R4 2065 |
Class R5 2065 |
Class R6 2065 |
Class Y 2065 |
||
|---|---|---|---|---|---|---|---|---|---|---|
| Maximum Sales Charge Imposed on Purchases (as a percentage of Offering Price) | 5.75% | none | none | none | none | none | none | none | ||
| Maximum Deferred Sales Charge (as a percentage) | 1.00% | [1] | 1.00% | [2] | none | none | none | none | none | none |
| [1] | Applies only to certain redemptions of shares bought with no initial sales charge. |
| [2] | This charge is eliminated after one year. |
Annual Fund Operating Expenses - Putnam Sustainable Retirement 2065 Fund |
Class A 2065 |
Class C 2065 |
Class R 2065 |
Class R3 2065 |
Class R4 2065 |
Class R5 2065 |
Class R6 2065 |
Class Y 2065 |
|
|---|---|---|---|---|---|---|---|---|---|
| Management Fees (as a percentage of Assets) | 0.55% | 0.55% | 0.55% | 0.55% | 0.55% | 0.55% | 0.55% | 0.55% | |
| Distribution and Service (12b-1) Fees | 0.25% | 1.00% | 0.50% | 0.25% | none | none | none | none | |
| Other Expenses (as a percentage of Assets): | 10.95% | 10.95% | 11.10% | 11.10% | 11.10% | 10.95% | 10.85% | 10.95% | |
| Acquired Fund Fees and Expenses | 0.57% | 0.57% | 0.57% | 0.57% | 0.57% | 0.57% | 0.57% | 0.57% | |
| Expenses (as a percentage of Assets) | 12.32% | 13.07% | 12.72% | 12.47% | 12.22% | 12.07% | 11.97% | 12.07% | |
| Fee Waiver or Reimbursement | [1] | (11.47%) | (11.47%) | (11.47%) | (11.47%) | (11.47%) | (11.47%) | (11.47%) | (11.47%) |
| Net Expenses (as a percentage of Assets) | 0.85% | 1.60% | 1.25% | 1.00% | 0.75% | 0.60% | 0.50% | 0.60% | |
| [1] | Reflects a contractual obligation of the Investment Manager to limit certain fund expenses through November 30, 2027. This obligation may be modified or discontinued only with approval of the Board of Trustees. |
The following hypothetical example is intended to help you compare the cost of investing in the fund with the cost of investing in other funds. It assumes that you invest $10,000 in the fund for the time periods indicated and then, except as indicated, redeem all your shares at the end of those periods. It assumes a 5% return on your investment each year and that the fund’s operating expenses remain the same. Only the first three years of each period in the example take into account the expense reimbursement described above. Your actual costs may be higher or lower.
Expense Example - Putnam Sustainable Retirement 2065 Fund - USD ($) |
Expense Example, with Redemption, 1 Year |
Expense Example, with Redemption, 3 Years |
Expense Example, with Redemption, 5 Years |
Expense Example, with Redemption, 10 Years |
Expense Example, No Redemption, 1 Year |
Expense Example, No Redemption, 3 Years |
Expense Example, No Redemption, 5 Years |
Expense Example, No Redemption, 10 Years |
|---|---|---|---|---|---|---|---|---|
| Class A 2065 | 657 | 831 | 3,266 | 7,955 | ||||
| Class C 2065 | 263 | 505 | 3,166 | 8,066 | 163 | 505 | 3,166 | 8,066 |
| Class R 2065 | 127 | 397 | 3,023 | 8,006 | ||||
| Class R3 2065 | 102 | 318 | 2,918 | 7,897 | ||||
| Class R4 2065 | 77 | 240 | 2,812 | 7,785 | ||||
| Class R5 2065 | 61 | 192 | 2,748 | 7,715 | ||||
| Class R6 2065 | 51 | 160 | 2,705 | 7,668 | ||||
| Class Y 2065 | 61 | 192 | 2,748 | 7,715 |
The fund pays transaction-related costs, such as commissions, when it buys and sells securities (or “turns over” its portfolio). A higher turnover rate may indicate higher transaction costs and may result in higher taxes when the fund’s shares are held in a taxable account. These costs, which are not reflected in annual fund operating expenses or the above example, affect fund performance. The fund’s turnover rate in the most recent fiscal year was 45%.
Investments
The fund is one of a series of target date funds that invest primarily in exchange-traded funds (“ETFs”) that focus on investments with positive sustainability or environmental, social, and governance (“ESG”) characteristics, referred to as underlying funds. The underlying funds include funds managed by Franklin Advisers, Inc. (“Franklin Advisers” or the “Investment Manager”), the fund’s investment manager, and funds managed by affiliated investment advisers. The fund’s asset allocation strategy may be attractive to investors who plan to retire or otherwise intend to begin making periodic withdrawals of their investments in or about 2065 (the target date). The fund is designed to provide diversification among different asset classes by investing its assets in the underlying funds.
Under normal circumstances, the fund will invest in underlying funds (which, for purposes of this policy, include money market mutual funds advised by the Investment Manager or its affiliates) such that, in the aggregate, it has indirect exposure to investments that meet each underlying fund’s respective sustainability or ESG criteria and that represent at least 80% of the value of its net assets. This policy is non-fundamental and may be changed only after 60 days’ notice to shareholders. The Investment Manager may not apply ESG or sustainability criteria to investments that are not subject to the fund’s 80% policy, and such investments may not meet the applicable ESG or sustainability criteria. Through its investments in underlying funds, the fund makes use of a range of ESG- and sustainability- oriented investment strategies and invests across a variety of asset classes. The ESG or sustainability criteria will differ across the underlying funds. These differences may arise both from differences in the underlying funds’ asset classes (such as the characteristics of non-U.S. versus U.S. issuers, or the structural differences (e.g., position in the capital structure) between equity and fixed-income investments) as well as from different managers’ styles. In implementing an underlying fund’s investment strategy, the portfolio managers of the underlying fund may apply and weigh different ESG criteria differently than the portfolio managers of the other underlying funds. There are also expected to be differences in how the portfolio managers of the underlying funds source ESG-related or sustainability-oriented research (e.g., proprietary versus third-party research) and/or their approach to selecting companies based on ESG or sustainability criteria.
The fund’s target allocations among asset classes and underlying funds will increasingly emphasize capital preservation and income over time and will change gradually based on the number of remaining years until the fund’s target date, as shown in the predetermined “glide path” in the chart under “What are the funds’ and each underlying fund’s main investment strategies and related risks?” The Investment Manager adjusts these allocations at the end of each calendar quarter based on the glide path.
Pending investment in underlying funds, the fund also expects to temporarily invest cash balances resulting from purchase activity by fund shareholders in Putnam Government Money Market Fund, a mutual fund sponsored by the Investment Manager, or in cash or cash equivalents. The fund also expects to invest a portion of its assets in Putnam Government Money Market Fund or in cash or cash equivalents in order to manage shareholder redemptions. The percentage of a fund invested in Putnam Government Money Market Fund is expected to vary over time and will depend on the level of purchase and redemption activity by fund shareholders.
The following table presents your fund’s approximate allocations to each asset class and underlying fund as of September 30, 2024 (taking into account any tactical adjustments described below) and its projected approximate allocations to those asset classes and underlying funds as of September 30, 2025. The table does not reflect temporary investments in Putnam Government Money Market Fund or in cash or cash equivalents. By comparing the percentage allocations of your fund in the table, you can see how its allocations are expected to change during the one-year period beginning on September 30, 2024. The table also shows the approximate allocations of other Putnam Sustainable Retirement Funds, which are designed for investors with different target retirement dates. Over a five-year period, each fund’s allocations will gradually change to resemble the allocations of the fund with the next earliest target date. The table illustrates how a fund’s allocations are expected to change over time to increasingly emphasize capital preservation and income.
| Underlying Fund* | Year | 2065 (your fund) | 2060 | 2055 | 2050 | 2045 | 2040 | 2035 | 2030 | 2025 | Maturity Fund |
| Putnam Sustainable Leaders ETF | 2024 | 48.6% | 47.2% | 44.8% | 42.3% | 39.7% | 36.4% | 31.7% | 21.0% | 14.9% | 14.1% |
| 2025 | 47.6% | 45.8% | 43.3% | 40.7% | 38.4% | 35.2% | 30.3% | 18.6% | 14.3% | 14.1% | |
| Putnam Sustainable Future ETF | 2024 | 23.8% | 23.1% | 21.9% | 20.6% | 19.4% | 17.9% | 15.8% | 10.5% | 7.5% | 7.1% |
| 2025 | 23.8% | 22.9% | 21.7% | 20.4% | 19.2% | 17.6% | 15.2% | 9.3% | 7.1% | 7.1% | |
| Putnam PanAgora ESG Inter-national Equity ETF | 2024 |
17.8% | 17.3% | 16.4% | 15.5% | 14.4% | 12.4% | 9.6% | 6.3% | 4.5% | 4.2% |
| 2025 | 17.8% | 17.2% | 16.2% | 15.3% | 14.2% | 11.9% | 9.1% | 5.6% | 4.3% | 4.2% | |
| Putnam PanAgora ESG Emer-ging Markets Equity ETF | 2024 |
4.9% | 4.8% | 4.5% | 4.2% | 3.8% | 2.2% | 0.1% | 0.0% | 0.0% | 0.0% |
| 2025 | 5.9% | 5.7% | 5.4% | 5.1% | 4.5% | 2.2% | 0.0% | 0.0% | 0.0% | 0.0% | |
| Putnam ESG Core Bond ETF | 2024 | 3.3% | 5.3% | 8.9% | 12.4% | 15.4% | 23.0% | 33.5% | 49.7% | 52.3% | 51.7% |
| 2025 | 3.3% | 5.9% | 9.7% | 13.0% | 16.1% | 24.8% | 35.4% | 53.4% | 51.8% | 51.7% | |
| Putnam ESG High Yield ETF | 2024 | 1.1% | 1.8% | 3.0% | 4.1% | 4.9% | 4.8% | 4.9% | 6.7% | 14.8% | 16.9% |
| 2025 | 1.1% | 2.0% | 3.2% | 4.3% | 4.9% | 4.8% | 5.3% | 7.1% | 16.5% | 16.9% | |
| Putnam ESG Ultra Short ETF | 2024 | 0.5% | 0.5% | 0.5% | 0.9% | 2.4% | 3.3% | 4.4% | 5.8% | 6.0% | 6.0% |
| 2025 | 0.5% | 0.5% | 0.5% | 1.2% | 2.7% | 3.5% | 4.7% | 6.0% | 6.0% | 6.0% | |
| Total Equity** | 2024 | 95.1% | 92.4% | 87.6% | 82.6% | 77.3% | 68.9% | 57.2% | 37.8% | 26.9% | 25.4% |
| 2025 | 95.1% | 91.6% | 86.6% | 81.5% | 76.3% | 66.9% | 54.6% | 33.5% | 25.7% | 25.4% | |
| Total Fixed Income** | 2024 | 4.9% | 7.6% | 12.4% | 17.4% | 22.7% | 31.1% | 42.8% | 62.2% | 73.1% | 74.6% |
| 2025 | 4.9% | 8.4% | 13.4% | 18.5% | 23.7% | 33.1% | 45.4% | 66.5% | 74.3% | 74.6% |
| * | Due to rounding, allocations shown in the table above may not total 100%. In addition, because of rounding in the calculation of allocations among underlying funds and market fluctuations, actual allocations might be more or less than these percentages. |
| ** | Equity and fixed-income allocations are hypothetical estimates based on an assumption that each of Putnam Sustainable Leaders ETF, Putnam Sustainable Future ETF, Putnam PanAgora ESG International Equity ETF, and Putnam PanAgora ESG Emerging Markets Equity ETF is equivalent to an equity investment and each of Putnam ESG Core Bond ETF, Putnam ESG High Yield ETF and Putnam ESG Ultra Short ETF is equivalent to a fixed-income investment. Actual allocations will vary. |
The fund’s target allocations may differ from the allocations shown in the table. The Investment Manager may change the glide path, the fund’s target allocations, and the underlying funds in which it invests at any time, although the Investment Manager generally expects these changes (other than the tactical adjustments described below) to be infrequent and generally in response to longer-term structural changes (e.g., in the average retirement age or life expectancy) that lead the fund’s portfolio managers to determine that a change is advisable. The Investment Manager may also make tactical adjustments from time to time in the fund’s allocations to underlying funds in response to market conditions within a range of +/- 15% from the allocations to fixed-income and equity asset classes as presented in the fund’s glide path.
It is assumed that investors will begin gradual withdrawals from the fund at around the target date. Near the end of the target date year, the fund’s target allocations will correspond to those of Putnam Sustainable Retirement Maturity Fund (“Maturity Fund”), a fund that seeks as high a rate of current income as the Investment Manager believes is consistent with preservation of capital, and the fund will be merged into Maturity Fund. More information about Maturity Fund is available in the prospectus beginning on page 171, and more information about the underlying funds (which are not offered by this prospectus) is included below and under “What are the funds’ and each underlying fund’s main investment strategies and related risks?”
Information about each underlying fund’s investment strategy
Putnam Sustainable Leaders ETF (“Sustainable Leaders ETF”)
Sustainable Leaders ETF invests mainly in common stocks of U.S. companies of any size, with a focus on companies that Putnam Investment Management, LLC (“Putnam Management”), Sustainable Leaders ETF’s investment manager, believes exhibit a commitment to financially material sustainable business practices. Sustainable Leaders ETF may also invest in non-U.S. companies. In evaluating investments for Sustainable Leaders ETF, Putnam Management views “financially material sustainable business practices” as business practices that it believes are reasonably likely to impact the financial condition or operating performance of a company and that relate to environmental, social, or corporate governance issues.
Under normal circumstances, Sustainable Leaders ETF invests at least 80% of the value of its net assets in securities that meet Putnam Management’s sustainability criteria. For a further discussion of Sustainable Leaders ETF’s investment strategy, please turn to the section What are the funds’ and each underlying fund’s main investment strategies and related risks? beginning on page 189.
Putnam Sustainable Future ETF (“Sustainable Future ETF”)
Sustainable Future ETF invests mainly in common stocks of U.S. companies of any size, with a focus on companies whose products and services Putnam Management, Sustainable Future ETF’s investment manager, believes provide solutions that directly contribute to sustainable social, environmental and economic development (Solutions Companies).
Under normal circumstances, Sustainable Future ETF invests at least 80% of the value of its net assets in securities that meet Putnam Management’s sustainability criteria. For a further discussion of Sustainable Future ETF’s investment strategy, please turn to the section What are the funds’ and each underlying fund’s main investment strategies and related risks? beginning on page 189.
Putnam PanAgora ESG International Equity ETF (“PanAgora International Equity ETF”)
PanAgora International Equity ETF invests mainly in common stocks (growth or value stocks or both) of companies of any size outside the United States with a focus on companies that PanAgora International Equity ETF’s subadviser, PanAgora Asset Management, Inc. (“PanAgora”), believes offer attractive benchmark-relative
returns and exhibit positive ESG metrics. Under normal circumstances, PanAgora International Equity ETF invests at least 80% of its net assets in equity securities of companies that meet PanAgora’s ESG criteria. For a further discussion of PanAgora International Equity ETF’s investment strategy, please turn to the section What are the funds’ and each underlying fund’s main investment strategies and related risks? beginning on page 189.
Putnam PanAgora ESG Emerging Markets Equity ETF (“PanAgora Emerging Markets Equity ETF”)
PanAgora Emerging Markets Equity ETF invests mainly in common stocks (growth or value stocks or both) of emerging markets companies of any size with a focus on companies that PanAgora Emerging Markets Equity ETF’s subadviser, PanAgora, believes offer attractive benchmark-relative returns and exhibit positive ESG metrics. Under normal circumstances, PanAgora Emerging Markets Equity ETF invests at least 80% of its net assets in equity securities of emerging markets companies that meet PanAgora’s ESG criteria. For a further discussion of PanAgora Emerging Markets Equity ETF’s investment strategy, please turn to the section What are the funds’ and each underlying fund’s main investment strategies and related risks? beginning on page 189.
Putnam ESG Core Bond ETF (“Core Bond ETF”)
Core Bond ETF invests mainly in a diversified portfolio of investment-grade fixed-income securities with a focus on companies or issuers that Franklin Advisers, Core Bond ETF’s investment manager, believes meet relevant ESG criteria on a sector-specific basis. Under normal circumstances, Core Bond ETF invests at least 80% of the value of its net assets in fixed-income securities that meet Franklin Advisers’ ESG criteria. For a further discussion of Core Bond ETF’s investment strategy, please turn to the section What are the funds’ and each underlying fund’s main investment strategies and related risks? beginning on page 189.
Putnam ESG High Yield ETF (“High Yield ETF”)
High Yield ETF invests mainly in bonds that are below investment grade in quality (sometimes referred to as “junk bonds”) with a focus on companies or issuers that Franklin Advisers, High Yield ETF’s investment manager, believes meet relevant ESG criteria on a sector-specific basis. High Yield ETF invests mainly in bonds that also have one or more of the following characteristics: (1) are obligations of U.S. companies or issuers and (2) have intermediate- to long-term maturities (three years or longer). Under normal circumstances, High Yield ETF invests at least 80% of the value of its net assets in fixed-income securities rated below investment grade that meet Franklin Advisers’ ESG criteria. For a further discussion of High Yield ETF’s investment strategy, please turn to the section What are the funds’ and each underlying fund’s main investment strategies and related risks? beginning on page 189.
Putnam ESG Ultra Short ETF (“Ultra Short ETF”)
Ultra Short ETF invests in a diversified short duration portfolio of fixed-income securities comprised of investment-grade money market and other fixed-income securities, including U.S. dollar-denominated foreign securities of these types, with a focus on companies or issuers that Franklin Advisers, Ultra Short ETF’s investment manager, believes meet relevant ESG criteria, on a sector-specific basis. Under normal circumstances, Ultra Short ETF invests at least 80% of the value of its net assets in fixed-income securities that meet Franklin Advisers’ ESG criteria. For a further discussion of Ultra Short ETF’s investment strategy, please turn to the section What are the funds’ and each underlying fund’s main investment strategies and related risks? beginning on page 189.
It is important to understand that you can lose money by investing in the fund. Losses may occur near, at or after the target date. There is no guarantee that the fund will provide adequate income at and through an investor’s retirement.
The fund’s allocation of assets among asset classes and the underlying funds may hurt performance. An underlying fund may change its investment program or policies without the fund’s approval, which could require the fund to reduce or eliminate its allocation to the underlying fund at an unfavorable time.
The fund invests in underlying funds and indirectly bears expenses related to the underlying funds. However, the Investment Manager has contractually agreed to waive fees, reimburse expenses of, or reimburse the fund through at least November 30, 2027 in an amount equal to the fund’s acquired fund fees and expenses (e.g., the fees and expenses incurred by the fund as a result of its investments in the underlying funds). The Investment Manager also has contractually agreed to waive fees and/or reimburse expenses of each class of shares of the fund through at least November 30, 2027 in an amount sufficient to result in total annual fund operating expenses for class A, C, R, R3, R4, R5, R6 and Y shares of the fund (exclusive of payments under the fund’s distribution plans, brokerage, interest, taxes, investment-related expenses, acquired fund fees and expenses, and extraordinary expenses) that equal 0.60%, 0.60%, 0.75%, 0.75%, 0.75%, 0.60%, 0.50%, and 0.60%, respectively, of the fund’s average net assets.
Pending investment in underlying funds, the fund also expects to temporarily invest cash balances resulting from purchase activity by fund shareholders in Putnam Government Money Market Fund, a money market mutual fund sponsored by the Investment Manager, or in cash or cash equivalents. In addition, the fund expects to invest a portion of its assets in Putnam Government Money Market Fund or in cash or cash equivalents in order to manage shareholder redemptions. Large positions in Putnam Government Money Market Fund or in cash or cash equivalents may dampen performance and may prevent the fund from achieving its goal. These practices may be subject to other risks, as described under Miscellaneous Investments, Investment Practices and Risks in the SAI.
The fund also bears the risks associated with the underlying funds identified below. The relative significance of these risks will vary over time based on the fund’s target allocations to the underlying funds and to equity and fixed-income asset classes, which may change from time to time as discussed above.
Investment Strategy-Related Risks of the Underlying Funds
Sustainability and ESG investing risk. Investing in underlying funds with an ESG or sustainability focus may result in the fund having exposure to underlying funds that invest in certain types of companies, issuers, industries or sectors that the market may not favor. In evaluating an investment opportunity for the underlying funds, Franklin Advisers, Putnam Management or PanAgora may make investment decisions without the availability of optimal ESG-related data (which may be even less available with securitized debt instruments) or based on information and data that is incomplete or inaccurate. Sustainability and ESG metrics are not uniformly defined, and applying such metrics involves subjective assessments. Sustainability and ESG scorings and assessments of issuers can vary across third-party data providers and may change over time. Franklin Advisers, Putnam Management and PanAgora do not rely exclusively on third-party data providers in evaluating sustainability and ESG criteria for the underlying funds. ESG information from third-party data providers may be incomplete, inaccurate or unavailable, particularly with respect to companies in emerging market countries, which may adversely impact the investment process. In addition, the business practices, products or services of issuers in which an underlying fund invests may change over time. As a result of these possibilities, among others, an underlying fund may temporarily hold securities that are inconsistent with the underlying fund’s ESG or sustainability investment criteria. Regulatory changes or interpretations regarding the definitions and/or use of ESG and/or sustainability criteria could have a material adverse effect on the underlying fund’s ability to invest in accordance with its investment policies and/or achieve its investment objective. The underlying funds do not restrict investments based solely on “negative screens”, and the underlying fixed-income funds do not restrict their fixed-income investments to “green bonds” (e.g., U.S. dollar-denominated bonds designated as “green” by the Climate Bonds Initiative). For the underlying funds that pursue fixed-income investment strategies, because fixed-income investments generally represent a promise to pay principal and interest by an issuer, and not an ownership interest, and may involve complex structures, ESG-related investment considerations may have a more limited impact on risk and return (or may have an impact over a different investment time horizon) relative to other asset classes, and this may be particularly true for shorter-term investments. In addition, holders of fixed-income investments do not typically have voting rights, unlike holders of equity investments who have the right to vote on issuer proposals.
Market risk. The value of investments in the underlying funds’ portfolios may fall or fail to rise over extended periods of time for a variety of reasons, including general economic, political or financial market conditions, investor sentiment and market perceptions, government actions, geopolitical events or changes, outbreaks of infectious illnesses or other widespread public health issues (including epidemics and
pandemics), and factors related to a specific issuer, geography, industry or sector. These and other factors may lead to increased volatility and reduced liquidity in the underlying funds’ portfolio holdings, may negatively impact the fund’s performance, and may exacerbate other risks to which the fund is subject.
Common stock risk. (For all underlying funds except Core Bond ETF, High Yield ETF and Ultra Short ETF) Common stock represents an ownership interest in a company. The value of a company’s stock may fall or fail to rise as a result of factors directly relating to that company, such as decisions made by its management or lower demand for the company’s products or services. A stock’s value may also fall because of factors affecting not just the company, but also other companies in the same industry or in a number of different industries, such as increases in production costs.
| Growth investing risk. Growth stocks may be more susceptible to earnings disappointments, and the market may not favor growth-style investing. |
| Value investing risk. Value stocks may fail to rebound, and the market may not favor value-style investing. Companies whose stocks we believe are undervalued by the market may have experienced adverse business developments or may be subject to special risks that have caused their stocks to be out of favor. |
| Small and midsize companies risk. Stocks of small and midsize companies often trade in smaller volumes, and their prices may fluctuate more than stocks of larger companies. Stocks of these companies may therefore be more vulnerable to adverse developments than those of larger companies. |
Industry or sector concentration risk. (For all underlying funds except Core Bond ETF, High Yield ETF and Ultra Short ETF) From time to time, an underlying fund may invest a significant portion of its assets in companies in one or more related industries or sectors, which would make the underlying fund more vulnerable to adverse developments affecting those industries or sectors.
Model and data risk. (For all underlying funds except Sustainable Leaders ETF, Sustainable Future ETF and High Yield ETF) If the quantitative models or data that are used in managing an underlying fund prove to be incorrect or incomplete, investment decisions made in reliance on the models or data may not produce the desired results, and the underlying fund may realize losses. Additionally, market movements are likely to change the risk levels and risk allocations of the underlying fund. Investments made based on quantitative models may perform differently from the market as a whole.
Foreign investment risk. (For all underlying funds except Ultra Short ETF, Sustainable Leaders ETF and Sustainable Future ETF) The value of international investments traded in foreign currencies may be adversely impacted by fluctuations in exchange rates. International investments, particularly investments in emerging markets, may carry risks associated with potentially less stable economies or governments (such as the risk of seizure by a foreign government, the imposition of currency or other restrictions, or high levels of inflation), and may be or become
illiquid. There may be less publicly-available information, or less reliable publicly-available information, about foreign companies (including information related to companies’ ESG practices), particularly with respect to emerging market companies, than publicly-available information regarding U.S. companies. As a result, an underlying fund’s ability to evaluate a foreign company, including with respect to its ESG or sustainability practices, may be more limited than its ability to evaluate a U.S. company.
Geographic focus risk. (For PanAgora International Equity ETF and PanAgora Emerging Markets Equity ETF) From time to time, an underlying fund may invest a significant portion of its assets in companies in one or more related geographic regions, industries or sectors, such as European and Asian countries, which would make the fund more vulnerable to adverse developments affecting those geographic regions, industries or sectors, including political, economic, or other developments adversely impacting ESG or sustainable investing.
Fixed-income investments risk. (For Core Bond ETF, High Yield ETF and Ultra Short ETF) The risks associated with fixed-income investments include interest rate risk, which is the risk that the value of an underlying fund’s investments is likely to fall if interest rates rise. Fixed-income investments are also subject to credit risk, which is the risk that the issuer of a fixed-income investment may default on payment of interest or principal. Credit risk is generally greater for debt not backed by the full faith and credit of the U.S. government, and interest rate risk is generally greater for longer-term debt. Fixed-income investments may be more susceptible to downgrades or defaults during economic downturns or other periods of economic stress. Mortgage-backed investments, unlike traditional debt investments, are also subject to prepayment risk, which means that they may increase in value less than other bonds when interest rates decline and decline in value more than other bonds when interest rates rise. The underlying fund may have to invest the proceeds from prepaid investments, including mortgage-backed investments, in other investments with less attractive terms and yields. The underlying fund’s investments in mortgage-backed securities, and in certain other securities and derivatives, may be or become illiquid. The underlying fund’s investments in mortgage-backed securities may make the underlying fund’s net asset value more susceptible to economic, market, political and other developments affecting the residential and commercial real estate markets and the servicing of mortgage loans secured by real estate properties. During periods of difficult economic conditions, delinquencies and losses on commercial mortgage-backed investments in particular generally increase, including as a result of the effects of those conditions on commercial real estate markets, the ability of commercial tenants to make loan payments, and the ability of a property to attract and retain commercial tenants.
One of the underlying funds, Putnam High Yield ETF, invests mostly in higher-yield, higher-risk debt investments that are rated below BBB or its equivalent at the time of purchase by any nationally recognized securities rating agency rating such investments, or in unrated investments that Franklin Advisers believes are of comparable quality. The underlying fund may invest up to 15% of the underlying
fund’s total assets in debt investments rated below CCC or its equivalent, at the time of purchase, by each rating agency rating such investments, or in unrated investments that Franklin Advisers believes are of comparable quality. This includes investments in the lowest rating category of the rating agency. The underlying fund will not necessarily sell an investment if its rating is reduced after Franklin Advisers buys it. Investments rated below BBB or its equivalent are below-investment-grade in quality. This rating reflects a greater possibility that the issuers may be unable to make timely payments of interest and principal and thus default. If a default occurs, or is perceived as likely to occur, the value of the investment will usually be more volatile and is likely to fall. The value of a debt instrument may also be affected by changes in, or perceptions of, the financial condition of the issuer, borrower, counterparty, or other entity, or underlying collateral or assets, or changes in, or perceptions of, specific or general market, economic, industry, political, regulatory, geopolitical, environmental, public health, and other conditions. A default or expected default could also make it difficult for the underlying fund to sell the investment at a price approximating the value Franklin Advisers had previously placed on it. Lower-rated debt usually has a more limited market than higher-rated debt, which may at times make it difficult for the underlying fund to buy or sell certain debt instruments or to establish their fair values.
Derivatives risk. (For all underlying funds except PanAgora International Equity ETF, PanAgora Emerging Markets Equity ETF, Sustainable Leaders ETF and Sustainable Future ETF) An underlying fund’s use of derivatives may increase the risks of investing in the underlying fund by increasing investment exposure (which may be considered leverage) or, in the case of many over-the-counter instruments, because of the potential inability to terminate or sell derivatives positions and the potential failure of the other party to the instrument to meet its obligations. The risk of a party failing to meet its obligations may increase if the fund has significant investment exposure to that counterparty. The value of derivatives may move in unexpected ways due to unanticipated market movements, the use of leverage, imperfect correlation between the derivative instrument and the reference asset, or other factors, especially in unusual market conditions, and volatility in the value of derivatives could adversely impact the underlying fund’s returns, obligations and exposures. Derivatives are also subject to other risks, including liquidity risk (e.g., liquidity demands arising from the requirement to make payments to a derivative counterparty), operational risk (e.g., settlement issues or system failure), and legal risk (e.g., insufficient legal documentation or contract enforceability issues).
Floating rate obligations risk. (For Core Bond ETF, High Yield ETF and Ultra Short ETF) To the extent an underlying fund holds floating rate loans, interest rate risk may be reduced but will not be eliminated. While floating rate loans are normally secured by specific collateral or assets of the issuer (so that holders of the loans, such as the underlying fund, will have a priority claim on those assets in the event of default or bankruptcy of the issuer), the value of collateral may be insufficient to meet the issuer’s obligations, and the underlying fund’s access to collateral may be limited by bankruptcy or other insolvency laws. The settlement period (the period
between the execution of the trade and the delivery of cash to the purchaser) for floating rate loan transactions is typically longer than seven days, and it is possible that sale proceeds from floating rate loan transactions will not be available to meet redemption obligations.
Portfolio turnover rate risk. From time to time an underlying fund may engage in frequent trading. Funds with high turnover may be more likely to realize capital gains that must be distributed to shareholders as taxable income. High turnover may also cause a fund to pay more brokerage commissions and to incur other transaction costs (including imputed transaction costs), which may detract from performance. A fund’s portfolio turnover rate and the amount of brokerage commissions it pays and transaction costs it incurs will vary over time based on market conditions.
Management and operational risk. There is no guarantee that the investment techniques, analyses, or judgments that Franklin Advisers, Putnam Management or PanAgora, as applicable, applies in making investment decisions for the underlying funds will produce the intended outcome or that the investments they select for the underlying funds will perform as well as other securities that were not selected for the underlying funds. Franklin Advisers, Putnam Management, PanAgora, or the underlying funds’ other service providers, may experience disruptions or operating errors that could negatively impact the underlying funds.
Risks Related to Investing in ETFs
As ETFs, shares of the underlying funds are traded in the secondary market. Prior to trading in the secondary market, shares of the underlying funds are “created” at NAV by market makers, large investors and institutions (collectively, “authorized participants”) only in creation units. A creation transaction generally takes place when an authorized participant deposits into an underlying fund a designated portfolio of securities, assets or other positions (a “creation basket”), and an amount of cash (including any cash representing the value of substituted securities, assets or other positions), if any, in exchange for a specified number of creation units. Similarly, shares of an underlying fund can be redeemed only in creation units, generally for a designated portfolio of securities, assets or other positions held by the underlying fund and an amount of cash (including any portion of such securities for which cash may be substituted), if any.
Fluctuation of net asset value (“NAV”) and share price risk. Shares of the underlying funds may trade at a larger premium or discount to their NAV than shares of other ETFs. The NAV of an underlying fund will generally fluctuate with changes in the market value of the underlying fund’s holdings. Underlying fund shares can be bought and sold in the secondary market at market prices. Disruptions to creations and redemptions, the existence of extreme market volatility or potential lack of an active trading market for an underlying fund’s shares may result in the underlying fund’s shares trading significantly above (at a premium) or below (at a discount) to NAV or to the intraday value of the underlying fund’s holdings. In addition, in stressed market conditions or periods of market disruption or volatility, the market for shares of the
underlying funds may become less liquid in response to deteriorating liquidity in the markets for the underlying funds’ portfolio holdings.
Authorized participant concentration risk. Only an authorized participant may engage in creation and redemption transactions directly with an underlying fund. Your fund is not an authorized participant and can only purchase and sell underlying fund shares in the secondary market at market prices or through an authorized participant. The underlying fund may have a limited number of financial institutions that act as authorized participants, none of which are obligated to engage in creation and/or redemption transactions. To the extent that those authorized participants do not engage in creation and redemption orders, there may be a significantly diminished trading market for underlying fund shares, or underlying fund shares may trade at a discount (or premium) to NAV and possibly face trading halts and/or de-listing.
Trading issues risk. The underlying funds have a limited public trading history. Sustainable Leaders ETF and Sustainable Future ETF began trading publicly in May 2021, while PanAgora International Equity ETF, PanAgora Emerging Markets Equity ETF, Core Bond ETF, High Yield ETF, and Ultra Short ETF began trading publicly in January 2023. There can be no assurance that an active trading market will develop or be maintained or that the market for underlying fund shares will operate as intended, which could lead to the underlying funds’ shares trading at wider spreads and larger premiums and discounts to NAV than other actively managed ETFs. As a result, it may cost the fund more to trade underlying fund shares than shares of other ETFs. There is no guarantee that the underlying fund will be able to attract market makers and authorized participants. Market makers and authorized participants are not obligated to make a market in the underlying fund’s shares or to submit purchase and redemption orders for creation units.
The market prices of an underlying fund’s shares are expected to fluctuate, in some cases materially, in response to changes in the underlying fund’s NAV, the intraday value of the underlying fund’s holdings and supply and demand for the underlying fund’s shares. Each underlying fund’s respective investment manager cannot predict whether an underlying fund’s shares will trade above, below or at their NAV or the intraday value of the underlying fund’s holdings. During periods when an underlying fund is trading below its NAV, the fund may incur significant losses if it sells its underlying fund shares.
The securities held by an underlying fund may be traded in markets that close at a different time than the exchange on which the underlying fund’s shares are listed. Liquidity in those securities may be reduced after the applicable closing times. Accordingly, during the time when the exchange is open but after the applicable market closing, fixing or settlement times, bid-ask spreads on the exchange and the corresponding premium or discount to the NAV of the underlying funds’ shares may widen.
Large shareholder risk. Each underlying fund may be an investment option for mutual funds that are managed by Franklin Resources, Inc. (“Franklin Templeton”) and its affiliates as “funds of funds.” Additionally, other investors from time to time may make substantial investments in an underlying fund, including affiliates of Franklin Templeton, through seed capital arrangements. Such shareholders may at times be considered to control an underlying fund. Dispositions of a large number of shares by these shareholders may adversely affect an underlying fund’s liquidity and net assets to the extent such transactions are executed directly with the underlying fund in the form of redemptions through an authorized participant, rather than executed in the secondary market. These redemptions may also force an underlying fund to sell securities, which may increase the underlying fund’s brokerage costs. In addition, underlying fund returns may be adversely affected if an underlying fund holds a portion of its assets in liquid, cash-like investments in connection with or in anticipation of shareholder redemptions. To the extent these large shareholders transact in shares of an underlying fund on the secondary market, such transactions may account for a large percentage of the trading volume on the exchange and may, therefore, have a material effect (upward or downward) on the market price of the underlying fund’s shares.
Cash transactions risk. Some of the underlying funds may effect creations and redemptions in cash or partially in cash. Therefore, an underlying fund may be required to sell portfolio securities, incur transaction costs, and subsequently recognize gains on such sales that the underlying fund might not have recognized if it were to distribute portfolio securities in-kind. As such, investments by a fund in an underlying fund’s shares may be less tax-efficient than an investment in an ETF that distributes portfolio securities entirely in-kind. An underlying fund may also incur transaction costs in connection with creations effected in cash (in whole or in part).
Semi-transparent ETF risk. (For Sustainable Leaders ETF and Sustainable Future ETF) Two of the underlying funds, Putnam Sustainable Leaders ETF and Putnam Sustainable Future ETF (the “Semi-Transparent ETFs”), are different from traditional ETFs, including the other underlying funds. Traditional ETFs disclose to the public what assets they hold each day. However, the Semi-Transparent ETFs do not. This may create additional risks for an investment in the Semi-Transparent ETFs, including that an investor may have to pay more money to trade the Semi-Transparent ETF’s shares in light of the fact that the Semi-Transparent ETF will provide less information to traders, who tend to charge more for trades when they have less information. The price an investor pays to buy or sell an ETF’s shares on an exchange may not match the value of the ETF’s portfolio, and these price differences may be greater for the Semi-Transparent ETFs compared to other ETFs because they provide less information to traders. These additional risks may be even greater in adverse or uncertain market conditions.
The differences between the Semi-Transparent ETFs and other ETFs may also have advantages. By keeping certain information about the Semi-Transparent ETFs secret, a Semi-Transparent ETF may face less risk that other traders can predict or copy its investment strategy. This may improve the Semi-Transparent ETF’s performance.
If other traders are able to copy or predict the Semi-Transparent ETF’s investment strategy, however, this may hurt the Semi-Transparent ETF’s performance.
Tracking basket structure risk. (For Sustainable Leaders ETF and Sustainable Future ETF) The Semi-Transparent ETFs are actively managed ETFs that operate pursuant to an exemptive order from the Securities and Exchange Commission and do not publicly disclose their complete portfolio holdings each business day. Instead, each Semi-Transparent ETF publishes each business day on its website a “Tracking Basket,” which is designed to closely track the daily performance of the Semi-Transparent ETF but is not the Semi-Transparent ETF’s actual portfolio. The Tracking Basket is comprised of: (1) select recently disclosed portfolio holdings and/or select securities from the universe from which the Semi-Transparent ETF’s investments are selected (“Strategy Components”); (2) liquid ETFs that convey information about the types of instruments (that are not otherwise fully represented by the Strategy Components) in which the Semi-Transparent ETF invests; and (3) cash and cash equivalents.
A Semi-Transparent ETF’s Tracking Basket structure may affect the price at which shares of the Semi-Transparent ETF trade in the secondary market. Although the Tracking Basket is intended to provide investors with enough information to allow for an effective arbitrage mechanism that will keep the market price of each Semi-Transparent ETF at or close to its NAV per share, there is a risk that market prices will vary significantly from NAV. The Semi-Transparent ETFs, which trade on the basis of a published Tracking Basket, may trade at a wider bid/ask spread than ETFs that publish their portfolios on a daily basis, and therefore, may cost investors more to trade. These risks may increase during periods of market disruption or volatility. In addition, although each Semi-Transparent ETF seeks to benefit from keeping its portfolio information secret, market participants may attempt to use the Tracking Basket to identify the Semi-Transparent ETF’s trading strategy. If successful, this could result in such market participants engaging in certain predatory trading practices that may have the potential to harm the Semi-Transparent ETF and its shareholders, such as front running the Semi-Transparent ETF’s trades of portfolio securities.
Arbitrage risk. (For Sustainable Leaders ETF and Sustainable Future ETF) Unlike ETFs that publicly disclose their complete portfolio holdings each business day, each Semi-Transparent ETF provides certain other information intended to allow market participants to estimate the value of positions in the Semi-Transparent ETF’s shares. Although this information is designed to facilitate arbitrage opportunities in the Semi-Transparent ETF’s shares to reduce bid/ask spreads and minimize discounts or premiums between the market price and NAV of the Semi-Transparent ETF shares, there is no guarantee the Semi-Transparent ETF’s arbitrage mechanism will operate as intended and that the Semi-Transparent ETF will not experience wide bid/ask spreads and/or large discounts or premiums to NAV. In addition, market participants may attempt to use the disclosed information to “reverse engineer” the Semi-Transparent ETF’s trading strategy, which, if successful, could increase opportunities for predatory trading practices that may have the potential to negatively impact the Semi-Transparent ETF’s performance.
Trading halt risk. (For Sustainable Leaders ETF and Sustainable Future ETF) There may be circumstances where a security held in a Semi-Transparent ETF’s portfolio but not in the Tracking Basket does not have readily available market quotations. If Putnam Management determines that such circumstance may affect the reliability of the Tracking Basket as an arbitrage vehicle, that information, along with the identity and weighting of that security in the Semi-Transparent ETF’s portfolio, will be publicly disclosed on the Semi-Transparent ETF’s website, and Putnam Management will assess appropriate remedial measures. In these circumstances, market participants may use this information to engage in certain predatory trading practices that may have the potential to harm the Semi-Transparent ETF and its shareholders. In addition, if securities representing 10% or more of the Semi-Transparent ETF’s portfolio do not have readily available market quotations, Putnam Management would promptly request the exchange to halt trading of the Semi-Transparent ETF, meaning that investors (including the fund) would not be able to trade their shares. Trading may also be halted in other circumstances, for example, due to market conditions.
The fund may not achieve its goal, and it is not intended to be a complete investment program. An investment in the fund is not insured or guaranteed by the Federal Deposit Insurance Corporation or any other government agency.
The performance information below gives some indication of the risks associated with an investment in the fund by showing the fund’s performance year to year and over time. Before February 10, 2023, the fund was managed with a materially different investment strategy and may have achieved materially different performance results under its current investment strategy from that shown for periods before this date. The bar chart does not reflect the impact of sales charges. If it did, performance would be lower. Please remember that past performance is not necessarily an indication of future results. Monthly performance figures for the fund are available at www.franklintempleton.com.
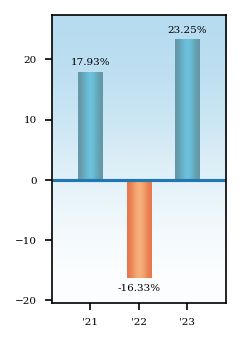
Average Annual Total Returns - Putnam Sustainable Retirement 2065 Fund |
1 Year |
Since Inception |
Inception Date |
||
|---|---|---|---|---|---|
| Class A 2065 | 16.17% | 4.66% | Jan. 04, 2021 | ||
| Class A 2065 | After Taxes on Distributions | 15.78% | 3.36% | Jan. 04, 2021 | ||
| Class A 2065 | After Taxes on Distributions and Sales | 9.75% | 3.15% | Jan. 04, 2021 | ||
| Class C 2065 | 21.32% | 5.95% | Jan. 04, 2021 | ||
| Class R 2065 | 22.70% | 6.31% | Jan. 04, 2021 | ||
| Class R3 2065 | 23.08% | 6.59% | Jan. 04, 2021 | ||
| Class R4 2065 | 23.36% | 6.84% | Jan. 04, 2021 | ||
| Class R5 2065 | 23.51% | 6.99% | Jan. 04, 2021 | ||
| Class R6 2065 | 23.64% | 7.11% | Jan. 04, 2021 | ||
| Class Y 2065 | 23.50% | 7.00% | Jan. 04, 2021 | ||
| Russell 3000® Index (no deduction for fees, expenses or taxes) | 25.96% | [1] | 8.54% | [1] | Jan. 04, 2021 |
| Bloomberg U.S. Aggregate Bond Index (no deduction for fees, expenses or taxes) | 5.53% | [1] | (3.31%) | [1] | Jan. 04, 2021 |
| S&P Target Date To 2065 Index (no deduction for fees, expenses or taxes) | 20.84% | [1] | 6.35% | [1] | Jan. 04, 2021 |
| [1] | The table above compares the fund’s returns to the performance of three indexes: (i) the Russell 3000® Index, a broad measure of market performance, (ii) the Bloomberg U.S. Aggregate Bond Index, a broad measure of market performance, and (iii) the S&P Target Date To 2065 Index, an additional index that the Investment Manager believes more closely reflects the fund’s principal investment objective and strategies. |
| After-tax returns reflect the historical highest individual federal marginal income tax rates and do not reflect state and local taxes. Actual after-tax returns depend on an investor’s tax situation and may differ from those shown. After-tax returns are shown for class A shares only and will vary for other classes. These after-tax returns do not apply if you hold your fund shares through a 401(k) plan, an IRA, or another tax-advantaged arrangement. |
| The Russell 3000® Index measures the performance of the 3,000 largest U.S. companies based on total market capitalization. Source: FTSE. |
| Frank Russell Company is the source and owner of the trademarks, service marks and copyrights related to the Russell Indexes. Russell ® is a trademark of Frank Russell Company. |
| The Bloomberg U.S. Aggregate Bond Index is an unmanaged index of U.S. investment-grade fixed income securities. |
| All Bloomberg indices are provided by Bloomberg Index Services Limited. |
| BLOOMBERG® is a trademark and service mark of Bloomberg Finance L.P. and its affiliates (collectively “Bloomberg”). Bloomberg or Bloomberg’s licensors own all proprietary rights in the Bloomberg Indices. Neither Bloomberg nor Bloomberg’s licensors approve or endorse this material, or guarantees the accuracy or completeness of any information herein, or makes any warranty, express or implied, as to the results to be obtained therefrom, and to the maximum extent allowed by law, neither shall have any liability or responsibility for injury or damages arising in connection therewith. |
| The S&P Target Date To Index Series is designed to represent a small, style-specific derived consensus of asset class exposure and glide path for a specified list of target retirement dates. |
| Securities in the fund do not match those in the indexes, and the performance of the fund will differ. |
Putnam Sustainable Retirement 2060 Fund seeks capital appreciation and current income consistent with a decreasing emphasis on capital appreciation and an increasing emphasis on current income as it approaches its target date.
The following tables describe the fees and expenses you may pay if you buy, hold, and sell shares of the fund. You may pay other fees, such as brokerage commissions and other fees to financial intermediaries, which are not reflected in the tables and examples below. You may qualify for sales charge discounts if you and your family invest, or agree to invest in the future, at least $50,000 in Putnam funds. More information about these and other discounts is available from your financial professional and in How do I buy fund shares? beginning on page 227 of the fund’s prospectus, in the Appendix to the fund’s prospectus, and in How to buy shares beginning on page II-3 of the fund’s statement of additional information (“SAI”).
Shareholder Fees - Putnam Sustainable Retirement 2060 Fund |
Class A 2060 |
Class C 2060 |
Class R 2060 |
Class R3 2060 |
Class R4 2060 |
Class R5 2060 |
Class R6 2060 |
Class Y 2060 |
||
|---|---|---|---|---|---|---|---|---|---|---|
| Maximum Sales Charge Imposed on Purchases (as a percentage of Offering Price) | 5.75% | none | none | none | none | none | none | none | ||
| Maximum Deferred Sales Charge (as a percentage) | 1.00% | [1] | 1.00% | [2] | none | none | none | none | none | none |
| [1] | Applies only to certain redemptions of shares bought with no initial sales charge. |
| [2] | This charge is eliminated after one year. |
Annual Fund Operating Expenses - Putnam Sustainable Retirement 2060 Fund |
Class A 2060 |
Class C 2060 |
Class R 2060 |
Class R3 2060 |
Class R4 2060 |
Class R5 2060 |
Class R6 2060 |
Class Y 2060 |
|
|---|---|---|---|---|---|---|---|---|---|
| Management Fees (as a percentage of Assets) | 0.54% | 0.54% | 0.54% | 0.54% | 0.54% | 0.54% | 0.54% | 0.54% | |
| Distribution and Service (12b-1) Fees | 0.25% | 1.00% | 0.50% | 0.25% | none | none | none | none | |
| Other Expenses (as a percentage of Assets): | 0.57% | 0.57% | 0.72% | 0.72% | 0.72% | 0.57% | 0.47% | 0.57% | |
| Acquired Fund Fees and Expenses | 0.57% | 0.57% | 0.57% | 0.57% | 0.57% | 0.57% | 0.57% | 0.57% | |
| Expenses (as a percentage of Assets) | 1.93% | 2.68% | 2.33% | 2.08% | 1.83% | 1.68% | 1.58% | 1.68% | |
| Fee Waiver or Reimbursement | [1] | (1.08%) | (1.08%) | (1.08%) | (1.08%) | (1.08%) | (1.08%) | (1.08%) | (1.08%) |
| Net Expenses (as a percentage of Assets) | 0.85% | 1.60% | 1.25% | 1.00% | 0.75% | 0.60% | 0.50% | 0.60% | |
| [1] | Reflects a contractual obligation of the Investment Manager to limit certain fund expenses through November 30, 2034. This obligation may be modified or discontinued only with approval of the Board of Trustees. |
The following hypothetical example is intended to help you compare the cost of investing in the fund with the cost of investing in other funds. It assumes that you invest $10,000 in the fund for the time periods indicated and then, except as indicated, redeem all your shares at the end of those periods. It assumes a 5% return on your investment each year and that the fund’s operating expenses remain the same. The example takes into account the expense reimbursement described above. Your actual costs may be higher or lower.
Expense Example - Putnam Sustainable Retirement 2060 Fund - USD ($) |
Expense Example, with Redemption, 1 Year |
Expense Example, with Redemption, 3 Years |
Expense Example, with Redemption, 5 Years |
Expense Example, with Redemption, 10 Years |
Expense Example, No Redemption, 1 Year |
Expense Example, No Redemption, 3 Years |
Expense Example, No Redemption, 5 Years |
Expense Example, No Redemption, 10 Years |
|---|---|---|---|---|---|---|---|---|
| Class A 2060 | 657 | 831 | 1,019 | 1,564 | ||||
| Class C 2060 | 263 | 505 | 871 | 1,699 | 163 | 505 | 871 | 1,699 |
| Class R 2060 | 127 | 397 | 686 | 1,511 | ||||
| Class R3 2060 | 102 | 318 | 552 | 1,225 | ||||
| Class R4 2060 | 77 | 240 | 417 | 930 | ||||
| Class R5 2060 | 61 | 192 | 335 | 750 | ||||
| Class R6 2060 | 51 | 160 | 280 | 628 | ||||
| Class Y 2060 | 61 | 192 | 335 | 750 |
The fund pays transaction-related costs, such as commissions, when it buys and sells securities (or “turns over” its portfolio). A higher turnover rate may indicate higher transaction costs and may result in higher taxes when the fund’s shares are held in a taxable account. These costs, which are not reflected in annual fund operating expenses or the above example, affect fund performance. The fund’s turnover rate in the most recent fiscal year was 29%.
Investments
The fund is one of a series of target date funds that invest primarily in exchange-traded funds (“ETFs”) that focus on investments with positive sustainability or environmental, social, and governance (“ESG”) characteristics, referred to as underlying funds. The underlying funds include funds managed by Franklin Advisers, Inc. (“Franklin Advisers” or the “Investment Manager”), the fund’s investment manager, and funds managed by affiliated investment advisers. The fund’s asset allocation strategy may be attractive to investors who plan to retire or otherwise intend to begin making periodic withdrawals of their investments in or about 2060 (the target date). The fund is designed to provide diversification among different asset classes by investing its assets in the underlying funds.
Under normal circumstances, the fund will invest in underlying funds (which, for purposes of this policy, include money market mutual funds advised by the Investment Manager or its affiliates) such that, in the aggregate, it has indirect exposure to investments that meet each underlying fund’s respective sustainability or ESG criteria and that represent at least 80% of the value of its net assets. This policy is non-fundamental and may be changed only after 60 days’ notice to shareholders. The Investment Manager may not apply ESG or sustainability criteria to investments that are not subject to the fund’s 80% policy, and such investments may not meet the applicable ESG or sustainability criteria. Through its investments in underlying funds, the fund makes use of a range of ESG- and sustainability- oriented investment strategies and invests across a variety of asset classes. The ESG or sustainability criteria will differ across the underlying funds. These differences may arise both
from differences in the underlying funds’ asset classes (such as the characteristics of non-U.S. versus U.S. issuers, or the structural differences (e.g., position in the capital structure) between equity and fixed-income investments) as well as from different managers’ styles. In implementing an underlying fund’s investment strategy, the portfolio managers of the underlying fund may apply and weigh different ESG criteria differently than the portfolio managers of the other underlying funds. There are also expected to be differences in how the portfolio managers of the underlying funds source ESG-related or sustainability-oriented research (e.g., proprietary versus third-party research) and/or their approach to selecting companies based on ESG or sustainability criteria.
The fund’s target allocations among asset classes and underlying funds will increasingly emphasize capital preservation and income over time and will change gradually based on the number of remaining years until the fund’s target date, as shown in the predetermined “glide path” in the chart under “What are the funds’ and each underlying fund’s main investment strategies and related risks?” The Investment Manager adjusts these allocations at the end of each calendar quarter based on the glide path.
Pending investment in underlying funds, the fund also expects to temporarily invest cash balances resulting from purchase activity by fund shareholders in Putnam Government Money Market Fund, a mutual fund sponsored by the Investment Manager, or in cash or cash equivalents. The fund also expects to invest a portion of its assets in Putnam Government Money Market Fund or in cash or cash equivalents in order to manage shareholder redemptions. The percentage of a fund invested in Putnam Government Money Market Fund is expected to vary over time and will depend on the level of purchase and redemption activity by fund shareholders.
The following table presents your fund’s approximate allocations to each asset class and underlying fund as of September 30, 2024 (taking into account any tactical adjustments described below) and its projected approximate allocations to those asset classes and underlying funds as of September 30, 2025. The table does not reflect temporary investments in Putnam Government Money Market Fund or in cash or cash equivalents. By comparing the percentage allocations of your fund in the table, you can see how its allocations are expected to change during the one-year period beginning on September 30, 2024. The table also shows the approximate allocations of other Putnam Sustainable Retirement Funds, which are designed for investors with different target retirement dates. Over a five-year period, each fund’s allocations will gradually change to resemble the allocations of the fund with the next earliest target date. The table illustrates how a fund’s allocations are expected to change over time to increasingly emphasize capital preservation and income.
| Underlying Fund* | Year | 2065 | 2060 (your fund) | 2055 | 2050 | 2045 | 2040 | 2035 | 2030 | 2025 | Maturity Fund |
| Putnam Sustainable Leaders ETF | 2024 | 48.6% | 47.2% | 44.8% | 42.3% | 39.7% | 36.4% | 31.7% | 21.0% | 14.9% | 14.1% |
| 2025 | 47.6% | 45.8% | 43.3% | 40.7% | 38.4% | 35.2% | 30.3% | 18.6% | 14.3% | 14.1% | |
| Putnam Sustainable Future ETF | 2024 | 23.8% | 23.1% | 21.9% | 20.6% | 19.4% | 17.9% | 15.8% | 10.5% | 7.5% | 7.1% |
| 2025 | 23.8% | 22.9% | 21.7% | 20.4% | 19.2% | 17.6% | 15.2% | 9.3% | 7.1% | 7.1% | |
| Putnam PanAgora ESG Inter-national Equity ETF | 2024 |
17.8% | 17.3% | 16.4% | 15.5% | 14.4% | 12.4% | 9.6% | 6.3% | 4.5% | 4.2% |
| 2025 | 17.8% | 17.2% | 16.2% | 15.3% | 14.2% | 11.9% | 9.1% | 5.6% | 4.3% | 4.2% | |
| Putnam PanAgora ESG Emer-ging Markets Equity ETF | 2024 |
4.9% | 4.8% | 4.5% | 4.2% | 3.8% | 2.2% | 0.1% | 0.0% | 0.0% | 0.0% |
| 2025 | 5.9% | 5.7% | 5.4% | 5.1% | 4.5% | 2.2% | 0.0% | 0.0% | 0.0% | 0.0% | |
| Putnam ESG Core Bond ETF | 2024 | 3.3% | 5.3% | 8.9% | 12.4% | 15.4% | 23.0% | 33.5% | 49.7% | 52.3% | 51.7% |
| 2025 | 3.3% | 5.9% | 9.7% | 13.0% | 16.1% | 24.8% | 35.4% | 53.4% | 51.8% | 51.7% | |
| Putnam ESG High Yield ETF | 2024 | 1.1% | 1.8% | 3.0% | 4.1% | 4.9% | 4.8% | 4.9% | 6.7% | 14.8% | 16.9% |
| 2025 | 1.1% | 2.0% | 3.2% | 4.3% | 4.9% | 4.8% | 5.3% | 7.1% | 16.5% | 16.9% | |
| Putnam ESG Ultra Short ETF | 2024 | 0.5% | 0.5% | 0.5% | 0.9% | 2.4% | 3.3% | 4.4% | 5.8% | 6.0% | 6.0% |
| 2025 | 0.5% | 0.5% | 0.5% | 1.2% | 2.7% | 3.5% | 4.7% | 6.0% | 6.0% | 6.0% | |
| Total Equity** | 2024 | 95.1% | 92.4% | 87.6% | 82.6% | 77.3% | 68.9% | 57.2% | 37.8% | 26.9% | 25.4% |
| 2025 | 95.1% | 91.6% | 86.6% | 81.5% | 76.3% | 66.9% | 54.6% | 33.5% | 25.7% | 25.4% | |
| Total Fixed Income** | 2024 | 4.9% | 7.6% | 12.4% | 17.4% | 22.7% | 31.1% | 42.8% | 62.2% | 73.1% | 74.6% |
| 2025 | 4.9% | 8.4% | 13.4% | 18.5% | 23.7% | 33.1% | 45.4% | 66.5% | 74.3% | 74.6% |
| * | Due to rounding, allocations shown in the table above may not total 100%. In addition, because of rounding in the calculation of allocations among underlying funds and market fluctuations, actual allocations might be more or less than these percentages. |
| ** | Equity and fixed-income allocations are hypothetical estimates based on an assumption that each of Putnam Sustainable Leaders ETF, Putnam Sustainable Future ETF, Putnam PanAgora ESG International Equity ETF, and Putnam PanAgora ESG Emerging Markets Equity ETF is equivalent to an equity investment and each of Putnam ESG Core Bond ETF, Putnam ESG High Yield ETF and Putnam ESG Ultra Short ETF is equivalent to a fixed-income investment. Actual allocations will vary. |
The fund’s target allocations may differ from the allocations shown in the table. The Investment Manager may change the glide path, the fund’s target allocations, and the underlying funds in which it invests at any time, although the Investment Manager generally expects these changes (other than the tactical adjustments described below) to be infrequent and generally in response to longer-term structural changes (e.g., in the average retirement age or life expectancy) that lead the fund’s portfolio managers to determine that a change is advisable. The Investment Manager may also make tactical adjustments from time to time in the fund’s allocations to underlying funds in response to market conditions within a range of +/- 15% from the allocations to fixed-income and equity asset classes as presented in the fund’s glide path.
It is assumed that investors will begin gradual withdrawals from the fund at around the target date. Near the end of the target date year, the fund’s target allocations will correspond to those of Putnam Sustainable Retirement Maturity Fund (“Maturity Fund”), a fund that seeks as high a rate of current income as the Investment Manager believes is consistent with preservation of capital, and the fund will be merged into Maturity Fund. More information about Maturity Fund is available in the prospectus beginning on page 171, and more information about the underlying funds (which are not offered by this prospectus) is included below and under “What are the funds’ and each underlying fund’s main investment strategies and related risks?”
Information about each underlying fund’s investment strategy
Putnam Sustainable Leaders ETF (“Sustainable Leaders ETF”)
Sustainable Leaders ETF invests mainly in common stocks of U.S. companies of any size, with a focus on companies that Putnam Investment Management, LLC (“Putnam Management”), Sustainable Leaders ETF’s investment manager, believes exhibit a commitment to financially material sustainable business practices. Sustainable Leaders ETF may also invest in non-U.S. companies. In evaluating investments for Sustainable Leaders ETF, Putnam Management views “financially material sustainable business practices” as business practices that it believes are reasonably likely to impact the financial condition or operating performance of a company and that relate to environmental, social, or corporate governance issues.
Under normal circumstances, Sustainable Leaders ETF invests at least 80% of the value of its net assets in securities that meet Putnam Management’s sustainability criteria. For a further discussion of Sustainable Leaders ETF’s investment strategy, please turn to the section What are the funds’ and each underlying fund’s main investment strategies and related risks? beginning on page 189.
Putnam Sustainable Future ETF (“Sustainable Future ETF”)
Sustainable Future ETF invests mainly in common stocks of U.S. companies of any size, with a focus on companies whose products and services Putnam Management, Sustainable Future ETF’s investment manager, believes provide solutions that directly contribute to sustainable social, environmental and economic development (Solutions Companies).
Under normal circumstances, Sustainable Future ETF invests at least 80% of the value of its net assets in securities that meet Putnam Management’s sustainability criteria. For a further discussion of Sustainable Future ETF’s investment strategy, please turn to the section What are the funds’ and each underlying fund’s main investment strategies and related risks? beginning on page 189.
Putnam PanAgora ESG International Equity ETF (“PanAgora International Equity ETF”)
PanAgora International Equity ETF invests mainly in common stocks (growth or value stocks or both) of companies of any size outside the United States with a focus on companies that PanAgora International Equity ETF’s subadviser, PanAgora Asset Management, Inc. (“PanAgora”), believes offer attractive benchmark-relative
returns and exhibit positive ESG metrics. Under normal circumstances, PanAgora International Equity ETF invests at least 80% of its net assets in equity securities of companies that meet PanAgora’s ESG criteria. For a further discussion of PanAgora International Equity ETF’s investment strategy, please turn to the section What are the funds’ and each underlying fund’s main investment strategies and related risks? beginning on page 189.
Putnam PanAgora ESG Emerging Markets Equity ETF (“PanAgora Emerging Markets Equity ETF”)
PanAgora Emerging Markets Equity ETF invests mainly in common stocks (growth or value stocks or both) of emerging markets companies of any size with a focus on companies that PanAgora Emerging Markets Equity ETF’s subadviser, PanAgora, believes offer attractive benchmark-relative returns and exhibit positive ESG metrics. Under normal circumstances, PanAgora Emerging Markets Equity ETF invests at least 80% of its net assets in equity securities of emerging markets companies that meet PanAgora’s ESG criteria. For a further discussion of PanAgora Emerging Markets Equity ETF’s investment strategy, please turn to the section What are the funds’ and each underlying fund’s main investment strategies and related risks? beginning on page 189.
Putnam ESG Core Bond ETF (“Core Bond ETF”)
Core Bond ETF invests mainly in a diversified portfolio of investment-grade fixed-income securities with a focus on companies or issuers that Franklin Advisers, Core Bond ETF’s investment manager, believes meet relevant ESG criteria on a sector-specific basis. Under normal circumstances, Core Bond ETF invests at least 80% of the value of its net assets in fixed-income securities that meet Franklin Advisers’ ESG criteria. For a further discussion of Core Bond ETF’s investment strategy, please turn to the section What are the funds’ and each underlying fund’s main investment strategies and related risks? beginning on page 189.
Putnam ESG High Yield ETF (“High Yield ETF”)
High Yield ETF invests mainly in bonds that are below investment grade in quality (sometimes referred to as “junk bonds”) with a focus on companies or issuers that Franklin Advisers, High Yield ETF’s investment manager, believes meet relevant ESG criteria on a sector-specific basis. High Yield ETF invests mainly in bonds that also have one or more of the following characteristics: (1) are obligations of U.S. companies or issuers and (2) have intermediate- to long-term maturities (three years or longer). Under normal circumstances, High Yield ETF invests at least 80% of the value of its net assets in fixed-income securities rated below investment grade that meet Franklin Advisers’ ESG criteria. For a further discussion of High Yield ETF’s investment strategy, please turn to the section What are the funds’ and each underlying fund’s main investment strategies and related risks? beginning on page 189.
Putnam ESG Ultra Short ETF (“Ultra Short ETF”)
Ultra Short ETF invests in a diversified short duration portfolio of fixed-income securities comprised of investment-grade money market and other fixed-income securities, including U.S. dollar-denominated foreign securities of these types, with a focus on companies or issuers that Franklin Advisers, Ultra Short ETF’s investment manager, believes meet relevant ESG criteria, on a sector-specific basis. Under normal circumstances, Ultra Short ETF invests at least 80% of the value of its net assets in fixed-income securities that meet Franklin Advisers’ ESG criteria. For a further discussion of Ultra Short ETF’s investment strategy, please turn to the section What are the funds’ and each underlying fund’s main investment strategies and related risks? beginning on page 189.
It is important to understand that you can lose money by investing in the fund. Losses may occur near, at or after the target date. There is no guarantee that the fund will provide adequate income at and through an investor’s retirement.
The fund’s allocation of assets among asset classes and the underlying funds may hurt performance. An underlying fund may change its investment program or policies without the fund’s approval, which could require the fund to reduce or eliminate its allocation to the underlying fund at an unfavorable time.
The fund invests in underlying funds and indirectly bears expenses related to the underlying funds. However, the Investment Manager has contractually agreed to waive fees, reimburse expenses of, or reimburse the fund through at least November 30, 2034 in an amount equal to the fund’s acquired fund fees and expenses (e.g., the fees and expenses incurred by the fund as a result of its investments in the underlying funds). The Investment Manager also has contractually agreed to waive fees and/or reimburse expenses of each class of shares of the fund through at least November 30, 2034 in an amount sufficient to result in total annual fund operating expenses for class A, C, R, R3, R4, R5, R6 and Y shares of the fund (exclusive of payments under the fund’s distribution plans, brokerage, interest, taxes, investment-related expenses, acquired fund fees and expenses, and extraordinary expenses) that equal 0.60%, 0.60%, 0.75%, 0.75%, 0.75%, 0.60%, 0.50%, and 0.60%, respectively, of the fund’s average net assets.
Pending investment in underlying funds, the fund also expects to temporarily invest cash balances resulting from purchase activity by fund shareholders in Putnam Government Money Market Fund, a money market mutual fund sponsored by the Investment Manager, or in cash or cash equivalents. In addition, the fund expects to invest a portion of its assets in Putnam Government Money Market Fund or in cash or cash equivalents in order to manage shareholder redemptions. Large positions in Putnam Government Money Market Fund or in cash or cash equivalents may dampen performance and may prevent the fund from achieving its goal. These practices may be subject to other risks, as described under Miscellaneous Investments, Investment Practices and Risks in the SAI.
The fund also bears the risks associated with the underlying funds identified below. The relative significance of these risks will vary over time based on the fund’s target allocations to the underlying funds and to equity and fixed-income asset classes, which may change from time to time as discussed above.
Investment Strategy-Related Risks of the Underlying Funds
Sustainability and ESG investing risk. Investing in underlying funds with an ESG or sustainability focus may result in the fund having exposure to underlying funds that invest in certain types of companies, issuers, industries or sectors that the market may not favor. In evaluating an investment opportunity for the underlying funds, Franklin Advisers, Putnam Management or PanAgora may make investment decisions without the availability of optimal ESG-related data (which may be even less available with securitized debt instruments) or based on information and data that is incomplete or inaccurate. Sustainability and ESG metrics are not uniformly defined, and applying such metrics involves subjective assessments. Sustainability and ESG scorings and assessments of issuers can vary across third-party data providers and may change over time. Franklin Advisers, Putnam Management and PanAgora do not rely exclusively on third-party data providers in evaluating sustainability and ESG criteria for the underlying funds. ESG information from third-party data providers may be incomplete, inaccurate or unavailable, particularly with respect to companies in emerging market countries, which may adversely impact the investment process. In addition, the business practices, products or services of issuers in which an underlying fund invests may change over time. As a result of these possibilities, among others, an underlying fund may temporarily hold securities that are inconsistent with the underlying fund’s ESG or sustainability investment criteria. Regulatory changes or interpretations regarding the definitions and/or use of ESG and/or sustainability criteria could have a material adverse effect on the underlying fund’s ability to invest in accordance with its investment policies and/or achieve its investment objective. The underlying funds do not restrict investments based solely on “negative screens”, and the underlying fixed-income funds do not restrict their fixed-income investments to “green bonds” (e.g., U.S. dollar-denominated bonds designated as “green” by the Climate Bonds Initiative). For the underlying funds that pursue fixed-income investment strategies, because fixed-income investments generally represent a promise to pay principal and interest by an issuer, and not an ownership interest, and may involve complex structures, ESG-related investment considerations may have a more limited impact on risk and return (or may have an impact over a different investment time horizon) relative to other asset classes, and this may be particularly true for shorter-term investments. In addition, holders of fixed-income investments do not typically have voting rights, unlike holders of equity investments who have the right to vote on issuer proposals.
Market risk. The value of investments in the underlying funds’ portfolios may fall or fail to rise over extended periods of time for a variety of reasons, including general economic, political or financial market conditions, investor sentiment and market perceptions, government actions, geopolitical events or changes, outbreaks of infectious illnesses or other widespread public health issues (including epidemics and
pandemics), and factors related to a specific issuer, geography, industry or sector. These and other factors may lead to increased volatility and reduced liquidity in the underlying funds’ portfolio holdings, may negatively impact the fund’s performance, and may exacerbate other risks to which the fund is subject.
Common stock risk. (For all underlying funds except Core Bond ETF, High Yield ETF and Ultra Short ETF) Common stock represents an ownership interest in a company. The value of a company’s stock may fall or fail to rise as a result of factors directly relating to that company, such as decisions made by its management or lower demand for the company’s products or services. A stock’s value may also fall because of factors affecting not just the company, but also other companies in the same industry or in a number of different industries, such as increases in production costs.
| Growth investing risk.. Growth stocks may be more susceptible to earnings disappointments, and the market may not favor growth-style investing. |
| Value investing risk. Value stocks may fail to rebound, and the market may not favor value-style investing. Companies whose stocks we believe are undervalued by the market may have experienced adverse business developments or may be subject to special risks that have caused their stocks to be out of favor. |
| Small and midsize companies risk. Stocks of small and midsize companies often trade in smaller volumes, and their prices may fluctuate more than stocks of larger companies. Stocks of these companies may therefore be more vulnerable to adverse developments than those of larger companies. |
Industry or sector concentration risk. (For all underlying funds except Core Bond ETF, High Yield ETF and Ultra Short ETF) From time to time, an underlying fund may invest a significant portion of its assets in companies in one or more related industries or sectors, which would make the underlying fund more vulnerable to adverse developments affecting those industries or sectors.
Model and data risk. (For all underlying funds except Sustainable Leaders ETF, Sustainable Future ETF and High Yield ETF) If the quantitative models or data that are used in managing an underlying fund prove to be incorrect or incomplete, investment decisions made in reliance on the models or data may not produce the desired results, and the underlying fund may realize losses. Additionally, market movements are likely to change the risk levels and risk allocations of the underlying fund. Investments made based on quantitative models may perform differently from the market as a whole.
Foreign investment risk. (For all underlying funds except Ultra Short ETF, Sustainable Leaders ETF and Sustainable Future ETF) The value of international investments traded in foreign currencies may be adversely impacted by fluctuations in exchange rates. International investments, particularly investments in emerging markets, may carry risks associated with potentially less stable economies or governments (such as the risk of seizure by a foreign government, the imposition of currency or other restrictions, or high levels of inflation), and may be or become
illiquid. There may be less publicly-available information, or less reliable publicly-available information, about foreign companies (including information related to companies’ ESG practices), particularly with respect to emerging market companies, than publicly-available information regarding U.S. companies. As a result, an underlying fund’s ability to evaluate a foreign company, including with respect to its ESG or sustainability practices, may be more limited than its ability to evaluate a U.S. company.
Geographic focus risk. (For PanAgora International Equity ETF and PanAgora Emerging Markets Equity ETF) From time to time, an underlying fund may invest a significant portion of its assets in companies in one or more related geographic regions, industries or sectors, such as European and Asian countries, which would make the fund more vulnerable to adverse developments affecting those geographic regions, industries or sectors, including political, economic, or other developments adversely impacting ESG or sustainable investing.
Fixed-income investments risk. (For Core Bond ETF, High Yield ETF and Ultra Short ETF) The risks associated with fixed-income investments include interest rate risk, which is the risk that the value of an underlying fund’s investments is likely to fall if interest rates rise. Fixed-income investments are also subject to credit risk, which is the risk that the issuer of a fixed-income investment may default on payment of interest or principal. Credit risk is generally greater for debt not backed by the full faith and credit of the U.S. government, and interest rate risk is generally greater for longer-term debt. Fixed-income investments may be more susceptible to downgrades or defaults during economic downturns or other periods of economic stress. Mortgage-backed investments, unlike traditional debt investments, are also subject to prepayment risk, which means that they may increase in value less than other bonds when interest rates decline and decline in value more than other bonds when interest rates rise. The underlying fund may have to invest the proceeds from prepaid investments, including mortgage-backed investments, in other investments with less attractive terms and yields. The underlying fund’s investments in mortgage-backed securities, and in certain other securities and derivatives, may be or become illiquid. The underlying fund’s investments in mortgage-backed securities may make the underlying fund’s net asset value more susceptible to economic, market, political and other developments affecting the residential and commercial real estate markets and the servicing of mortgage loans secured by real estate properties. During periods of difficult economic conditions, delinquencies and losses on commercial mortgage-backed investments in particular generally increase, including as a result of the effects of those conditions on commercial real estate markets, the ability of commercial tenants to make loan payments, and the ability of a property to attract and retain commercial tenants.
One of the underlying funds, Putnam High Yield ETF, invests mostly in higher-yield, higher-risk debt investments that are rated below BBB or its equivalent at the time of purchase by any nationally recognized securities rating agency rating such investments, or in unrated investments that Franklin Advisers believes are of comparable quality. The underlying fund may invest up to 15% of the underlying
fund’s total assets in debt investments rated below CCC or its equivalent, at the time of purchase, by each rating agency rating such investments, or in unrated investments that Franklin Advisers believes are of comparable quality. This includes investments in the lowest rating category of the rating agency. The underlying fund will not necessarily sell an investment if its rating is reduced after Franklin Advisers buys it. Investments rated below BBB or its equivalent are below-investment-grade in quality. This rating reflects a greater possibility that the issuers may be unable to make timely payments of interest and principal and thus default. If a default occurs, or is perceived as likely to occur, the value of the investment will usually be more volatile and is likely to fall. The value of a debt instrument may also be affected by changes in, or perceptions of, the financial condition of the issuer, borrower, counterparty, or other entity, or underlying collateral or assets, or changes in, or perceptions of, specific or general market, economic, industry, political, regulatory, geopolitical, environmental, public health, and other conditions. A default or expected default could also make it difficult for the underlying fund to sell the investment at a price approximating the value Franklin Advisers had previously placed on it. Lower-rated debt usually has a more limited market than higher-rated debt, which may at times make it difficult for the underlying fund to buy or sell certain debt instruments or to establish their fair values.
Derivatives risk. (For all underlying funds except PanAgora International Equity ETF, PanAgora Emerging Markets Equity ETF, Sustainable Leaders ETF and Sustainable Future ETF) An underlying fund’s use of derivatives may increase the risks of investing in the underlying fund by increasing investment exposure (which may be considered leverage) or, in the case of many over-the-counter instruments, because of the potential inability to terminate or sell derivatives positions and the potential failure of the other party to the instrument to meet its obligations. The risk of a party failing to meet its obligations may increase if the fund has significant investment exposure to that counterparty. The value of derivatives may move in unexpected ways due to unanticipated market movements, the use of leverage, imperfect correlation between the derivative instrument and the reference asset, or other factors, especially in unusual market conditions, and volatility in the value of derivatives could adversely impact the underlying fund’s returns, obligations and exposures. Derivatives are also subject to other risks, including liquidity risk (e.g., liquidity demands arising from the requirement to make payments to a derivative counterparty), operational risk (e.g., settlement issues or system failure), and legal risk (e.g., insufficient legal documentation or contract enforceability issues).
Floating rate obligations risk. (For Core Bond ETF, High Yield ETF and Ultra Short ETF) To the extent an underlying fund holds floating rate loans, interest rate risk may be reduced but will not be eliminated. While floating rate loans are normally secured by specific collateral or assets of the issuer (so that holders of the loans, such as the underlying fund, will have a priority claim on those assets in the event of default or bankruptcy of the issuer), the value of collateral may be insufficient to meet the issuer’s obligations, and the underlying fund’s access to collateral may be limited by bankruptcy or other insolvency laws. The settlement period (the period
between the execution of the trade and the delivery of cash to the purchaser) for floating rate loan transactions is typically longer than seven days, and it is possible that sale proceeds from floating rate loan transactions will not be available to meet redemption obligations.
Portfolio turnover rate risk. From time to time an underlying fund may engage in frequent trading. Funds with high turnover may be more likely to realize capital gains that must be distributed to shareholders as taxable income. High turnover may also cause a fund to pay more brokerage commissions and to incur other transaction costs (including imputed transaction costs), which may detract from performance. A fund’s portfolio turnover rate and the amount of brokerage commissions it pays and transaction costs it incurs will vary over time based on market conditions.
Management and operational risk. There is no guarantee that the investment techniques, analyses, or judgments that Franklin Advisers, Putnam Management or PanAgora, as applicable, applies in making investment decisions for the underlying funds will produce the intended outcome or that the investments they select for the underlying funds will perform as well as other securities that were not selected for the underlying funds. Franklin Advisers, Putnam Management, PanAgora, or the underlying funds’ other service providers, may experience disruptions or operating errors that could negatively impact the underlying funds.
Risks Related to Investing in ETFs
As ETFs, shares of the underlying funds are traded in the secondary market. Prior to trading in the secondary market, shares of the underlying funds are “created” at NAV by market makers, large investors and institutions (collectively, “authorized participants”) only in creation units. A creation transaction generally takes place when an authorized participant deposits into an underlying fund a designated portfolio of securities, assets or other positions (a “creation basket”), and an amount of cash (including any cash representing the value of substituted securities, assets or other positions), if any, in exchange for a specified number of creation units. Similarly, shares of an underlying fund can be redeemed only in creation units, generally for a designated portfolio of securities, assets or other positions held by the underlying fund and an amount of cash (including any portion of such securities for which cash may be substituted), if any.
Fluctuation of net asset value (“NAV”) and share price risk. Shares of the underlying funds may trade at a larger premium or discount to their NAV than shares of other ETFs. The NAV of an underlying fund will generally fluctuate with changes in the market value of the underlying fund’s holdings. Underlying fund shares can be bought and sold in the secondary market at market prices. Disruptions to creations and redemptions, the existence of extreme market volatility or potential lack of an active trading market for an underlying fund’s shares may result in the underlying fund’s shares trading significantly above (at a premium) or below (at a discount) to NAV or to the intraday value of the underlying fund’s holdings. In addition, in stressed market conditions or periods of market disruption or volatility, the market for shares of the
underlying funds may become less liquid in response to deteriorating liquidity in the markets for the underlying funds’ portfolio holdings.
Authorized participant concentration risk. Only an authorized participant may engage in creation and redemption transactions directly with an underlying fund. Your fund is not an authorized participant and can only purchase and sell underlying fund shares in the secondary market at market prices or through an authorized participant. The underlying fund may have a limited number of financial institutions that act as authorized participants, none of which are obligated to engage in creation and/or redemption transactions. To the extent that those authorized participants do not engage in creation and redemption orders, there may be a significantly diminished trading market for underlying fund shares, or underlying fund shares may trade at a discount (or premium) to NAV and possibly face trading halts and/or de-listing.
Trading issues risk. The underlying funds have a limited public trading history. Sustainable Leaders ETF and Sustainable Future ETF began trading publicly in May 2021, while PanAgora International Equity ETF, PanAgora Emerging Markets Equity ETF, Core Bond ETF, High Yield ETF, and Ultra Short ETF began trading publicly in January 2023. There can be no assurance that an active trading market will develop or be maintained or that the market for underlying fund shares will operate as intended, which could lead to the underlying funds’ shares trading at wider spreads and larger premiums and discounts to NAV than other actively managed ETFs. As a result, it may cost the fund more to trade underlying fund shares than shares of other ETFs. There is no guarantee that the underlying fund will be able to attract market makers and authorized participants. Market makers and authorized participants are not obligated to make a market in the underlying fund’s shares or to submit purchase and redemption orders for creation units.
The market prices of an underlying fund’s shares are expected to fluctuate, in some cases materially, in response to changes in the underlying fund’s NAV, the intraday value of the underlying fund’s holdings and supply and demand for the underlying fund’s shares. Each underlying fund’s respective investment manager cannot predict whether an underlying fund’s shares will trade above, below or at their NAV or the intraday value of the underlying fund’s holdings. During periods when an underlying fund is trading below its NAV, the fund may incur significant losses if it sells its underlying fund shares.
The securities held by an underlying fund may be traded in markets that close at a different time than the exchange on which the underlying fund’s shares are listed. Liquidity in those securities may be reduced after the applicable closing times. Accordingly, during the time when the exchange is open but after the applicable market closing, fixing or settlement times, bid-ask spreads on the exchange and the corresponding premium or discount to the NAV of the underlying funds’ shares may widen.
Large shareholder risk. Each underlying fund may be an investment option for mutual funds that are managed by Franklin Resources, Inc. (“Franklin Templeton”) and its affiliates as “funds of funds.” Additionally, other investors from time to time may make substantial investments in an underlying fund, including affiliates of Franklin Templeton, through seed capital arrangements. Such shareholders may at times be considered to control an underlying fund. Dispositions of a large number of shares by these shareholders may adversely affect an underlying fund’s liquidity and net assets to the extent such transactions are executed directly with the underlying fund in the form of redemptions through an authorized participant, rather than executed in the secondary market. These redemptions may also force an underlying fund to sell securities, which may increase the underlying fund’s brokerage costs. In addition, underlying fund returns may be adversely affected if an underlying fund holds a portion of its assets in liquid, cash-like investments in connection with or in anticipation of shareholder redemptions. To the extent these large shareholders transact in shares of an underlying fund on the secondary market, such transactions may account for a large percentage of the trading volume on the exchange and may, therefore, have a material effect (upward or downward) on the market price of the underlying fund’s shares.
Cash transactions risk. Some of the underlying funds may effect creations and redemptions in cash or partially in cash. Therefore, an underlying fund may be required to sell portfolio securities, incur transaction costs, and subsequently recognize gains on such sales that the underlying fund might not have recognized if it were to distribute portfolio securities in-kind. As such, investments by a fund in an underlying fund’s shares may be less tax-efficient than an investment in an ETF that distributes portfolio securities entirely in-kind. An underlying fund may also incur transaction costs in connection with creations effected in cash (in whole or in part).
Semi-transparent ETF risk. (For Sustainable Leaders ETF and Sustainable Future ETF) Two of the underlying funds, Putnam Sustainable Leaders ETF and Putnam Sustainable Future ETF (the “Semi-Transparent ETFs”), are different from traditional ETFs, including the other underlying funds. Traditional ETFs disclose to the public what assets they hold each day. However, the Semi-Transparent ETFs do not. This may create additional risks for an investment in the Semi-Transparent ETFs, including that an investor may have to pay more money to trade the Semi-Transparent ETF’s shares in light of the fact that the Semi-Transparent ETF will provide less information to traders, who tend to charge more for trades when they have less information. The price an investor pays to buy or sell an ETF’s shares on an exchange may not match the value of the ETF’s portfolio, and these price differences may be greater for the Semi-Transparent ETFs compared to other ETFs because they provide less information to traders. These additional risks may be even greater in adverse or uncertain market conditions.
The differences between the Semi-Transparent ETFs and other ETFs may also have advantages. By keeping certain information about the Semi-Transparent ETFs secret, a Semi-Transparent ETF may face less risk that other traders can predict or copy its investment strategy. This may improve the Semi-Transparent ETF’s performance.
If other traders are able to copy or predict the Semi-Transparent ETF’s investment strategy, however, this may hurt the Semi-Transparent ETF’s performance.
Tracking basket structure risk. (For Sustainable Leaders ETF and Sustainable Future ETF) The Semi-Transparent ETFs are actively managed ETFs that operate pursuant to an exemptive order from the Securities and Exchange Commission and do not publicly disclose their complete portfolio holdings each business day. Instead, each Semi-Transparent ETF publishes each business day on its website a “Tracking Basket,” which is designed to closely track the daily performance of the Semi-Transparent ETF but is not the Semi-Transparent ETF’s actual portfolio. The Tracking Basket is comprised of: (1) select recently disclosed portfolio holdings and/or select securities from the universe from which the Semi-Transparent ETF’s investments are selected (“Strategy Components”); (2) liquid ETFs that convey information about the types of instruments (that are not otherwise fully represented by the Strategy Components) in which the Semi-Transparent ETF invests; and (3) cash and cash equivalents.
A Semi-Transparent ETF’s Tracking Basket structure may affect the price at which shares of the Semi-Transparent ETF trade in the secondary market. Although the Tracking Basket is intended to provide investors with enough information to allow for an effective arbitrage mechanism that will keep the market price of each Semi-Transparent ETF at or close to its NAV per share, there is a risk that market prices will vary significantly from NAV. The Semi-Transparent ETFs, which trade on the basis of a published Tracking Basket, may trade at a wider bid/ask spread than ETFs that publish their portfolios on a daily basis, and therefore, may cost investors more to trade. These risks may increase during periods of market disruption or volatility. In addition, although each Semi-Transparent ETF seeks to benefit from keeping its portfolio information secret, market participants may attempt to use the Tracking Basket to identify the Semi-Transparent ETF’s trading strategy. If successful, this could result in such market participants engaging in certain predatory trading practices that may have the potential to harm the Semi-Transparent ETF and its shareholders, such as front running the Semi-Transparent ETF’s trades of portfolio securities.
Arbitrage risk. (For Sustainable Leaders ETF and Sustainable Future ETF) Unlike ETFs that publicly disclose their complete portfolio holdings each business day, each Semi-Transparent ETF provides certain other information intended to allow market participants to estimate the value of positions in the Semi-Transparent ETF’s shares. Although this information is designed to facilitate arbitrage opportunities in the Semi-Transparent ETF’s shares to reduce bid/ask spreads and minimize discounts or premiums between the market price and NAV of the Semi-Transparent ETF shares, there is no guarantee the Semi-Transparent ETF’s arbitrage mechanism will operate as intended and that the Semi-Transparent ETF will not experience wide bid/ask spreads and/or large discounts or premiums to NAV. In addition, market participants may attempt to use the disclosed information to “reverse engineer” the Semi-Transparent ETF’s trading strategy, which, if successful, could increase opportunities for predatory trading practices that may have the potential to negatively impact the Semi-Transparent ETF’s performance.
Trading halt risk. (For Sustainable Leaders ETF and Sustainable Future ETF) There may be circumstances where a security held in a Semi-Transparent ETF’s portfolio but not in the Tracking Basket does not have readily available market quotations. If Putnam Management determines that such circumstance may affect the reliability of the Tracking Basket as an arbitrage vehicle, that information, along with the identity and weighting of that security in the Semi-Transparent ETF’s portfolio, will be publicly disclosed on the Semi-Transparent ETF’s website, and Putnam Management will assess appropriate remedial measures. In these circumstances, market participants may use this information to engage in certain predatory trading practices that may have the potential to harm the Semi-Transparent ETF and its shareholders. In addition, if securities representing 10% or more of the Semi-Transparent ETF’s portfolio do not have readily available market quotations, Putnam Management would promptly request the exchange to halt trading of the Semi-Transparent ETF, meaning that investors (including the fund) would not be able to trade their shares. Trading may also be halted in other circumstances, for example, due to market conditions.
The fund may not achieve its goal, and it is not intended to be a complete investment program. An investment in the fund is not insured or guaranteed by the Federal Deposit Insurance Corporation or any other government agency.
The performance information below gives some indication of the risks associated with an investment in the fund by showing the fund’s performance year to year and over time. Before February 10, 2023, the fund was managed with a materially different investment strategy and may have achieved materially different performance results under its current investment strategy from that shown for periods before this date. The bar chart does not reflect the impact of sales charges. If it did, performance would be lower. Please remember that past performance is not necessarily an indication of future results. Monthly performance figures for the fund are available at www.franklintempleton.com.
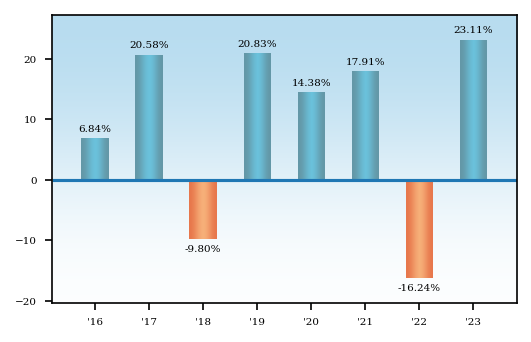
Average Annual Total Returns - Putnam Sustainable Retirement 2060 Fund |
1 Year |
5 Years |
Since Inception |
Inception Date |
|||
|---|---|---|---|---|---|---|---|
| Class A 2060 | 16.03% | 9.63% | 7.50% | Nov. 30, 2015 | |||
| Class A 2060 | After Taxes on Distributions | 15.56% | 7.95% | 5.85% | Nov. 30, 2015 | |||
| Class A 2060 | After Taxes on Distributions and Sales | 9.63% | 7.23% | 5.49% | Nov. 30, 2015 | |||
| Class C 2060 | 21.28% | 10.13% | 7.50% | Nov. 30, 2015 | |||
| Class R 2060 | 22.67% | 10.58% | 7.97% | Nov. 30, 2015 | |||
| Class R3 2060 | 22.97% | [1] | 10.81% | [1] | 8.19% | [1] | Nov. 30, 2015 |
| Class R4 2060 | 23.35% | [2] | 11.10% | [2] | 8.47% | [2] | Nov. 30, 2015 |
| Class R5 2060 | 23.53% | [3] | 11.27% | [3] | 8.62% | [3] | Nov. 30, 2015 |
| Class R6 2060 | 23.64% | [4] | 11.33% | [4] | 8.66% | [4] | Nov. 30, 2015 |
| Class Y 2060 | 23.55% | 11.24% | 8.57% | Nov. 30, 2015 | |||
| Russell 3000® Index (no deduction for fees, expenses or taxes) | 25.96% | [5] | 15.16% | [5] | 12.37% | [5] | Nov. 30, 2015 |
| Bloomberg U.S. Aggregate Bond Index (no deduction for fees, expenses or taxes) | 5.53% | [5] | 1.10% | [5] | 1.40% | [5] | Nov. 30, 2015 |
| S&P Target Date To 2060 Index (no deduction for fees, expenses or taxes) | 20.44% | [5] | 10.96% | [5] | 8.97% | [5] | Nov. 30, 2015 |
| [1] | Performance for class R3 shares prior to their inception (1/4/21) is derived from the historical performance of class Y shares, adjusted for the higher 12b-1 fees and investor servicing fees applicable to class R3 shares (relative to the comparable fees applicable to class Y shares prior to the inception of class R3 shares). |
| [2] | Performance for class R4 shares prior to their inception (1/4/21) is derived from the historical performance of class Y shares, adjusted for the higher investor servicing fees applicable to class R4 shares (relative to the comparable fees applicable to class Y shares prior to the inception of class R4 shares). |
| [3] | Performance for class R5 shares prior to their inception (1/4/21) is derived from the historical performance of class R6 shares and has not been adjusted for the lower fund expenses applicable to class R5 shares (relative to the comparable expenses applicable to R6 shares prior to the inception of class R5 shares); had it, returns would have been higher. |
| [4] | Performance for class R6 shares prior to their inception (9/1/16) is derived from the historical performance of class Y shares and has not been adjusted for the lower investor servicing fees applicable to class R6 shares (relative to the comparable fees applicable to class Y shares prior to the inception of class R6 shares); had it, returns would have been higher. |
| [5] | The table above compares the fund’s returns to the performance of three indexes: (i) the Russell 3000® Index, a broad measure of market performance, (ii) the Bloomberg U.S. Aggregate Bond Index, a broad measure of market performance, and (iii) the S&P Target Date To 2060 Index, an additional index that the Investment Manager believes more closely reflects the fund’s principal investment objective and strategies. |
| Class C share performance reflects conversion to class A shares after eight years. |
| After-tax returns reflect the historical highest individual federal marginal income tax rates and do not reflect state and local taxes. Actual after-tax returns depend on an investor’s tax situation and may differ from those shown. After-tax returns are shown for class A shares only and will vary for other classes. These after-tax returns do not apply if you hold your fund shares through a 401(k) plan, an IRA, or another tax-advantaged arrangement. |
| The Russell 3000® Index measures the performance of the 3,000 largest U.S. companies based on total market capitalization. Source: FTSE. |
| Frank Russell Company is the source and owner of the trademarks, service marks and copyrights related to the Russell Indexes. Russell ® is a trademark of Frank Russell Company. |
| The Bloomberg U.S. Aggregate Bond Index is an unmanaged index of U.S. investment-grade fixed income securities. |
| All Bloomberg indices are provided by Bloomberg Index Services Limited. |
| BLOOMBERG® is a trademark and service mark of Bloomberg Finance L.P. and its affiliates (collectively “Bloomberg”). Bloomberg or Bloomberg’s licensors own all proprietary rights in the Bloomberg Indices. Neither Bloomberg nor Bloomberg’s licensors approve or endorse this material, or guarantees the accuracy or completeness of any information herein, or makes any warranty, express or implied, as to the results to be obtained therefrom, and to the maximum extent allowed by law, neither shall have any liability or responsibility for injury or damages arising in connection therewith. |
| The S&P Target Date To Index Series is designed to represent a small, style-specific derived consensus of asset class exposure and glide path for a specified list of target retirement dates. |
| Securities in the fund do not match those in the indexes and the performance of the fund will differ. |
Putnam Sustainable Retirement 2055 Fund seeks capital appreciation and current income consistent with a decreasing emphasis on capital appreciation and an increasing emphasis on current income as it approaches its target date.
The following tables describe the fees and expenses you may pay if you buy, hold, and sell shares of the fund. You may pay other fees, such as brokerage commissions and other fees to financial intermediaries, which are not reflected in the tables and examples below. You may qualify for sales charge discounts if you and your family invest, or agree to invest in the future, at least $50,000 in Putnam funds. More information about these and other discounts is available from your financial professional and in How do I buy fund shares? beginning on page 227 of the fund’s prospectus, in the Appendix to the fund’s prospectus, and in How to buy shares beginning on page II-3 of the fund’s statement of additional information (“SAI”).
Shareholder Fees - Putnam Sustainable Retirement 2055 Fund |
Class A 2055 |
Class C 2055 |
Class R 2055 |
Class R3 2055 |
Class R4 2055 |
Class R5 2055 |
Class R6 2055 |
Class Y 2055 |
||
|---|---|---|---|---|---|---|---|---|---|---|
| Maximum Sales Charge Imposed on Purchases (as a percentage of Offering Price) | 5.75% | none | none | none | none | none | none | none | ||
| Maximum Deferred Sales Charge (as a percentage) | 1.00% | [1] | 1.00% | [2] | none | none | none | none | none | none |
| [1] | Applies only to certain redemptions of shares bought with no initial sales charge. |
| [2] | This charge is eliminated after one year. |
Annual Fund Operating Expenses - Putnam Sustainable Retirement 2055 Fund |
Class A 2055 |
Class C 2055 |
Class R 2055 |
Class R3 2055 |
Class R4 2055 |
Class R5 2055 |
Class R6 2055 |
Class Y 2055 |
|
|---|---|---|---|---|---|---|---|---|---|
| Management Fees (as a percentage of Assets) | 0.53% | 0.53% | 0.53% | 0.53% | 0.53% | 0.53% | 0.53% | 0.53% | |
| Distribution and Service (12b-1) Fees | 0.25% | 1.00% | 0.50% | 0.25% | none | none | none | none | |
| Other Expenses (as a percentage of Assets): | 0.30% | 0.30% | 0.45% | 0.45% | 0.45% | 0.30% | 0.20% | 0.30% | |
| Acquired Fund Fees and Expenses | 0.56% | 0.56% | 0.56% | 0.56% | 0.56% | 0.56% | 0.56% | 0.56% | |
| Expenses (as a percentage of Assets) | 1.64% | 2.39% | 2.04% | 1.79% | 1.54% | 1.39% | 1.29% | 1.39% | |
| Fee Waiver or Reimbursement | [1] | (0.79%) | (0.79%) | (0.79%) | (0.79%) | (0.79%) | (0.79%) | (0.79%) | (0.79%) |
| Net Expenses (as a percentage of Assets) | 0.85% | 1.60% | 1.25% | 1.00% | 0.75% | 0.60% | 0.50% | 0.60% | |
| [1] | Reflects a contractual obligation of the Investment Manager to limit certain fund expenses through November 30, 2027. This obligation may be modified or discontinued only with approval of the Board of Trustees. |
The following hypothetical example is intended to help you compare the cost of investing in the fund with the cost of investing in other funds. It assumes that you invest $10,000 in the fund for the time periods indicated and then, except as indicated, redeem all your shares at the end of those periods. It assumes a 5% return on your investment each year and that the fund’s operating expenses remain the same. Only the first three years of each period in the example take into account the expense reimbursement described above. Your actual costs may be higher or lower.
Expense Example - Putnam Sustainable Retirement 2055 Fund - USD ($) |
Expense Example, with Redemption, 1 Year |
Expense Example, with Redemption, 3 Years |
Expense Example, with Redemption, 5 Years |
Expense Example, with Redemption, 10 Years |
Expense Example, No Redemption, 1 Year |
Expense Example, No Redemption, 3 Years |
Expense Example, No Redemption, 5 Years |
Expense Example, No Redemption, 10 Years |
|---|---|---|---|---|---|---|---|---|
| Class A 2055 | 657 | 831 | 1,192 | 2,206 | ||||
| Class C 2055 | 263 | 505 | 1,047 | 2,331 | 163 | 505 | 1,047 | 2,331 |
| Class R 2055 | 127 | 397 | 866 | 2,166 | ||||
| Class R3 2055 | 102 | 318 | 734 | 1,896 | ||||
| Class R4 2055 | 77 | 240 | 601 | 1,619 | ||||
| Class R5 2055 | 61 | 192 | 520 | 1,449 | ||||
| Class R6 2055 | 51 | 160 | 466 | 1,334 | ||||
| Class Y 2055 | 61 | 192 | 520 | 1,449 |
The fund pays transaction-related costs, such as commissions, when it buys and sells securities (or “turns over” its portfolio). A higher turnover rate may indicate higher transaction costs and may result in higher taxes when the fund’s shares are held in a taxable account. These costs, which are not reflected in annual fund operating expenses or the above example, affect fund performance. The fund’s turnover rate in the most recent fiscal year was 13%.
Investments
The fund is one of a series of target date funds that invest primarily in exchange-traded funds (“ETFs”) that focus on investments with positive sustainability or environmental, social, and governance (“ESG”) characteristics, referred to as underlying funds. The underlying funds include funds managed by Franklin Advisers, Inc. (“Franklin Advisers” or the “Investment Manager”), the fund’s investment manager, and funds managed by affiliated investment advisers. The fund’s asset allocation strategy may be attractive to investors who plan to retire or otherwise intend to begin making periodic withdrawals of their investments in or about 2055 (the target date). The fund is designed to provide diversification among different asset classes by investing its assets in the underlying funds.
Under normal circumstances, the fund will invest in underlying funds (which, for purposes of this policy, include money market mutual funds advised by the Investment Manager or its affiliates) such that, in the aggregate, it has indirect exposure to investments that meet each underlying fund’s respective sustainability or ESG criteria and that represent at least 80% of the value of its net assets. This policy is non-fundamental and may be changed only after 60 days’ notice to shareholders. The Investment Manager may not apply ESG or sustainability criteria to investments that are not subject to the fund’s 80% policy, and such investments may not meet the applicable ESG or sustainability criteria. Through its investments in underlying funds, the fund makes use of a range of ESG- and sustainability- oriented investment strategies and invests across a variety of asset classes. The ESG or sustainability criteria will differ across the underlying funds. These differences may arise both from differences in the underlying funds’ asset classes (such as the characteristics of non-U.S. versus U.S. issuers, or the structural differences (e.g., position in the capital structure) between equity and fixed-income investments) as well as from different managers’ styles. In implementing an underlying fund’s investment strategy, the portfolio managers of the underlying fund may apply and weigh different ESG criteria differently than the portfolio managers of the other underlying funds. There are also expected to be differences in how the portfolio managers of the underlying funds source ESG-related or sustainability-oriented research (e.g., proprietary versus third-party research) and/or their approach to selecting companies based on ESG or sustainability criteria.
The fund’s target allocations among asset classes and underlying funds will increasingly emphasize capital preservation and income over time and will change gradually based on the number of remaining years until the fund’s target date, as shown in the predetermined “glide path” in the chart under “What are the funds’ and each underlying fund’s main investment strategies and related risks?” The Investment Manager adjusts these allocations at the end of each calendar quarter based on the glide path.
Pending investment in underlying funds, the fund also expects to temporarily invest cash balances resulting from purchase activity by fund shareholders in Putnam Government Money Market Fund, a mutual fund sponsored by the Investment Manager, or in cash or cash equivalents. The fund also expects to invest a portion of its assets in Putnam Government Money Market Fund or in cash or cash equivalents in order to manage shareholder redemptions. The percentage of a fund invested in Putnam Government Money Market Fund is expected to vary over time and will depend on the level of purchase and redemption activity by fund shareholders.
The following table presents your fund’s approximate allocations to each asset class and underlying fund as of September 30, 2024 (taking into account any tactical adjustments described below) and its projected approximate allocations to those asset classes and underlying funds as of September 30, 2025. The table does not reflect temporary investments in Putnam Government Money Market Fund or in cash or cash equivalents. By comparing the percentage allocations of your fund in the table, you can see how its allocations are expected to change during the one-year period beginning on September 30, 2024. The table also shows the approximate allocations of other Putnam Sustainable Retirement Funds, which are designed for investors with different target retirement dates. Over a five-year period, each fund’s allocations will gradually change to resemble the allocations of the fund with the next earliest target date. The table illustrates how a fund’s allocations are expected to change over time to increasingly emphasize capital preservation and income.
| Underlying Fund* | Year | 2065 | 2060 | 2055 (your fund) | 2050 | 2045 | 2040 | 2035 | 2030 | 2025 | Maturity Fund |
| Putnam Sustainable Leaders ETF | 2024 | 48.6% | 47.2% | 44.8% | 42.3% | 39.7% | 36.4% | 31.7% | 21.0% | 14.9% | 14.1% |
| 2025 | 47.6% | 45.8% | 43.3% | 40.7% | 38.4% | 35.2% | 30.3% | 18.6% | 14.3% | 14.1% | |
| Putnam Sustainable Future ETF | 2024 | 23.8% | 23.1% | 21.9% | 20.6% | 19.4% | 17.9% | 15.8% | 10.5% | 7.5% | 7.1% |
| 2025 | 23.8% | 22.9% | 21.7% | 20.4% | 19.2% | 17.6% | 15.2% | 9.3% | 7.1% | 7.1% | |
| Putnam PanAgora ESG Inter-national Equity ETF | 2024 |
17.8% | 17.3% | 16.4% | 15.5% | 14.4% | 12.4% | 9.6% | 6.3% | 4.5% | 4.2% |
| 2025 | 17.8% | 17.2% | 16.2% | 15.3% | 14.2% | 11.9% | 9.1% | 5.6% | 4.3% | 4.2% | |
| Putnam PanAgora ESG Emer-ging Markets Equity ETF | 2024 |
4.9% | 4.8% | 4.5% | 4.2% | 3.8% | 2.2% | 0.1% | 0.0% | 0.0% | 0.0% |
| 2025 | 5.9% | 5.7% | 5.4% | 5.1% | 4.5% | 2.2% | 0.0% | 0.0% | 0.0% | 0.0% | |
| Putnam ESG Core Bond ETF | 2024 | 3.3% | 5.3% | 8.9% | 12.4% | 15.4% | 23.0% | 33.5% | 49.7% | 52.3% | 51.7% |
| 2025 | 3.3% | 5.9% | 9.7% | 13.0% | 16.1% | 24.8% | 35.4% | 53.4% | 51.8% | 51.7% | |
| Putnam ESG High Yield ETF | 2024 | 1.1% | 1.8% | 3.0% | 4.1% | 4.9% | 4.8% | 4.9% | 6.7% | 14.8% | 16.9% |
| 2025 | 1.1% | 2.0% | 3.2% | 4.3% | 4.9% | 4.8% | 5.3% | 7.1% | 16.5% | 16.9% | |
| Putnam ESG Ultra Short ETF | 2024 | 0.5% | 0.5% | 0.5% | 0.9% | 2.4% | 3.3% | 4.4% | 5.8% | 6.0% | 6.0% |
| 2025 | 0.5% | 0.5% | 0.5% | 1.2% | 2.7% | 3.5% | 4.7% | 6.0% | 6.0% | 6.0% | |
| Total Equity** | 2024 | 95.1% | 92.4% | 87.6% | 82.6% | 77.3% | 68.9% | 57.2% | 37.8% | 26.9% | 25.4% |
| 2025 | 95.1% | 91.6% | 86.6% | 81.5% | 76.3% | 66.9% | 54.6% | 33.5% | 25.7% | 25.4% | |
| Total Fixed Income** | 2024 | 4.9% | 7.6% | 12.4% | 17.4% | 22.7% | 31.1% | 42.8% | 62.2% | 73.1% | 74.6% |
| 2025 | 4.9% | 8.4% | 13.4% | 18.5% | 23.7% | 33.1% | 45.4% | 66.5% | 74.3% | 74.6% |
| * | Due to rounding, allocations shown in the table above may not total 100%. In addition, because of rounding in the calculation of allocations among underlying funds and market fluctuations, actual allocations might be more or less than these percentages. |
| ** | Equity and fixed-income allocations are hypothetical estimates based on an assumption that each of Putnam Sustainable Leaders ETF, Putnam Sustainable Future ETF, Putnam PanAgora ESG International Equity ETF, and Putnam PanAgora ESG Emerging Markets Equity ETF is equivalent to an equity investment and each of Putnam ESG Core Bond ETF, Putnam ESG High Yield ETF and Putnam ESG Ultra Short ETF is equivalent to a fixed-income investment. Actual allocations will vary. |
The fund’s target allocations may differ from the allocations shown in the table. The Investment Manager may change the glide path, the fund’s target allocations, and the underlying funds in which it invests at any time, although the Investment Manager generally expects these changes (other than the tactical adjustments described below) to be infrequent and generally in response to longer-term structural changes (e.g., in the average retirement age or life expectancy) that lead the fund’s portfolio managers to determine that a change is advisable. The Investment Manager may also make tactical adjustments from time to time in the fund’s allocations to underlying funds in response to market conditions within a range of +/- 15% from the allocations to fixed-income and equity asset classes as presented in the fund’s glide path.
It is assumed that investors will begin gradual withdrawals from the fund at around the target date. Near the end of the target date year, the fund’s target allocations will correspond to those of Putnam Sustainable Retirement Maturity Fund (“Maturity Fund”), a fund that seeks as high a rate of current income as the Investment Manager believes is consistent with preservation of capital, and the fund will be merged into Maturity Fund. More information about Maturity Fund is available in the prospectus beginning on page 171, and more information about the underlying funds (which are not offered by this prospectus) is included below and under “What are the funds’ and each underlying fund’s main investment strategies and related risks?”
Information about each underlying fund’s investment strategy
Putnam Sustainable Leaders ETF (“Sustainable Leaders ETF”)
Sustainable Leaders ETF invests mainly in common stocks of U.S. companies of any size, with a focus on companies that Putnam Investment Management, LLC (“Putnam Management”), Sustainable Leaders ETF’s investment manager, believes exhibit a commitment to financially material sustainable business practices. Sustainable Leaders ETF may also invest in non-U.S. companies. In evaluating investments for Sustainable Leaders ETF, Putnam Management views “financially material sustainable business practices” as business practices that it believes are reasonably likely to impact the financial condition or operating performance of a company and that relate to environmental, social, or corporate governance issues.
Under normal circumstances, Sustainable Leaders ETF invests at least 80% of the value of its net assets in securities that meet Putnam Management’s sustainability criteria. For a further discussion of Sustainable Leaders ETF’s investment strategy, please turn to the section What are the funds’ and each underlying fund’s main investment strategies and related risks? beginning on page 189.
Putnam Sustainable Future ETF (“Sustainable Future ETF”)
Sustainable Future ETF invests mainly in common stocks of U.S. companies of any size, with a focus on companies whose products and services Putnam Management, Sustainable Future ETF’s investment manager, believes provide solutions that directly contribute to sustainable social, environmental and economic development (Solutions Companies).
Under normal circumstances, Sustainable Future ETF invests at least 80% of the value of its net assets in securities that meet Putnam Management’s sustainability criteria. For a further discussion of Sustainable Future ETF’s investment strategy, please turn to the section What are the funds’ and each underlying fund’s main investment strategies and related risks? beginning on page 189.
Putnam PanAgora ESG International Equity ETF (“PanAgora International Equity ETF”)
PanAgora International Equity ETF invests mainly in common stocks (growth or value stocks or both) of companies of any size outside the United States with a focus on companies that PanAgora International Equity ETF’s subadviser, PanAgora Asset Management, Inc. (“PanAgora”), believes offer attractive benchmark-relative
returns and exhibit positive ESG metrics. Under normal circumstances, PanAgora International Equity ETF invests at least 80% of its net assets in equity securities of companies that meet PanAgora’s ESG criteria. For a further discussion of PanAgora International Equity ETF’s investment strategy, please turn to the section What are the funds’ and each underlying fund’s main investment strategies and related risks? beginning on page 189.
Putnam PanAgora ESG Emerging Markets Equity ETF (“PanAgora Emerging Markets Equity ETF”)
PanAgora Emerging Markets Equity ETF invests mainly in common stocks (growth or value stocks or both) of emerging markets companies of any size with a focus on companies that PanAgora Emerging Markets Equity ETF’s subadviser, PanAgora, believes offer attractive benchmark-relative returns and exhibit positive ESG metrics. Under normal circumstances, PanAgora Emerging Markets Equity ETF invests at least 80% of its net assets in equity securities of emerging markets companies that meet PanAgora’s ESG criteria. For a further discussion of PanAgora Emerging Markets Equity ETF’s investment strategy, please turn to the section What are the funds’ and each underlying fund’s main investment strategies and related risks? beginning on page 189.
Putnam ESG Core Bond ETF (“Core Bond ETF”)
Core Bond ETF invests mainly in a diversified portfolio of investment-grade fixed-income securities with a focus on companies or issuers that Franklin Advisers, Core Bond ETF’s investment manager, believes meet relevant ESG criteria on a sector-specific basis. Under normal circumstances, Core Bond ETF invests at least 80% of the value of its net assets in fixed-income securities that meet Franklin Advisers’ ESG criteria. For a further discussion of Core Bond ETF’s investment strategy, please turn to the section What are the funds’ and each underlying fund’s main investment strategies and related risks? beginning on page 189.
Putnam ESG High Yield ETF (“High Yield ETF”)
High Yield ETF invests mainly in bonds that are below investment grade in quality (sometimes referred to as “junk bonds”) with a focus on companies or issuers that Franklin Advisers, High Yield ETF’s investment manager, believes meet relevant ESG criteria on a sector-specific basis. High Yield ETF invests mainly in bonds that also have one or more of the following characteristics: (1) are obligations of U.S. companies or issuers and (2) have intermediate- to long-term maturities (three years or longer). Under normal circumstances, High Yield ETF invests at least 80% of the value of its net assets in fixed-income securities rated below investment grade that meet Franklin Advisers’ ESG criteria. For a further discussion of High Yield ETF’s investment strategy, please turn to the section What are the funds’ and each underlying fund’s main investment strategies and related risks? beginning on page 189.
Putnam ESG Ultra Short ETF (“Ultra Short ETF”)
Ultra Short ETF invests in a diversified short duration portfolio of fixed-income securities comprised of investment-grade money market and other fixed-income securities, including U.S. dollar-denominated foreign securities of these types, with a focus on companies or issuers that Franklin Advisers, Ultra Short ETF’s investment manager, believes meet relevant ESG criteria, on a sector-specific basis. Under normal circumstances, Ultra Short ETF invests at least 80% of the value of its net assets in fixed-income securities that meet Franklin Advisers’ ESG criteria. For a further discussion of Ultra Short ETF’s investment strategy, please turn to the section What are the funds’ and each underlying fund’s main investment strategies and related risks? beginning on page 189.
It is important to understand that you can lose money by investing in the fund. Losses may occur near, at or after the target date. There is no guarantee that the fund will provide adequate income at and through an investor’s retirement.
The fund’s allocation of assets among asset classes and the underlying funds may hurt performance. An underlying fund may change its investment program or policies without the fund’s approval, which could require the fund to reduce or eliminate its allocation to the underlying fund at an unfavorable time.
The fund invests in underlying funds and indirectly bears expenses related to the underlying funds. However, the Investment Manager has contractually agreed to waive fees, reimburse expenses of, or reimburse the fund through at least November 30, 2027 in an amount equal to the fund’s acquired fund fees and expenses (e.g., the fees and expenses incurred by the fund as a result of its investments in the underlying funds). The Investment Manager also has contractually agreed to waive fees and/or reimburse expenses of each class of shares of the fund through at least November 30, 2027 in an amount sufficient to result in total annual fund operating expenses for class A, C, R, R3, R4, R5, R6 and Y shares of the fund (exclusive of payments under the fund’s distribution plans, brokerage, interest, taxes, investment-related expenses, acquired fund fees and expenses, and extraordinary expenses) that equal 0.60%, 0.60%, 0.75%, 0.75%, 0.75%, 0.60%, 0.50%, and 0.60%, respectively, of the fund’s average net assets.
Pending investment in underlying funds, the fund also expects to temporarily invest cash balances resulting from purchase activity by fund shareholders in Putnam Government Money Market Fund, a money market mutual fund sponsored by the Investment Manager, or in cash or cash equivalents. In addition, the fund expects to invest a portion of its assets in Putnam Government Money Market Fund or in cash or cash equivalents in order to manage shareholder redemptions. Large positions in Putnam Government Money Market Fund or in cash or cash equivalents may dampen performance and may prevent the fund from achieving its goal. These practices may be subject to other risks, as described under Miscellaneous Investments, Investment Practices and Risks in the SAI.
The fund also bears the risks associated with the underlying funds identified below. The relative significance of these risks will vary over time based on the fund’s target allocations to the underlying funds and to equity and fixed-income asset classes, which may change from time to time as discussed above.
Investment Strategy-Related Risks of the Underlying Funds
Sustainability and ESG investing risk. Investing in underlying funds with an ESG or sustainability focus may result in the fund having exposure to underlying funds that invest in certain types of companies, issuers, industries or sectors that the market may not favor. In evaluating an investment opportunity for the underlying funds, Franklin Advisers, Putnam Management or PanAgora may make investment decisions without the availability of optimal ESG-related data (which may be even less available with securitized debt instruments) or based on information and data that is incomplete or inaccurate. Sustainability and ESG metrics are not uniformly defined, and applying such metrics involves subjective assessments. Sustainability and ESG scorings and assessments of issuers can vary across third-party data providers and may change over time. Franklin Advisers, Putnam Management and PanAgora do not rely exclusively on third-party data providers in evaluating sustainability and ESG criteria for the underlying funds. ESG information from third-party data providers may be incomplete, inaccurate or unavailable, particularly with respect to companies in emerging market countries, which may adversely impact the investment process. In addition, the business practices, products or services of issuers in which an underlying fund invests may change over time. As a result of these possibilities, among others, an underlying fund may temporarily hold securities that are inconsistent with the underlying fund’s ESG or sustainability investment criteria. Regulatory changes or interpretations regarding the definitions and/or use of ESG and/or sustainability criteria could have a material adverse effect on the underlying fund’s ability to invest in accordance with its investment policies and/or achieve its investment objective. The underlying funds do not restrict investments based solely on “negative screens”, and the underlying fixed-income funds do not restrict their fixed-income investments to “green bonds” (e.g., U.S. dollar-denominated bonds designated as “green” by the Climate Bonds Initiative). For the underlying funds that pursue fixed-income investment strategies, because fixed-income investments generally represent a promise to pay principal and interest by an issuer, and not an ownership interest, and may involve complex structures, ESG-related investment considerations may have a more limited impact on risk and return (or may have an impact over a different investment time horizon) relative to other asset classes, and this may be particularly true for shorter-term investments. In addition, holders of fixed-income investments do not typically have voting rights, unlike holders of equity investments who have the right to vote on issuer proposals.
Market risk. The value of investments in the underlying funds’ portfolios may fall or fail to rise over extended periods of time for a variety of reasons, including general economic, political or financial market conditions, investor sentiment and market perceptions, government actions, geopolitical events or changes, outbreaks of infectious illnesses or other widespread public health issues (including epidemics and
pandemics), and factors related to a specific issuer, geography, industry or sector. These and other factors may lead to increased volatility and reduced liquidity in the underlying funds’ portfolio holdings, may negatively impact the fund’s performance, and may exacerbate other risks to which the fund is subject.
Common stock risk. (For all underlying funds except Core Bond ETF, High Yield ETF and Ultra Short ETF) Common stock represents an ownership interest in a company. The value of a company’s stock may fall or fail to rise as a result of factors directly relating to that company, such as decisions made by its management or lower demand for the company’s products or services. A stock’s value may also fall because of factors affecting not just the company, but also other companies in the same industry or in a number of different industries, such as increases in production costs.
| Growth investing risk.. Growth stocks may be more susceptible to earnings disappointments, and the market may not favor growth-style investing. |
| Value investing risk. Value stocks may fail to rebound, and the market may not favor value-style investing. Companies whose stocks we believe are undervalued by the market may have experienced adverse business developments or may be subject to special risks that have caused their stocks to be out of favor. |
| Small and midsize companies risk. Stocks of small and midsize companies often trade in smaller volumes, and their prices may fluctuate more than stocks of larger companies. Stocks of these companies may therefore be more vulnerable to adverse developments than those of larger companies. |
Industry or sector concentration risk. (For all underlying funds except Core Bond ETF, High Yield ETF and Ultra Short ETF) From time to time, an underlying fund may invest a significant portion of its assets in companies in one or more related industries or sectors, which would make the underlying fund more vulnerable to adverse developments affecting those industries or sectors.
Model and data risk. (For all underlying funds except Sustainable Leaders ETF, Sustainable Future ETF and High Yield ETF) If the quantitative models or data that are used in managing an underlying fund prove to be incorrect or incomplete, investment decisions made in reliance on the models or data may not produce the desired results, and the underlying fund may realize losses. Additionally, market movements are likely to change the risk levels and risk allocations of the underlying fund. Investments made based on quantitative models may perform differently from the market as a whole.
Foreign investment risk. (For all underlying funds except Ultra Short ETF, Sustainable Leaders ETF and Sustainable Future ETF) The value of international investments traded in foreign currencies may be adversely impacted by fluctuations in exchange rates. International investments, particularly investments in emerging markets, may carry risks associated with potentially less stable economies or governments (such as the risk of seizure by a foreign government, the imposition of currency or other restrictions, or high levels of inflation), and may be or become
illiquid. There may be less publicly-available information, or less reliable publicly-available information, about foreign companies (including information related to companies’ ESG practices), particularly with respect to emerging market companies, than publicly-available information regarding U.S. companies. As a result, an underlying fund’s ability to evaluate a foreign company, including with respect to its ESG or sustainability practices, may be more limited than its ability to evaluate a U.S. company.
Geographic focus risk. (For PanAgora International Equity ETF and PanAgora Emerging Markets Equity ETF) From time to time, an underlying fund may invest a significant portion of its assets in companies in one or more related geographic regions, industries or sectors, such as European and Asian countries, which would make the fund more vulnerable to adverse developments affecting those geographic regions, industries or sectors, including political, economic, or other developments adversely impacting ESG or sustainable investing.
Fixed-income investments risk. (For Core Bond ETF, High Yield ETF and Ultra Short ETF) The risks associated with fixed-income investments include interest rate risk, which is the risk that the value of an underlying fund’s investments is likely to fall if interest rates rise. Fixed-income investments are also subject to credit risk, which is the risk that the issuer of a fixed-income investment may default on payment of interest or principal. Credit risk is generally greater for debt not backed by the full faith and credit of the U.S. government, and interest rate risk is generally greater for longer-term debt. Fixed-income investments may be more susceptible to downgrades or defaults during economic downturns or other periods of economic stress. Mortgage-backed investments, unlike traditional debt investments, are also subject to prepayment risk, which means that they may increase in value less than other bonds when interest rates decline and decline in value more than other bonds when interest rates rise. The underlying fund may have to invest the proceeds from prepaid investments, including mortgage-backed investments, in other investments with less attractive terms and yields. The underlying fund’s investments in mortgage-backed securities, and in certain other securities and derivatives, may be or become illiquid. The underlying fund’s investments in mortgage-backed securities may make the underlying fund’s net asset value more susceptible to economic, market, political and other developments affecting the residential and commercial real estate markets and the servicing of mortgage loans secured by real estate properties. During periods of difficult economic conditions, delinquencies and losses on commercial mortgage-backed investments in particular generally increase, including as a result of the effects of those conditions on commercial real estate markets, the ability of commercial tenants to make loan payments, and the ability of a property to attract and retain commercial tenants.
One of the underlying funds, Putnam High Yield ETF, invests mostly in higher-yield, higher-risk debt investments that are rated below BBB or its equivalent at the time of purchase by any nationally recognized securities rating agency rating such investments, or in unrated investments that Franklin Advisers believes are of comparable quality. The underlying fund may invest up to 15% of the underlying
fund’s total assets in debt investments rated below CCC or its equivalent, at the time of purchase, by each rating agency rating such investments, or in unrated investments that Franklin Advisers believes are of comparable quality. This includes investments in the lowest rating category of the rating agency. The underlying fund will not necessarily sell an investment if its rating is reduced after Franklin Advisers buys it. Investments rated below BBB or its equivalent are below-investment-grade in quality. This rating reflects a greater possibility that the issuers may be unable to make timely payments of interest and principal and thus default. If a default occurs, or is perceived as likely to occur, the value of the investment will usually be more volatile and is likely to fall. The value of a debt instrument may also be affected by changes in, or perceptions of, the financial condition of the issuer, borrower, counterparty, or other entity, or underlying collateral or assets, or changes in, or perceptions of, specific or general market, economic, industry, political, regulatory, geopolitical, environmental, public health, and other conditions. A default or expected default could also make it difficult for the underlying fund to sell the investment at a price approximating the value Franklin Advisers had previously placed on it. Lower-rated debt usually has a more limited market than higher-rated debt, which may at times make it difficult for the underlying fund to buy or sell certain debt instruments or to establish their fair values.
Derivatives risk. (For all underlying funds except PanAgora International Equity ETF, PanAgora Emerging Markets Equity ETF, Sustainable Leaders ETF and Sustainable Future ETF) An underlying fund’s use of derivatives may increase the risks of investing in the underlying fund by increasing investment exposure (which may be considered leverage) or, in the case of many over-the-counter instruments, because of the potential inability to terminate or sell derivatives positions and the potential failure of the other party to the instrument to meet its obligations. The risk of a party failing to meet its obligations may increase if the fund has significant investment exposure to that counterparty. The value of derivatives may move in unexpected ways due to unanticipated market movements, the use of leverage, imperfect correlation between the derivative instrument and the reference asset, or other factors, especially in unusual market conditions, and volatility in the value of derivatives could adversely impact the underlying fund’s returns, obligations and exposures. Derivatives are also subject to other risks, including liquidity risk (e.g., liquidity demands arising from the requirement to make payments to a derivative counterparty), operational risk (e.g., settlement issues or system failure), and legal risk (e.g., insufficient legal documentation or contract enforceability issues).
Floating rate obligations risk. (For Core Bond ETF, High Yield ETF and Ultra Short ETF) To the extent an underlying fund holds floating rate loans, interest rate risk may be reduced but will not be eliminated. While floating rate loans are normally secured by specific collateral or assets of the issuer (so that holders of the loans, such as the underlying fund, will have a priority claim on those assets in the event of default or bankruptcy of the issuer), the value of collateral may be insufficient to meet the issuer’s obligations, and the underlying fund’s access to collateral may be limited by bankruptcy or other insolvency laws. The settlement period (the period
between the execution of the trade and the delivery of cash to the purchaser) for floating rate loan transactions is typically longer than seven days, and it is possible that sale proceeds from floating rate loan transactions will not be available to meet redemption obligations.
Portfolio turnover rate risk. From time to time an underlying fund may engage in frequent trading. Funds with high turnover may be more likely to realize capital gains that must be distributed to shareholders as taxable income. High turnover may also cause a fund to pay more brokerage commissions and to incur other transaction costs (including imputed transaction costs), which may detract from performance. A fund’s portfolio turnover rate and the amount of brokerage commissions it pays and transaction costs it incurs will vary over time based on market conditions.
Management and operational risk. There is no guarantee that the investment techniques, analyses, or judgments that Franklin Advisers, Putnam Management or PanAgora, as applicable, applies in making investment decisions for the underlying funds will produce the intended outcome or that the investments they select for the underlying funds will perform as well as other securities that were not selected for the underlying funds. Franklin Advisers, Putnam Management, PanAgora, or the underlying funds’ other service providers, may experience disruptions or operating errors that could negatively impact the underlying funds.
Risks Related to Investing in ETFs
As ETFs, shares of the underlying funds are traded in the secondary market. Prior to trading in the secondary market, shares of the underlying funds are “created” at NAV by market makers, large investors and institutions (collectively, “authorized participants”) only in creation units. A creation transaction generally takes place when an authorized participant deposits into an underlying fund a designated portfolio of securities, assets or other positions (a “creation basket”), and an amount of cash (including any cash representing the value of substituted securities, assets or other positions), if any, in exchange for a specified number of creation units. Similarly, shares of an underlying fund can be redeemed only in creation units, generally for a designated portfolio of securities, assets or other positions held by the underlying fund and an amount of cash (including any portion of such securities for which cash may be substituted), if any.
Fluctuation of net asset value (“NAV”) and share price risk. Shares of the underlying funds may trade at a larger premium or discount to their NAV than shares of other ETFs. The NAV of an underlying fund will generally fluctuate with changes in the market value of the underlying fund’s holdings. Underlying fund shares can be bought and sold in the secondary market at market prices. Disruptions to creations and redemptions, the existence of extreme market volatility or potential lack of an active trading market for an underlying fund’s shares may result in the underlying fund’s shares trading significantly above (at a premium) or below (at a discount) to NAV or to the intraday value of the underlying fund’s holdings. In addition, in stressed market conditions or periods of market disruption or volatility, the market for shares of the
underlying funds may become less liquid in response to deteriorating liquidity in the markets for the underlying funds’ portfolio holdings.
Authorized participant concentration risk. Only an authorized participant may engage in creation and redemption transactions directly with an underlying fund. Your fund is not an authorized participant and can only purchase and sell underlying fund shares in the secondary market at market prices or through an authorized participant. The underlying fund may have a limited number of financial institutions that act as authorized participants, none of which are obligated to engage in creation and/or redemption transactions. To the extent that those authorized participants do not engage in creation and redemption orders, there may be a significantly diminished trading market for underlying fund shares, or underlying fund shares may trade at a discount (or premium) to NAV and possibly face trading halts and/or de-listing.
Trading issues risk. The underlying funds have a limited public trading history. Sustainable Leaders ETF and Sustainable Future ETF began trading publicly in May 2021, while PanAgora International Equity ETF, PanAgora Emerging Markets Equity ETF, Core Bond ETF, High Yield ETF, and Ultra Short ETF began trading publicly in January 2023. There can be no assurance that an active trading market will develop or be maintained or that the market for underlying fund shares will operate as intended, which could lead to the underlying funds’ shares trading at wider spreads and larger premiums and discounts to NAV than other actively managed ETFs. As a result, it may cost the fund more to trade underlying fund shares than shares of other ETFs. There is no guarantee that the underlying fund will be able to attract market makers and authorized participants. Market makers and authorized participants are not obligated to make a market in the underlying fund’s shares or to submit purchase and redemption orders for creation units.
The market prices of an underlying fund’s shares are expected to fluctuate, in some cases materially, in response to changes in the underlying fund’s NAV, the intraday value of the underlying fund’s holdings and supply and demand for the underlying fund’s shares. Each underlying fund’s respective investment manager cannot predict whether an underlying fund’s shares will trade above, below or at their NAV or the intraday value of the underlying fund’s holdings. During periods when an underlying fund is trading below its NAV, the fund may incur significant losses if it sells its underlying fund shares.
The securities held by an underlying fund may be traded in markets that close at a different time than the exchange on which the underlying fund’s shares are listed. Liquidity in those securities may be reduced after the applicable closing times. Accordingly, during the time when the exchange is open but after the applicable market closing, fixing or settlement times, bid-ask spreads on the exchange and the corresponding premium or discount to the NAV of the underlying funds’ shares may widen.
Large shareholder risk. Each underlying fund may be an investment option for mutual funds that are managed by Franklin Resources, Inc. (“Franklin Templeton”) and its affiliates as “funds of funds.” Additionally, other investors from time to time may make substantial investments in an underlying fund, including affiliates of Franklin Templeton, through seed capital arrangements. Such shareholders may at times be considered to control an underlying fund. Dispositions of a large number of shares by these shareholders may adversely affect an underlying fund’s liquidity and net assets to the extent such transactions are executed directly with the underlying fund in the form of redemptions through an authorized participant, rather than executed in the secondary market. These redemptions may also force an underlying fund to sell securities, which may increase the underlying fund’s brokerage costs. In addition, underlying fund returns may be adversely affected if an underlying fund holds a portion of its assets in liquid, cash-like investments in connection with or in anticipation of shareholder redemptions. To the extent these large shareholders transact in shares of an underlying fund on the secondary market, such transactions may account for a large percentage of the trading volume on the exchange and may, therefore, have a material effect (upward or downward) on the market price of the underlying fund’s shares.
Cash transactions risk. Some of the underlying funds may effect creations and redemptions in cash or partially in cash. Therefore, an underlying fund may be required to sell portfolio securities, incur transaction costs, and subsequently recognize gains on such sales that the underlying fund might not have recognized if it were to distribute portfolio securities in-kind. As such, investments by a fund in an underlying fund’s shares may be less tax-efficient than an investment in an ETF that distributes portfolio securities entirely in-kind. An underlying fund may also incur transaction costs in connection with creations effected in cash (in whole or in part).
Semi-transparent ETF risk. (For Sustainable Leaders ETF and Sustainable Future ETF) Two of the underlying funds, Putnam Sustainable Leaders ETF and Putnam Sustainable Future ETF (the “Semi-Transparent ETFs”), are different from traditional ETFs, including the other underlying funds. Traditional ETFs disclose to the public what assets they hold each day. However, the Semi-Transparent ETFs do not. This may create additional risks for an investment in the Semi-Transparent ETFs, including that an investor may have to pay more money to trade the Semi-Transparent ETF’s shares in light of the fact that the Semi-Transparent ETF will provide less information to traders, who tend to charge more for trades when they have less information. The price an investor pays to buy or sell an ETF’s shares on an exchange may not match the value of the ETF’s portfolio, and these price differences may be greater for the Semi-Transparent ETFs compared to other ETFs because they provide less information to traders. These additional risks may be even greater in adverse or uncertain market conditions.
The differences between the Semi-Transparent ETFs and other ETFs may also have advantages. By keeping certain information about the Semi-Transparent ETFs secret, a Semi-Transparent ETF may face less risk that other traders can predict or copy its investment strategy. This may improve the Semi-Transparent ETF’s performance.
If other traders are able to copy or predict the Semi-Transparent ETF’s investment strategy, however, this may hurt the Semi-Transparent ETF’s performance.
Tracking basket structure risk. (For Sustainable Leaders ETF and Sustainable Future ETF) The Semi-Transparent ETFs are actively managed ETFs that operate pursuant to an exemptive order from the Securities and Exchange Commission and do not publicly disclose their complete portfolio holdings each business day. Instead, each Semi-Transparent ETF publishes each business day on its website a “Tracking Basket,” which is designed to closely track the daily performance of the Semi-Transparent ETF but is not the Semi-Transparent ETF’s actual portfolio. The Tracking Basket is comprised of: (1) select recently disclosed portfolio holdings and/or select securities from the universe from which the Semi-Transparent ETF’s investments are selected (“Strategy Components”); (2) liquid ETFs that convey information about the types of instruments (that are not otherwise fully represented by the Strategy Components) in which the Semi-Transparent ETF invests; and (3) cash and cash equivalents.
A Semi-Transparent ETF’s Tracking Basket structure may affect the price at which shares of the Semi-Transparent ETF trade in the secondary market. Although the Tracking Basket is intended to provide investors with enough information to allow for an effective arbitrage mechanism that will keep the market price of each Semi-Transparent ETF at or close to its NAV per share, there is a risk that market prices will vary significantly from NAV. The Semi-Transparent ETFs, which trade on the basis of a published Tracking Basket, may trade at a wider bid/ask spread than ETFs that publish their portfolios on a daily basis, and therefore, may cost investors more to trade. These risks may increase during periods of market disruption or volatility. In addition, although each Semi-Transparent ETF seeks to benefit from keeping its portfolio information secret, market participants may attempt to use the Tracking Basket to identify the Semi-Transparent ETF’s trading strategy. If successful, this could result in such market participants engaging in certain predatory trading practices that may have the potential to harm the Semi-Transparent ETF and its shareholders, such as front running the Semi-Transparent ETF’s trades of portfolio securities.
Arbitrage risk. (For Sustainable Leaders ETF and Sustainable Future ETF) Unlike ETFs that publicly disclose their complete portfolio holdings each business day, each Semi-Transparent ETF provides certain other information intended to allow market participants to estimate the value of positions in the Semi-Transparent ETF’s shares. Although this information is designed to facilitate arbitrage opportunities in the Semi-Transparent ETF’s shares to reduce bid/ask spreads and minimize discounts or premiums between the market price and NAV of the Semi-Transparent ETF shares, there is no guarantee the Semi-Transparent ETF’s arbitrage mechanism will operate as intended and that the Semi-Transparent ETF will not experience wide bid/ask spreads and/or large discounts or premiums to NAV. In addition, market participants may attempt to use the disclosed information to “reverse engineer” the Semi-Transparent ETF’s trading strategy, which, if successful, could increase opportunities for predatory trading practices that may have the potential to negatively impact the Semi-Transparent ETF’s performance.
Trading halt risk. (For Sustainable Leaders ETF and Sustainable Future ETF) There may be circumstances where a security held in a Semi-Transparent ETF’s portfolio but not in the Tracking Basket does not have readily available market quotations. If Putnam Management determines that such circumstance may affect the reliability of the Tracking Basket as an arbitrage vehicle, that information, along with the identity and weighting of that security in the Semi-Transparent ETF’s portfolio, will be publicly disclosed on the Semi-Transparent ETF’s website, and Putnam Management will assess appropriate remedial measures. In these circumstances, market participants may use this information to engage in certain predatory trading practices that may have the potential to harm the Semi-Transparent ETF and its shareholders. In addition, if securities representing 10% or more of the Semi-Transparent ETF’s portfolio do not have readily available market quotations, Putnam Management would promptly request the exchange to halt trading of the Semi-Transparent ETF, meaning that investors (including the fund) would not be able to trade their shares. Trading may also be halted in other circumstances, for example, due to market conditions.
The fund may not achieve its goal, and it is not intended to be a complete investment program. An investment in the fund is not insured or guaranteed by the Federal Deposit Insurance Corporation or any other government agency.
The performance information below gives some indication of the risks associated with an investment in the fund by showing the fund’s performance year to year and over time. Before February 10, 2023, the fund was managed with a materially different investment strategy and may have achieved materially different performance results under its current investment strategy from that shown for periods before this date. The bar chart does not reflect the impact of sales charges. If it did, performance would be lower. Please remember that past performance is not necessarily an indication of future results. Monthly performance figures for the fund are available at www.franklintempleton.com.
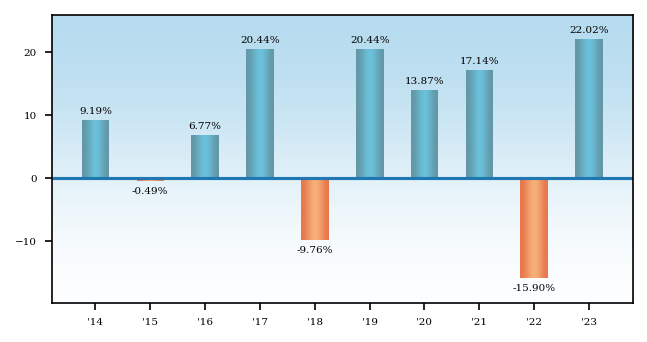
Average Annual Total Returns - Putnam Sustainable Retirement 2055 Fund |
1 Year |
5 Years |
10 Years |
|
|---|---|---|---|---|
| Class A 2055 | 15.01% | 9.21% | 6.96% | |
| Class A 2055 | After Taxes on Distributions | 14.48% | 7.46% | 4.81% | |
| Class A 2055 | After Taxes on Distributions and Sales | 9.01% | 6.90% | 4.81% | |
| Class C 2055 | 19.97% | 9.69% | 6.94% | |
| Class R 2055 | 21.44% | 10.14% | 7.28% | |
| Class R3 2055 | [1] | 21.73% | 10.39% | 7.50% |
| Class R4 2055 | [2] | 22.12% | 10.67% | 7.78% |
| Class R5 2055 | [3] | 22.26% | 10.83% | 7.91% |
| Class R6 2055 | [4] | 22.46% | 10.91% | 7.95% |
| Class Y 2055 | 22.31% | 10.79% | 7.86% | |
| Russell 3000® Index (no deduction for fees, expenses or taxes) | [5] | 25.96% | 15.16% | 11.48% |
| Bloomberg U.S. Aggregate Bond Index (no deduction for fees, expenses or taxes) | [5] | 5.53% | 1.10% | 1.81% |
| S&P Target Date To 2055 Index (no deduction for fees, expenses or taxes) | [5] | 20.21% | 10.70% | 7.67% |
| [1] | Performance for class R3 shares prior to their inception (1/4/21) is derived from the historical performance of class Y shares, adjusted for the higher 12b-1 fees and investor servicing fees applicable to class R3 shares (relative to the comparable fees applicable to class Y shares prior to the inception of class R3 shares). |
| [2] | Performance for class R4 shares prior to their inception (1/4/21) is derived from the historical performance of class Y shares, adjusted for the higher investor servicing fees applicable to class R4 shares (relative to the comparable fees applicable to class Y shares prior to the inception of class R4 shares). |
| [3] | Performance for class R5 shares prior to their inception (1/4/21) is derived from the historical performance of class R6 shares and has not been adjusted for the lower fund expenses applicable to class R5 shares (relative to the comparable expenses applicable to R6 shares prior to the inception of class R5 shares); had it, returns would have been higher. |
| [4] | Performance for class R6 shares prior to their inception (9/1/16) is derived from the historical performance of class Y shares and has not been adjusted for the lower investor servicing fees applicable to class R6 shares (relative to the comparable fees applicable to class Y shares prior to the inception of class R6 shares); had it, returns would have been higher. |
| [5] | The table above compares the fund’s returns to the performance of three indexes: (i) the Russell 3000® Index, a broad measure of market performance, (ii) the Bloomberg U.S. Aggregate Bond Index, a broad measure of market performance, and (iii) the S&P Target Date To 2055 Index, an additional index that the Investment Manager believes more closely reflects the fund’s principal investment objective and strategies. |
| Class C share performance reflects conversion to class A shares after eight years. |
| After-tax returns reflect the historical highest individual federal marginal income tax rates and do not reflect state and local taxes. Actual after-tax returns depend on an investor’s tax situation and may differ from those shown. After-tax returns are shown for class A shares only and will vary for other classes. These after-tax returns do not apply if you hold your fund shares through a 401(k) plan, an IRA, or another tax-advantaged arrangement. |
| The Russell 3000® Index measures the performance of the 3,000 largest U.S. companies based on total market capitalization. Source: FTSE. |
| Frank Russell Company is the source and owner of the trademarks, service marks and copyrights related to the Russell Indexes. Russell ® is a trademark of Frank Russell Company. |
| The Bloomberg U.S. Aggregate Bond Index is an unmanaged index of U.S. investment-grade fixed income securities. |
| All Bloomberg indices are provided by Bloomberg Index Services Limited. |
| BLOOMBERG® is a trademark and service mark of Bloomberg Finance L.P. and its affiliates (collectively “Bloomberg”). Bloomberg or Bloomberg’s licensors own all proprietary rights in the Bloomberg Indices. Neither Bloomberg nor Bloomberg’s licensors approve or endorse this material, or guarantees the accuracy or completeness of any information herein, or makes any warranty, express or implied, as to the results to be obtained therefrom, and to the maximum extent allowed by law, neither shall have any liability or responsibility for injury or damages arising in connection therewith. |
| The S&P Target Date To Index Series is designed to represent a small, style-specific derived consensus of asset class exposure and glide path for a specified list of target retirement dates. |
| Securities in the fund do not match those in the indexes and the performance of the fund will differ. |
Putnam Sustainable Retirement 2050 Fund seeks capital appreciation and current income consistent with a decreasing emphasis on capital appreciation and an increasing emphasis on current income as it approaches its target date.
The following tables describe the fees and expenses you may pay if you buy, hold, and sell shares of the fund. You may pay other fees, such as brokerage commissions and other fees to financial intermediaries, which are not reflected in the tables and examples below. You may qualify for sales charge discounts if you and your family invest, or agree to invest in the future, at least $50,000 in Putnam funds. More information about these and other discounts is available from your financial professional and in How do I buy fund shares? beginning on page 227 of the fund’s prospectus, in the Appendix to the fund’s prospectus, and in How to buy shares beginning on page II-3 of the fund’s statement of additional information (“SAI”).
Shareholder Fees - Putnam Sustainable Retirement 2050 Fund |
Class A 2050 |
Class C 2050 |
Class R 2050 |
Class R3 2050 |
Class R4 2050 |
Class R5 2050 |
Class R6 2050 |
Class Y 2050 |
||
|---|---|---|---|---|---|---|---|---|---|---|
| Maximum Sales Charge Imposed on Purchases (as a percentage of Offering Price) | 5.75% | none | none | none | none | none | none | none | ||
| Maximum Deferred Sales Charge (as a percentage) | 1.00% | [1] | 1.00% | [2] | none | none | none | none | none | none |
| [1] | Applies only to certain redemptions of shares bought with no initial sales charge. |
| [2] | This charge is eliminated after one year. |
Annual Fund Operating Expenses - Putnam Sustainable Retirement 2050 Fund |
Class A 2050 |
Class C 2050 |
Class R 2050 |
Class R3 2050 |
Class R4 2050 |
Class R5 2050 |
Class R6 2050 |
Class Y 2050 |
|
|---|---|---|---|---|---|---|---|---|---|
| Management Fees (as a percentage of Assets) | 0.52% | 0.52% | 0.52% | 0.52% | 0.52% | 0.52% | 0.52% | 0.52% | |
| Distribution and Service (12b-1) Fees | 0.25% | 1.00% | 0.50% | 0.25% | none | none | none | none | |
| Other Expenses (as a percentage of Assets): | 0.23% | 0.23% | 0.38% | 0.38% | 0.38% | 0.23% | 0.13% | 0.23% | |
| Acquired Fund Fees and Expenses | 0.55% | 0.55% | 0.55% | 0.55% | 0.55% | 0.55% | 0.55% | 0.55% | |
| Expenses (as a percentage of Assets) | 1.55% | 2.30% | 1.95% | 1.70% | 1.45% | 1.30% | 1.20% | 1.30% | |
| Fee Waiver or Reimbursement | [1] | (0.70%) | (0.70%) | (0.70%) | (0.70%) | (0.70%) | (0.70%) | (0.70%) | (0.70%) |
| Net Expenses (as a percentage of Assets) | 0.85% | 1.60% | 1.25% | 1.00% | 0.75% | 0.60% | 0.50% | 0.60% | |
| [1] | Reflects a contractual obligation of the Investment Manager to limit certain fund expenses through November 30, 2027. This obligation may be modified or discontinued only with approval of the Board of Trustees. |
The following hypothetical example is intended to help you compare the cost of investing in the fund with the cost of investing in other funds. It assumes that you invest $10,000 in the fund for the time periods indicated and then, except as indicated, redeem all your shares at the end of those periods. It assumes a 5% return on your investment each year and that the fund’s operating expenses remain the same. Only the first three years of each period in the example take into account the expense reimbursement described above. Your actual costs may be higher or lower.
Expense Example - Putnam Sustainable Retirement 2050 Fund - USD ($) |
Expense Example, with Redemption, 1 Year |
Expense Example, with Redemption, 3 Years |
Expense Example, with Redemption, 5 Years |
Expense Example, with Redemption, 10 Years |
Expense Example, No Redemption, 1 Year |
Expense Example, No Redemption, 3 Years |
Expense Example, No Redemption, 5 Years |
Expense Example, No Redemption, 10 Years |
|---|---|---|---|---|---|---|---|---|
| Class A 2050 | 657 | 831 | 1,172 | 2,135 | ||||
| Class C 2050 | 263 | 505 | 1,027 | 2,270 | 163 | 505 | 1,027 | 2,270 |
| Class R 2050 | 127 | 397 | 845 | 2,093 | ||||
| Class R3 2050 | 102 | 318 | 714 | 1,821 | ||||
| Class R4 2050 | 77 | 240 | 580 | 1,542 | ||||
| Class R5 2050 | 61 | 192 | 499 | 1,371 | ||||
| Class R6 2050 | 51 | 160 | 445 | 1,256 | ||||
| Class Y 2050 | 61 | 192 | 499 | 1,371 |
The fund pays transaction-related costs, such as commissions, when it buys and sells securities (or “turns over” its portfolio). A higher turnover rate may indicate higher transaction costs and may result in higher taxes when the fund’s shares are held in a taxable account. These costs, which are not reflected in annual fund operating expenses or the above example, affect fund performance. The fund’s turnover rate in the most recent fiscal year was 17%.
Investments
The fund is one of a series of target date funds that invest primarily in exchange-traded funds (“ETFs”) that focus on investments with positive sustainability or environmental, social, and governance (“ESG”) characteristics, referred to as underlying funds. The underlying funds include funds managed by Franklin Advisers, Inc. (“Franklin Advisers” or the “Investment Manager”), the fund’s investment manager, and funds managed by affiliated investment advisers. The fund’s asset allocation strategy may be attractive to investors who plan to retire or otherwise intend to begin making periodic withdrawals of their investments in or about 2050 (the target date). The fund is designed to provide diversification among different asset classes by investing its assets in the underlying funds.
Under normal circumstances, the fund will invest in underlying funds (which, for purposes of this policy, include money market mutual funds advised by the Investment Manager or its affiliates) such that, in the aggregate, it has indirect exposure to investments that meet each underlying fund’s respective sustainability or ESG criteria and that represent at least 80% of the value of its net assets. This policy is non-fundamental and may be changed only after 60 days’ notice to shareholders. The Investment Manager may not apply ESG or sustainability criteria to investments that are not subject to the fund’s 80% policy, and such investments may not meet the applicable ESG or sustainability criteria. Through its investments in underlying funds, the fund makes use of a range of ESG- and sustainability- oriented investment strategies and invests across a variety of asset classes. The ESG or sustainability criteria will differ across the underlying funds. These differences may arise both from differences in the underlying funds’ asset classes (such as the characteristics of non-U.S. versus U.S. issuers, or the structural differences (e.g., position in the capital structure) between equity and fixed-income investments) as well as from different managers’ styles. In implementing an underlying fund’s investment strategy, the portfolio managers of the underlying fund may apply and weigh different ESG criteria differently than the portfolio managers of the other underlying funds. There are also expected to be differences in how the portfolio managers of the underlying funds source ESG-related or sustainability-oriented research (e.g., proprietary versus third-party research) and/or their approach to selecting companies based on ESG or sustainability criteria.
The fund’s target allocations among asset classes and underlying funds will increasingly emphasize capital preservation and income over time and will change gradually based on the number of remaining years until the fund’s target date, as shown in the predetermined “glide path” in the chart under “What are the funds’ and each underlying fund’s main investment strategies and related risks?” The Investment Manager adjusts these allocations at the end of each calendar quarter based on the glide path.
Pending investment in underlying funds, the fund also expects to temporarily invest cash balances resulting from purchase activity by fund shareholders in Putnam Government Money Market Fund, a mutual fund sponsored by the Investment Manager, or in cash or cash equivalents. The fund also expects to invest a portion of its assets in Putnam Government Money Market Fund or in cash or cash equivalents in order to manage shareholder redemptions. The percentage of a fund invested in Putnam Government Money Market Fund is expected to vary over time and will depend on the level of purchase and redemption activity by fund shareholders.
The following table presents your fund’s approximate allocations to each asset class and underlying fund as of September 30, 2024 (taking into account any tactical adjustments described below) and its projected approximate allocations to those asset classes and underlying funds as of September 30, 2025. The table does not reflect temporary investments in Putnam Government Money Market Fund or in cash or cash equivalents. By comparing the percentage allocations of your fund in the table, you can see how its allocations are expected to change during the one-year period beginning on September 30, 2024. The table also shows the approximate allocations of other Putnam Sustainable Retirement Funds, which are designed for investors with different target retirement dates. Over a five-year period, each fund’s allocations will gradually change to resemble the allocations of the fund with the next earliest target date. The table illustrates how a fund’s allocations are expected to change over time to increasingly emphasize capital preservation and income.
| Underlying Fund* | Year | 2065 | 2060 | 2055 | 2050 (your fund) | 2045 | 2040 | 2035 | 2030 | 2025 | Maturity Fund |
| Putnam Sustainable Leaders ETF | 2024 | 48.6% | 47.2% | 44.8% | 42.3% | 39.7% | 36.4% | 31.7% | 21.0% | 14.9% | 14.1% |
| 2025 | 47.6% | 45.8% | 43.3% | 40.7% | 38.4% | 35.2% | 30.3% | 18.6% | 14.3% | 14.1% | |
| Putnam Sustainable Future ETF | 2024 | 23.8% | 23.1% | 21.9% | 20.6% | 19.4% | 17.9% | 15.8% | 10.5% | 7.5% | 7.1% |
| 2025 | 23.8% | 22.9% | 21.7% | 20.4% | 19.2% | 17.6% | 15.2% | 9.3% | 7.1% | 7.1% | |
| Putnam PanAgora ESG Inter-national Equity ETF | 2024 |
17.8% | 17.3% | 16.4% | 15.5% | 14.4% | 12.4% | 9.6% | 6.3% | 4.5% | 4.2% |
| 2025 | 17.8% | 17.2% | 16.2% | 15.3% | 14.2% | 11.9% | 9.1% | 5.6% | 4.3% | 4.2% | |
| Putnam PanAgora ESG Emer-ging Markets Equity ETF | 2024 |
4.9% | 4.8% | 4.5% | 4.2% | 3.8% | 2.2% | 0.1% | 0.0% | 0.0% | 0.0% |
| 2025 | 5.9% | 5.7% | 5.4% | 5.1% | 4.5% | 2.2% | 0.0% | 0.0% | 0.0% | 0.0% | |
| Putnam ESG Core Bond ETF | 2024 | 3.3% | 5.3% | 8.9% | 12.4% | 15.4% | 23.0% | 33.5% | 49.7% | 52.3% | 51.7% |
| 2025 | 3.3% | 5.9% | 9.7% | 13.0% | 16.1% | 24.8% | 35.4% | 53.4% | 51.8% | 51.7% | |
| Putnam ESG High Yield ETF | 2024 | 1.1% | 1.8% | 3.0% | 4.1% | 4.9% | 4.8% | 4.9% | 6.7% | 14.8% | 16.9% |
| 2025 | 1.1% | 2.0% | 3.2% | 4.3% | 4.9% | 4.8% | 5.3% | 7.1% | 16.5% | 16.9% | |
| Putnam ESG Ultra Short ETF | 2024 | 0.5% | 0.5% | 0.5% | 0.9% | 2.4% | 3.3% | 4.4% | 5.8% | 6.0% | 6.0% |
| 2025 | 0.5% | 0.5% | 0.5% | 1.2% | 2.7% | 3.5% | 4.7% | 6.0% | 6.0% | 6.0% | |
| Total Equity** | 2024 | 95.1% | 92.4% | 87.6% | 82.6% | 77.3% | 68.9% | 57.2% | 37.8% | 26.9% | 25.4% |
| 2025 | 95.1% | 91.6% | 86.6% | 81.5% | 76.3% | 66.9% | 54.6% | 33.5% | 25.7% | 25.4% | |
| Total Fixed Income** | 2024 | 4.9% | 7.6% | 12.4% | 17.4% | 22.7% | 31.1% | 42.8% | 62.2% | 73.1% | 74.6% |
| 2025 | 4.9% | 8.4% | 13.4% | 18.5% | 23.7% | 33.1% | 45.4% | 66.5% | 74.3% | 74.6% |
| * | Due to rounding, allocations shown in the table above may not total 100%. In addition, because of rounding in the calculation of allocations among underlying funds and market fluctuations, actual allocations might be more or less than these percentages. |
| ** | Equity and fixed-income allocations are hypothetical estimates based on an assumption that each of Putnam Sustainable Leaders ETF, Putnam Sustainable Future ETF, Putnam PanAgora ESG International Equity ETF, and Putnam PanAgora ESG Emerging Markets Equity ETF is equivalent to an equity investment and each of Putnam ESG Core Bond ETF, Putnam ESG High Yield ETF and Putnam ESG Ultra Short ETF is equivalent to a fixed-income investment. Actual allocations will vary. |
The fund’s target allocations may differ from the allocations shown in the table. The Investment Manager may change the glide path, the fund’s target allocations, and the underlying funds in which it invests at any time, although the Investment Manager generally expects these changes (other than the tactical adjustments described below) to be infrequent and generally in response to longer-term structural changes (e.g., in the average retirement age or life expectancy) that lead the fund’s portfolio managers to determine that a change is advisable. The Investment Manager may also make tactical adjustments from time to time in the fund’s allocations to underlying funds in response to market conditions within a range of +/- 15% from the allocations to fixed-income and equity asset classes as presented in the fund’s glide path.
It is assumed that investors will begin gradual withdrawals from the fund at around the target date. Near the end of the target date year, the fund’s target allocations will correspond to those of Putnam Sustainable Retirement Maturity Fund (“Maturity Fund”), a fund that seeks as high a rate of current income as the Investment Manager believes is consistent with preservation of capital, and the fund will be merged into Maturity Fund. More information about Maturity Fund is available in the prospectus beginning on page 171, and more information about the underlying funds (which are not offered by this prospectus) is included below and under “What are the funds’ and each underlying fund’s main investment strategies and related risks?”
Information about each underlying fund’s investment strategy
Putnam Sustainable Leaders ETF (“Sustainable Leaders ETF”)
Sustainable Leaders ETF invests mainly in common stocks of U.S. companies of any size, with a focus on companies that Putnam Investment Management, LLC (“Putnam Management”), Sustainable Leaders ETF’s investment manager, believes exhibit a commitment to financially material sustainable business practices. Sustainable Leaders ETF may also invest in non-U.S. companies. In evaluating investments for Sustainable Leaders ETF, Putnam Management views “financially material sustainable business practices” as business practices that it believes are reasonably likely to impact the financial condition or operating performance of a company and that relate to environmental, social, or corporate governance issues.
Under normal circumstances, Sustainable Leaders ETF invests at least 80% of the value of its net assets in securities that meet Putnam Management’s sustainability criteria. For a further discussion of Sustainable Leaders ETF’s investment strategy, please turn to the section What are the funds’ and each underlying fund’s main investment strategies and related risks? beginning on page 189.
Putnam Sustainable Future ETF (“Sustainable Future ETF”)
Sustainable Future ETF invests mainly in common stocks of U.S. companies of any size, with a focus on companies whose products and services Putnam Management, Sustainable Future ETF’s investment manager, believes provide solutions that directly contribute to sustainable social, environmental and economic development (Solutions Companies).
Under normal circumstances, Sustainable Future ETF invests at least 80% of the value of its net assets in securities that meet Putnam Management’s sustainability criteria. For a further discussion of Sustainable Future ETF’s investment strategy, please turn to the section What are the funds’ and each underlying fund’s main investment strategies and related risks? beginning on page 189.
Putnam PanAgora ESG International Equity ETF (“PanAgora International Equity ETF”)
PanAgora International Equity ETF invests mainly in common stocks (growth or value stocks or both) of companies of any size outside the United States with a focus on companies that PanAgora International Equity ETF’s subadviser, PanAgora Asset Management, Inc. (“PanAgora”), believes offer attractive benchmark-relative
returns and exhibit positive ESG metrics. Under normal circumstances, PanAgora International Equity ETF invests at least 80% of its net assets in equity securities of companies that meet PanAgora’s ESG criteria. For a further discussion of PanAgora International Equity ETF’s investment strategy, please turn to the section What are the funds’ and each underlying fund’s main investment strategies and related risks? beginning on page 189.
Putnam PanAgora ESG Emerging Markets Equity ETF (“PanAgora Emerging Markets Equity ETF”)
PanAgora Emerging Markets Equity ETF invests mainly in common stocks (growth or value stocks or both) of emerging markets companies of any size with a focus on companies that PanAgora Emerging Markets Equity ETF’s subadviser, PanAgora, believes offer attractive benchmark-relative returns and exhibit positive ESG metrics. Under normal circumstances, PanAgora Emerging Markets Equity ETF invests at least 80% of its net assets in equity securities of emerging markets companies that meet PanAgora’s ESG criteria. For a further discussion of PanAgora Emerging Markets Equity ETF’s investment strategy, please turn to the section What are the funds’ and each underlying fund’s main investment strategies and related risks? beginning on page 189.
Putnam ESG Core Bond ETF (“Core Bond ETF”)
Core Bond ETF invests mainly in a diversified portfolio of investment-grade fixed-income securities with a focus on companies or issuers that Franklin Advisers, Core Bond ETF’s investment manager, believes meet relevant ESG criteria on a sector-specific basis. Under normal circumstances, Core Bond ETF invests at least 80% of the value of its net assets in fixed-income securities that meet Franklin Advisers’ ESG criteria. For a further discussion of Core Bond ETF’s investment strategy, please turn to the section What are the funds’ and each underlying fund’s main investment strategies and related risks? beginning on page 189.
Putnam ESG High Yield ETF (“High Yield ETF”)
High Yield ETF invests mainly in bonds that are below investment grade in quality (sometimes referred to as “junk bonds”) with a focus on companies or issuers that Franklin Advisers, High Yield ETF’s investment manager, believes meet relevant ESG criteria on a sector-specific basis. High Yield ETF invests mainly in bonds that also have one or more of the following characteristics: (1) are obligations of U.S. companies or issuers and (2) have intermediate- to long-term maturities (three years or longer). Under normal circumstances, High Yield ETF invests at least 80% of the value of its net assets in fixed-income securities rated below investment grade that meet Franklin Advisers’ ESG criteria. For a further discussion of High Yield ETF’s investment strategy, please turn to the section What are the funds’ and each underlying fund’s main investment strategies and related risks? beginning on page 189.
Putnam ESG Ultra Short ETF (“Ultra Short ETF”)
Ultra Short ETF invests in a diversified short duration portfolio of fixed-income securities comprised of investment-grade money market and other fixed-income securities, including U.S. dollar-denominated foreign securities of these types, with a focus on companies or issuers that Franklin Advisers, Ultra Short ETF’s investment manager, believes meet relevant ESG criteria, on a sector-specific basis. Under normal circumstances, Ultra Short ETF invests at least 80% of the value of its net assets in fixed-income securities that meet Franklin Advisers’ ESG criteria. For a further discussion of Ultra Short ETF’s investment strategy, please turn to the section What are the funds’ and each underlying fund’s main investment strategies and related risks? beginning on page 189.
It is important to understand that you can lose money by investing in the fund. Losses may occur near, at or after the target date. There is no guarantee that the fund will provide adequate income at and through an investor’s retirement.
The fund’s allocation of assets among asset classes and the underlying funds may hurt performance. An underlying fund may change its investment program or policies without the fund’s approval, which could require the fund to reduce or eliminate its allocation to the underlying fund at an unfavorable time.
The fund invests in underlying funds and indirectly bears expenses related to the underlying funds. However, the Investment Manager has contractually agreed to waive fees, reimburse expenses of, or reimburse the fund through at least November 30, 2027 in an amount equal to the fund’s acquired fund fees and expenses (e.g., the fees and expenses incurred by the fund as a result of its investments in the underlying funds). The Investment Manager also has contractually agreed to waive fees and/or reimburse expenses of each class of shares of the fund through at least November 30, 2027 in an amount sufficient to result in total annual fund operating expenses for class A, C, R, R3, R4, R5, R6 and Y shares of the fund (exclusive of payments under the fund’s distribution plans, brokerage, interest, taxes, investment-related expenses, acquired fund fees and expenses, and extraordinary expenses) that equal 0.60%, 0.60%, 0.75%, 0.75%, 0.75%, 0.60%, 0.50%, and 0.60%, respectively, of the fund’s average net assets.
Pending investment in underlying funds, the fund also expects to temporarily invest cash balances resulting from purchase activity by fund shareholders in Putnam Government Money Market Fund, a money market mutual fund sponsored by the Investment Manager, or in cash or cash equivalents. In addition, the fund expects to invest a portion of its assets in Putnam Government Money Market Fund or in cash or cash equivalents in order to manage shareholder redemptions. Large positions in Putnam Government Money Market Fund or in cash or cash equivalents may dampen performance and may prevent the fund from achieving its goal. These practices may be subject to other risks, as described under Miscellaneous Investments, Investment Practices and Risks in the SAI.
The fund also bears the risks associated with the underlying funds identified below. The relative significance of these risks will vary over time based on the fund’s target allocations to the underlying funds and to equity and fixed-income asset classes, which may change from time to time as discussed above.
Investment Strategy-Related Risks of the Underlying Funds
Sustainability and ESG investing risk. Investing in underlying funds with an ESG or sustainability focus may result in the fund having exposure to underlying funds that invest in certain types of companies, issuers, industries or sectors that the market may not favor. In evaluating an investment opportunity for the underlying funds, Franklin Advisers, Putnam Management or PanAgora may make investment decisions without the availability of optimal ESG-related data (which may be even less available with securitized debt instruments) or based on information and data that is incomplete or inaccurate. Sustainability and ESG metrics are not uniformly defined, and applying such metrics involves subjective assessments. Sustainability and ESG scorings and assessments of issuers can vary across third-party data providers and may change over time. Franklin Advisers, Putnam Management and PanAgora do not rely exclusively on third-party data providers in evaluating sustainability and ESG criteria for the underlying funds. ESG information from third-party data providers may be incomplete, inaccurate or unavailable, particularly with respect to companies in emerging market countries, which may adversely impact the investment process. In addition, the business practices, products or services of issuers in which an underlying fund invests may change over time. As a result of these possibilities, among others, an underlying fund may temporarily hold securities that are inconsistent with the underlying fund’s ESG or sustainability investment criteria. Regulatory changes or interpretations regarding the definitions and/or use of ESG and/or sustainability criteria could have a material adverse effect on the underlying fund’s ability to invest in accordance with its investment policies and/or achieve its investment objective. The underlying funds do not restrict investments based solely on “negative screens”, and the underlying fixed-income funds do not restrict their fixed-income investments to “green bonds” (e.g., U.S. dollar-denominated bonds designated as “green” by the Climate Bonds Initiative). For the underlying funds that pursue fixed-income investment strategies, because fixed-income investments generally represent a promise to pay principal and interest by an issuer, and not an ownership interest, and may involve complex structures, ESG-related investment considerations may have a more limited impact on risk and return (or may have an impact over a different investment time horizon) relative to other asset classes, and this may be particularly true for shorter-term investments. In addition, holders of fixed-income investments do not typically have voting rights, unlike holders of equity investments who have the right to vote on issuer proposals.
Market risk. The value of investments in the underlying funds’ portfolios may fall or fail to rise over extended periods of time for a variety of reasons, including general economic, political or financial market conditions, investor sentiment and market perceptions, government actions, geopolitical events or changes, outbreaks of infectious illnesses or other widespread public health issues (including epidemics and
pandemics), and factors related to a specific issuer, geography, industry or sector. These and other factors may lead to increased volatility and reduced liquidity in the underlying funds’ portfolio holdings, may negatively impact the fund’s performance, and may exacerbate other risks to which the fund is subject.
Common stock risk. (For all underlying funds except Core Bond ETF, High Yield ETF and Ultra Short ETF) Common stock represents an ownership interest in a company. The value of a company’s stock may fall or fail to rise as a result of factors directly relating to that company, such as decisions made by its management or lower demand for the company’s products or services. A stock’s value may also fall because of factors affecting not just the company, but also other companies in the same industry or in a number of different industries, such as increases in production costs.
| Growth investing risk.. Growth stocks may be more susceptible to earnings disappointments, and the market may not favor growth-style investing. |
| Value investing risk. Value stocks may fail to rebound, and the market may not favor value-style investing. Companies whose stocks we believe are undervalued by the market may have experienced adverse business developments or may be subject to special risks that have caused their stocks to be out of favor. |
| Small and midsize companies risk. Stocks of small and midsize companies often trade in smaller volumes, and their prices may fluctuate more than stocks of larger companies. Stocks of these companies may therefore be more vulnerable to adverse developments than those of larger companies. |
Industry or sector concentration risk. (For all underlying funds except Core Bond ETF, High Yield ETF and Ultra Short ETF) From time to time, an underlying fund may invest a significant portion of its assets in companies in one or more related industries or sectors, which would make the underlying fund more vulnerable to adverse developments affecting those industries or sectors.
Model and data risk. (For all underlying funds except Sustainable Leaders ETF, Sustainable Future ETF and High Yield ETF) If the quantitative models or data that are used in managing an underlying fund prove to be incorrect or incomplete, investment decisions made in reliance on the models or data may not produce the desired results, and the underlying fund may realize losses. Additionally, market movements are likely to change the risk levels and risk allocations of the underlying fund. Investments made based on quantitative models may perform differently from the market as a whole.
Foreign investment risk. (For all underlying funds except Ultra Short ETF, Sustainable Leaders ETF and Sustainable Future ETF) The value of international investments traded in foreign currencies may be adversely impacted by fluctuations in exchange rates. International investments, particularly investments in emerging markets, may carry risks associated with potentially less stable economies or governments (such as the risk of seizure by a foreign government, the imposition of currency or other restrictions, or high levels of inflation), and may be or become
illiquid. There may be less publicly-available information, or less reliable publicly-available information, about foreign companies (including information related to companies’ ESG practices), particularly with respect to emerging market companies, than publicly-available information regarding U.S. companies. As a result, an underlying fund’s ability to evaluate a foreign company, including with respect to its ESG or sustainability practices, may be more limited than its ability to evaluate a U.S. company.
Geographic focus risk. (For PanAgora International Equity ETF and PanAgora Emerging Markets Equity ETF) From time to time, an underlying fund may invest a significant portion of its assets in companies in one or more related geographic regions, industries or sectors, such as European and Asian countries, which would make the fund more vulnerable to adverse developments affecting those geographic regions, industries or sectors, including political, economic, or other developments adversely impacting ESG or sustainable investing.
Fixed-income investments risk. (For Core Bond ETF, High Yield ETF and Ultra Short ETF) The risks associated with fixed-income investments include interest rate risk, which is the risk that the value of an underlying fund’s investments is likely to fall if interest rates rise. Fixed-income investments are also subject to credit risk, which is the risk that the issuer of a fixed-income investment may default on payment of interest or principal. Credit risk is generally greater for debt not backed by the full faith and credit of the U.S. government, and interest rate risk is generally greater for longer-term debt. Fixed-income investments may be more susceptible to downgrades or defaults during economic downturns or other periods of economic stress. Mortgage-backed investments, unlike traditional debt investments, are also subject to prepayment risk, which means that they may increase in value less than other bonds when interest rates decline and decline in value more than other bonds when interest rates rise. The underlying fund may have to invest the proceeds from prepaid investments, including mortgage-backed investments, in other investments with less attractive terms and yields. The underlying fund’s investments in mortgage-backed securities, and in certain other securities and derivatives, may be or become illiquid. The underlying fund’s investments in mortgage-backed securities may make the underlying fund’s net asset value more susceptible to economic, market, political and other developments affecting the residential and commercial real estate markets and the servicing of mortgage loans secured by real estate properties. During periods of difficult economic conditions, delinquencies and losses on commercial mortgage-backed investments in particular generally increase, including as a result of the effects of those conditions on commercial real estate markets, the ability of commercial tenants to make loan payments, and the ability of a property to attract and retain commercial tenants.
One of the underlying funds, Putnam High Yield ETF, invests mostly in higher-yield, higher-risk debt investments that are rated below BBB or its equivalent at the time of purchase by any nationally recognized securities rating agency rating such investments, or in unrated investments that Franklin Advisers believes are of comparable quality. The underlying fund may invest up to 15% of the underlying
fund’s total assets in debt investments rated below CCC or its equivalent, at the time of purchase, by each rating agency rating such investments, or in unrated investments that Franklin Advisers believes are of comparable quality. This includes investments in the lowest rating category of the rating agency. The underlying fund will not necessarily sell an investment if its rating is reduced after Franklin Advisers buys it. Investments rated below BBB or its equivalent are below-investment-grade in quality. This rating reflects a greater possibility that the issuers may be unable to make timely payments of interest and principal and thus default. If a default occurs, or is perceived as likely to occur, the value of the investment will usually be more volatile and is likely to fall. The value of a debt instrument may also be affected by changes in, or perceptions of, the financial condition of the issuer, borrower, counterparty, or other entity, or underlying collateral or assets, or changes in, or perceptions of, specific or general market, economic, industry, political, regulatory, geopolitical, environmental, public health, and other conditions. A default or expected default could also make it difficult for the underlying fund to sell the investment at a price approximating the value Franklin Advisers had previously placed on it. Lower-rated debt usually has a more limited market than higher-rated debt, which may at times make it difficult for the underlying fund to buy or sell certain debt instruments or to establish their fair values.
Derivatives risk. (For all underlying funds except PanAgora International Equity ETF, PanAgora Emerging Markets Equity ETF, Sustainable Leaders ETF and Sustainable Future ETF) An underlying fund’s use of derivatives may increase the risks of investing in the underlying fund by increasing investment exposure (which may be considered leverage) or, in the case of many over-the-counter instruments, because of the potential inability to terminate or sell derivatives positions and the potential failure of the other party to the instrument to meet its obligations. The risk of a party failing to meet its obligations may increase if the fund has significant investment exposure to that counterparty. The value of derivatives may move in unexpected ways due to unanticipated market movements, the use of leverage, imperfect correlation between the derivative instrument and the reference asset, or other factors, especially in unusual market conditions, and volatility in the value of derivatives could adversely impact the underlying fund’s returns, obligations and exposures. Derivatives are also subject to other risks, including liquidity risk (e.g., liquidity demands arising from the requirement to make payments to a derivative counterparty), operational risk (e.g., settlement issues or system failure), and legal risk (e.g., insufficient legal documentation or contract enforceability issues).
Floating rate obligations risk. (For Core Bond ETF, High Yield ETF and Ultra Short ETF) To the extent an underlying fund holds floating rate loans, interest rate risk may be reduced but will not be eliminated. While floating rate loans are normally secured by specific collateral or assets of the issuer (so that holders of the loans, such as the underlying fund, will have a priority claim on those assets in the event of default or bankruptcy of the issuer), the value of collateral may be insufficient to meet the issuer’s obligations, and the underlying fund’s access to collateral may be limited by bankruptcy or other insolvency laws. The settlement period (the period
between the execution of the trade and the delivery of cash to the purchaser) for floating rate loan transactions is typically longer than seven days, and it is possible that sale proceeds from floating rate loan transactions will not be available to meet redemption obligations.
Portfolio turnover rate risk. From time to time an underlying fund may engage in frequent trading. Funds with high turnover may be more likely to realize capital gains that must be distributed to shareholders as taxable income. High turnover may also cause a fund to pay more brokerage commissions and to incur other transaction costs (including imputed transaction costs), which may detract from performance. A fund’s portfolio turnover rate and the amount of brokerage commissions it pays and transaction costs it incurs will vary over time based on market conditions.
Management and operational risk. There is no guarantee that the investment techniques, analyses, or judgments that Franklin Advisers, Putnam Management or PanAgora, as applicable, applies in making investment decisions for the underlying funds will produce the intended outcome or that the investments they select for the underlying funds will perform as well as other securities that were not selected for the underlying funds. Franklin Advisers, Putnam Management, PanAgora, or the underlying funds’ other service providers, may experience disruptions or operating errors that could negatively impact the underlying funds.
Risks Related to Investing in ETFs
As ETFs, shares of the underlying funds are traded in the secondary market. Prior to trading in the secondary market, shares of the underlying funds are “created” at NAV by market makers, large investors and institutions (collectively, “authorized participants”) only in creation units. A creation transaction generally takes place when an authorized participant deposits into an underlying fund a designated portfolio of securities, assets or other positions (a “creation basket”), and an amount of cash (including any cash representing the value of substituted securities, assets or other positions), if any, in exchange for a specified number of creation units. Similarly, shares of an underlying fund can be redeemed only in creation units, generally for a designated portfolio of securities, assets or other positions held by the underlying fund and an amount of cash (including any portion of such securities for which cash may be substituted), if any.
Fluctuation of net asset value (“NAV”) and share price risk. Shares of the underlying funds may trade at a larger premium or discount to their NAV than shares of other ETFs. The NAV of an underlying fund will generally fluctuate with changes in the market value of the underlying fund’s holdings. Underlying fund shares can be bought and sold in the secondary market at market prices. Disruptions to creations and redemptions, the existence of extreme market volatility or potential lack of an active trading market for an underlying fund’s shares may result in the underlying fund’s shares trading significantly above (at a premium) or below (at a discount) to NAV or to the intraday value of the underlying fund’s holdings. In addition, in stressed market conditions or periods of market disruption or volatility, the market for shares of the
underlying funds may become less liquid in response to deteriorating liquidity in the markets for the underlying funds’ portfolio holdings.
Authorized participant concentration risk. Only an authorized participant may engage in creation and redemption transactions directly with an underlying fund. Your fund is not an authorized participant and can only purchase and sell underlying fund shares in the secondary market at market prices or through an authorized participant. The underlying fund may have a limited number of financial institutions that act as authorized participants, none of which are obligated to engage in creation and/or redemption transactions. To the extent that those authorized participants do not engage in creation and redemption orders, there may be a significantly diminished trading market for underlying fund shares, or underlying fund shares may trade at a discount (or premium) to NAV and possibly face trading halts and/or de-listing.
Trading issues risk. The underlying funds have a limited public trading history. Sustainable Leaders ETF and Sustainable Future ETF began trading publicly in May 2021, while PanAgora International Equity ETF, PanAgora Emerging Markets Equity ETF, Core Bond ETF, High Yield ETF, and Ultra Short ETF began trading publicly in January 2023. There can be no assurance that an active trading market will develop or be maintained or that the market for underlying fund shares will operate as intended, which could lead to the underlying funds’ shares trading at wider spreads and larger premiums and discounts to NAV than other actively managed ETFs. As a result, it may cost the fund more to trade underlying fund shares than shares of other ETFs. There is no guarantee that the underlying fund will be able to attract market makers and authorized participants. Market makers and authorized participants are not obligated to make a market in the underlying fund’s shares or to submit purchase and redemption orders for creation units.
The market prices of an underlying fund’s shares are expected to fluctuate, in some cases materially, in response to changes in the underlying fund’s NAV, the intraday value of the underlying fund’s holdings and supply and demand for the underlying fund’s shares. Each underlying fund’s respective investment manager cannot predict whether an underlying fund’s shares will trade above, below or at their NAV or the intraday value of the underlying fund’s holdings. During periods when an underlying fund is trading below its NAV, the fund may incur significant losses if it sells its underlying fund shares.
The securities held by an underlying fund may be traded in markets that close at a different time than the exchange on which the underlying fund’s shares are listed. Liquidity in those securities may be reduced after the applicable closing times. Accordingly, during the time when the exchange is open but after the applicable market closing, fixing or settlement times, bid-ask spreads on the exchange and the corresponding premium or discount to the NAV of the underlying funds’ shares may widen.
Large shareholder risk. Each underlying fund may be an investment option for mutual funds that are managed by Franklin Resources, Inc. (“Franklin Templeton”) and its affiliates as “funds of funds.” Additionally, other investors from time to time may make substantial investments in an underlying fund, including affiliates of Franklin Templeton, through seed capital arrangements. Such shareholders may at times be considered to control an underlying fund. Dispositions of a large number of shares by these shareholders may adversely affect an underlying fund’s liquidity and net assets to the extent such transactions are executed directly with the underlying fund in the form of redemptions through an authorized participant, rather than executed in the secondary market. These redemptions may also force an underlying fund to sell securities, which may increase the underlying fund’s brokerage costs. In addition, underlying fund returns may be adversely affected if an underlying fund holds a portion of its assets in liquid, cash-like investments in connection with or in anticipation of shareholder redemptions. To the extent these large shareholders transact in shares of an underlying fund on the secondary market, such transactions may account for a large percentage of the trading volume on the exchange and may, therefore, have a material effect (upward or downward) on the market price of the underlying fund’s shares.
Cash transactions risk. Some of the underlying funds may effect creations and redemptions in cash or partially in cash. Therefore, an underlying fund may be required to sell portfolio securities, incur transaction costs, and subsequently recognize gains on such sales that the underlying fund might not have recognized if it were to distribute portfolio securities in-kind. As such, investments by a fund in an underlying fund’s shares may be less tax-efficient than an investment in an ETF that distributes portfolio securities entirely in-kind. An underlying fund may also incur transaction costs in connection with creations effected in cash (in whole or in part).
Semi-transparent ETF risk. (For Sustainable Leaders ETF and Sustainable Future ETF) Two of the underlying funds, Putnam Sustainable Leaders ETF and Putnam Sustainable Future ETF (the “Semi-Transparent ETFs”), are different from traditional ETFs, including the other underlying funds. Traditional ETFs disclose to the public what assets they hold each day. However, the Semi-Transparent ETFs do not. This may create additional risks for an investment in the Semi-Transparent ETFs, including that an investor may have to pay more money to trade the Semi-Transparent ETF’s shares in light of the fact that the Semi-Transparent ETF will provide less information to traders, who tend to charge more for trades when they have less information. The price an investor pays to buy or sell an ETF’s shares on an exchange may not match the value of the ETF’s portfolio, and these price differences may be greater for the Semi-Transparent ETFs compared to other ETFs because they provide less information to traders. These additional risks may be even greater in adverse or uncertain market conditions.
The differences between the Semi-Transparent ETFs and other ETFs may also have advantages. By keeping certain information about the Semi-Transparent ETFs secret, a Semi-Transparent ETF may face less risk that other traders can predict or copy its investment strategy. This may improve the Semi-Transparent ETF’s performance.
If other traders are able to copy or predict the Semi-Transparent ETF’s investment strategy, however, this may hurt the Semi-Transparent ETF’s performance.
Tracking basket structure risk. (For Sustainable Leaders ETF and Sustainable Future ETF) The Semi-Transparent ETFs are actively managed ETFs that operate pursuant to an exemptive order from the Securities and Exchange Commission and do not publicly disclose their complete portfolio holdings each business day. Instead, each Semi-Transparent ETF publishes each business day on its website a “Tracking Basket,” which is designed to closely track the daily performance of the Semi-Transparent ETF but is not the Semi-Transparent ETF’s actual portfolio. The Tracking Basket is comprised of: (1) select recently disclosed portfolio holdings and/or select securities from the universe from which the Semi-Transparent ETF’s investments are selected (“Strategy Components”); (2) liquid ETFs that convey information about the types of instruments (that are not otherwise fully represented by the Strategy Components) in which the Semi-Transparent ETF invests; and (3) cash and cash equivalents.
A Semi-Transparent ETF’s Tracking Basket structure may affect the price at which shares of the Semi-Transparent ETF trade in the secondary market. Although the Tracking Basket is intended to provide investors with enough information to allow for an effective arbitrage mechanism that will keep the market price of each Semi-Transparent ETF at or close to its NAV per share, there is a risk that market prices will vary significantly from NAV. The Semi-Transparent ETFs, which trade on the basis of a published Tracking Basket, may trade at a wider bid/ask spread than ETFs that publish their portfolios on a daily basis, and therefore, may cost investors more to trade. These risks may increase during periods of market disruption or volatility. In addition, although each Semi-Transparent ETF seeks to benefit from keeping its portfolio information secret, market participants may attempt to use the Tracking Basket to identify the Semi-Transparent ETF’s trading strategy. If successful, this could result in such market participants engaging in certain predatory trading practices that may have the potential to harm the Semi-Transparent ETF and its shareholders, such as front running the Semi-Transparent ETF’s trades of portfolio securities.
Arbitrage risk. (For Sustainable Leaders ETF and Sustainable Future ETF) Unlike ETFs that publicly disclose their complete portfolio holdings each business day, each Semi-Transparent ETF provides certain other information intended to allow market participants to estimate the value of positions in the Semi-Transparent ETF’s shares. Although this information is designed to facilitate arbitrage opportunities in the Semi-Transparent ETF’s shares to reduce bid/ask spreads and minimize discounts or premiums between the market price and NAV of the Semi-Transparent ETF shares, there is no guarantee the Semi-Transparent ETF’s arbitrage mechanism will operate as intended and that the Semi-Transparent ETF will not experience wide bid/ask spreads and/or large discounts or premiums to NAV. In addition, market participants may attempt to use the disclosed information to “reverse engineer” the Semi-Transparent ETF’s trading strategy, which, if successful, could increase opportunities for predatory trading practices that may have the potential to negatively impact the Semi-Transparent ETF’s performance.
Trading halt risk. (For Sustainable Leaders ETF and Sustainable Future ETF) There may be circumstances where a security held in a Semi-Transparent ETF’s portfolio but not in the Tracking Basket does not have readily available market quotations. If Putnam Management determines that such circumstance may affect the reliability of the Tracking Basket as an arbitrage vehicle, that information, along with the identity and weighting of that security in the Semi-Transparent ETF’s portfolio, will be publicly disclosed on the Semi-Transparent ETF’s website, and Putnam Management will assess appropriate remedial measures. In these circumstances, market participants may use this information to engage in certain predatory trading practices that may have the potential to harm the Semi-Transparent ETF and its shareholders. In addition, if securities representing 10% or more of the Semi-Transparent ETF’s portfolio do not have readily available market quotations, Putnam Management would promptly request the exchange to halt trading of the Semi-Transparent ETF, meaning that investors (including the fund) would not be able to trade their shares. Trading may also be halted in other circumstances, for example, due to market conditions.
The fund may not achieve its goal, and it is not intended to be a complete investment program. An investment in the fund is not insured or guaranteed by the Federal Deposit Insurance Corporation or any other government agency.
The performance information below gives some indication of the risks associated with an investment in the fund by showing the fund’s performance year to year and over time. Before February 10, 2023, the fund was managed with a materially different investment strategy and may have achieved materially different performance results under its current investment strategy from that shown for periods before this date. The bar chart does not reflect the impact of sales charges. If it did, performance would be lower. Please remember that past performance is not necessarily an indication of future results. Monthly performance figures for the fund are available at www.franklintempleton.com.
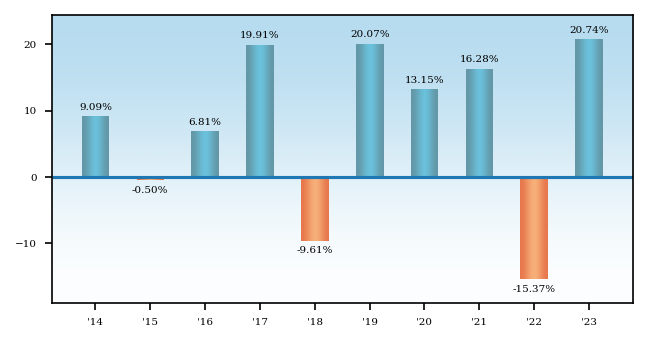
Average Annual Total Returns - Putnam Sustainable Retirement 2050 Fund |
1 Year |
5 Years |
10 Years |
|
|---|---|---|---|---|
| Class A 2050 | 13.80% | 8.76% | 6.70% | |
| Class A 2050 | After Taxes on Distributions | 13.22% | 6.98% | 5.01% | |
| Class A 2050 | After Taxes on Distributions and Sales | 8.29% | 6.53% | 4.85% | |
| Class C 2050 | 18.85% | 9.23% | 6.68% | |
| Class R 2050 | 20.33% | 9.69% | 7.02% | |
| Class R3 2050 | [1] | 20.51% | 9.93% | 7.24% |
| Class R4 2050 | [2] | 20.82% | 10.21% | 7.50% |
| Class R5 2050 | [3] | 21.01% | 10.36% | 7.64% |
| Class R6 2050 | [4] | 21.11% | 10.42% | 7.67% |
| Class Y 2050 | 21.04% | 10.33% | 7.60% | |
| Russell 3000® Index (no deduction for fees, expenses or taxes) | [5] | 25.96% | 15.16% | 11.48% |
| Bloomberg U.S. Aggregate Bond Index (no deduction for fees, expenses or taxes) | [5] | 5.53% | 1.10% | 1.81% |
| S&P Target Date To 2050 Index (no deduction for fees, expenses or taxes) | [5] | 20.21% | 10.67% | 7.62% |
| [1] | Performance for class R3 shares prior to their inception (1/4/21) is derived from the historical performance of class Y shares, adjusted for the higher 12b-1 fees and investor servicing fees applicable to class R3 shares (relative to the comparable fees applicable to class Y shares prior to the inception of class R3 shares). |
| [2] | Performance for class R4 shares prior to their inception (1/4/21) is derived from the historical performance of class Y shares, adjusted for the higher investor servicing fees applicable to class R4 shares (relative to the comparable fees applicable to class Y shares prior to the inception of class R4 shares). |
| [3] | Performance for class R5 shares prior to their inception (1/4/21) is derived from the historical performance of class R6 shares and has not been adjusted for the lower fund expenses applicable to class R5 shares (relative to the comparable expenses applicable to R6 shares prior to the inception of class R5 shares); had it, returns would have been higher. |
| [4] | Performance for class R6 shares prior to their inception (9/1/16) is derived from the historical performance of class Y shares and has not been adjusted for the lower investor servicing fees applicable to class R6 shares (relative to the comparable fees applicable to class Y shares prior to the inception of class R6 shares); had it, returns would have been higher. |
| [5] | The table above compares the fund’s returns to the performance of three indexes: (i) the Russell 3000® Index, a broad measure of market performance, (ii) the Bloomberg U.S. Aggregate Bond Index, a broad measure of market performance, and (iii) the S&P Target Date To 2050 Index, an additional index that the Investment Manager believes more closely reflects the fund’s principal investment objective and strategies. |
| Class C share performance reflects conversion to class A shares after eight years. |
| After-tax returns reflect the historical highest individual federal marginal income tax rates and do not reflect state and local taxes. Actual after-tax returns depend on an investor’s tax situation and may differ from those shown. After-tax returns are shown for class A shares only and will vary for other classes. These after-tax returns do not apply if you hold your fund shares through a 401(k) plan, an IRA, or another tax-advantaged arrangement. |
| The Russell 3000® Index measures the performance of the 3,000 largest U.S. companies based on total market capitalization. Source: FTSE. |
| Frank Russell Company is the source and owner of the trademarks, service marks and copyrights related to the Russell Indexes. Russell ® is a trademark of Frank Russell Company. |
| The Bloomberg U.S. Aggregate Bond Index is an unmanaged index of U.S. investment-grade fixed income securities. |
| All Bloomberg indices are provided by Bloomberg Index Services Limited. |
| BLOOMBERG® is a trademark and service mark of Bloomberg Finance L.P. and its affiliates (collectively “Bloomberg”). Bloomberg or Bloomberg’s licensors own all proprietary rights in the Bloomberg Indices. Neither Bloomberg nor Bloomberg’s licensors approve or endorse this material, or guarantees the accuracy or completeness of any information herein, or makes any warranty, express or implied, as to the results to be obtained therefrom, and to the maximum extent allowed by law, neither shall have any liability or responsibility for injury or damages arising in connection therewith. |
| The S&P Target Date To Index Series is designed to represent a small, style-specific derived consensus of asset class exposure and glide path for a specified list of target retirement dates. |
| Securities in the fund do not match those in the indexes and the performance of the fund will differ. |
Putnam Sustainable Retirement 2045 Fund seeks capital appreciation and current income consistent with a decreasing emphasis on capital appreciation and an increasing emphasis on current income as it approaches its target date.
The following tables describe the fees and expenses you may pay if you buy, hold, and sell shares of the fund. You may pay other fees, such as brokerage commissions and other fees to financial intermediaries, which are not reflected in the tables and examples below. You may qualify for sales charge discounts if you and your family invest, or agree to invest in the future, at least $50,000 in Putnam funds. More information about these and other discounts is available from your financial professional and in How do I buy fund shares? beginning on page 227 of the fund’s prospectus, in the Appendix to the fund’s prospectus, and in How to buy shares beginning on page II-3 of the fund’s statement of additional information (“SAI”).
Shareholder Fees - Putnam Sustainable Retirement 2045 Fund |
Class A 2045 |
Class C 2045 |
Class R 2045 |
Class R3 2045 |
Class R4 2045 |
Class R5 2045 |
Class R6 2045 |
Class Y 2045 |
||
|---|---|---|---|---|---|---|---|---|---|---|
| Maximum Sales Charge Imposed on Purchases (as a percentage of Offering Price) | 5.75% | none | none | none | none | none | none | none | ||
| Maximum Deferred Sales Charge (as a percentage) | 1.00% | [1] | 1.00% | [2] | none | none | none | none | none | none |
| [1] | Applies only to certain redemptions of shares bought with no initial sales charge. |
| [2] | This charge is eliminated after one year. |
Annual Fund Operating Expenses - Putnam Sustainable Retirement 2045 Fund |
Class A 2045 |
Class C 2045 |
Class R 2045 |
Class R3 2045 |
Class R4 2045 |
Class R5 2045 |
Class R6 2045 |
Class Y 2045 |
|
|---|---|---|---|---|---|---|---|---|---|
| Management Fees (as a percentage of Assets) | 0.51% | 0.51% | 0.51% | 0.51% | 0.51% | 0.51% | 0.51% | 0.51% | |
| Distribution and Service (12b-1) Fees | 0.25% | 1.00% | 0.50% | 0.25% | none | none | none | none | |
| Other Expenses (as a percentage of Assets): | 0.22% | 0.22% | 0.37% | 0.37% | 0.37% | 0.22% | 0.12% | 0.22% | |
| Acquired Fund Fees and Expenses | 0.53% | 0.53% | 0.53% | 0.53% | 0.53% | 0.53% | 0.53% | 0.53% | |
| Expenses (as a percentage of Assets) | 1.51% | 2.26% | 1.91% | 1.66% | 1.41% | 1.26% | 1.16% | 1.26% | |
| Fee Waiver or Reimbursement | [1] | (0.66%) | (0.66%) | (0.66%) | (0.66%) | (0.66%) | (0.66%) | (0.66%) | (0.66%) |
| Net Expenses (as a percentage of Assets) | 0.85% | 1.60% | 1.25% | 1.00% | 0.75% | 0.60% | 0.50% | 0.60% | |
| [1] | Reflects a contractual obligation of the Investment Manager to limit certain fund expenses through November 30, 2027. This obligation may be modified or discontinued only with approval of the Board of Trustees. |
The following hypothetical example is intended to help you compare the cost of investing in the fund with the cost of investing in other funds. It assumes that you invest $10,000 in the fund for the time periods indicated and then, except as indicated, redeem all your shares at the end of those periods. It assumes a 5% return on your investment each year and that the fund’s operating expenses remain the same. Only the first three years of each period in the example take into account the expense reimbursement described above. Your actual costs may be higher or lower.
Expense Example - Putnam Sustainable Retirement 2045 Fund - USD ($) |
Expense Example, with Redemption, 1 Year |
Expense Example, with Redemption, 3 Years |
Expense Example, with Redemption, 5 Years |
Expense Example, with Redemption, 10 Years |
Expense Example, No Redemption, 1 Year |
Expense Example, No Redemption, 3 Years |
Expense Example, No Redemption, 5 Years |
Expense Example, No Redemption, 10 Years |
|---|---|---|---|---|---|---|---|---|
| Class A 2045 | 657 | 831 | 1,164 | 2,103 | ||||
| Class C 2045 | 263 | 505 | 1,018 | 2,238 | 163 | 505 | 1,018 | 2,238 |
| Class R 2045 | 127 | 397 | 836 | 2,061 | ||||
| Class R3 2045 | 102 | 318 | 704 | 1,788 | ||||
| Class R4 2045 | 77 | 240 | 571 | 1,508 | ||||
| Class R5 2045 | 61 | 192 | 490 | 1,337 | ||||
| Class R6 2045 | 51 | 160 | 435 | 1,221 | ||||
| Class Y 2045 | 61 | 192 | 490 | 1,337 |
The fund pays transaction-related costs, such as commissions, when it buys and sells securities (or “turns over” its portfolio). A higher turnover rate may indicate higher transaction costs and may result in higher taxes when the fund’s shares are held in a taxable account. These costs, which are not reflected in annual fund operating expenses or the above example, affect fund performance. The fund’s turnover rate in the most recent fiscal year was 21%.
Investments
The fund is one of a series of target date funds that invest primarily in exchange-traded funds (“ETFs”) that focus on investments with positive sustainability or environmental, social, and governance (“ESG”) characteristics, referred to as underlying funds. The underlying funds include funds managed by Franklin Advisers, Inc. (“Franklin Advisers” or the “Investment Manager”), the fund’s investment manager, and funds managed by affiliated investment advisers. The fund’s asset allocation strategy may be attractive to investors who plan to retire or otherwise intend to begin making periodic withdrawals of their investments in or about 2045 (the target date). The fund is designed to provide diversification among different asset classes by investing its assets in the underlying funds.
Under normal circumstances, the fund will invest in underlying funds (which, for purposes of this policy, include money market mutual funds advised by the Investment Manager or its affiliates) such that, in the aggregate, it has indirect exposure to investments that meet each underlying fund’s respective sustainability or ESG criteria and that represent at least 80% of the value of its net assets. This policy is non-fundamental and may be changed only after 60 days’ notice to shareholders. The Investment Manager may not apply ESG or sustainability criteria to investments that are not subject to the fund’s 80% policy, and such investments may not meet the applicable ESG or sustainability criteria. Through its investments in underlying funds, the fund makes use of a range of ESG- and sustainability- oriented investment strategies and invests across a variety of asset classes. The ESG or sustainability criteria will differ across the underlying funds. These differences may arise both from differences in the underlying funds’ asset classes (such as the characteristics of non-U.S. versus U.S. issuers, or the structural differences (e.g., position in the capital structure) between equity and fixed-income investments) as well as from different managers’ styles. In implementing an underlying fund’s investment strategy, the portfolio managers of the underlying fund may apply and weigh different ESG criteria differently than the portfolio managers of the other underlying funds. There are also expected to be differences in how the portfolio managers of the underlying funds source ESG-related or sustainability-oriented research (e.g., proprietary versus third-party research) and/or their approach to selecting companies based on ESG or sustainability criteria.
The fund’s target allocations among asset classes and underlying funds will increasingly emphasize capital preservation and income over time and will change gradually based on the number of remaining years until the fund’s target date, as shown in the predetermined “glide path” in the chart under “What are the funds’ and each underlying fund’s main investment strategies and related risks?” The Investment Manager adjusts these allocations at the end of each calendar quarter based on the glide path.
Pending investment in underlying funds, the fund also expects to temporarily invest cash balances resulting from purchase activity by fund shareholders in Putnam Government Money Market Fund, a mutual fund sponsored by the Investment Manager, or in cash or cash equivalents. The fund also expects to invest a portion of its assets in Putnam Government Money Market Fund or in cash or cash equivalents in order to manage shareholder redemptions. The percentage of a fund invested in Putnam Government Money Market Fund is expected to vary over time and will depend on the level of purchase and redemption activity by fund shareholders.
The following table presents your fund’s approximate allocations to each asset class and underlying fund as of September 30, 2024 (taking into account any tactical adjustments described below) and its projected approximate allocations to those asset classes and underlying funds as of September 30, 2025. The table does not reflect temporary investments in Putnam Government Money Market Fund or in cash or cash equivalents. By comparing the percentage allocations of your fund in the table, you can see how its allocations are expected to change during the one-year period beginning on September 30, 2024. The table also shows the approximate allocations of other Putnam Sustainable Retirement Funds, which are designed for investors with different target retirement dates. Over a five-year period, each fund’s allocations will gradually change to resemble the allocations of the fund with the next earliest target date. The table illustrates how a fund’s allocations are expected to change over time to increasingly emphasize capital preservation and income.
| Underlying Fund* | Year | 2065 | 2060 | 2055 | 2050 | 2045 (your fund) | 2040 | 2035 | 2030 | 2025 | Maturity Fund |
| Putnam Sustainable Leaders ETF | 2024 | 48.6% | 47.2% | 44.8% | 42.3% | 39.7% | 36.4% | 31.7% | 21.0% | 14.9% | 14.1% |
| 2025 | 47.6% | 45.8% | 43.3% | 40.7% | 38.4% | 35.2% | 30.3% | 18.6% | 14.3% | 14.1% | |
| Putnam Sustainable Future ETF | 2024 | 23.8% | 23.1% | 21.9% | 20.6% | 19.4% | 17.9% | 15.8% | 10.5% | 7.5% | 7.1% |
| 2025 | 23.8% | 22.9% | 21.7% | 20.4% | 19.2% | 17.6% | 15.2% | 9.3% | 7.1% | 7.1% | |
| Putnam PanAgora ESG Inter-national Equity ETF | 2024 |
17.8% | 17.3% | 16.4% | 15.5% | 14.4% | 12.4% | 9.6% | 6.3% | 4.5% | 4.2% |
| 2025 | 17.8% | 17.2% | 16.2% | 15.3% | 14.2% | 11.9% | 9.1% | 5.6% | 4.3% | 4.2% | |
| Putnam PanAgora ESG Emer-ging Markets Equity ETF | 2024 |
4.9% | 4.8% | 4.5% | 4.2% | 3.8% | 2.2% | 0.1% | 0.0% | 0.0% | 0.0% |
| 2025 | 5.9% | 5.7% | 5.4% | 5.1% | 4.5% | 2.2% | 0.0% | 0.0% | 0.0% | 0.0% | |
| Putnam ESG Core Bond ETF | 2024 | 3.3% | 5.3% | 8.9% | 12.4% | 15.4% | 23.0% | 33.5% | 49.7% | 52.3% | 51.7% |
| 2025 | 3.3% | 5.9% | 9.7% | 13.0% | 16.1% | 24.8% | 35.4% | 53.4% | 51.8% | 51.7% | |
| Putnam ESG High Yield ETF | 2024 | 1.1% | 1.8% | 3.0% | 4.1% | 4.9% | 4.8% | 4.9% | 6.7% | 14.8% | 16.9% |
| 2025 | 1.1% | 2.0% | 3.2% | 4.3% | 4.9% | 4.8% | 5.3% | 7.1% | 16.5% | 16.9% | |
| Putnam ESG Ultra Short ETF | 2024 | 0.5% | 0.5% | 0.5% | 0.9% | 2.4% | 3.3% | 4.4% | 5.8% | 6.0% | 6.0% |
| 2025 | 0.5% | 0.5% | 0.5% | 1.2% | 2.7% | 3.5% | 4.7% | 6.0% | 6.0% | 6.0% | |
| Total Equity** | 2024 | 95.1% | 92.4% | 87.6% | 82.6% | 77.3% | 68.9% | 57.2% | 37.8% | 26.9% | 25.4% |
| 2025 | 95.1% | 91.6% | 86.6% | 81.5% | 76.3% | 66.9% | 54.6% | 33.5% | 25.7% | 25.4% | |
| Total Fixed Income** | 2024 | 4.9% | 7.6% | 12.4% | 17.4% | 22.7% | 31.1% | 42.8% | 62.2% | 73.1% | 74.6% |
| 2025 | 4.9% | 8.4% | 13.4% | 18.5% | 23.7% | 33.1% | 45.4% | 66.5% | 74.3% | 74.6% |
| * | Due to rounding, allocations shown in the table above may not total 100%. In addition, because of rounding in the calculation of allocations among underlying funds and market fluctuations, actual allocations might be more or less than these percentages. |
| ** | Equity and fixed-income allocations are hypothetical estimates based on an assumption that each of Putnam Sustainable Leaders ETF, Putnam Sustainable Future ETF, Putnam PanAgora ESG International Equity ETF, and Putnam PanAgora ESG Emerging Markets Equity ETF is equivalent to an equity investment and each of Putnam ESG Core Bond ETF, Putnam ESG High Yield ETF and Putnam ESG Ultra Short ETF is equivalent to a fixed-income investment. Actual allocations will vary. |
The fund’s target allocations may differ from the allocations shown in the table. The Investment Manager may change the glide path, the fund’s target allocations, and the underlying funds in which it invests at any time, although the Investment Manager generally expects these changes (other than the tactical adjustments described below) to be infrequent and generally in response to longer-term structural changes (e.g., in the average retirement age or life expectancy) that lead the fund’s portfolio managers to determine that a change is advisable. The Investment Manager may also make tactical adjustments from time to time in the fund’s allocations to underlying funds in response to market conditions within a range of +/- 15% from the allocations to fixed-income and equity asset classes as presented in the fund’s glide path.
It is assumed that investors will begin gradual withdrawals from the fund at around the target date. Near the end of the target date year, the fund’s target allocations will correspond to those of Putnam Sustainable Retirement Maturity Fund (“Maturity Fund”), a fund that seeks as high a rate of current income as the Investment Manager believes is consistent with preservation of capital, and the fund will be merged into Maturity Fund. More information about Maturity Fund is available in the prospectus beginning on page 171, and more information about the underlying funds (which are not offered by this prospectus) is included below and under “What are the funds’ and each underlying fund’s main investment strategies and related risks?”
Information about each underlying fund’s investment strategy
Putnam Sustainable Leaders ETF (“Sustainable Leaders ETF”)
Sustainable Leaders ETF invests mainly in common stocks of U.S. companies of any size, with a focus on companies that Putnam Investment Management, LLC (“Putnam Management”), Sustainable Leaders ETF’s investment manager, believes exhibit a commitment to financially material sustainable business practices. Sustainable Leaders ETF may also invest in non-U.S. companies. In evaluating investments for Sustainable Leaders ETF, Putnam Management views “financially material sustainable business practices” as business practices that it believes are reasonably likely to impact the financial condition or operating performance of a company and that relate to environmental, social, or corporate governance issues.
Under normal circumstances, Sustainable Leaders ETF invests at least 80% of the value of its net assets in securities that meet Putnam Management’s sustainability criteria. For a further discussion of Sustainable Leaders ETF’s investment strategy, please turn to the section What are the funds’ and each underlying fund’s main investment strategies and related risks? beginning on page 189.
Putnam Sustainable Future ETF (“Sustainable Future ETF”)
Sustainable Future ETF invests mainly in common stocks of U.S. companies of any size, with a focus on companies whose products and services Putnam Management, Sustainable Future ETF’s investment manager, believes provide solutions that directly contribute to sustainable social, environmental and economic development (Solutions Companies).
Under normal circumstances, Sustainable Future ETF invests at least 80% of the value of its net assets in securities that meet Putnam Management’s sustainability criteria. For a further discussion of Sustainable Future ETF’s investment strategy, please turn to the section What are the funds’ and each underlying fund’s main investment strategies and related risks? beginning on page 189.
Putnam PanAgora ESG International Equity ETF (“PanAgora International Equity ETF”)
PanAgora International Equity ETF invests mainly in common stocks (growth or value stocks or both) of companies of any size outside the United States with a focus on companies that PanAgora International Equity ETF’s subadviser, PanAgora Asset Management, Inc. (“PanAgora”), believes offer attractive benchmark-relative
returns and exhibit positive ESG metrics. Under normal circumstances, PanAgora International Equity ETF invests at least 80% of its net assets in equity securities of companies that meet PanAgora’s ESG criteria. For a further discussion of PanAgora International Equity ETF’s investment strategy, please turn to the section What are the funds’ and each underlying fund’s main investment strategies and related risks? beginning on page 189.
Putnam PanAgora ESG Emerging Markets Equity ETF (“PanAgora Emerging Markets Equity ETF”)
PanAgora Emerging Markets Equity ETF invests mainly in common stocks (growth or value stocks or both) of emerging markets companies of any size with a focus on companies that PanAgora Emerging Markets Equity ETF’s subadviser, PanAgora, believes offer attractive benchmark-relative returns and exhibit positive ESG metrics. Under normal circumstances, PanAgora Emerging Markets Equity ETF invests at least 80% of its net assets in equity securities of emerging markets companies that meet PanAgora’s ESG criteria. For a further discussion of PanAgora Emerging Markets Equity ETF’s investment strategy, please turn to the section What are the funds’ and each underlying fund’s main investment strategies and related risks? beginning on page 189.
Putnam ESG Core Bond ETF (“Core Bond ETF”)
Core Bond ETF invests mainly in a diversified portfolio of investment-grade fixed-income securities with a focus on companies or issuers that Franklin Advisers, Core Bond ETF’s investment manager, believes meet relevant ESG criteria on a sector-specific basis. Under normal circumstances, Core Bond ETF invests at least 80% of the value of its net assets in fixed-income securities that meet Franklin Advisers’ ESG criteria. For a further discussion of Core Bond ETF’s investment strategy, please turn to the section What are the funds’ and each underlying fund’s main investment strategies and related risks? beginning on page 189.
Putnam ESG High Yield ETF (“High Yield ETF”)
High Yield ETF invests mainly in bonds that are below investment grade in quality (sometimes referred to as “junk bonds”) with a focus on companies or issuers that Franklin Advisers, High Yield ETF’s investment manager, believes meet relevant ESG criteria on a sector-specific basis. High Yield ETF invests mainly in bonds that also have one or more of the following characteristics: (1) are obligations of U.S. companies or issuers and (2) have intermediate- to long-term maturities (three years or longer). Under normal circumstances, High Yield ETF invests at least 80% of the value of its net assets in fixed-income securities rated below investment grade that meet Franklin Advisers’ ESG criteria. For a further discussion of High Yield ETF’s investment strategy, please turn to the section What are the funds’ and each underlying fund’s main investment strategies and related risks? beginning on page 189.
Putnam ESG Ultra Short ETF (“Ultra Short ETF”)
Ultra Short ETF invests in a diversified short duration portfolio of fixed-income securities comprised of investment-grade money market and other fixed-income securities, including U.S. dollar-denominated foreign securities of these types, with a focus on companies or issuers that Franklin Advisers, Ultra Short ETF’s investment manager, believes meet relevant ESG criteria, on a sector-specific basis. Under normal circumstances, Ultra Short ETF invests at least 80% of the value of its net assets in fixed-income securities that meet Franklin Advisers’ ESG criteria. For a further discussion of Ultra Short ETF’s investment strategy, please turn to the section What are the funds’ and each underlying fund’s main investment strategies and related risks? beginning on page 189.
It is important to understand that you can lose money by investing in the fund. Losses may occur near, at or after the target date. There is no guarantee that the fund will provide adequate income at and through an investor’s retirement.
The fund’s allocation of assets among asset classes and the underlying funds may hurt performance. An underlying fund may change its investment program or policies without the fund’s approval, which could require the fund to reduce or eliminate its allocation to the underlying fund at an unfavorable time.
The fund invests in underlying funds and indirectly bears expenses related to the underlying funds. However, the Investment Manager has contractually agreed to waive fees, reimburse expenses of, or reimburse the fund through at least November 30, 2027 in an amount equal to the fund’s acquired fund fees and expenses (e.g., the fees and expenses incurred by the fund as a result of its investments in the underlying funds). The Investment Manager also has contractually agreed to waive fees and/or reimburse expenses of each class of shares of the fund through at least November 30, 2027 in an amount sufficient to result in total annual fund operating expenses for class A, C, R, R3, R4, R5, R6 and Y shares of the fund (exclusive of payments under the fund’s distribution plans, brokerage, interest, taxes, investment-related expenses, acquired fund fees and expenses, and extraordinary expenses) that equal 0.60%, 0.60%, 0.75%, 0.75%, 0.75%, 0.60%, 0.50%, and 0.60%, respectively, of the fund’s average net assets.
Pending investment in underlying funds, the fund also expects to temporarily invest cash balances resulting from purchase activity by fund shareholders in Putnam Government Money Market Fund, a money market mutual fund sponsored by the Investment Manager, or in cash or cash equivalents. In addition, the fund expects to invest a portion of its assets in Putnam Government Money Market Fund or in cash or cash equivalents in order to manage shareholder redemptions. Large positions in Putnam Government Money Market Fund or in cash or cash equivalents may dampen performance and may prevent the fund from achieving its goal. These practices may be subject to other risks, as described under Miscellaneous Investments, Investment Practices and Risks in the SAI.
The fund also bears the risks associated with the underlying funds identified below. The relative significance of these risks will vary over time based on the fund’s target allocations to the underlying funds and to equity and fixed-income asset classes, which may change from time to time as discussed above.
Investment Strategy-Related Risks of the Underlying Funds
Sustainability and ESG investing risk. Investing in underlying funds with an ESG or sustainability focus may result in the fund having exposure to underlying funds that invest in certain types of companies, issuers, industries or sectors that the market may not favor. In evaluating an investment opportunity for the underlying funds, Franklin Advisers, Putnam Management or PanAgora may make investment decisions without the availability of optimal ESG-related data (which may be even less available with securitized debt instruments) or based on information and data that is incomplete or inaccurate. Sustainability and ESG metrics are not uniformly defined, and applying such metrics involves subjective assessments. Sustainability and ESG scorings and assessments of issuers can vary across third-party data providers and may change over time. Franklin Advisers, Putnam Management and PanAgora do not rely exclusively on third-party data providers in evaluating sustainability and ESG criteria for the underlying funds. ESG information from third-party data providers may be incomplete, inaccurate or unavailable, particularly with respect to companies in emerging market countries, which may adversely impact the investment process. In addition, the business practices, products or services of issuers in which an underlying fund invests may change over time. As a result of these possibilities, among others, an underlying fund may temporarily hold securities that are inconsistent with the underlying fund’s ESG or sustainability investment criteria. Regulatory changes or interpretations regarding the definitions and/or use of ESG and/or sustainability criteria could have a material adverse effect on the underlying fund’s ability to invest in accordance with its investment policies and/or achieve its investment objective. The underlying funds do not restrict investments based solely on “negative screens”, and the underlying fixed-income funds do not restrict their fixed-income investments to “green bonds” (e.g., U.S. dollar-denominated bonds designated as “green” by the Climate Bonds Initiative). For the underlying funds that pursue fixed-income investment strategies, because fixed-income investments generally represent a promise to pay principal and interest by an issuer, and not an ownership interest, and may involve complex structures, ESG-related investment considerations may have a more limited impact on risk and return (or may have an impact over a different investment time horizon) relative to other asset classes, and this may be particularly true for shorter-term investments. In addition, holders of fixed-income investments do not typically have voting rights, unlike holders of equity investments who have the right to vote on issuer proposals.
Market risk. The value of investments in the underlying funds’ portfolios may fall or fail to rise over extended periods of time for a variety of reasons, including general economic, political or financial market conditions, investor sentiment and market perceptions, government actions, geopolitical events or changes, outbreaks of infectious illnesses or other widespread public health issues (including epidemics and
pandemics), and factors related to a specific issuer, geography, industry or sector. These and other factors may lead to increased volatility and reduced liquidity in the underlying funds’ portfolio holdings, may negatively impact the fund’s performance, and may exacerbate other risks to which the fund is subject.
Common stock risk. (For all underlying funds except Core Bond ETF, High Yield ETF and Ultra Short ETF) Common stock represents an ownership interest in a company. The value of a company’s stock may fall or fail to rise as a result of factors directly relating to that company, such as decisions made by its management or lower demand for the company’s products or services. A stock’s value may also fall because of factors affecting not just the company, but also other companies in the same industry or in a number of different industries, such as increases in production costs.
| Growth investing risk.. Growth stocks may be more susceptible to earnings disappointments, and the market may not favor growth-style investing. |
| Value investing risk. Value stocks may fail to rebound, and the market may not favor value-style investing. Companies whose stocks we believe are undervalued by the market may have experienced adverse business developments or may be subject to special risks that have caused their stocks to be out of favor. |
| Small and midsize companies risk. Stocks of small and midsize companies often trade in smaller volumes, and their prices may fluctuate more than stocks of larger companies. Stocks of these companies may therefore be more vulnerable to adverse developments than those of larger companies. |
Industry or sector concentration risk. (For all underlying funds except Core Bond ETF, High Yield ETF and Ultra Short ETF) From time to time, an underlying fund may invest a significant portion of its assets in companies in one or more related industries or sectors, which would make the underlying fund more vulnerable to adverse developments affecting those industries or sectors.
Model and data risk. (For all underlying funds except Sustainable Leaders ETF, Sustainable Future ETF and High Yield ETF) If the quantitative models or data that are used in managing an underlying fund prove to be incorrect or incomplete, investment decisions made in reliance on the models or data may not produce the desired results, and the underlying fund may realize losses. Additionally, market movements are likely to change the risk levels and risk allocations of the underlying fund. Investments made based on quantitative models may perform differently from the market as a whole.
Foreign investment risk. (For all underlying funds except Ultra Short ETF, Sustainable Leaders ETF and Sustainable Future ETF) The value of international investments traded in foreign currencies may be adversely impacted by fluctuations in exchange rates. International investments, particularly investments in emerging markets, may carry risks associated with potentially less stable economies or governments (such as the risk of seizure by a foreign government, the imposition of currency or other restrictions, or high levels of inflation), and may be or become
illiquid. There may be less publicly-available information, or less reliable publicly-available information, about foreign companies (including information related to companies’ ESG practices), particularly with respect to emerging market companies, than publicly-available information regarding U.S. companies. As a result, an underlying fund’s ability to evaluate a foreign company, including with respect to its ESG or sustainability practices, may be more limited than its ability to evaluate a U.S. company.
Geographic focus risk. (For PanAgora International Equity ETF and PanAgora Emerging Markets Equity ETF) From time to time, an underlying fund may invest a significant portion of its assets in companies in one or more related geographic regions, industries or sectors, such as European and Asian countries, which would make the fund more vulnerable to adverse developments affecting those geographic regions, industries or sectors, including political, economic, or other developments adversely impacting ESG or sustainable investing.
Fixed-income investments risk. (For Core Bond ETF, High Yield ETF and Ultra Short ETF) The risks associated with fixed-income investments include interest rate risk, which is the risk that the value of an underlying fund’s investments is likely to fall if interest rates rise. Fixed-income investments are also subject to credit risk, which is the risk that the issuer of a fixed-income investment may default on payment of interest or principal. Credit risk is generally greater for debt not backed by the full faith and credit of the U.S. government, and interest rate risk is generally greater for longer-term debt. Fixed-income investments may be more susceptible to downgrades or defaults during economic downturns or other periods of economic stress. Mortgage-backed investments, unlike traditional debt investments, are also subject to prepayment risk, which means that they may increase in value less than other bonds when interest rates decline and decline in value more than other bonds when interest rates rise. The underlying fund may have to invest the proceeds from prepaid investments, including mortgage-backed investments, in other investments with less attractive terms and yields. The underlying fund’s investments in mortgage-backed securities, and in certain other securities and derivatives, may be or become illiquid. The underlying fund’s investments in mortgage-backed securities may make the underlying fund’s net asset value more susceptible to economic, market, political and other developments affecting the residential and commercial real estate markets and the servicing of mortgage loans secured by real estate properties. During periods of difficult economic conditions, delinquencies and losses on commercial mortgage-backed investments in particular generally increase, including as a result of the effects of those conditions on commercial real estate markets, the ability of commercial tenants to make loan payments, and the ability of a property to attract and retain commercial tenants.
One of the underlying funds, Putnam High Yield ETF, invests mostly in higher-yield, higher-risk debt investments that are rated below BBB or its equivalent at the time of purchase by any nationally recognized securities rating agency rating such investments, or in unrated investments that Franklin Advisers believes are of comparable quality. The underlying fund may invest up to 15% of the underlying
fund’s total assets in debt investments rated below CCC or its equivalent, at the time of purchase, by each rating agency rating such investments, or in unrated investments that Franklin Advisers believes are of comparable quality. This includes investments in the lowest rating category of the rating agency. The underlying fund will not necessarily sell an investment if its rating is reduced after Franklin Advisers buys it. Investments rated below BBB or its equivalent are below-investment-grade in quality. This rating reflects a greater possibility that the issuers may be unable to make timely payments of interest and principal and thus default. If a default occurs, or is perceived as likely to occur, the value of the investment will usually be more volatile and is likely to fall. The value of a debt instrument may also be affected by changes in, or perceptions of, the financial condition of the issuer, borrower, counterparty, or other entity, or underlying collateral or assets, or changes in, or perceptions of, specific or general market, economic, industry, political, regulatory, geopolitical, environmental, public health, and other conditions. A default or expected default could also make it difficult for the underlying fund to sell the investment at a price approximating the value Franklin Advisers had previously placed on it. Lower-rated debt usually has a more limited market than higher-rated debt, which may at times make it difficult for the underlying fund to buy or sell certain debt instruments or to establish their fair values.
Derivatives risk. (For all underlying funds except PanAgora International Equity ETF, PanAgora Emerging Markets Equity ETF, Sustainable Leaders ETF and Sustainable Future ETF) An underlying fund’s use of derivatives may increase the risks of investing in the underlying fund by increasing investment exposure (which may be considered leverage) or, in the case of many over-the-counter instruments, because of the potential inability to terminate or sell derivatives positions and the potential failure of the other party to the instrument to meet its obligations. The risk of a party failing to meet its obligations may increase if the fund has significant investment exposure to that counterparty. The value of derivatives may move in unexpected ways due to unanticipated market movements, the use of leverage, imperfect correlation between the derivative instrument and the reference asset, or other factors, especially in unusual market conditions, and volatility in the value of derivatives could adversely impact the underlying fund’s returns, obligations and exposures. Derivatives are also subject to other risks, including liquidity risk (e.g., liquidity demands arising from the requirement to make payments to a derivative counterparty), operational risk (e.g., settlement issues or system failure), and legal risk (e.g., insufficient legal documentation or contract enforceability issues).
Floating rate obligations risk. (For Core Bond ETF, High Yield ETF and Ultra Short ETF) To the extent an underlying fund holds floating rate loans, interest rate risk may be reduced but will not be eliminated. While floating rate loans are normally secured by specific collateral or assets of the issuer (so that holders of the loans, such as the underlying fund, will have a priority claim on those assets in the event of default or bankruptcy of the issuer), the value of collateral may be insufficient to meet the issuer’s obligations, and the underlying fund’s access to collateral may be limited by bankruptcy or other insolvency laws. The settlement period (the period
between the execution of the trade and the delivery of cash to the purchaser) for floating rate loan transactions is typically longer than seven days, and it is possible that sale proceeds from floating rate loan transactions will not be available to meet redemption obligations.
Portfolio turnover rate risk. From time to time an underlying fund may engage in frequent trading. Funds with high turnover may be more likely to realize capital gains that must be distributed to shareholders as taxable income. High turnover may also cause a fund to pay more brokerage commissions and to incur other transaction costs (including imputed transaction costs), which may detract from performance. A fund’s portfolio turnover rate and the amount of brokerage commissions it pays and transaction costs it incurs will vary over time based on market conditions.
Management and operational risk. There is no guarantee that the investment techniques, analyses, or judgments that Franklin Advisers, Putnam Management or PanAgora, as applicable, applies in making investment decisions for the underlying funds will produce the intended outcome or that the investments they select for the underlying funds will perform as well as other securities that were not selected for the underlying funds. Franklin Advisers, Putnam Management, PanAgora, or the underlying funds’ other service providers, may experience disruptions or operating errors that could negatively impact the underlying funds.
Risks Related to Investing in ETFs
As ETFs, shares of the underlying funds are traded in the secondary market. Prior to trading in the secondary market, shares of the underlying funds are “created” at NAV by market makers, large investors and institutions (collectively, “authorized participants”) only in creation units. A creation transaction generally takes place when an authorized participant deposits into an underlying fund a designated portfolio of securities, assets or other positions (a “creation basket”), and an amount of cash (including any cash representing the value of substituted securities, assets or other positions), if any, in exchange for a specified number of creation units. Similarly, shares of an underlying fund can be redeemed only in creation units, generally for a designated portfolio of securities, assets or other positions held by the underlying fund and an amount of cash (including any portion of such securities for which cash may be substituted), if any.
Fluctuation of net asset value (“NAV”) and share price risk. Shares of the underlying funds may trade at a larger premium or discount to their NAV than shares of other ETFs. The NAV of an underlying fund will generally fluctuate with changes in the market value of the underlying fund’s holdings. Underlying fund shares can be bought and sold in the secondary market at market prices. Disruptions to creations and redemptions, the existence of extreme market volatility or potential lack of an active trading market for an underlying fund’s shares may result in the underlying fund’s shares trading significantly above (at a premium) or below (at a discount) to NAV or to the intraday value of the underlying fund’s holdings. In addition, in stressed market conditions or periods of market disruption or volatility, the market for shares of the
underlying funds may become less liquid in response to deteriorating liquidity in the markets for the underlying funds’ portfolio holdings.
Authorized participant concentration risk. Only an authorized participant may engage in creation and redemption transactions directly with an underlying fund. Your fund is not an authorized participant and can only purchase and sell underlying fund shares in the secondary market at market prices or through an authorized participant. The underlying fund may have a limited number of financial institutions that act as authorized participants, none of which are obligated to engage in creation and/or redemption transactions. To the extent that those authorized participants do not engage in creation and redemption orders, there may be a significantly diminished trading market for underlying fund shares, or underlying fund shares may trade at a discount (or premium) to NAV and possibly face trading halts and/or de-listing.
Trading issues risk. The underlying funds have a limited public trading history. Sustainable Leaders ETF and Sustainable Future ETF began trading publicly in May 2021, while PanAgora International Equity ETF, PanAgora Emerging Markets Equity ETF, Core Bond ETF, High Yield ETF, and Ultra Short ETF began trading publicly in January 2023. There can be no assurance that an active trading market will develop or be maintained or that the market for underlying fund shares will operate as intended, which could lead to the underlying funds’ shares trading at wider spreads and larger premiums and discounts to NAV than other actively managed ETFs. As a result, it may cost the fund more to trade underlying fund shares than shares of other ETFs. There is no guarantee that the underlying fund will be able to attract market makers and authorized participants. Market makers and authorized participants are not obligated to make a market in the underlying fund’s shares or to submit purchase and redemption orders for creation units.
The market prices of an underlying fund’s shares are expected to fluctuate, in some cases materially, in response to changes in the underlying fund’s NAV, the intraday value of the underlying fund’s holdings and supply and demand for the underlying fund’s shares. Each underlying fund’s respective investment manager cannot predict whether an underlying fund’s shares will trade above, below or at their NAV or the intraday value of the underlying fund’s holdings. During periods when an underlying fund is trading below its NAV, the fund may incur significant losses if it sells its underlying fund shares.
The securities held by an underlying fund may be traded in markets that close at a different time than the exchange on which the underlying fund’s shares are listed. Liquidity in those securities may be reduced after the applicable closing times. Accordingly, during the time when the exchange is open but after the applicable market closing, fixing or settlement times, bid-ask spreads on the exchange and the corresponding premium or discount to the NAV of the underlying funds’ shares may widen.
Large shareholder risk. Each underlying fund may be an investment option for mutual funds that are managed by Franklin Resources, Inc. (“Franklin Templeton”) and its affiliates as “funds of funds.” Additionally, other investors from time to time may make substantial investments in an underlying fund, including affiliates of Franklin Templeton, through seed capital arrangements. Such shareholders may at times be considered to control an underlying fund. Dispositions of a large number of shares by these shareholders may adversely affect an underlying fund’s liquidity and net assets to the extent such transactions are executed directly with the underlying fund in the form of redemptions through an authorized participant, rather than executed in the secondary market. These redemptions may also force an underlying fund to sell securities, which may increase the underlying fund’s brokerage costs. In addition, underlying fund returns may be adversely affected if an underlying fund holds a portion of its assets in liquid, cash-like investments in connection with or in anticipation of shareholder redemptions. To the extent these large shareholders transact in shares of an underlying fund on the secondary market, such transactions may account for a large percentage of the trading volume on the exchange and may, therefore, have a material effect (upward or downward) on the market price of the underlying fund’s shares.
Cash transactions risk. Some of the underlying funds may effect creations and redemptions in cash or partially in cash. Therefore, an underlying fund may be required to sell portfolio securities, incur transaction costs, and subsequently recognize gains on such sales that the underlying fund might not have recognized if it were to distribute portfolio securities in-kind. As such, investments by a fund in an underlying fund’s shares may be less tax-efficient than an investment in an ETF that distributes portfolio securities entirely in-kind. An underlying fund may also incur transaction costs in connection with creations effected in cash (in whole or in part).
Semi-transparent ETF risk. (For Sustainable Leaders ETF and Sustainable Future ETF) Two of the underlying funds, Putnam Sustainable Leaders ETF and Putnam Sustainable Future ETF (the “Semi-Transparent ETFs”), are different from traditional ETFs, including the other underlying funds. Traditional ETFs disclose to the public what assets they hold each day. However, the Semi-Transparent ETFs do not. This may create additional risks for an investment in the Semi-Transparent ETFs, including that an investor may have to pay more money to trade the Semi-Transparent ETF’s shares in light of the fact that the Semi-Transparent ETF will provide less information to traders, who tend to charge more for trades when they have less information. The price an investor pays to buy or sell an ETF’s shares on an exchange may not match the value of the ETF’s portfolio, and these price differences may be greater for the Semi-Transparent ETFs compared to other ETFs because they provide less information to traders. These additional risks may be even greater in adverse or uncertain market conditions.
The differences between the Semi-Transparent ETFs and other ETFs may also have advantages. By keeping certain information about the Semi-Transparent ETFs secret, a Semi-Transparent ETF may face less risk that other traders can predict or copy its investment strategy. This may improve the Semi-Transparent ETF’s performance.
If other traders are able to copy or predict the Semi-Transparent ETF’s investment strategy, however, this may hurt the Semi-Transparent ETF’s performance.
Tracking basket structure risk. (For Sustainable Leaders ETF and Sustainable Future ETF) The Semi-Transparent ETFs are actively managed ETFs that operate pursuant to an exemptive order from the Securities and Exchange Commission and do not publicly disclose their complete portfolio holdings each business day. Instead, each Semi-Transparent ETF publishes each business day on its website a “Tracking Basket,” which is designed to closely track the daily performance of the Semi-Transparent ETF but is not the Semi-Transparent ETF’s actual portfolio. The Tracking Basket is comprised of: (1) select recently disclosed portfolio holdings and/or select securities from the universe from which the Semi-Transparent ETF’s investments are selected (“Strategy Components”); (2) liquid ETFs that convey information about the types of instruments (that are not otherwise fully represented by the Strategy Components) in which the Semi-Transparent ETF invests; and (3) cash and cash equivalents.
A Semi-Transparent ETF’s Tracking Basket structure may affect the price at which shares of the Semi-Transparent ETF trade in the secondary market. Although the Tracking Basket is intended to provide investors with enough information to allow for an effective arbitrage mechanism that will keep the market price of each Semi-Transparent ETF at or close to its NAV per share, there is a risk that market prices will vary significantly from NAV. The Semi-Transparent ETFs, which trade on the basis of a published Tracking Basket, may trade at a wider bid/ask spread than ETFs that publish their portfolios on a daily basis, and therefore, may cost investors more to trade. These risks may increase during periods of market disruption or volatility. In addition, although each Semi-Transparent ETF seeks to benefit from keeping its portfolio information secret, market participants may attempt to use the Tracking Basket to identify the Semi-Transparent ETF’s trading strategy. If successful, this could result in such market participants engaging in certain predatory trading practices that may have the potential to harm the Semi-Transparent ETF and its shareholders, such as front running the Semi-Transparent ETF’s trades of portfolio securities.
Arbitrage risk. (For Sustainable Leaders ETF and Sustainable Future ETF) Unlike ETFs that publicly disclose their complete portfolio holdings each business day, each Semi-Transparent ETF provides certain other information intended to allow market participants to estimate the value of positions in the Semi-Transparent ETF’s shares. Although this information is designed to facilitate arbitrage opportunities in the Semi-Transparent ETF’s shares to reduce bid/ask spreads and minimize discounts or premiums between the market price and NAV of the Semi-Transparent ETF shares, there is no guarantee the Semi-Transparent ETF’s arbitrage mechanism will operate as intended and that the Semi-Transparent ETF will not experience wide bid/ask spreads and/or large discounts or premiums to NAV. In addition, market participants may attempt to use the disclosed information to “reverse engineer” the Semi-Transparent ETF’s trading strategy, which, if successful, could increase opportunities for predatory trading practices that may have the potential to negatively impact the Semi-Transparent ETF’s performance.
Trading halt risk. (For Sustainable Leaders ETF and Sustainable Future ETF) There may be circumstances where a security held in a Semi-Transparent ETF’s portfolio but not in the Tracking Basket does not have readily available market quotations. If Putnam Management determines that such circumstance may affect the reliability of the Tracking Basket as an arbitrage vehicle, that information, along with the identity and weighting of that security in the Semi-Transparent ETF’s portfolio, will be publicly disclosed on the Semi-Transparent ETF’s website, and Putnam Management will assess appropriate remedial measures. In these circumstances, market participants may use this information to engage in certain predatory trading practices that may have the potential to harm the Semi-Transparent ETF and its shareholders. In addition, if securities representing 10% or more of the Semi-Transparent ETF’s portfolio do not have readily available market quotations, Putnam Management would promptly request the exchange to halt trading of the Semi-Transparent ETF, meaning that investors (including the fund) would not be able to trade their shares. Trading may also be halted in other circumstances, for example, due to market conditions.
The fund may not achieve its goal, and it is not intended to be a complete investment program. An investment in the fund is not insured or guaranteed by the Federal Deposit Insurance Corporation or any other government agency.
The performance information below gives some indication of the risks associated with an investment in the fund by showing the fund’s performance year to year and over time. Before February 10, 2023, the fund was managed with a materially different investment strategy and may have achieved materially different performance results under its current investment strategy from that shown for periods before this date. The bar chart does not reflect the impact of sales charges. If it did, performance would be lower. Please remember that past performance is not necessarily an indication of future results. Monthly performance figures for the fund are available at www.franklintempleton.com.
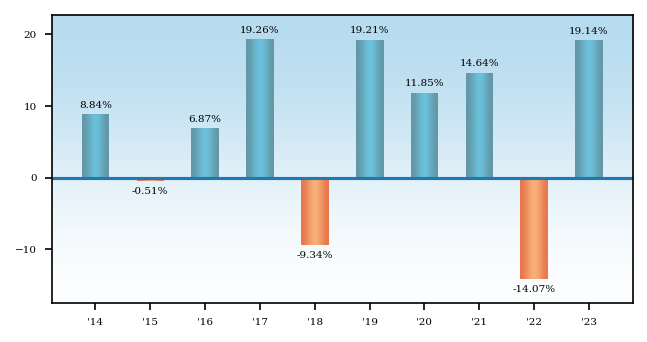
Average Annual Total Returns - Putnam Sustainable Retirement 2045 Fund |
1 Year |
5 Years |
10 Years |
|
|---|---|---|---|---|
| Class A 2045 | 12.29% | 8.08% | 6.32% | |
| Class A 2045 | After Taxes on Distributions | 11.48% | 6.07% | 4.51% | |
| Class A 2045 | After Taxes on Distributions and Sales | 7.42% | 5.89% | 4.48% | |
| Class C 2045 | 17.22% | 8.54% | 6.31% | |
| Class R 2045 | 18.64% | 8.99% | 6.64% | |
| Class R3 2045 | [1] | 18.94% | 9.26% | 6.87% |
| Class R4 2045 | [2] | 19.21% | 9.53% | 7.14% |
| Class R5 2045 | [3] | 19.41% | 9.68% | 7.27% |
| Class R6 2045 | [4] | 19.52% | 9.73% | 7.29% |
| Class Y 2045 | 19.42% | 9.65% | 7.23% | |
| Russell 3000® Index (no deduction for fees, expenses or taxes) | [5] | 25.96% | 15.16% | 11.48% |
| Bloomberg U.S. Aggregate Bond Index (no deduction for fees, expenses or taxes) | [5] | 5.53% | 1.10% | 1.81% |
| S&P Target Date To 2045 Index (no deduction for fees, expenses or taxes) | [5] | 19.57% | 10.31% | 7.39% |
| [1] | Performance for class R3 shares prior to their inception (1/4/21) is derived from the historical performance of class Y shares, adjusted for the higher 12b-1 fees and investor servicing fees applicable to class R3 shares (relative to the comparable fees applicable to class Y shares prior to the inception of class R3 shares). |
| [2] | Performance for class R4 shares prior to their inception (1/4/21) is derived from the historical performance of class Y shares, adjusted for the higher investor servicing fees applicable to class R4 shares (relative to the comparable fees applicable to class Y shares prior to the inception of class R4 shares). |
| [3] | Performance for class R5 shares prior to their inception (1/4/21) is derived from the historical performance of class R6 shares and has not been adjusted for the lower fund expenses applicable to class R5 shares (relative to the comparable expenses applicable to R6 shares prior to the inception of class R5 shares); had it, returns would have been higher. |
| [4] | Performance for class R6 shares prior to their inception (9/1/16) is derived from the historical performance of class Y shares and has not been adjusted for the lower investor servicing fees applicable to class R6 shares (relative to the comparable fees applicable to class Y shares prior to the inception of class R6 shares); had it, returns would have been higher. |
| [5] | The table above compares the fund’s returns to the performance of three indexes: (i) the Russell 3000® Index, a broad measure of market performance, (ii) the Bloomberg U.S. Aggregate Bond Index, a broad measure of market performance, and (iii) the S&P Target Date To 2045 Index, an additional index that the Investment Manager believes more closely reflects the fund’s principal investment objective and strategies. |
| Class C share performance reflects conversion to class A shares after eight years. |
| After-tax returns reflect the historical highest individual federal marginal income tax rates and do not reflect state and local taxes. Actual after-tax returns depend on an investor’s tax situation and may differ from those shown. After-tax returns are shown for class A shares only and will vary for other classes. These after-tax returns do not apply if you hold your fund shares through a 401(k) plan, an IRA, or another tax-advantaged arrangement. |
| The Russell 3000® Index measures the performance of the 3,000 largest U.S. companies based on total market capitalization. Source: FTSE. |
| Frank Russell Company is the source and owner of the trademarks, service marks and copyrights related to the Russell Indexes. Russell ® is a trademark of Frank Russell Company. |
| The Bloomberg U.S. Aggregate Bond Index is an unmanaged index of U.S. investment-grade fixed income securities. |
| All Bloomberg indices are provided by Bloomberg Index Services Limited. |
| BLOOMBERG® is a trademark and service mark of Bloomberg Finance L.P. and its affiliates (collectively “Bloomberg”). Bloomberg or Bloomberg’s licensors own all proprietary rights in the Bloomberg Indices. Neither Bloomberg nor Bloomberg’s licensors approve or endorse this material, or guarantees the accuracy or completeness of any information herein, or makes any warranty, express or implied, as to the results to be obtained therefrom, and to the maximum extent allowed by law, neither shall have any liability or responsibility for injury or damages arising in connection therewith. |
| The S&P Target Date To Index Series is designed to represent a small, style-specific derived consensus of asset class exposure and glide path for a specified list of target retirement dates. |
| Securities in the fund do not match those in the indexes and the performance of the fund will differ. |
Putnam Sustainable Retirement 2040 Fund seeks capital appreciation and current income consistent with a decreasing emphasis on capital appreciation and an increasing emphasis on current income as it approaches its target date.
The following tables describe the fees and expenses you may pay if you buy, hold, and sell shares of the fund. You may pay other fees, such as brokerage commissions and other fees to financial intermediaries, which are not reflected in the tables and examples below. You may qualify for sales charge discounts if you and your family invest, or agree to invest in the future, at least $50,000 in Putnam funds. More information about these and other discounts is available from your financial professional and in How do I buy fund shares? beginning on page 227 of the fund’s prospectus, in the Appendix to the fund’s prospectus, and in How to buy shares beginning on page II-3 of the fund’s statement of additional information (“SAI”).
Shareholder Fees - Putnam Sustainable Retirement 2040 Fund |
Class A 2040 |
Class C 2040 |
Class R 2040 |
Class R3 2040 |
Class R4 2040 |
Class R5 2040 |
Class R6 2040 |
Class Y 2040 |
||
|---|---|---|---|---|---|---|---|---|---|---|
| Maximum Sales Charge Imposed on Purchases (as a percentage of Offering Price) | 5.75% | none | none | none | none | none | none | none | ||
| Maximum Deferred Sales Charge (as a percentage) | 1.00% | [1] | 1.00% | [2] | none | none | none | none | none | none |
| [1] | Applies only to certain redemptions of shares bought with no initial sales charge. |
| [2] | This charge is eliminated after one year. |
Annual Fund Operating Expenses - Putnam Sustainable Retirement 2040 Fund |
Class A 2040 |
Class C 2040 |
Class R 2040 |
Class R3 2040 |
Class R4 2040 |
Class R5 2040 |
Class R6 2040 |
Class Y 2040 |
|
|---|---|---|---|---|---|---|---|---|---|
| Management Fees (as a percentage of Assets) | 0.50% | 0.50% | 0.50% | 0.50% | 0.50% | 0.50% | 0.50% | 0.50% | |
| Distribution and Service (12b-1) Fees | 0.25% | 1.00% | 0.50% | 0.25% | none | none | none | none | |
| Other Expenses (as a percentage of Assets): | 0.20% | 0.20% | 0.35% | 0.35% | 0.35% | 0.20% | 0.10% | 0.20% | |
| Acquired Fund Fees and Expenses | 0.51% | 0.51% | 0.51% | 0.51% | 0.51% | 0.51% | 0.51% | 0.51% | |
| Expenses (as a percentage of Assets) | 1.46% | 2.21% | 1.86% | 1.61% | 1.36% | 1.21% | 1.11% | 1.21% | |
| Fee Waiver or Reimbursement | [1] | (0.61%) | (0.61%) | (0.61%) | (0.61%) | (0.61%) | (0.61%) | (0.61%) | (0.61%) |
| Net Expenses (as a percentage of Assets) | 0.85% | 1.60% | 1.25% | 1.00% | 0.75% | 0.60% | 0.50% | 0.60% | |
| [1] | Reflects a contractual obligation of the Investment Manager to limit certain fund expenses through November 30, 2027. This obligation may be modified or discontinued only with approval of the Board of Trustees. |
The following hypothetical example is intended to help you compare the cost of investing in the fund with the cost of investing in other funds. It assumes that you invest $10,000 in the fund for the time periods indicated and then, except as indicated, redeem all your shares at the end of those periods. It assumes a 5% return on your investment each year and that the fund’s operating expenses remain the same. Only the first three years of each period in the example take into account the expense reimbursement described above. Your actual costs may be higher or lower.
Expense Example - Putnam Sustainable Retirement 2040 Fund - USD ($) |
Expense Example, with Redemption, 1 Year |
Expense Example, with Redemption, 3 Years |
Expense Example, with Redemption, 5 Years |
Expense Example, with Redemption, 10 Years |
Expense Example, No Redemption, 1 Year |
Expense Example, No Redemption, 3 Years |
Expense Example, No Redemption, 5 Years |
Expense Example, No Redemption, 10 Years |
|---|---|---|---|---|---|---|---|---|
| Class A 2040 | 657 | 831 | 1,153 | 2,063 | ||||
| Class C 2040 | 263 | 505 | 1,007 | 2,198 | 163 | 505 | 1,007 | 2,198 |
| Class R 2040 | 127 | 397 | 825 | 2,020 | ||||
| Class R3 2040 | 102 | 318 | 693 | 1,746 | ||||
| Class R4 2040 | 77 | 240 | 559 | 1,465 | ||||
| Class R5 2040 | 61 | 192 | 478 | 1,293 | ||||
| Class R6 2040 | 51 | 160 | 424 | 1,177 | ||||
| Class Y 2040 | 61 | 192 | 478 | 1,293 |
The fund pays transaction-related costs, such as commissions, when it buys and sells securities (or “turns over” its portfolio). A higher turnover rate may indicate higher transaction costs and may result in higher taxes when the fund’s shares are held in a taxable account. These costs, which are not reflected in annual fund operating expenses or the above example, affect fund performance. The fund’s turnover rate in the most recent fiscal year was 25%.
Investments
The fund is one of a series of target date funds that invest primarily in exchange-traded funds (“ETFs”) that focus on investments with positive sustainability or environmental, social, and governance (“ESG”) characteristics, referred to as underlying funds. The underlying funds include funds managed by Franklin Advisers, Inc. (“Franklin Advisers” or the “Investment Manager”), the fund’s investment manager, and funds managed by affiliated investment advisers. The fund’s asset allocation strategy may be attractive to investors who plan to retire or otherwise intend to begin making periodic withdrawals of their investments in or about 2040 (the target date). The fund is designed to provide diversification among different asset classes by investing its assets in the underlying funds.
Under normal circumstances, the fund will invest in underlying funds (which, for purposes of this policy, include money market mutual funds advised by the Investment Manager or its affiliates) such that, in the aggregate, it has indirect exposure to investments that meet each underlying fund’s respective sustainability or ESG criteria and that represent at least 80% of the value of its net assets. This policy is non-fundamental and may be changed only after 60 days’ notice to shareholders. The Investment Manager may not apply ESG or sustainability criteria to investments that are not subject to the fund’s 80% policy, and such investments may not meet the applicable ESG or sustainability criteria. Through its investments in underlying funds, the fund makes use of a range of ESG- and sustainability- oriented investment strategies and invests across a variety of asset classes. The ESG or sustainability criteria will differ across the underlying funds. These differences may arise both from differences in the underlying funds’ asset classes (such as the characteristics of non-U.S. versus U.S. issuers, or the structural differences (e.g., position in the capital structure) between equity and fixed-income investments) as well as from different managers’ styles. In implementing an underlying fund’s investment strategy, the portfolio managers of the underlying fund may apply and weigh different ESG criteria differently than the portfolio managers of the other underlying funds. There are also expected to be differences in how the portfolio managers of the underlying funds source ESG-related or sustainability-oriented research (e.g., proprietary versus third-party research) and/or their approach to selecting companies based on ESG or sustainability criteria.
The fund’s target allocations among asset classes and underlying funds will increasingly emphasize capital preservation and income over time and will change gradually based on the number of remaining years until the fund’s target date, as shown in the predetermined “glide path” in the chart under “What are the funds’ and each underlying fund’s main investment strategies and related risks?” The Investment Manager adjusts these allocations at the end of each calendar quarter based on the glide path.
Pending investment in underlying funds, the fund also expects to temporarily invest cash balances resulting from purchase activity by fund shareholders in Putnam Government Money Market Fund, a mutual fund sponsored by the Investment Manager, or in cash or cash equivalents. The fund also expects to invest a portion of its assets in Putnam Government Money Market Fund or in cash or cash equivalents in order to manage shareholder redemptions. The percentage of a fund invested in Putnam Government Money Market Fund is expected to vary over time and will depend on the level of purchase and redemption activity by fund shareholders.
The following table presents your fund’s approximate allocations to each asset class and underlying fund as of September 30, 2024 (taking into account any tactical adjustments described below) and its projected approximate allocations to those asset classes and underlying funds as of September 30, 2025. The table does not reflect temporary investments in Putnam Government Money Market Fund or in cash or cash equivalents. By comparing the percentage allocations of your fund in the table, you can see how its allocations are expected to change during the one-year period beginning on September 30, 2024. The table also shows the approximate allocations of other Putnam Sustainable Retirement Funds, which are designed for investors with different target retirement dates. Over a five-year period, each fund’s allocations will gradually change to resemble the allocations of the fund with the next earliest target date. The table illustrates how a fund’s allocations are expected to change over time to increasingly emphasize capital preservation and income.
| Underlying Fund* | Year | 2065 | 2060 | 2055 | 2050 | 2045 | 2040 (your fund) | 2035 | 2030 | 2025 | Maturity Fund |
| Putnam Sustainable Leaders ETF | 2024 | 48.6% | 47.2% | 44.8% | 42.3% | 39.7% | 36.4% | 31.7% | 21.0% | 14.9% | 14.1% |
| 2025 | 47.6% | 45.8% | 43.3% | 40.7% | 38.4% | 35.2% | 30.3% | 18.6% | 14.3% | 14.1% | |
| Putnam Sustainable Future ETF | 2024 | 23.8% | 23.1% | 21.9% | 20.6% | 19.4% | 17.9% | 15.8% | 10.5% | 7.5% | 7.1% |
| 2025 | 23.8% | 22.9% | 21.7% | 20.4% | 19.2% | 17.6% | 15.2% | 9.3% | 7.1% | 7.1% | |
| Putnam PanAgora ESG Inter-national Equity ETF | 2024 |
17.8% | 17.3% | 16.4% | 15.5% | 14.4% | 12.4% | 9.6% | 6.3% | 4.5% | 4.2% |
| 2025 | 17.8% | 17.2% | 16.2% | 15.3% | 14.2% | 11.9% | 9.1% | 5.6% | 4.3% | 4.2% | |
| Putnam PanAgora ESG Emer-ging Markets Equity ETF | 2024 |
4.9% | 4.8% | 4.5% | 4.2% | 3.8% | 2.2% | 0.1% | 0.0% | 0.0% | 0.0% |
| 2025 | 5.9% | 5.7% | 5.4% | 5.1% | 4.5% | 2.2% | 0.0% | 0.0% | 0.0% | 0.0% | |
| Putnam ESG Core Bond ETF | 2024 | 3.3% | 5.3% | 8.9% | 12.4% | 15.4% | 23.0% | 33.5% | 49.7% | 52.3% | 51.7% |
| 2025 | 3.3% | 5.9% | 9.7% | 13.0% | 16.1% | 24.8% | 35.4% | 53.4% | 51.8% | 51.7% | |
| Putnam ESG High Yield ETF | 2024 | 1.1% | 1.8% | 3.0% | 4.1% | 4.9% | 4.8% | 4.9% | 6.7% | 14.8% | 16.9% |
| 2025 | 1.1% | 2.0% | 3.2% | 4.3% | 4.9% | 4.8% | 5.3% | 7.1% | 16.5% | 16.9% | |
| Putnam ESG Ultra Short ETF | 2024 | 0.5% | 0.5% | 0.5% | 0.9% | 2.4% | 3.3% | 4.4% | 5.8% | 6.0% | 6.0% |
| 2025 | 0.5% | 0.5% | 0.5% | 1.2% | 2.7% | 3.5% | 4.7% | 6.0% | 6.0% | 6.0% | |
| Total Equity** | 2024 | 95.1% | 92.4% | 87.6% | 82.6% | 77.3% | 68.9% | 57.2% | 37.8% | 26.9% | 25.4% |
| 2025 | 95.1% | 91.6% | 86.6% | 81.5% | 76.3% | 66.9% | 54.6% | 33.5% | 25.7% | 25.4% | |
| Total Fixed Income** | 2024 | 4.9% | 7.6% | 12.4% | 17.4% | 22.7% | 31.1% | 42.8% | 62.2% | 73.1% | 74.6% |
| 2025 | 4.9% | 8.4% | 13.4% | 18.5% | 23.7% | 33.1% | 45.4% | 66.5% | 74.3% | 74.6% |
| * | Due to rounding, allocations shown in the table above may not total 100%. In addition, because of rounding in the calculation of allocations among underlying funds and market fluctuations, actual allocations might be more or less than these percentages. |
| ** | Equity and fixed-income allocations are hypothetical estimates based on an assumption that each of Putnam Sustainable Leaders ETF, Putnam Sustainable Future ETF, Putnam PanAgora ESG International Equity ETF, and Putnam PanAgora ESG Emerging Markets Equity ETF is equivalent to an equity investment and each of Putnam ESG Core Bond ETF, Putnam ESG High Yield ETF and Putnam ESG Ultra Short ETF is equivalent to a fixed-income investment. Actual allocations will vary. |
The fund’s target allocations may differ from the allocations shown in the table. The Investment Manager may change the glide path, the fund’s target allocations, and the underlying funds in which it invests at any time, although the Investment Manager generally expects these changes (other than the tactical adjustments described below) to be infrequent and generally in response to longer-term structural changes (e.g., in the average retirement age or life expectancy) that lead the fund’s portfolio managers to determine that a change is advisable. The Investment Manager may also make tactical adjustments from time to time in the fund’s allocations to underlying funds in response to market conditions within a range of +/- 15% from the allocations to fixed-income and equity asset classes as presented in the fund’s glide path.
It is assumed that investors will begin gradual withdrawals from the fund at around the target date. Near the end of the target date year, the fund’s target allocations will correspond to those of Putnam Sustainable Retirement Maturity Fund (“Maturity Fund”), a fund that seeks as high a rate of current income as the Investment Manager believes is consistent with preservation of capital, and the fund will be merged into Maturity Fund. More information about Maturity Fund is available in the prospectus beginning on page 171, and more information about the underlying funds (which are not offered by this prospectus) is included below and under “What are the funds’ and each underlying fund’s main investment strategies and related risks?”
Information about each underlying fund’s investment strategy
Putnam Sustainable Leaders ETF (“Sustainable Leaders ETF”)
Sustainable Leaders ETF invests mainly in common stocks of U.S. companies of any size, with a focus on companies that Putnam Investment Management, LLC (“Putnam Management”), Sustainable Leaders ETF’s investment manager, believes exhibit a commitment to financially material sustainable business practices. Sustainable Leaders ETF may also invest in non-U.S. companies. In evaluating investments for Sustainable Leaders ETF, Putnam Management views “financially material sustainable business practices” as business practices that it believes are reasonably likely to impact the financial condition or operating performance of a company and that relate to environmental, social, or corporate governance issues.
Under normal circumstances, Sustainable Leaders ETF invests at least 80% of the value of its net assets in securities that meet Putnam Management’s sustainability criteria. For a further discussion of Sustainable Leaders ETF’s investment strategy, please turn to the section What are the funds’ and each underlying fund’s main investment strategies and related risks? beginning on page 189.
Putnam Sustainable Future ETF (“Sustainable Future ETF”)
Sustainable Future ETF invests mainly in common stocks of U.S. companies of any size, with a focus on companies whose products and services Putnam Management, Sustainable Future ETF’s investment manager, believes provide solutions that directly contribute to sustainable social, environmental and economic development (Solutions Companies).
Under normal circumstances, Sustainable Future ETF invests at least 80% of the value of its net assets in securities that meet Putnam Management’s sustainability criteria. For a further discussion of Sustainable Future ETF’s investment strategy, please turn to the section What are the funds’ and each underlying fund’s main investment strategies and related risks? beginning on page 189.
Putnam PanAgora ESG International Equity ETF (“PanAgora International Equity ETF”)
PanAgora International Equity ETF invests mainly in common stocks (growth or value stocks or both) of companies of any size outside the United States with a focus on companies that PanAgora International Equity ETF’s subadviser, PanAgora Asset Management, Inc. (“PanAgora”), believes offer attractive benchmark-relative
returns and exhibit positive ESG metrics. Under normal circumstances, PanAgora International Equity ETF invests at least 80% of its net assets in equity securities of companies that meet PanAgora’s ESG criteria. For a further discussion of PanAgora International Equity ETF’s investment strategy, please turn to the section What are the funds’ and each underlying fund’s main investment strategies and related risks? beginning on page 189.
Putnam PanAgora ESG Emerging Markets Equity ETF (“PanAgora Emerging Markets Equity ETF”)
PanAgora Emerging Markets Equity ETF invests mainly in common stocks (growth or value stocks or both) of emerging markets companies of any size with a focus on companies that PanAgora Emerging Markets Equity ETF’s subadviser, PanAgora, believes offer attractive benchmark-relative returns and exhibit positive ESG metrics. Under normal circumstances, PanAgora Emerging Markets Equity ETF invests at least 80% of its net assets in equity securities of emerging markets companies that meet PanAgora’s ESG criteria. For a further discussion of PanAgora Emerging Markets Equity ETF’s investment strategy, please turn to the section What are the funds’ and each underlying fund’s main investment strategies and related risks? beginning on page 189.
Putnam ESG Core Bond ETF (“Core Bond ETF”)
Core Bond ETF invests mainly in a diversified portfolio of investment-grade fixed-income securities with a focus on companies or issuers that Franklin Advisers, Core Bond ETF’s investment manager, believes meet relevant ESG criteria on a sector-specific basis. Under normal circumstances, Core Bond ETF invests at least 80% of the value of its net assets in fixed-income securities that meet Franklin Advisers’ ESG criteria. For a further discussion of Core Bond ETF’s investment strategy, please turn to the section What are the funds’ and each underlying fund’s main investment strategies and related risks? beginning on page 189.
Putnam ESG High Yield ETF (“High Yield ETF”)
High Yield ETF invests mainly in bonds that are below investment grade in quality (sometimes referred to as “junk bonds”) with a focus on companies or issuers that Franklin Advisers, High Yield ETF’s investment manager, believes meet relevant ESG criteria on a sector-specific basis. High Yield ETF invests mainly in bonds that also have one or more of the following characteristics: (1) are obligations of U.S. companies or issuers and (2) have intermediate- to long-term maturities (three years or longer). Under normal circumstances, High Yield ETF invests at least 80% of the value of its net assets in fixed-income securities rated below investment grade that meet Franklin Advisers’ ESG criteria. For a further discussion of High Yield ETF’s investment strategy, please turn to the section What are the funds’ and each underlying fund’s main investment strategies and related risks? beginning on page 189.
Putnam ESG Ultra Short ETF (“Ultra Short ETF”)
Ultra Short ETF invests in a diversified short duration portfolio of fixed-income securities comprised of investment-grade money market and other fixed-income securities, including U.S. dollar-denominated foreign securities of these types, with a focus on companies or issuers that Franklin Advisers, Ultra Short ETF’s investment manager, believes meet relevant ESG criteria, on a sector-specific basis. Under normal circumstances, Ultra Short ETF invests at least 80% of the value of its net assets in fixed-income securities that meet Franklin Advisers’ ESG criteria. For a further discussion of Ultra Short ETF’s investment strategy, please turn to the section What are the funds’ and each underlying fund’s main investment strategies and related risks? beginning on page 189.
It is important to understand that you can lose money by investing in the fund. Losses may occur near, at or after the target date. There is no guarantee that the fund will provide adequate income at and through an investor’s retirement.
The fund’s allocation of assets among asset classes and the underlying funds may hurt performance. An underlying fund may change its investment program or policies without the fund’s approval, which could require the fund to reduce or eliminate its allocation to the underlying fund at an unfavorable time.
The fund invests in underlying funds and indirectly bears expenses related to the underlying funds. However, the Investment Manager has contractually agreed to waive fees, reimburse expenses of, or reimburse the fund through at least November 30, 2027 in an amount equal to the fund’s acquired fund fees and expenses (e.g., the fees and expenses incurred by the fund as a result of its investments in the underlying funds). The Investment Manager also has contractually agreed to waive fees and/or reimburse expenses of each class of shares of the fund through at least November 30, 2027 in an amount sufficient to result in total annual fund operating expenses for class A, C, R, R3, R4, R5, R6 and Y shares of the fund (exclusive of payments under the fund’s distribution plans, brokerage, interest, taxes, investment-related expenses, acquired fund fees and expenses, and extraordinary expenses) that equal 0.60%, 0.60%, 0.75%, 0.75%, 0.75%, 0.60%, 0.50%, and 0.60%, respectively, of the fund’s average net assets.
Pending investment in underlying funds, the fund also expects to temporarily invest cash balances resulting from purchase activity by fund shareholders in Putnam Government Money Market Fund, a money market mutual fund sponsored by the Investment Manager, or in cash or cash equivalents. In addition, the fund expects to invest a portion of its assets in Putnam Government Money Market Fund or in cash or cash equivalents in order to manage shareholder redemptions. Large positions in Putnam Government Money Market Fund or in cash or cash equivalents may dampen performance and may prevent the fund from achieving its goal. These practices may be subject to other risks, as described under Miscellaneous Investments, Investment Practices and Risks in the SAI.
The fund also bears the risks associated with the underlying funds identified below. The relative significance of these risks will vary over time based on the fund’s target allocations to the underlying funds and to equity and fixed-income asset classes, which may change from time to time as discussed above.
Investment Strategy-Related Risks of the Underlying Funds
Sustainability and ESG investing risk. Investing in underlying funds with an ESG or sustainability focus may result in the fund having exposure to underlying funds that invest in certain types of companies, issuers, industries or sectors that the market may not favor. In evaluating an investment opportunity for the underlying funds, Franklin Advisers, Putnam Management or PanAgora may make investment decisions without the availability of optimal ESG-related data (which may be even less available with securitized debt instruments) or based on information and data that is incomplete or inaccurate. Sustainability and ESG metrics are not uniformly defined, and applying such metrics involves subjective assessments. Sustainability and ESG scorings and assessments of issuers can vary across third-party data providers and may change over time. Franklin Advisers, Putnam Management and PanAgora do not rely exclusively on third-party data providers in evaluating sustainability and ESG criteria for the underlying funds. ESG information from third-party data providers may be incomplete, inaccurate or unavailable, particularly with respect to companies in emerging market countries, which may adversely impact the investment process. In addition, the business practices, products or services of issuers in which an underlying fund invests may change over time. As a result of these possibilities, among others, an underlying fund may temporarily hold securities that are inconsistent with the underlying fund’s ESG or sustainability investment criteria. Regulatory changes or interpretations regarding the definitions and/or use of ESG and/or sustainability criteria could have a material adverse effect on the underlying fund’s ability to invest in accordance with its investment policies and/or achieve its investment objective. The underlying funds do not restrict investments based solely on “negative screens”, and the underlying fixed-income funds do not restrict their fixed-income investments to “green bonds” (e.g., U.S. dollar-denominated bonds designated as “green” by the Climate Bonds Initiative). For the underlying funds that pursue fixed-income investment strategies, because fixed-income investments generally represent a promise to pay principal and interest by an issuer, and not an ownership interest, and may involve complex structures, ESG-related investment considerations may have a more limited impact on risk and return (or may have an impact over a different investment time horizon) relative to other asset classes, and this may be particularly true for shorter-term investments. In addition, holders of fixed-income investments do not typically have voting rights, unlike holders of equity investments who have the right to vote on issuer proposals.
Market risk. The value of investments in the underlying funds’ portfolios may fall or fail to rise over extended periods of time for a variety of reasons, including general economic, political or financial market conditions, investor sentiment and market perceptions, government actions, geopolitical events or changes, outbreaks of infectious illnesses or other widespread public health issues (including epidemics and
pandemics), and factors related to a specific issuer, geography, industry or sector. These and other factors may lead to increased volatility and reduced liquidity in the underlying funds’ portfolio holdings, may negatively impact the fund’s performance, and may exacerbate other risks to which the fund is subject.
Common stock risk. (For all underlying funds except Core Bond ETF, High Yield ETF and Ultra Short ETF) Common stock represents an ownership interest in a company. The value of a company’s stock may fall or fail to rise as a result of factors directly relating to that company, such as decisions made by its management or lower demand for the company’s products or services. A stock’s value may also fall because of factors affecting not just the company, but also other companies in the same industry or in a number of different industries, such as increases in production costs.
| Growth investing risk.. Growth stocks may be more susceptible to earnings disappointments, and the market may not favor growth-style investing. |
| Value investing risk. Value stocks may fail to rebound, and the market may not favor value-style investing. Companies whose stocks we believe are undervalued by the market may have experienced adverse business developments or may be subject to special risks that have caused their stocks to be out of favor. |
| Small and midsize companies risk. Stocks of small and midsize companies often trade in smaller volumes, and their prices may fluctuate more than stocks of larger companies. Stocks of these companies may therefore be more vulnerable to adverse developments than those of larger companies. |
Industry or sector concentration risk. (For all underlying funds except Core Bond ETF, High Yield ETF and Ultra Short ETF) From time to time, an underlying fund may invest a significant portion of its assets in companies in one or more related industries or sectors, which would make the underlying fund more vulnerable to adverse developments affecting those industries or sectors.
Model and data risk. (For all underlying funds except Sustainable Leaders ETF, Sustainable Future ETF and High Yield ETF) If the quantitative models or data that are used in managing an underlying fund prove to be incorrect or incomplete, investment decisions made in reliance on the models or data may not produce the desired results, and the underlying fund may realize losses. Additionally, market movements are likely to change the risk levels and risk allocations of the underlying fund. Investments made based on quantitative models may perform differently from the market as a whole.
Foreign investment risk. (For all underlying funds except Ultra Short ETF, Sustainable Leaders ETF and Sustainable Future ETF) The value of international investments traded in foreign currencies may be adversely impacted by fluctuations in exchange rates. International investments, particularly investments in emerging markets, may carry risks associated with potentially less stable economies or governments (such as the risk of seizure by a foreign government, the imposition of currency or other restrictions, or high levels of inflation), and may be or become
illiquid. There may be less publicly-available information, or less reliable publicly-available information, about foreign companies (including information related to companies’ ESG practices), particularly with respect to emerging market companies, than publicly-available information regarding U.S. companies. As a result, an underlying fund’s ability to evaluate a foreign company, including with respect to its ESG or sustainability practices, may be more limited than its ability to evaluate a U.S. company.
Geographic focus risk. (For PanAgora International Equity ETF and PanAgora Emerging Markets Equity ETF) From time to time, an underlying fund may invest a significant portion of its assets in companies in one or more related geographic regions, industries or sectors, such as European and Asian countries, which would make the fund more vulnerable to adverse developments affecting those geographic regions, industries or sectors, including political, economic, or other developments adversely impacting ESG or sustainable investing.
Fixed-income investments risk. (For Core Bond ETF, High Yield ETF and Ultra Short ETF) The risks associated with fixed-income investments include interest rate risk, which is the risk that the value of an underlying fund’s investments is likely to fall if interest rates rise. Fixed-income investments are also subject to credit risk, which is the risk that the issuer of a fixed-income investment may default on payment of interest or principal. Credit risk is generally greater for debt not backed by the full faith and credit of the U.S. government, and interest rate risk is generally greater for longer-term debt. Fixed-income investments may be more susceptible to downgrades or defaults during economic downturns or other periods of economic stress. Mortgage-backed investments, unlike traditional debt investments, are also subject to prepayment risk, which means that they may increase in value less than other bonds when interest rates decline and decline in value more than other bonds when interest rates rise. The underlying fund may have to invest the proceeds from prepaid investments, including mortgage-backed investments, in other investments with less attractive terms and yields. The underlying fund’s investments in mortgage-backed securities, and in certain other securities and derivatives, may be or become illiquid. The underlying fund’s investments in mortgage-backed securities may make the underlying fund’s net asset value more susceptible to economic, market, political and other developments affecting the residential and commercial real estate markets and the servicing of mortgage loans secured by real estate properties. During periods of difficult economic conditions, delinquencies and losses on commercial mortgage-backed investments in particular generally increase, including as a result of the effects of those conditions on commercial real estate markets, the ability of commercial tenants to make loan payments, and the ability of a property to attract and retain commercial tenants.
One of the underlying funds, Putnam High Yield ETF, invests mostly in higher-yield, higher-risk debt investments that are rated below BBB or its equivalent at the time of purchase by any nationally recognized securities rating agency rating such investments, or in unrated investments that Franklin Advisers believes are of comparable quality. The underlying fund may invest up to 15% of the underlying
fund’s total assets in debt investments rated below CCC or its equivalent, at the time of purchase, by each rating agency rating such investments, or in unrated investments that Franklin Advisers believes are of comparable quality. This includes investments in the lowest rating category of the rating agency. The underlying fund will not necessarily sell an investment if its rating is reduced after Franklin Advisers buys it. Investments rated below BBB or its equivalent are below-investment-grade in quality. This rating reflects a greater possibility that the issuers may be unable to make timely payments of interest and principal and thus default. If a default occurs, or is perceived as likely to occur, the value of the investment will usually be more volatile and is likely to fall. The value of a debt instrument may also be affected by changes in, or perceptions of, the financial condition of the issuer, borrower, counterparty, or other entity, or underlying collateral or assets, or changes in, or perceptions of, specific or general market, economic, industry, political, regulatory, geopolitical, environmental, public health, and other conditions. A default or expected default could also make it difficult for the underlying fund to sell the investment at a price approximating the value Franklin Advisers had previously placed on it. Lower-rated debt usually has a more limited market than higher-rated debt, which may at times make it difficult for the underlying fund to buy or sell certain debt instruments or to establish their fair values.
Derivatives risk. (For all underlying funds except PanAgora International Equity ETF, PanAgora Emerging Markets Equity ETF, Sustainable Leaders ETF and Sustainable Future ETF) An underlying fund’s use of derivatives may increase the risks of investing in the underlying fund by increasing investment exposure (which may be considered leverage) or, in the case of many over-the-counter instruments, because of the potential inability to terminate or sell derivatives positions and the potential failure of the other party to the instrument to meet its obligations. The risk of a party failing to meet its obligations may increase if the fund has significant investment exposure to that counterparty. The value of derivatives may move in unexpected ways due to unanticipated market movements, the use of leverage, imperfect correlation between the derivative instrument and the reference asset, or other factors, especially in unusual market conditions, and volatility in the value of derivatives could adversely impact the underlying fund’s returns, obligations and exposures. Derivatives are also subject to other risks, including liquidity risk (e.g., liquidity demands arising from the requirement to make payments to a derivative counterparty), operational risk (e.g., settlement issues or system failure), and legal risk (e.g., insufficient legal documentation or contract enforceability issues).
Floating rate obligations risk. (For Core Bond ETF, High Yield ETF and Ultra Short ETF) To the extent an underlying fund holds floating rate loans, interest rate risk may be reduced but will not be eliminated. While floating rate loans are normally secured by specific collateral or assets of the issuer (so that holders of the loans, such as the underlying fund, will have a priority claim on those assets in the event of default or bankruptcy of the issuer), the value of collateral may be insufficient to meet the issuer’s obligations, and the underlying fund’s access to collateral may be limited by bankruptcy or other insolvency laws. The settlement period (the period
between the execution of the trade and the delivery of cash to the purchaser) for floating rate loan transactions is typically longer than seven days, and it is possible that sale proceeds from floating rate loan transactions will not be available to meet redemption obligations.
Portfolio turnover rate risk. From time to time an underlying fund may engage in frequent trading. Funds with high turnover may be more likely to realize capital gains that must be distributed to shareholders as taxable income. High turnover may also cause a fund to pay more brokerage commissions and to incur other transaction costs (including imputed transaction costs), which may detract from performance. A fund’s portfolio turnover rate and the amount of brokerage commissions it pays and transaction costs it incurs will vary over time based on market conditions.
Management and operational risk. There is no guarantee that the investment techniques, analyses, or judgments that Franklin Advisers, Putnam Management or PanAgora, as applicable, applies in making investment decisions for the underlying funds will produce the intended outcome or that the investments they select for the underlying funds will perform as well as other securities that were not selected for the underlying funds. Franklin Advisers, Putnam Management, PanAgora, or the underlying funds’ other service providers, may experience disruptions or operating errors that could negatively impact the underlying funds.
Risks Related to Investing in ETFs
As ETFs, shares of the underlying funds are traded in the secondary market. Prior to trading in the secondary market, shares of the underlying funds are “created” at NAV by market makers, large investors and institutions (collectively, “authorized participants”) only in creation units. A creation transaction generally takes place when an authorized participant deposits into an underlying fund a designated portfolio of securities, assets or other positions (a “creation basket”), and an amount of cash (including any cash representing the value of substituted securities, assets or other positions), if any, in exchange for a specified number of creation units. Similarly, shares of an underlying fund can be redeemed only in creation units, generally for a designated portfolio of securities, assets or other positions held by the underlying fund and an amount of cash (including any portion of such securities for which cash may be substituted), if any.
Fluctuation of net asset value (“NAV”) and share price risk. Shares of the underlying funds may trade at a larger premium or discount to their NAV than shares of other ETFs. The NAV of an underlying fund will generally fluctuate with changes in the market value of the underlying fund’s holdings. Underlying fund shares can be bought and sold in the secondary market at market prices. Disruptions to creations and redemptions, the existence of extreme market volatility or potential lack of an active trading market for an underlying fund’s shares may result in the underlying fund’s shares trading significantly above (at a premium) or below (at a discount) to NAV or to the intraday value of the underlying fund’s holdings. In addition, in stressed market conditions or periods of market disruption or volatility, the market for shares of the
underlying funds may become less liquid in response to deteriorating liquidity in the markets for the underlying funds’ portfolio holdings.
Authorized participant concentration risk. Only an authorized participant may engage in creation and redemption transactions directly with an underlying fund. Your fund is not an authorized participant and can only purchase and sell underlying fund shares in the secondary market at market prices or through an authorized participant. The underlying fund may have a limited number of financial institutions that act as authorized participants, none of which are obligated to engage in creation and/or redemption transactions. To the extent that those authorized participants do not engage in creation and redemption orders, there may be a significantly diminished trading market for underlying fund shares, or underlying fund shares may trade at a discount (or premium) to NAV and possibly face trading halts and/or de-listing.
Trading issues risk. The underlying funds have a limited public trading history. Sustainable Leaders ETF and Sustainable Future ETF began trading publicly in May 2021, while PanAgora International Equity ETF, PanAgora Emerging Markets Equity ETF, Core Bond ETF, High Yield ETF, and Ultra Short ETF began trading publicly in January 2023. There can be no assurance that an active trading market will develop or be maintained or that the market for underlying fund shares will operate as intended, which could lead to the underlying funds’ shares trading at wider spreads and larger premiums and discounts to NAV than other actively managed ETFs. As a result, it may cost the fund more to trade underlying fund shares than shares of other ETFs. There is no guarantee that the underlying fund will be able to attract market makers and authorized participants. Market makers and authorized participants are not obligated to make a market in the underlying fund’s shares or to submit purchase and redemption orders for creation units.
The market prices of an underlying fund’s shares are expected to fluctuate, in some cases materially, in response to changes in the underlying fund’s NAV, the intraday value of the underlying fund’s holdings and supply and demand for the underlying fund’s shares. Each underlying fund’s respective investment manager cannot predict whether an underlying fund’s shares will trade above, below or at their NAV or the intraday value of the underlying fund’s holdings. During periods when an underlying fund is trading below its NAV, the fund may incur significant losses if it sells its underlying fund shares.
The securities held by an underlying fund may be traded in markets that close at a different time than the exchange on which the underlying fund’s shares are listed. Liquidity in those securities may be reduced after the applicable closing times. Accordingly, during the time when the exchange is open but after the applicable market closing, fixing or settlement times, bid-ask spreads on the exchange and the corresponding premium or discount to the NAV of the underlying funds’ shares may widen.
Large shareholder risk. Each underlying fund may be an investment option for mutual funds that are managed by Franklin Resources, Inc. (“Franklin Templeton”) and its affiliates as “funds of funds.” Additionally, other investors from time to time may make substantial investments in an underlying fund, including affiliates of Franklin Templeton, through seed capital arrangements. Such shareholders may at times be considered to control an underlying fund. Dispositions of a large number of shares by these shareholders may adversely affect an underlying fund’s liquidity and net assets to the extent such transactions are executed directly with the underlying fund in the form of redemptions through an authorized participant, rather than executed in the secondary market. These redemptions may also force an underlying fund to sell securities, which may increase the underlying fund’s brokerage costs. In addition, underlying fund returns may be adversely affected if an underlying fund holds a portion of its assets in liquid, cash-like investments in connection with or in anticipation of shareholder redemptions. To the extent these large shareholders transact in shares of an underlying fund on the secondary market, such transactions may account for a large percentage of the trading volume on the exchange and may, therefore, have a material effect (upward or downward) on the market price of the underlying fund’s shares.
Cash transactions risk. Some of the underlying funds may effect creations and redemptions in cash or partially in cash. Therefore, an underlying fund may be required to sell portfolio securities, incur transaction costs, and subsequently recognize gains on such sales that the underlying fund might not have recognized if it were to distribute portfolio securities in-kind. As such, investments by a fund in an underlying fund’s shares may be less tax-efficient than an investment in an ETF that distributes portfolio securities entirely in-kind. An underlying fund may also incur transaction costs in connection with creations effected in cash (in whole or in part).
Semi-transparent ETF risk. (For Sustainable Leaders ETF and Sustainable Future ETF) Two of the underlying funds, Putnam Sustainable Leaders ETF and Putnam Sustainable Future ETF (the “Semi-Transparent ETFs”), are different from traditional ETFs, including the other underlying funds. Traditional ETFs disclose to the public what assets they hold each day. However, the Semi-Transparent ETFs do not. This may create additional risks for an investment in the Semi-Transparent ETFs, including that an investor may have to pay more money to trade the Semi-Transparent ETF’s shares in light of the fact that the Semi-Transparent ETF will provide less information to traders, who tend to charge more for trades when they have less information. The price an investor pays to buy or sell an ETF’s shares on an exchange may not match the value of the ETF’s portfolio, and these price differences may be greater for the Semi-Transparent ETFs compared to other ETFs because they provide less information to traders. These additional risks may be even greater in adverse or uncertain market conditions.
The differences between the Semi-Transparent ETFs and other ETFs may also have advantages. By keeping certain information about the Semi-Transparent ETFs secret, a Semi-Transparent ETF may face less risk that other traders can predict or copy its investment strategy. This may improve the Semi-Transparent ETF’s performance.
If other traders are able to copy or predict the Semi-Transparent ETF’s investment strategy, however, this may hurt the Semi-Transparent ETF’s performance.
Tracking basket structure risk. (For Sustainable Leaders ETF and Sustainable Future ETF) The Semi-Transparent ETFs are actively managed ETFs that operate pursuant to an exemptive order from the Securities and Exchange Commission and do not publicly disclose their complete portfolio holdings each business day. Instead, each Semi-Transparent ETF publishes each business day on its website a “Tracking Basket,” which is designed to closely track the daily performance of the Semi-Transparent ETF but is not the Semi-Transparent ETF’s actual portfolio. The Tracking Basket is comprised of: (1) select recently disclosed portfolio holdings and/or select securities from the universe from which the Semi-Transparent ETF’s investments are selected (“Strategy Components”); (2) liquid ETFs that convey information about the types of instruments (that are not otherwise fully represented by the Strategy Components) in which the Semi-Transparent ETF invests; and (3) cash and cash equivalents.
A Semi-Transparent ETF’s Tracking Basket structure may affect the price at which shares of the Semi-Transparent ETF trade in the secondary market. Although the Tracking Basket is intended to provide investors with enough information to allow for an effective arbitrage mechanism that will keep the market price of each Semi-Transparent ETF at or close to its NAV per share, there is a risk that market prices will vary significantly from NAV. The Semi-Transparent ETFs, which trade on the basis of a published Tracking Basket, may trade at a wider bid/ask spread than ETFs that publish their portfolios on a daily basis, and therefore, may cost investors more to trade. These risks may increase during periods of market disruption or volatility. In addition, although each Semi-Transparent ETF seeks to benefit from keeping its portfolio information secret, market participants may attempt to use the Tracking Basket to identify the Semi-Transparent ETF’s trading strategy. If successful, this could result in such market participants engaging in certain predatory trading practices that may have the potential to harm the Semi-Transparent ETF and its shareholders, such as front running the Semi-Transparent ETF’s trades of portfolio securities.
Arbitrage risk. (For Sustainable Leaders ETF and Sustainable Future ETF) Unlike ETFs that publicly disclose their complete portfolio holdings each business day, each Semi-Transparent ETF provides certain other information intended to allow market participants to estimate the value of positions in the Semi-Transparent ETF’s shares. Although this information is designed to facilitate arbitrage opportunities in the Semi-Transparent ETF’s shares to reduce bid/ask spreads and minimize discounts or premiums between the market price and NAV of the Semi-Transparent ETF shares, there is no guarantee the Semi-Transparent ETF’s arbitrage mechanism will operate as intended and that the Semi-Transparent ETF will not experience wide bid/ask spreads and/or large discounts or premiums to NAV. In addition, market participants may attempt to use the disclosed information to “reverse engineer” the Semi-Transparent ETF’s trading strategy, which, if successful, could increase opportunities for predatory trading practices that may have the potential to negatively impact the Semi-Transparent ETF’s performance.
Trading halt risk. (For Sustainable Leaders ETF and Sustainable Future ETF) There may be circumstances where a security held in a Semi-Transparent ETF’s portfolio but not in the Tracking Basket does not have readily available market quotations. If Putnam Management determines that such circumstance may affect the reliability of the Tracking Basket as an arbitrage vehicle, that information, along with the identity and weighting of that security in the Semi-Transparent ETF’s portfolio, will be publicly disclosed on the Semi-Transparent ETF’s website, and Putnam Management will assess appropriate remedial measures. In these circumstances, market participants may use this information to engage in certain predatory trading practices that may have the potential to harm the Semi-Transparent ETF and its shareholders. In addition, if securities representing 10% or more of the Semi-Transparent ETF’s portfolio do not have readily available market quotations, Putnam Management would promptly request the exchange to halt trading of the Semi-Transparent ETF, meaning that investors (including the fund) would not be able to trade their shares. Trading may also be halted in other circumstances, for example, due to market conditions.
The fund may not achieve its goal, and it is not intended to be a complete investment program. An investment in the fund is not insured or guaranteed by the Federal Deposit Insurance Corporation or any other government agency.
The performance information below gives some indication of the risks associated with an investment in the fund by showing the fund’s performance year to year and over time. Before February 10, 2023, the fund was managed with a materially different investment strategy and may have achieved materially different performance results under its current investment strategy from that shown for periods before this date. The bar chart does not reflect the impact of sales charges. If it did, performance would be lower. Please remember that past performance is not necessarily an indication of future results. Monthly performance figures for the fund are available at www.franklintempleton.com.
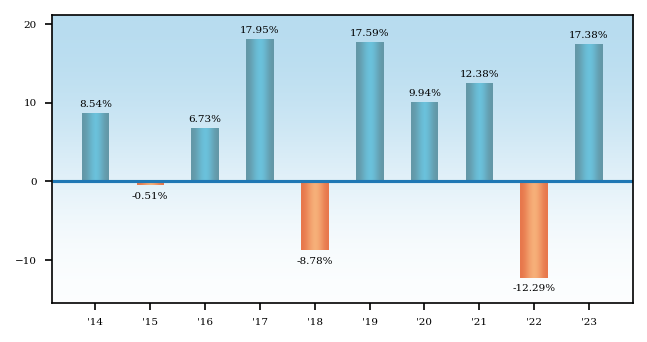
Average Annual Total Returns - Putnam Sustainable Retirement 2040 Fund |
1 Year |
5 Years |
10 Years |
|
|---|---|---|---|---|
| Class A 2040 | 10.63% | 7.11% | 5.74% | |
| Class A 2040 | After Taxes on Distributions | 9.77% | 5.12% | 4.01% | |
| Class A 2040 | After Taxes on Distributions and Sales | 6.41% | 5.11% | 4.03% | |
| Class C 2040 | 15.51% | 7.58% | 5.74% | |
| Class R 2040 | 16.91% | 8.01% | 6.05% | |
| Class R3 2040 | [1] | 17.22% | 8.26% | 6.26% |
| Class R4 2040 | [2] | 17.53% | 8.52% | 6.52% |
| Class R5 2040 | [3] | 17.66% | 8.69% | 6.67% |
| Class R6 2040 | [4] | 17.82% | 8.76% | 6.71% |
| Class Y 2040 | 17.67% | 8.65% | 6.63% | |
| Russell 3000® Index (no deduction for fees, expenses or taxes) | [5] | 25.96% | 15.16% | 11.48% |
| Bloomberg U.S. Aggregate Bond Index (no deduction for fees, expenses or taxes) | [5] | 5.53% | 1.10% | 1.81% |
| S&P Target Date To 2040 Index (no deduction for fees, expenses or taxes) | [5] | 18.16% | 9.73% | 7.06% |
| [1] | Performance for class R3 shares prior to their inception (1/4/21) is derived from the historical performance of class Y shares, adjusted for the higher 12b-1 fees and investor servicing fees applicable to class R3 shares (relative to the comparable fees applicable to class Y shares prior to the inception of class R3 shares). |
| [2] | Performance for class R4 shares prior to their inception (1/4/21) is derived from the historical performance of class Y shares, adjusted for the higher investor servicing fees applicable to class R4 shares (relative to the comparable fees applicable to class Y shares prior to the inception of class R4 shares). |
| [3] | Performance for class R5 shares prior to their inception (1/4/21) is derived from the historical performance of class R6 shares, adjusted for the higher investor servicing fees applicable to class R5 shares (relative to the comparable fees applicable to R6 shares prior to the inception of class R5 shares). |
| [4] | Performance for class R6 shares prior to their inception (9/1/16) is derived from the historical performance of class Y shares and has not been adjusted for the lower investor servicing fees applicable to class R6 shares (relative to the comparable fees applicable to class Y shares prior to the inception of class R6 shares); had it, returns would have been higher. |
| [5] | The table above compares the fund’s returns to the performance of three indexes: (i) the Russell 3000® Index, a broad measure of market performance, (ii) the Bloomberg U.S. Aggregate Bond Index, a broad measure of market performance, and (iii) the S&P Target Date To 2040 Index, an additional index that the Investment Manager believes more closely reflects the fund’s principal investment objective and strategies. |
| Class C share performance reflects conversion to class A shares after eight years. |
| After-tax returns reflect the historical highest individual federal marginal income tax rates and do not reflect state and local taxes. Actual after-tax returns depend on an investor’s tax situation and may differ from those shown. After-tax returns are shown for class A shares only and will vary for other classes. These after-tax returns do not apply if you hold your fund shares through a 401(k) plan, an IRA, or another tax-advantaged arrangement. |
| The Russell 3000® Index measures the performance of the 3,000 largest U.S. companies based on total market capitalization. Source: FTSE. |
| Frank Russell Company is the source and owner of the trademarks, service marks and copyrights related to the Russell Indexes. Russell ® is a trademark of Frank Russell Company. |
| The Bloomberg U.S. Aggregate Bond Index is an unmanaged index of U.S. investment-grade fixed income securities. |
| All Bloomberg indices are provided by Bloomberg Index Services Limited. |
| BLOOMBERG® is a trademark and service mark of Bloomberg Finance L.P. and its affiliates (collectively “Bloomberg”). Bloomberg or Bloomberg’s licensors own all proprietary rights in the Bloomberg Indices. Neither Bloomberg nor Bloomberg’s licensors approve or endorse this material, or guarantees the accuracy or completeness of any information herein, or makes any warranty, express or implied, as to the results to be obtained therefrom, and to the maximum extent allowed by law, neither shall have any liability or responsibility for injury or damages arising in connection therewith. |
| The S&P Target Date To Index Series is designed to represent a small, style-specific derived consensus of asset class exposure and glide path for a specified list of target retirement dates. |
| Securities in the fund do not match those in the indexes and the performance of the fund will differ. |
Putnam Sustainable Retirement 2035 Fund seeks capital appreciation and current income consistent with a decreasing emphasis on capital appreciation and an increasing emphasis on current income as it approaches its target date.
The following tables describe the fees and expenses you may pay if you buy, hold, and sell shares of the fund. You may pay other fees, such as brokerage commissions and other fees to financial intermediaries, which are not reflected in the tables and examples below. You may qualify for sales charge discounts if you and your family invest, or agree to invest in the future, at least $50,000 in Putnam funds. More information about these and other discounts is available from your financial professional and in How do I buy fund shares? beginning on page 227 of the fund’s prospectus, in the Appendix to the fund’s prospectus, and in How to buy shares beginning on page II-3 of the fund’s statement of additional information (“SAI”).
Shareholder Fees - Putnam Sustainable Retirement 2035 Fund |
Class A 2035 |
Class C 2035 |
Class R 2035 |
Class R3 2035 |
Class R4 2035 |
Class R5 2035 |
Class R6 2035 |
Class Y 2035 |
||
|---|---|---|---|---|---|---|---|---|---|---|
| Maximum Sales Charge Imposed on Purchases (as a percentage of Offering Price) | 5.75% | none | none | none | none | none | none | none | ||
| Maximum Deferred Sales Charge (as a percentage) | 1.00% | [1] | 1.00% | [2] | none | none | none | none | none | none |
| [1] | Applies only to certain redemptions of shares bought with no initial sales charge. |
| [2] | This charge is eliminated after one year. |
Annual Fund Operating Expenses - Putnam Sustainable Retirement 2035 Fund |
Class A 2035 |
Class C 2035 |
Class R 2035 |
Class R3 2035 |
Class R4 2035 |
Class R5 2035 |
Class R6 2035 |
Class Y 2035 |
|
|---|---|---|---|---|---|---|---|---|---|
| Management Fees (as a percentage of Assets) | 0.49% | 0.49% | 0.49% | 0.49% | 0.49% | 0.49% | 0.49% | 0.49% | |
| Distribution and Service (12b-1) Fees | 0.25% | 1.00% | 0.50% | 0.25% | none | none | none | none | |
| Other Expenses (as a percentage of Assets): | 0.19% | 0.19% | 0.34% | 0.34% | 0.34% | 0.19% | 0.09% | 0.19% | |
| Acquired Fund Fees and Expenses | 0.48% | 0.48% | 0.48% | 0.48% | 0.48% | 0.48% | 0.48% | 0.48% | |
| Expenses (as a percentage of Assets) | 1.41% | 2.16% | 1.81% | 1.56% | 1.31% | 1.16% | 1.06% | 1.16% | |
| Fee Waiver or Reimbursement | [1] | (0.56%) | (0.56%) | (0.56%) | (0.56%) | (0.56%) | (0.56%) | (0.56%) | (0.56%) |
| Net Expenses (as a percentage of Assets) | 0.85% | 1.60% | 1.25% | 1.00% | 0.75% | 0.60% | 0.50% | 0.60% | |
| [1] | Reflects a contractual obligation of the Investment Manager to limit certain fund expenses through November 30, 2027. This obligation may be modified or discontinued only with approval of the Board of Trustees. |
The following hypothetical example is intended to help you compare the cost of investing in the fund with the cost of investing in other funds. It assumes that you invest $10,000 in the fund for the time periods indicated and then, except as indicated, redeem all your shares at the end of those periods. It assumes a 5% return on your investment each year and that the fund’s operating expenses remain the same. Only the first three years of each period in the example take into account the expense reimbursement described above. Your actual costs may be higher or lower.
Expense Example - Putnam Sustainable Retirement 2035 Fund - USD ($) |
Expense Example, with Redemption, 1 Year |
Expense Example, with Redemption, 3 Years |
Expense Example, with Redemption, 5 Years |
Expense Example, with Redemption, 10 Years |
Expense Example, No Redemption, 1 Year |
Expense Example, No Redemption, 3 Years |
Expense Example, No Redemption, 5 Years |
Expense Example, No Redemption, 10 Years |
|---|---|---|---|---|---|---|---|---|
| Class A 2035 | 657 | 831 | 1,142 | 2,023 | ||||
| Class C 2035 | 263 | 505 | 996 | 2,158 | 163 | 505 | 996 | 2,158 |
| Class R 2035 | 127 | 397 | 814 | 1,979 | ||||
| Class R3 2035 | 102 | 318 | 682 | 1,704 | ||||
| Class R4 2035 | 77 | 240 | 548 | 1,422 | ||||
| Class R5 2035 | 61 | 192 | 466 | 1,250 | ||||
| Class R6 2035 | 51 | 160 | 412 | 1,133 | ||||
| Class Y 2035 | 61 | 192 | 466 | 1,250 |
The fund pays transaction-related costs, such as commissions, when it buys and sells securities (or “turns over” its portfolio). A higher turnover rate may indicate higher transaction costs and may result in higher taxes when the fund’s shares are held in a taxable account. These costs, which are not reflected in annual fund operating expenses or the above example, affect fund performance. The fund’s turnover rate in the most recent fiscal year was 27%.
Investments
The fund is one of a series of target date funds that invest primarily in exchange-traded funds (“ETFs”) that focus on investments with positive sustainability or environmental, social, and governance (“ESG”) characteristics, referred to as underlying funds. The underlying funds include funds managed by Franklin Advisers, Inc. (“Franklin Advisers” or the “Investment Manager”), the fund’s investment manager, and funds managed by affiliated investment advisers. The fund’s asset allocation strategy may be attractive to investors who plan to retire or otherwise intend to begin making periodic withdrawals of their investments in or about 2035 (the target date). The fund is designed to provide diversification among different asset classes by investing its assets in the underlying funds.
Under normal circumstances, the fund will invest in underlying funds (which, for purposes of this policy, include money market mutual funds advised by the Investment Manager or its affiliates) such that, in the aggregate, it has indirect exposure to investments that meet each underlying fund’s respective sustainability or ESG criteria and that represent at least 80% of the value of its net assets. This policy is non-fundamental and may be changed only after 60 days’ notice to shareholders. The Investment Manager may not apply ESG or sustainability criteria to investments that are not subject to the fund’s 80% policy, and such investments may not meet the applicable ESG or sustainability criteria. Through its investments in underlying funds, the fund makes use of a range of ESG- and sustainability- oriented investment strategies and invests across a variety of asset classes. The ESG or sustainability criteria will differ across the underlying funds. These differences may arise both from differences in the underlying funds’ asset classes (such as the characteristics of non-U.S. versus U.S. issuers, or the structural differences (e.g., position in the capital structure) between equity and fixed-income investments) as well as from different managers’ styles. In implementing an underlying fund’s investment strategy, the portfolio managers of the underlying fund may apply and weigh different ESG criteria differently than the portfolio managers of the other underlying funds. There are also expected to be differences in how the portfolio managers of the underlying funds source ESG-related or sustainability-oriented research (e.g., proprietary versus third-party research) and/or their approach to selecting companies based on ESG or sustainability criteria.
The fund’s target allocations among asset classes and underlying funds will increasingly emphasize capital preservation and income over time and will change gradually based on the number of remaining years until the fund’s target date, as shown in the predetermined “glide path” in the chart under “What are the funds’ and each underlying fund’s main investment strategies and related risks?” The Investment Manager adjusts these allocations at the end of each calendar quarter based on the glide path.
Pending investment in underlying funds, the fund also expects to temporarily invest cash balances resulting from purchase activity by fund shareholders in Putnam Government Money Market Fund, a mutual fund sponsored by the Investment Manager, or in cash or cash equivalents. The fund also expects to invest a portion of its assets in Putnam Government Money Market Fund or in cash or cash equivalents in order to manage shareholder redemptions. The percentage of a fund invested in Putnam Government Money Market Fund is expected to vary over time and will depend on the level of purchase and redemption activity by fund shareholders.
The following table presents your fund’s approximate allocations to each asset class and underlying fund as of September 30, 2024 (taking into account any tactical adjustments described below) and its projected approximate allocations to those asset classes and underlying funds as of September 30, 2025. The table does not reflect temporary investments in Putnam Government Money Market Fund or in cash or cash equivalents. By comparing the percentage allocations of your fund in the table, you can see how its allocations are expected to change during the one-year period beginning on September 30, 2024. The table also shows the approximate allocations of other Putnam Sustainable Retirement Funds, which are designed for investors with different target retirement dates. Over a five-year period, each fund’s allocations will gradually change to resemble the allocations of the fund with the next earliest target date. The table illustrates how a fund’s allocations are expected to change over time to increasingly emphasize capital preservation and income.
| Underlying Fund* | Year | 2065 | 2060 | 2055 | 2050 | 2045 | 2040 | 2035 (your fund) | 2030 | 2025 | Maturity Fund |
| Putnam Sustainable Leaders ETF | 2024 | 48.6% | 47.2% | 44.8% | 42.3% | 39.7% | 36.4% | 31.7% | 21.0% | 14.9% | 14.1% |
| 2025 | 47.6% | 45.8% | 43.3% | 40.7% | 38.4% | 35.2% | 30.3% | 18.6% | 14.3% | 14.1% | |
| Putnam Sustainable Future ETF | 2024 | 23.8% | 23.1% | 21.9% | 20.6% | 19.4% | 17.9% | 15.8% | 10.5% | 7.5% | 7.1% |
| 2025 | 23.8% | 22.9% | 21.7% | 20.4% | 19.2% | 17.6% | 15.2% | 9.3% | 7.1% | 7.1% | |
| Putnam PanAgora ESG Inter-national Equity ETF | 2024 |
17.8% | 17.3% | 16.4% | 15.5% | 14.4% | 12.4% | 9.6% | 6.3% | 4.5% | 4.2% |
| 2025 | 17.8% | 17.2% | 16.2% | 15.3% | 14.2% | 11.9% | 9.1% | 5.6% | 4.3% | 4.2% | |
| Putnam PanAgora ESG Emer-ging Markets Equity ETF | 2024 |
4.9% | 4.8% | 4.5% | 4.2% | 3.8% | 2.2% | 0.1% | 0.0% | 0.0% | 0.0% |
| 2025 | 5.9% | 5.7% | 5.4% | 5.1% | 4.5% | 2.2% | 0.0% | 0.0% | 0.0% | 0.0% | |
| Putnam ESG Core Bond ETF | 2024 | 3.3% | 5.3% | 8.9% | 12.4% | 15.4% | 23.0% | 33.5% | 49.7% | 52.3% | 51.7% |
| 2025 | 3.3% | 5.9% | 9.7% | 13.0% | 16.1% | 24.8% | 35.4% | 53.4% | 51.8% | 51.7% | |
| Putnam ESG High Yield ETF | 2024 | 1.1% | 1.8% | 3.0% | 4.1% | 4.9% | 4.8% | 4.9% | 6.7% | 14.8% | 16.9% |
| 2025 | 1.1% | 2.0% | 3.2% | 4.3% | 4.9% | 4.8% | 5.3% | 7.1% | 16.5% | 16.9% | |
| Putnam ESG Ultra Short ETF | 2024 | 0.5% | 0.5% | 0.5% | 0.9% | 2.4% | 3.3% | 4.4% | 5.8% | 6.0% | 6.0% |
| 2025 | 0.5% | 0.5% | 0.5% | 1.2% | 2.7% | 3.5% | 4.7% | 6.0% | 6.0% | 6.0% | |
| Total Equity** | 2024 | 95.1% | 92.4% | 87.6% | 82.6% | 77.3% | 68.9% | 57.2% | 37.8% | 26.9% | 25.4% |
| 2025 | 95.1% | 91.6% | 86.6% | 81.5% | 76.3% | 66.9% | 54.6% | 33.5% | 25.7% | 25.4% | |
| Total Fixed Income** | 2024 | 4.9% | 7.6% | 12.4% | 17.4% | 22.7% | 31.1% | 42.8% | 62.2% | 73.1% | 74.6% |
| 2025 | 4.9% | 8.4% | 13.4% | 18.5% | 23.7% | 33.1% | 45.4% | 66.5% | 74.3% | 74.6% |
| * | Due to rounding, allocations shown in the table above may not total 100%. In addition, because of rounding in the calculation of allocations among underlying funds and market fluctuations, actual allocations might be more or less than these percentages. |
| ** | Equity and fixed-income allocations are hypothetical estimates based on an assumption that each of Putnam Sustainable Leaders ETF, Putnam Sustainable Future ETF, Putnam PanAgora ESG International Equity ETF, and Putnam PanAgora ESG Emerging Markets Equity ETF is equivalent to an equity investment and each of Putnam ESG Core Bond ETF, Putnam ESG High Yield ETF and Putnam ESG Ultra Short ETF is equivalent to a fixed-income investment. Actual allocations will vary. |
The fund’s target allocations may differ from the allocations shown in the table. The Investment Manager may change the glide path, the fund’s target allocations, and the underlying funds in which it invests at any time, although the Investment Manager generally expects these changes (other than the tactical adjustments described below) to be infrequent and generally in response to longer-term structural changes (e.g., in the average retirement age or life expectancy) that lead the fund’s portfolio managers to determine that a change is advisable. The Investment Manager may also make tactical adjustments from time to time in the fund’s allocations to underlying funds in response to market conditions within a range of +/- 15% from the allocations to fixed-income and equity asset classes as presented in the fund’s glide path.
It is assumed that investors will begin gradual withdrawals from the fund at around the target date. Near the end of the target date year, the fund’s target allocations will correspond to those of Putnam Sustainable Retirement Maturity Fund (“Maturity Fund”), a fund that seeks as high a rate of current income as the Investment Manager believes is consistent with preservation of capital, and the fund will be merged into Maturity Fund. More information about Maturity Fund is available in the prospectus beginning on page 171, and more information about the underlying funds (which are not offered by this prospectus) is included below and under “What are the funds’ and each underlying fund’s main investment strategies and related risks?”
Information about each underlying fund’s investment strategy
Putnam Sustainable Leaders ETF (“Sustainable Leaders ETF”)
Sustainable Leaders ETF invests mainly in common stocks of U.S. companies of any size, with a focus on companies that Putnam Investment Management, LLC (“Putnam Management”), Sustainable Leaders ETF’s investment manager, believes exhibit a commitment to financially material sustainable business practices. Sustainable Leaders ETF may also invest in non-U.S. companies. In evaluating investments for Sustainable Leaders ETF, Putnam Management views “financially material sustainable business practices” as business practices that it believes are reasonably likely to impact the financial condition or operating performance of a company and that relate to environmental, social, or corporate governance issues.
Under normal circumstances, Sustainable Leaders ETF invests at least 80% of the value of its net assets in securities that meet Putnam Management’s sustainability criteria. For a further discussion of Sustainable Leaders ETF’s investment strategy, please turn to the section What are the funds’ and each underlying fund’s main investment strategies and related risks? beginning on page 189.
Putnam Sustainable Future ETF (“Sustainable Future ETF”)
Sustainable Future ETF invests mainly in common stocks of U.S. companies of any size, with a focus on companies whose products and services Putnam Management, Sustainable Future ETF’s investment manager, believes provide solutions that directly contribute to sustainable social, environmental and economic development (Solutions Companies).
Under normal circumstances, Sustainable Future ETF invests at least 80% of the value of its net assets in securities that meet Putnam Management’s sustainability criteria. For a further discussion of Sustainable Future ETF’s investment strategy, please turn to the section What are the funds’ and each underlying fund’s main investment strategies and related risks? beginning on page 189.
Putnam PanAgora ESG International Equity ETF (“PanAgora International Equity ETF”)
PanAgora International Equity ETF invests mainly in common stocks (growth or value stocks or both) of companies of any size outside the United States with a focus on companies that PanAgora International Equity ETF’s subadviser, PanAgora Asset Management, Inc. (“PanAgora”), believes offer attractive benchmark-relative
returns and exhibit positive ESG metrics. Under normal circumstances, PanAgora International Equity ETF invests at least 80% of its net assets in equity securities of companies that meet PanAgora’s ESG criteria. For a further discussion of PanAgora International Equity ETF’s investment strategy, please turn to the section What are the funds’ and each underlying fund’s main investment strategies and related risks? beginning on page 189.
Putnam PanAgora ESG Emerging Markets Equity ETF (“PanAgora Emerging Markets Equity ETF”)
PanAgora Emerging Markets Equity ETF invests mainly in common stocks (growth or value stocks or both) of emerging markets companies of any size with a focus on companies that PanAgora Emerging Markets Equity ETF’s subadviser, PanAgora, believes offer attractive benchmark-relative returns and exhibit positive ESG metrics. Under normal circumstances, PanAgora Emerging Markets Equity ETF invests at least 80% of its net assets in equity securities of emerging markets companies that meet PanAgora’s ESG criteria. For a further discussion of PanAgora Emerging Markets Equity ETF’s investment strategy, please turn to the section What are the funds’ and each underlying fund’s main investment strategies and related risks? beginning on page 189.
Putnam ESG Core Bond ETF (“Core Bond ETF”)
Core Bond ETF invests mainly in a diversified portfolio of investment-grade fixed-income securities with a focus on companies or issuers that Franklin Advisers, Core Bond ETF’s investment manager, believes meet relevant ESG criteria on a sector-specific basis. Under normal circumstances, Core Bond ETF invests at least 80% of the value of its net assets in fixed-income securities that meet Franklin Advisers’ ESG criteria. For a further discussion of Core Bond ETF’s investment strategy, please turn to the section What are the funds’ and each underlying fund’s main investment strategies and related risks? beginning on page 189.
Putnam ESG High Yield ETF (“High Yield ETF”)
High Yield ETF invests mainly in bonds that are below investment grade in quality (sometimes referred to as “junk bonds”) with a focus on companies or issuers that Franklin Advisers, High Yield ETF’s investment manager, believes meet relevant ESG criteria on a sector-specific basis. High Yield ETF invests mainly in bonds that also have one or more of the following characteristics: (1) are obligations of U.S. companies or issuers and (2) have intermediate- to long-term maturities (three years or longer). Under normal circumstances, High Yield ETF invests at least 80% of the value of its net assets in fixed-income securities rated below investment grade that meet Franklin Advisers’ ESG criteria. For a further discussion of High Yield ETF’s investment strategy, please turn to the section What are the funds’ and each underlying fund’s main investment strategies and related risks? beginning on page 189.
Putnam ESG Ultra Short ETF (“Ultra Short ETF”)
Ultra Short ETF invests in a diversified short duration portfolio of fixed-income securities comprised of investment-grade money market and other fixed-income securities, including U.S. dollar-denominated foreign securities of these types, with a focus on companies or issuers that Franklin Advisers, Ultra Short ETF’s investment manager, believes meet relevant ESG criteria, on a sector-specific basis. Under normal circumstances, Ultra Short ETF invests at least 80% of the value of its net assets in fixed-income securities that meet Franklin Advisers’ ESG criteria. For a further discussion of Ultra Short ETF’s investment strategy, please turn to the section What are the funds’ and each underlying fund’s main investment strategies and related risks? beginning on page 189.
Risks
It is important to understand that you can lose money by investing in the fund. Losses may occur near, at or after the target date. There is no guarantee that the fund will provide adequate income at and through an investor’s retirement.
The fund’s allocation of assets among asset classes and the underlying funds may hurt performance. An underlying fund may change its investment program or policies without the fund’s approval, which could require the fund to reduce or eliminate its allocation to the underlying fund at an unfavorable time.
The fund invests in underlying funds and indirectly bears expenses related to the underlying funds. However, the Investment Manager has contractually agreed to waive fees, reimburse expenses of, or reimburse the fund through at least November 30, 2027 in an amount equal to the fund’s acquired fund fees and expenses (e.g., the fees and expenses incurred by the fund as a result of its investments in the underlying funds). The Investment Manager also has contractually agreed to waive fees and/or reimburse expenses of each class of shares of the fund through at least November 30, 2027 in an amount sufficient to result in total annual fund operating expenses for class A, C, R, R3, R4, R5, R6 and Y shares of the fund (exclusive of payments under the fund’s distribution plans, brokerage, interest, taxes, investment-related expenses, acquired fund fees and expenses, and extraordinary expenses) that equal 0.60%, 0.60%, 0.75%, 0.75%, 0.75%, 0.60%, 0.50%, and 0.60%, respectively, of the fund’s average net assets.
Pending investment in underlying funds, the fund also expects to temporarily invest cash balances resulting from purchase activity by fund shareholders in Putnam Government Money Market Fund, a money market mutual fund sponsored by the Investment Manager, or in cash or cash equivalents. In addition, the fund expects to invest a portion of its assets in Putnam Government Money Market Fund or in cash or cash equivalents in order to manage shareholder redemptions. Large positions in Putnam Government Money Market Fund or in cash or cash equivalents may dampen performance and may prevent the fund from achieving its goal. These practices may be subject to other risks, as described under Miscellaneous Investments, Investment Practices and Risks in the SAI.
The fund also bears the risks associated with the underlying funds identified below. The relative significance of these risks will vary over time based on the fund’s target allocations to the underlying funds and to equity and fixed-income asset classes, which may change from time to time as discussed above.
Investment Strategy-Related Risks of the Underlying Funds
Sustainability and ESG investing risk. Investing in underlying funds with an ESG or sustainability focus may result in the fund having exposure to underlying funds that invest in certain types of companies, issuers, industries or sectors that the market may not favor. In evaluating an investment opportunity for the underlying funds, Franklin Advisers, Putnam Management or PanAgora may make investment decisions without the availability of optimal ESG-related data (which may be even less available with securitized debt instruments) or based on information and data that is incomplete or inaccurate. Sustainability and ESG metrics are not uniformly defined, and applying such metrics involves subjective assessments. Sustainability and ESG scorings and assessments of issuers can vary across third-party data providers and may change over time. Franklin Advisers, Putnam Management and PanAgora do not rely exclusively on third-party data providers in evaluating sustainability and ESG criteria for the underlying funds. ESG information from third-party data providers may be incomplete, inaccurate or unavailable, particularly with respect to companies in emerging market countries, which may adversely impact the investment process. In addition, the business practices, products or services of issuers in which an underlying fund invests may change over time. As a result of these possibilities, among others, an underlying fund may temporarily hold securities that are inconsistent with the underlying fund’s ESG or sustainability investment criteria. Regulatory changes or interpretations regarding the definitions and/or use of ESG and/or sustainability criteria could have a material adverse effect on the underlying fund’s ability to invest in accordance with its investment policies and/or achieve its investment objective. The underlying funds do not restrict investments based solely on “negative screens”, and the underlying fixed-income funds do not restrict their fixed-income investments to “green bonds” (e.g., U.S. dollar-denominated bonds designated as “green” by the Climate Bonds Initiative). For the underlying funds that pursue fixed-income investment strategies, because fixed-income investments generally represent a promise to pay principal and interest by an issuer, and not an ownership interest, and may involve complex structures, ESG-related investment considerations may have a more limited impact on risk and return (or may have an impact over a different investment time horizon) relative to other asset classes, and this may be particularly true for shorter-term investments. In addition, holders of fixed-income investments do not typically have voting rights, unlike holders of equity investments who have the right to vote on issuer proposals.
Market risk. The value of investments in the underlying funds’ portfolios may fall or fail to rise over extended periods of time for a variety of reasons, including general economic, political or financial market conditions, investor sentiment and market perceptions, government actions, geopolitical events or changes, outbreaks of infectious illnesses or other widespread public health issues (including epidemics and
pandemics), and factors related to a specific issuer, geography, industry or sector. These and other factors may lead to increased volatility and reduced liquidity in the underlying funds’ portfolio holdings, may negatively impact the fund’s performance, and may exacerbate other risks to which the fund is subject.
Common stock risk. (For all underlying funds except Core Bond ETF, High Yield ETF and Ultra Short ETF) Common stock represents an ownership interest in a company. The value of a company’s stock may fall or fail to rise as a result of factors directly relating to that company, such as decisions made by its management or lower demand for the company’s products or services. A stock’s value may also fall because of factors affecting not just the company, but also other companies in the same industry or in a number of different industries, such as increases in production costs.
| Growth investing risk.. Growth stocks may be more susceptible to earnings disappointments, and the market may not favor growth-style investing. |
| Value investing risk. Value stocks may fail to rebound, and the market may not favor value-style investing. Companies whose stocks we believe are undervalued by the market may have experienced adverse business developments or may be subject to special risks that have caused their stocks to be out of favor. |
| Small and midsize companies risk. Stocks of small and midsize companies often trade in smaller volumes, and their prices may fluctuate more than stocks of larger companies. Stocks of these companies may therefore be more vulnerable to adverse developments than those of larger companies. |
Industry or sector concentration risk. (For all underlying funds except Core Bond ETF, High Yield ETF and Ultra Short ETF) From time to time, an underlying fund may invest a significant portion of its assets in companies in one or more related industries or sectors, which would make the underlying fund more vulnerable to adverse developments affecting those industries or sectors.
Model and data risk. (For all underlying funds except Sustainable Leaders ETF, Sustainable Future ETF and High Yield ETF) If the quantitative models or data that are used in managing an underlying fund prove to be incorrect or incomplete, investment decisions made in reliance on the models or data may not produce the desired results, and the underlying fund may realize losses. Additionally, market movements are likely to change the risk levels and risk allocations of the underlying fund. Investments made based on quantitative models may perform differently from the market as a whole.
Foreign investment risk. (For all underlying funds except Ultra Short ETF, Sustainable Leaders ETF and Sustainable Future ETF) The value of international investments traded in foreign currencies may be adversely impacted by fluctuations in exchange rates. International investments, particularly investments in emerging markets, may carry risks associated with potentially less stable economies or governments (such as the risk of seizure by a foreign government, the imposition of currency or other restrictions, or high levels of inflation), and may be or become
illiquid. There may be less publicly-available information, or less reliable publicly-available information, about foreign companies (including information related to companies’ ESG practices), particularly with respect to emerging market companies, than publicly-available information regarding U.S. companies. As a result, an underlying fund’s ability to evaluate a foreign company, including with respect to its ESG or sustainability practices, may be more limited than its ability to evaluate a U.S. company.
Geographic focus risk. (For PanAgora International Equity ETF and PanAgora Emerging Markets Equity ETF) From time to time, an underlying fund may invest a significant portion of its assets in companies in one or more related geographic regions, industries or sectors, such as European and Asian countries, which would make the fund more vulnerable to adverse developments affecting those geographic regions, industries or sectors, including political, economic, or other developments adversely impacting ESG or sustainable investing.
Fixed-income investments risk. (For Core Bond ETF, High Yield ETF and Ultra Short ETF) The risks associated with fixed-income investments include interest rate risk, which is the risk that the value of an underlying fund’s investments is likely to fall if interest rates rise. Fixed-income investments are also subject to credit risk, which is the risk that the issuer of a fixed-income investment may default on payment of interest or principal. Credit risk is generally greater for debt not backed by the full faith and credit of the U.S. government, and interest rate risk is generally greater for longer-term debt. Fixed-income investments may be more susceptible to downgrades or defaults during economic downturns or other periods of economic stress. Mortgage-backed investments, unlike traditional debt investments, are also subject to prepayment risk, which means that they may increase in value less than other bonds when interest rates decline and decline in value more than other bonds when interest rates rise. The underlying fund may have to invest the proceeds from prepaid investments, including mortgage-backed investments, in other investments with less attractive terms and yields. The underlying fund’s investments in mortgage-backed securities, and in certain other securities and derivatives, may be or become illiquid. The underlying fund’s investments in mortgage-backed securities may make the underlying fund’s net asset value more susceptible to economic, market, political and other developments affecting the residential and commercial real estate markets and the servicing of mortgage loans secured by real estate properties. During periods of difficult economic conditions, delinquencies and losses on commercial mortgage-backed investments in particular generally increase, including as a result of the effects of those conditions on commercial real estate markets, the ability of commercial tenants to make loan payments, and the ability of a property to attract and retain commercial tenants.
One of the underlying funds, Putnam High Yield ETF, invests mostly in higher-yield, higher-risk debt investments that are rated below BBB or its equivalent at the time of purchase by any nationally recognized securities rating agency rating such investments, or in unrated investments that Franklin Advisers believes are of comparable quality. The underlying fund may invest up to 15% of the underlying
fund’s total assets in debt investments rated below CCC or its equivalent, at the time of purchase, by each rating agency rating such investments, or in unrated investments that Franklin Advisers believes are of comparable quality. This includes investments in the lowest rating category of the rating agency. The underlying fund will not necessarily sell an investment if its rating is reduced after Franklin Advisers buys it. Investments rated below BBB or its equivalent are below-investment-grade in quality. This rating reflects a greater possibility that the issuers may be unable to make timely payments of interest and principal and thus default. If a default occurs, or is perceived as likely to occur, the value of the investment will usually be more volatile and is likely to fall. The value of a debt instrument may also be affected by changes in, or perceptions of, the financial condition of the issuer, borrower, counterparty, or other entity, or underlying collateral or assets, or changes in, or perceptions of, specific or general market, economic, industry, political, regulatory, geopolitical, environmental, public health, and other conditions. A default or expected default could also make it difficult for the underlying fund to sell the investment at a price approximating the value Franklin Advisers had previously placed on it. Lower-rated debt usually has a more limited market than higher-rated debt, which may at times make it difficult for the underlying fund to buy or sell certain debt instruments or to establish their fair values.
Derivatives risk. (For all underlying funds except PanAgora International Equity ETF, PanAgora Emerging Markets Equity ETF, Sustainable Leaders ETF and Sustainable Future ETF) An underlying fund’s use of derivatives may increase the risks of investing in the underlying fund by increasing investment exposure (which may be considered leverage) or, in the case of many over-the-counter instruments, because of the potential inability to terminate or sell derivatives positions and the potential failure of the other party to the instrument to meet its obligations. The risk of a party failing to meet its obligations may increase if the fund has significant investment exposure to that counterparty. The value of derivatives may move in unexpected ways due to unanticipated market movements, the use of leverage, imperfect correlation between the derivative instrument and the reference asset, or other factors, especially in unusual market conditions, and volatility in the value of derivatives could adversely impact the underlying fund’s returns, obligations and exposures. Derivatives are also subject to other risks, including liquidity risk (e.g., liquidity demands arising from the requirement to make payments to a derivative counterparty), operational risk (e.g., settlement issues or system failure), and legal risk (e.g., insufficient legal documentation or contract enforceability issues).
Floating rate obligations risk. (For Core Bond ETF, High Yield ETF and Ultra Short ETF) To the extent an underlying fund holds floating rate loans, interest rate risk may be reduced but will not be eliminated. While floating rate loans are normally secured by specific collateral or assets of the issuer (so that holders of the loans, such as the underlying fund, will have a priority claim on those assets in the event of default or bankruptcy of the issuer), the value of collateral may be insufficient to meet the issuer’s obligations, and the underlying fund’s access to collateral may be limited by bankruptcy or other insolvency laws. The settlement period (the period
between the execution of the trade and the delivery of cash to the purchaser) for floating rate loan transactions is typically longer than seven days, and it is possible that sale proceeds from floating rate loan transactions will not be available to meet redemption obligations.
Portfolio turnover rate risk. From time to time an underlying fund may engage in frequent trading. Funds with high turnover may be more likely to realize capital gains that must be distributed to shareholders as taxable income. High turnover may also cause a fund to pay more brokerage commissions and to incur other transaction costs (including imputed transaction costs), which may detract from performance. A fund’s portfolio turnover rate and the amount of brokerage commissions it pays and transaction costs it incurs will vary over time based on market conditions.
Management and operational risk. There is no guarantee that the investment techniques, analyses, or judgments that Franklin Advisers, Putnam Management or PanAgora, as applicable, applies in making investment decisions for the underlying funds will produce the intended outcome or that the investments they select for the underlying funds will perform as well as other securities that were not selected for the underlying funds. Franklin Advisers, Putnam Management, PanAgora, or the underlying funds’ other service providers, may experience disruptions or operating errors that could negatively impact the underlying funds.
Risks Related to Investing in ETFs
As ETFs, shares of the underlying funds are traded in the secondary market. Prior to trading in the secondary market, shares of the underlying funds are “created” at NAV by market makers, large investors and institutions (collectively, “authorized participants”) only in creation units. A creation transaction generally takes place when an authorized participant deposits into an underlying fund a designated portfolio of securities, assets or other positions (a “creation basket”), and an amount of cash (including any cash representing the value of substituted securities, assets or other positions), if any, in exchange for a specified number of creation units. Similarly, shares of an underlying fund can be redeemed only in creation units, generally for a designated portfolio of securities, assets or other positions held by the underlying fund and an amount of cash (including any portion of such securities for which cash may be substituted), if any.
Fluctuation of net asset value (“NAV”) and share price risk. Shares of the underlying funds may trade at a larger premium or discount to their NAV than shares of other ETFs. The NAV of an underlying fund will generally fluctuate with changes in the market value of the underlying fund’s holdings. Underlying fund shares can be bought and sold in the secondary market at market prices. Disruptions to creations and redemptions, the existence of extreme market volatility or potential lack of an active trading market for an underlying fund’s shares may result in the underlying fund’s shares trading significantly above (at a premium) or below (at a discount) to NAV or to the intraday value of the underlying fund’s holdings. In addition, in stressed market conditions or periods of market disruption or volatility, the market for shares of the
underlying funds may become less liquid in response to deteriorating liquidity in the markets for the underlying funds’ portfolio holdings.
Authorized participant concentration risk. Only an authorized participant may engage in creation and redemption transactions directly with an underlying fund. Your fund is not an authorized participant and can only purchase and sell underlying fund shares in the secondary market at market prices or through an authorized participant. The underlying fund may have a limited number of financial institutions that act as authorized participants, none of which are obligated to engage in creation and/or redemption transactions. To the extent that those authorized participants do not engage in creation and redemption orders, there may be a significantly diminished trading market for underlying fund shares, or underlying fund shares may trade at a discount (or premium) to NAV and possibly face trading halts and/or de-listing.
Trading issues risk. The underlying funds have a limited public trading history. Sustainable Leaders ETF and Sustainable Future ETF began trading publicly in May 2021, while PanAgora International Equity ETF, PanAgora Emerging Markets Equity ETF, Core Bond ETF, High Yield ETF, and Ultra Short ETF began trading publicly in January 2023. There can be no assurance that an active trading market will develop or be maintained or that the market for underlying fund shares will operate as intended, which could lead to the underlying funds’ shares trading at wider spreads and larger premiums and discounts to NAV than other actively managed ETFs. As a result, it may cost the fund more to trade underlying fund shares than shares of other ETFs. There is no guarantee that the underlying fund will be able to attract market makers and authorized participants. Market makers and authorized participants are not obligated to make a market in the underlying fund’s shares or to submit purchase and redemption orders for creation units.
The market prices of an underlying fund’s shares are expected to fluctuate, in some cases materially, in response to changes in the underlying fund’s NAV, the intraday value of the underlying fund’s holdings and supply and demand for the underlying fund’s shares. Each underlying fund’s respective investment manager cannot predict whether an underlying fund’s shares will trade above, below or at their NAV or the intraday value of the underlying fund’s holdings. During periods when an underlying fund is trading below its NAV, the fund may incur significant losses if it sells its underlying fund shares.
The securities held by an underlying fund may be traded in markets that close at a different time than the exchange on which the underlying fund’s shares are listed. Liquidity in those securities may be reduced after the applicable closing times. Accordingly, during the time when the exchange is open but after the applicable market closing, fixing or settlement times, bid-ask spreads on the exchange and the corresponding premium or discount to the NAV of the underlying funds’ shares may widen.
Large shareholder risk. Each underlying fund may be an investment option for mutual funds that are managed by Franklin Resources, Inc. (“Franklin Templeton”) and its affiliates as “funds of funds.” Additionally, other investors from time to time may make substantial investments in an underlying fund, including affiliates of Franklin Templeton, through seed capital arrangements. Such shareholders may at times be considered to control an underlying fund. Dispositions of a large number of shares by these shareholders may adversely affect an underlying fund’s liquidity and net assets to the extent such transactions are executed directly with the underlying fund in the form of redemptions through an authorized participant, rather than executed in the secondary market. These redemptions may also force an underlying fund to sell securities, which may increase the underlying fund’s brokerage costs. In addition, underlying fund returns may be adversely affected if an underlying fund holds a portion of its assets in liquid, cash-like investments in connection with or in anticipation of shareholder redemptions. To the extent these large shareholders transact in shares of an underlying fund on the secondary market, such transactions may account for a large percentage of the trading volume on the exchange and may, therefore, have a material effect (upward or downward) on the market price of the underlying fund’s shares.
Cash transactions risk. Some of the underlying funds may effect creations and redemptions in cash or partially in cash. Therefore, an underlying fund may be required to sell portfolio securities, incur transaction costs, and subsequently recognize gains on such sales that the underlying fund might not have recognized if it were to distribute portfolio securities in-kind. As such, investments by a fund in an underlying fund’s shares may be less tax-efficient than an investment in an ETF that distributes portfolio securities entirely in-kind. An underlying fund may also incur transaction costs in connection with creations effected in cash (in whole or in part).
Semi-transparent ETF risk. (For Sustainable Leaders ETF and Sustainable Future ETF) Two of the underlying funds, Putnam Sustainable Leaders ETF and Putnam Sustainable Future ETF (the “Semi-Transparent ETFs”), are different from traditional ETFs, including the other underlying funds. Traditional ETFs disclose to the public what assets they hold each day. However, the Semi-Transparent ETFs do not. This may create additional risks for an investment in the Semi-Transparent ETFs, including that an investor may have to pay more money to trade the Semi-Transparent ETF’s shares in light of the fact that the Semi-Transparent ETF will provide less information to traders, who tend to charge more for trades when they have less information. The price an investor pays to buy or sell an ETF’s shares on an exchange may not match the value of the ETF’s portfolio, and these price differences may be greater for the Semi-Transparent ETFs compared to other ETFs because they provide less information to traders. These additional risks may be even greater in adverse or uncertain market conditions.
The differences between the Semi-Transparent ETFs and other ETFs may also have advantages. By keeping certain information about the Semi-Transparent ETFs secret, a Semi-Transparent ETF may face less risk that other traders can predict or copy its investment strategy. This may improve the Semi-Transparent ETF’s performance.
If other traders are able to copy or predict the Semi-Transparent ETF’s investment strategy, however, this may hurt the Semi-Transparent ETF’s performance.
Tracking basket structure risk. (For Sustainable Leaders ETF and Sustainable Future ETF) The Semi-Transparent ETFs are actively managed ETFs that operate pursuant to an exemptive order from the Securities and Exchange Commission and do not publicly disclose their complete portfolio holdings each business day. Instead, each Semi-Transparent ETF publishes each business day on its website a “Tracking Basket,” which is designed to closely track the daily performance of the Semi-Transparent ETF but is not the Semi-Transparent ETF’s actual portfolio. The Tracking Basket is comprised of: (1) select recently disclosed portfolio holdings and/or select securities from the universe from which the Semi-Transparent ETF’s investments are selected (“Strategy Components”); (2) liquid ETFs that convey information about the types of instruments (that are not otherwise fully represented by the Strategy Components) in which the Semi-Transparent ETF invests; and (3) cash and cash equivalents.
A Semi-Transparent ETF’s Tracking Basket structure may affect the price at which shares of the Semi-Transparent ETF trade in the secondary market. Although the Tracking Basket is intended to provide investors with enough information to allow for an effective arbitrage mechanism that will keep the market price of each Semi-Transparent ETF at or close to its NAV per share, there is a risk that market prices will vary significantly from NAV. The Semi-Transparent ETFs, which trade on the basis of a published Tracking Basket, may trade at a wider bid/ask spread than ETFs that publish their portfolios on a daily basis, and therefore, may cost investors more to trade. These risks may increase during periods of market disruption or volatility. In addition, although each Semi-Transparent ETF seeks to benefit from keeping its portfolio information secret, market participants may attempt to use the Tracking Basket to identify the Semi-Transparent ETF’s trading strategy. If successful, this could result in such market participants engaging in certain predatory trading practices that may have the potential to harm the Semi-Transparent ETF and its shareholders, such as front running the Semi-Transparent ETF’s trades of portfolio securities.
Arbitrage risk. (For Sustainable Leaders ETF and Sustainable Future ETF) Unlike ETFs that publicly disclose their complete portfolio holdings each business day, each Semi-Transparent ETF provides certain other information intended to allow market participants to estimate the value of positions in the Semi-Transparent ETF’s shares. Although this information is designed to facilitate arbitrage opportunities in the Semi-Transparent ETF’s shares to reduce bid/ask spreads and minimize discounts or premiums between the market price and NAV of the Semi-Transparent ETF shares, there is no guarantee the Semi-Transparent ETF’s arbitrage mechanism will operate as intended and that the Semi-Transparent ETF will not experience wide bid/ask spreads and/or large discounts or premiums to NAV. In addition, market participants may attempt to use the disclosed information to “reverse engineer” the Semi-Transparent ETF’s trading strategy, which, if successful, could increase opportunities for predatory trading practices that may have the potential to negatively impact the Semi-Transparent ETF’s performance.
Trading halt risk. (For Sustainable Leaders ETF and Sustainable Future ETF) There may be circumstances where a security held in a Semi-Transparent ETF’s portfolio but not in the Tracking Basket does not have readily available market quotations. If Putnam Management determines that such circumstance may affect the reliability of the Tracking Basket as an arbitrage vehicle, that information, along with the identity and weighting of that security in the Semi-Transparent ETF’s portfolio, will be publicly disclosed on the Semi-Transparent ETF’s website, and Putnam Management will assess appropriate remedial measures. In these circumstances, market participants may use this information to engage in certain predatory trading practices that may have the potential to harm the Semi-Transparent ETF and its shareholders. In addition, if securities representing 10% or more of the Semi-Transparent ETF’s portfolio do not have readily available market quotations, Putnam Management would promptly request the exchange to halt trading of the Semi-Transparent ETF, meaning that investors (including the fund) would not be able to trade their shares. Trading may also be halted in other circumstances, for example, due to market conditions.
The fund may not achieve its goal, and it is not intended to be a complete investment program. An investment in the fund is not insured or guaranteed by the Federal Deposit Insurance Corporation or any other government agency.
The performance information below gives some indication of the risks associated with an investment in the fund by showing the fund’s performance year to year and over time. Before February 10, 2023, the fund was managed with a materially different investment strategy and may have achieved materially different performance results under its current investment strategy from that shown for periods before this date. The bar chart does not reflect the impact of sales charges. If it did, performance would be lower. Please remember that past performance is not necessarily an indication of future results. Monthly performance figures for the fund are available at www.franklintempleton.com.
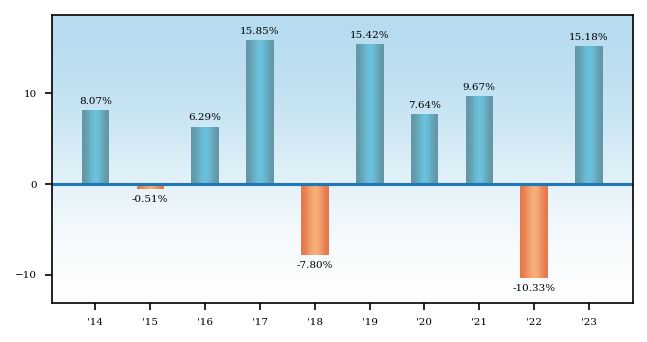
Average Annual Total Returns - Putnam Sustainable Retirement 2035 Fund |
1 Year |
5 Years |
10 Years |
|
|---|---|---|---|---|
| Class A 2035 | 8.56% | 5.81% | 4.94% | |
| Class A 2035 | After Taxes on Distributions | 7.59% | 3.96% | 3.34% | |
| Class A 2035 | After Taxes on Distributions and Sales | 5.16% | 4.04% | 3.38% | |
| Class C 2035 | 13.32% | 6.27% | 4.93% | |
| Class R 2035 | 14.75% | 6.71% | 5.25% | |
| Class R3 2035 | [1] | 15.02% | 6.94% | 5.44% |
| Class R4 2035 | [2] | 15.29% | 7.20% | 5.70% |
| Class R5 2035 | [3] | 15.49% | 7.36% | 5.84% |
| Class R6 2035 | [4] | 15.60% | 7.44% | 5.90% |
| Class Y 2035 | 15.47% | 7.35% | 5.83% | |
| Russell 3000® Index (no deduction for fees, expenses or taxes) | [5] | 25.96% | 15.16% | 11.48% |
| Bloomberg U.S. Aggregate Bond Index (no deduction for fees, expenses or taxes) | [5] | 5.53% | 1.10% | 1.81% |
| S&P Target Date To 2035 Index (no deduction for fees, expenses or taxes) | [5] | 16.48% | 8.98% | 6.59% |
| [1] | Performance for class R3 shares prior to their inception (1/4/21) is derived from the historical performance of class Y shares, adjusted for the higher 12b-1 fees and investor servicing fees applicable to class R3 shares (relative to the comparable fees applicable to class Y shares prior to the inception of class R3 shares). |
| [2] | Performance for class R4 shares prior to their inception (1/4/21) is derived from the historical performance of class Y shares, adjusted for the higher investor servicing fees applicable to class R4 shares (relative to the comparable fees applicable to class Y shares prior to the inception of class R4 shares). |
| [3] | Performance for class R5 shares prior to their inception (1/4/21) is derived from the historical performance of class R6 shares, adjusted for the higher investor servicing fees applicable to class R5 shares (relative to the comparable fees applicable to R6 shares prior to the inception of class R5 shares). |
| [4] | Performance for class R6 shares prior to their inception (9/1/16) is derived from the historical performance of class Y shares and has not been adjusted for the lower investor servicing fees applicable to class R6 shares (relative to the comparable fees applicable to class Y shares prior to the inception of class R6 shares); had it, returns would have been higher. |
| [5] | The table above compares the fund’s returns to the performance of three indexes: (i) the Russell 3000® Index, a broad measure of market performance, (ii) the Bloomberg U.S. Aggregate Bond Index, a broad measure of market performance, and (iii) the S&P Target Date To 2035 Index, an additional index that the Investment Manager believes more closely reflects the fund’s principal investment objective and strategies. |
| Class C share performance reflects conversion to class A shares after eight years. |
| After-tax returns reflect the historical highest individual federal marginal income tax rates and do not reflect state and local taxes. Actual after-tax returns depend on an investor’s tax situation and may differ from those shown. After-tax returns are shown for class A shares only and will vary for other classes. These after-tax returns do not apply if you hold your fund shares through a 401(k) plan, an IRA, or another tax-advantaged arrangement. |
| The Russell 3000® Index measures the performance of the 3,000 largest U.S. companies based on total market capitalization. Source: FTSE. |
| Frank Russell Company is the source and owner of the trademarks, service marks and copyrights related to the Russell Indexes. Russell ® is a trademark of Frank Russell Company. |
| The Bloomberg U.S. Aggregate Bond Index is an unmanaged index of U.S. investment-grade fixed income securities. |
| All Bloomberg indices are provided by Bloomberg Index Services Limited. |
| BLOOMBERG® is a trademark and service mark of Bloomberg Finance L.P. and its affiliates (collectively “Bloomberg”). Bloomberg or Bloomberg’s licensors own all proprietary rights in the Bloomberg Indices. Neither Bloomberg nor Bloomberg’s licensors approve or endorse this material, or guarantees the accuracy or completeness of any information herein, or makes any warranty, express or implied, as to the results to be obtained therefrom, and to the maximum extent allowed by law, neither shall have any liability or responsibility for injury or damages arising in connection therewith. |
| The S&P Target Date To Index Series is designed to represent a small, style-specific derived consensus of asset class exposure and glide path for a specified list of target retirement dates. |
| Securities in the fund do not match those in the indexes and the performance of the fund will differ. |
Putnam Sustainable Retirement 2030 Fund seeks capital appreciation and current income consistent with a decreasing emphasis on capital appreciation and an increasing emphasis on current income as it approaches its target date.
The following tables describe the fees and expenses you may pay if you buy, hold, and sell shares of the fund. You may pay other fees, such as brokerage commissions and other fees to financial intermediaries, which are not reflected in the tables and examples below. You may qualify for sales charge discounts if you and your family invest, or agree to invest in the future, at least $50,000 in Putnam funds. More information about these and other discounts is available from your financial professional and in How do I buy fund shares? beginning on page 227 of the fund’s prospectus, in the Appendix to the fund’s prospectus, and in How to buy shares beginning on page II-3 of the fund’s statement of additional information (“SAI”).
Shareholder Fees - Putnam Sustainable Retirement 2030 Fund |
Class A 2030 |
Class C 2030 |
Class R 2030 |
Class R3 2030 |
Class R4 2030 |
Class R5 2030 |
Class R6 2030 |
Class Y 2030 |
||
|---|---|---|---|---|---|---|---|---|---|---|
| Maximum Sales Charge Imposed on Purchases (as a percentage of Offering Price) | 5.75% | none | none | none | none | none | none | none | ||
| Maximum Deferred Sales Charge (as a percentage) | 1.00% | [1] | 1.00% | [2] | none | none | none | none | none | none |
| [1] | Applies only to certain redemptions of shares bought with no initial sales charge. |
| [2] | This charge is eliminated after one year. |
Annual Fund Operating Expenses - Putnam Sustainable Retirement 2030 Fund |
Class A 2030 |
Class C 2030 |
Class R 2030 |
Class R3 2030 |
Class R4 2030 |
Class R5 2030 |
Class R6 2030 |
Class Y 2030 |
|
|---|---|---|---|---|---|---|---|---|---|
| Management Fees (as a percentage of Assets) | 0.48% | 0.48% | 0.48% | 0.48% | 0.48% | 0.48% | 0.48% | 0.48% | |
| Distribution and Service (12b-1) Fees | 0.25% | 1.00% | 0.50% | 0.25% | none | none | none | none | |
| Other Expenses (as a percentage of Assets): | 0.19% | 0.19% | 0.34% | 0.34% | 0.34% | 0.19% | 0.09% | 0.19% | |
| Acquired Fund Fees and Expenses | 0.43% | 0.43% | 0.43% | 0.43% | 0.43% | 0.43% | 0.43% | 0.43% | |
| Expenses (as a percentage of Assets) | 1.35% | 2.10% | 1.75% | 1.50% | 1.25% | 1.10% | 1.00% | 1.10% | |
| Fee Waiver or Reimbursement | [1] | (0.50%) | (0.50%) | (0.50%) | (0.50%) | (0.50%) | (0.50%) | (0.50%) | (0.50%) |
| Net Expenses (as a percentage of Assets) | 0.85% | 1.60% | 1.25% | 1.00% | 0.75% | 0.60% | 0.50% | 0.60% | |
| [1] | Reflects a contractual obligation of the Investment Manager to limit certain fund expenses through November 30, 2027. This obligation may be modified or discontinued only with approval of the Board of Trustees. |
The following hypothetical example is intended to help you compare the cost of investing in the fund with the cost of investing in other funds. It assumes that you invest $10,000 in the fund for the time periods indicated and then, except as indicated, redeem all your shares at the end of those periods. It assumes a 5% return on your investment each year and that the fund’s operating expenses remain the same. Only the first three years of each period in the example take into account the expense reimbursement described above. Your actual costs may be higher or lower.
Expense Example - Putnam Sustainable Retirement 2030 Fund - USD ($) |
Expense Example, with Redemption, 1 Year |
Expense Example, with Redemption, 3 Years |
Expense Example, with Redemption, 5 Years |
Expense Example, with Redemption, 10 Years |
Expense Example, No Redemption, 1 Year |
Expense Example, No Redemption, 3 Years |
Expense Example, No Redemption, 5 Years |
Expense Example, No Redemption, 10 Years |
|---|---|---|---|---|---|---|---|---|
| Class A 2030 | 657 | 831 | 1,129 | 1,974 | ||||
| Class C 2030 | 263 | 505 | 983 | 2,110 | 163 | 505 | 983 | 2,110 |
| Class R 2030 | 127 | 397 | 800 | 1,930 | ||||
| Class R3 2030 | 102 | 318 | 668 | 1,654 | ||||
| Class R4 2030 | 77 | 240 | 534 | 1,371 | ||||
| Class R5 2030 | 61 | 192 | 452 | 1,197 | ||||
| Class R6 2030 | 51 | 160 | 398 | 1,080 | ||||
| Class Y 2030 | 61 | 192 | 452 | 1,197 |
The fund pays transaction-related costs, such as commissions, when it buys and sells securities (or “turns over” its portfolio). A higher turnover rate may indicate higher transaction costs and may result in higher taxes when the fund’s shares are held in a taxable account. These costs, which are not reflected in annual fund operating expenses or the above example, affect fund performance. The fund’s turnover rate in the most recent fiscal year was 29%.
Investments
The fund is one of a series of target date funds that invest primarily in exchange-traded funds (“ETFs”) that focus on investments with positive sustainability or environmental, social, and governance (“ESG”) characteristics, referred to as underlying funds. The underlying funds include funds managed by Franklin Advisers, Inc. (“Franklin Advisers” or the “Investment Manager”), the fund’s investment manager, and funds managed by affiliated investment advisers. The fund’s asset allocation strategy may be attractive to investors who plan to retire or otherwise intend to begin making periodic withdrawals of their investments in or about 2030
(the target date). The fund is designed to provide diversification among different asset classes by investing its assets in the underlying funds.
Under normal circumstances, the fund will invest in underlying funds (which, for purposes of this policy, include money market mutual funds advised by the Investment Manager or its affiliates) such that, in the aggregate, it has indirect exposure to investments that meet each underlying fund’s respective sustainability or ESG criteria and that represent at least 80% of the value of its net assets. This policy is non-fundamental and may be changed only after 60 days’ notice to shareholders. The Investment Manager may not apply ESG or sustainability criteria to investments that are not subject to the fund’s 80% policy, and such investments may not meet the applicable ESG or sustainability criteria. Through its investments in underlying funds, the fund makes use of a range of ESG- and sustainability- oriented investment strategies and invests across a variety of asset classes. The ESG or sustainability criteria will differ across the underlying funds. These differences may arise both from differences in the underlying funds’ asset classes (such as the characteristics of non-U.S. versus U.S. issuers, or the structural differences (e.g., position in the capital structure) between equity and fixed-income investments) as well as from different managers’ styles. In implementing an underlying fund’s investment strategy, the portfolio managers of the underlying fund may apply and weigh different ESG criteria differently than the portfolio managers of the other underlying funds. There are also expected to be differences in how the portfolio managers of the underlying funds source ESG-related or sustainability-oriented research (e.g., proprietary versus third-party research) and/or their approach to selecting companies based on ESG or sustainability criteria.
The fund’s target allocations among asset classes and underlying funds will increasingly emphasize capital preservation and income over time and will change gradually based on the number of remaining years until the fund’s target date, as shown in the predetermined “glide path” in the chart under “What are the funds’ and each underlying fund’s main investment strategies and related risks?” The Investment Manager adjusts these allocations at the end of each calendar quarter based on the glide path.
Pending investment in underlying funds, the fund also expects to temporarily invest cash balances resulting from purchase activity by fund shareholders in Putnam Government Money Market Fund, a mutual fund sponsored by the Investment Manager, or in cash or cash equivalents. The fund also expects to invest a portion of its assets in Putnam Government Money Market Fund or in cash or cash equivalents in order to manage shareholder redemptions. The percentage of a fund invested in Putnam Government Money Market Fund is expected to vary over time and will depend on the level of purchase and redemption activity by fund shareholders.
The following table presents your fund’s approximate allocations to each asset class and underlying fund as of September 30, 2024 (taking into account any tactical adjustments described below) and its projected approximate allocations to those asset classes and underlying funds as of September 30, 2025. The table does not
reflect temporary investments in Putnam Government Money Market Fund or in cash or cash equivalents. By comparing the percentage allocations of your fund in the table, you can see how its allocations are expected to change during the one-year period beginning on September 30, 2024. The table also shows the approximate allocations of other Putnam Sustainable Retirement Funds, which are designed for investors with different target retirement dates. Over a five-year period, each fund’s allocations will gradually change to resemble the allocations of the fund with the next earliest target date. The table illustrates how a fund’s allocations are expected to change over time to increasingly emphasize capital preservation and income.
| Underlying Fund* | Year | 2065 | 2060 | 2055 | 2050 | 2045 | 2040 | 2035 | 2030 (your fund) | 2025 | Maturity Fund |
| Putnam Sustainable Leaders ETF | 2024 | 48.6% | 47.2% | 44.8% | 42.3% | 39.7% | 36.4% | 31.7% | 21.0% | 14.9% | 14.1% |
| 2025 | 47.6% | 45.8% | 43.3% | 40.7% | 38.4% | 35.2% | 30.3% | 18.6% | 14.3% | 14.1% | |
| Putnam Sustainable Future ETF | 2024 | 23.8% | 23.1% | 21.9% | 20.6% | 19.4% | 17.9% | 15.8% | 10.5% | 7.5% | 7.1% |
| 2025 | 23.8% | 22.9% | 21.7% | 20.4% | 19.2% | 17.6% | 15.2% | 9.3% | 7.1% | 7.1% | |
| Putnam PanAgora ESG Inter-national Equity ETF | 2024 |
17.8% | 17.3% | 16.4% | 15.5% | 14.4% | 12.4% | 9.6% | 6.3% | 4.5% | 4.2% |
| 2025 | 17.8% | 17.2% | 16.2% | 15.3% | 14.2% | 11.9% | 9.1% | 5.6% | 4.3% | 4.2% | |
| Putnam PanAgora ESG Emer-ging Markets Equity ETF | 2024 |
4.9% | 4.8% | 4.5% | 4.2% | 3.8% | 2.2% | 0.1% | 0.0% | 0.0% | 0.0% |
| 2025 | 5.9% | 5.7% | 5.4% | 5.1% | 4.5% | 2.2% | 0.0% | 0.0% | 0.0% | 0.0% | |
| Putnam ESG Core Bond ETF | 2024 | 3.3% | 5.3% | 8.9% | 12.4% | 15.4% | 23.0% | 33.5% | 49.7% | 52.3% | 51.7% |
| 2025 | 3.3% | 5.9% | 9.7% | 13.0% | 16.1% | 24.8% | 35.4% | 53.4% | 51.8% | 51.7% | |
| Putnam ESG High Yield ETF | 2024 | 1.1% | 1.8% | 3.0% | 4.1% | 4.9% | 4.8% | 4.9% | 6.7% | 14.8% | 16.9% |
| 2025 | 1.1% | 2.0% | 3.2% | 4.3% | 4.9% | 4.8% | 5.3% | 7.1% | 16.5% | 16.9% | |
| Putnam ESG Ultra Short ETF | 2024 | 0.5% | 0.5% | 0.5% | 0.9% | 2.4% | 3.3% | 4.4% | 5.8% | 6.0% | 6.0% |
| 2025 | 0.5% | 0.5% | 0.5% | 1.2% | 2.7% | 3.5% | 4.7% | 6.0% | 6.0% | 6.0% | |
| Total Equity** | 2024 | 95.1% | 92.4% | 87.6% | 82.6% | 77.3% | 68.9% | 57.2% | 37.8% | 26.9% | 25.4% |
| 2025 | 95.1% | 91.6% | 86.6% | 81.5% | 76.3% | 66.9% | 54.6% | 33.5% | 25.7% | 25.4% | |
| Total Fixed Income** | 2024 | 4.9% | 7.6% | 12.4% | 17.4% | 22.7% | 31.1% | 42.8% | 62.2% | 73.1% | 74.6% |
| 2025 | 4.9% | 8.4% | 13.4% | 18.5% | 23.7% | 33.1% | 45.4% | 66.5% | 74.3% | 74.6% |
| * | Due to rounding, allocations shown in the table above may not total 100%. In addition, because of rounding in the calculation of allocations among underlying funds and market fluctuations, actual allocations might be more or less than these percentages. |
| ** | Equity and fixed-income allocations are hypothetical estimates based on an assumption that each of Putnam Sustainable Leaders ETF, Putnam Sustainable Future ETF, Putnam PanAgora ESG International Equity ETF, and Putnam PanAgora ESG Emerging Markets Equity ETF is equivalent to an equity investment and each of Putnam ESG Core Bond ETF, Putnam ESG High Yield ETF and Putnam ESG Ultra Short ETF is equivalent to a fixed-income investment. Actual allocations will vary. |
The fund’s target allocations may differ from the allocations shown in the table. The Investment Manager may change the glide path, the fund’s target allocations, and the underlying funds in which it invests at any time, although the Investment Manager generally expects these changes (other than the tactical adjustments described below) to be infrequent and generally in response to longer-term structural changes (e.g., in the average retirement age or life expectancy) that lead the fund’s portfolio managers to determine that a change is advisable. The Investment Manager may also make tactical adjustments from time to time in the fund’s allocations to underlying funds in response to market conditions within a range of +/- 15% from the allocations to fixed-income and equity asset classes as presented in the fund’s glide path.
It is assumed that investors will begin gradual withdrawals from the fund at around the target date. Near the end of the target date year, the fund’s target allocations will correspond to those of Putnam Sustainable Retirement Maturity Fund (“Maturity Fund”), a fund that seeks as high a rate of current income as the Investment Manager believes is consistent with preservation of capital, and the fund will be merged into Maturity Fund. More information about Maturity Fund is available in the prospectus beginning on page 171, and more information about the underlying funds (which are not offered by this prospectus) is included below and under “What are the funds’ and each underlying fund’s main investment strategies and related risks?”
Information about each underlying fund’s investment strategy
Putnam Sustainable Leaders ETF (“Sustainable Leaders ETF”)
Sustainable Leaders ETF invests mainly in common stocks of U.S. companies of any size, with a focus on companies that Putnam Investment Management, LLC (“Putnam Management”), Sustainable Leaders ETF’s investment manager, believes exhibit a commitment to financially material sustainable business practices. Sustainable Leaders ETF may also invest in non-U.S. companies. In evaluating investments for Sustainable Leaders ETF, Putnam Management views “financially material sustainable business practices” as business practices that it believes are reasonably likely to impact the financial condition or operating performance of a company and that relate to environmental, social, or corporate governance issues.
Under normal circumstances, Sustainable Leaders ETF invests at least 80% of the value of its net assets in securities that meet Putnam Management’s sustainability criteria. For a further discussion of Sustainable Leaders ETF’s investment strategy, please turn to the section What are the funds’ and each underlying fund’s main investment strategies and related risks? beginning on page 189.
Putnam Sustainable Future ETF (“Sustainable Future ETF”)
Sustainable Future ETF invests mainly in common stocks of U.S. companies of any size, with a focus on companies whose products and services Putnam Management, Sustainable Future ETF’s investment manager, believes provide solutions that directly contribute to sustainable social, environmental and economic development (Solutions Companies).
Under normal circumstances, Sustainable Future ETF invests at least 80% of the value of its net assets in securities that meet Putnam Management’s sustainability criteria. For a further discussion of Sustainable Future ETF’s investment strategy, please turn to the section What are the funds’ and each underlying fund’s main investment strategies and related risks? beginning on page 189.
Putnam PanAgora ESG International Equity ETF (“PanAgora International Equity ETF”)
PanAgora International Equity ETF invests mainly in common stocks (growth or value stocks or both) of companies of any size outside the United States with a focus on companies that PanAgora International Equity ETF’s subadviser, PanAgora Asset Management, Inc. (“PanAgora”), believes offer attractive benchmark-relative returns and exhibit positive ESG metrics. Under normal circumstances, PanAgora International Equity ETF invests at least 80% of its net assets in equity securities of companies that meet PanAgora’s ESG criteria. For a further discussion of PanAgora International Equity ETF’s investment strategy, please turn to the section What are the funds’ and each underlying fund’s main investment strategies and related risks? beginning on page 189.
Putnam PanAgora ESG Emerging Markets Equity ETF (“PanAgora Emerging Markets Equity ETF”)
PanAgora Emerging Markets Equity ETF invests mainly in common stocks (growth or value stocks or both) of emerging markets companies of any size with a focus on companies that PanAgora Emerging Markets Equity ETF’s subadviser, PanAgora, believes offer attractive benchmark-relative returns and exhibit positive ESG metrics. Under normal circumstances, PanAgora Emerging Markets Equity ETF invests at least 80% of its net assets in equity securities of emerging markets companies that meet PanAgora’s ESG criteria. For a further discussion of PanAgora Emerging Markets Equity ETF’s investment strategy, please turn to the section What are the funds’ and each underlying fund’s main investment strategies and related risks? beginning on page 189.
Putnam ESG Core Bond ETF (“Core Bond ETF”)
Core Bond ETF invests mainly in a diversified portfolio of investment-grade fixed-income securities with a focus on companies or issuers that Franklin Advisers, Core Bond ETF’s investment manager, believes meet relevant ESG criteria on a sector-specific basis. Under normal circumstances, Core Bond ETF invests at least 80% of the value of its net assets in fixed-income securities that meet Franklin Advisers’ ESG criteria. For a further discussion of Core Bond ETF’s investment strategy, please turn to the section What are the funds’ and each underlying fund’s main investment strategies and related risks? beginning on page 189.
Putnam ESG High Yield ETF (“High Yield ETF”)
High Yield ETF invests mainly in bonds that are below investment grade in quality (sometimes referred to as “junk bonds”) with a focus on companies or issuers that Franklin Advisers, High Yield ETF’s investment manager, believes meet relevant
ESG criteria on a sector-specific basis. High Yield ETF invests mainly in bonds that also have one or more of the following characteristics: (1) are obligations of U.S. companies or issuers and (2) have intermediate- to long-term maturities (three years or longer). Under normal circumstances, High Yield ETF invests at least 80% of the value of its net assets in fixed-income securities rated below investment grade that meet Franklin Advisers’ ESG criteria. For a further discussion of High Yield ETF’s investment strategy, please turn to the section What are the funds’ and each underlying fund’s main investment strategies and related risks? beginning on page 189.
Putnam ESG Ultra Short ETF (“Ultra Short ETF”)
Ultra Short ETF invests in a diversified short duration portfolio of fixed-income securities comprised of investment-grade money market and other fixed-income securities, including U.S. dollar-denominated foreign securities of these types, with a focus on companies or issuers that Franklin Advisers, Ultra Short ETF’s investment manager, believes meet relevant ESG criteria, on a sector-specific basis. Under normal circumstances, Ultra Short ETF invests at least 80% of the value of its net assets in fixed-income securities that meet Franklin Advisers’ ESG criteria. For a further discussion of Ultra Short ETF’s investment strategy, please turn to the section What are the funds’ and each underlying fund’s main investment strategies and related risks? beginning on page 189.
It is important to understand that you can lose money by investing in the fund. Losses may occur near, at or after the target date. There is no guarantee that the fund will provide adequate income at and through an investor’s retirement.
The fund’s allocation of assets among asset classes and the underlying funds may hurt performance. An underlying fund may change its investment program or policies without the fund’s approval, which could require the fund to reduce or eliminate its allocation to the underlying fund at an unfavorable time.
The fund invests in underlying funds and indirectly bears expenses related to the underlying funds. However, Putnam the Investment Manager has contractually agreed to waive fees, reimburse expenses of, or reimburse the fund through at least November 30, 2027 in an amount equal to the fund’s acquired fund fees and expenses (e.g., the fees and expenses incurred by the fund as a result of its investments in the underlying funds). The Investment Manager also has contractually agreed to waive fees and/or reimburse expenses of each class of shares of the fund through at least November 30, 2027 in an amount sufficient to result in total annual fund operating expenses for class A, C, R, R3, R4, R5, R6 and Y shares of the fund (exclusive of payments under the fund’s distribution plans, brokerage, interest, taxes, investment-related expenses, acquired fund fees and expenses, and extraordinary expenses) that equal 0.60%, 0.60%, 0.75%, 0.75%, 0.75%, 0.60%, 0.50%, and 0.60%, respectively, of the fund’s average net assets.
Pending investment in underlying funds, the fund also expects to temporarily invest cash balances resulting from purchase activity by fund shareholders in Putnam Government Money Market Fund, a money market mutual fund sponsored by the Investment Manager, or in cash or cash equivalents. In addition, the fund expects to invest a portion of its assets in Putnam Government Money Market Fund or in cash or cash equivalents in order to manage shareholder redemptions. Large positions in Putnam Government Money Market Fund or in cash or cash equivalents may dampen performance and may prevent the fund from achieving its goal. These practices may be subject to other risks, as described under Miscellaneous Investments, Investment Practices and Risks in the SAI.
The fund also bears the risks associated with the underlying funds identified below. The relative significance of these risks will vary over time based on the fund’s target allocations to the underlying funds and to equity and fixed-income asset classes, which may change from time to time as discussed above.
Investment Strategy-Related Risks of the Underlying Funds
Sustainability and ESG investing risk. Investing in underlying funds with an ESG or sustainability focus may result in the fund having exposure to underlying funds that invest in certain types of companies, issuers, industries or sectors that the market may not favor. In evaluating an investment opportunity for the underlying funds, Franklin Advisers, Putnam Management or PanAgora may make investment decisions without the availability of optimal ESG-related data (which may be even less available with securitized debt instruments) or based on information and data that is incomplete or inaccurate. Sustainability and ESG metrics are not uniformly defined, and applying such metrics involves subjective assessments. Sustainability and ESG scorings and assessments of issuers can vary across third-party data providers and may change over time. Franklin Advisers, Putnam Management and PanAgora do not rely exclusively on third-party data providers in evaluating sustainability and ESG criteria for the underlying funds. ESG information from third-party data providers may be incomplete, inaccurate or unavailable, particularly with respect to companies in emerging market countries, which may adversely impact the investment process. In addition, the business practices, products or services of issuers in which an underlying fund invests may change over time. As a result of these possibilities, among others, an underlying fund may temporarily hold securities that are inconsistent with the underlying fund’s ESG or sustainability investment criteria. Regulatory changes or interpretations regarding the definitions and/or use of ESG and/or sustainability criteria could have a material adverse effect on the underlying fund’s ability to invest in accordance with its investment policies and/or achieve its investment objective. The underlying funds do not restrict investments based solely on “negative screens”, and the underlying fixed-income funds do not restrict their fixed-income investments to “green bonds” (e.g., U.S. dollar-denominated bonds designated as “green” by the Climate Bonds Initiative). For the underlying funds that pursue fixed-income investment strategies, because fixed-income investments generally represent a promise to pay principal and interest by an issuer, and not an ownership interest, and may involve complex structures, ESG-related investment
considerations may have a more limited impact on risk and return (or may have an impact over a different investment time horizon) relative to other asset classes, and this may be particularly true for shorter-term investments. In addition, holders of fixed-income investments do not typically have voting rights, unlike holders of equity investments who have the right to vote on issuer proposals.
Market risk. The value of investments in the underlying funds’ portfolios may fall or fail to rise over extended periods of time for a variety of reasons, including general economic, political or financial market conditions, investor sentiment and market perceptions, government actions, geopolitical events or changes, outbreaks of infectious illnesses or other widespread public health issues (including epidemics and pandemics), and factors related to a specific issuer, geography, industry or sector. These and other factors may lead to increased volatility and reduced liquidity in the underlying funds’ portfolio holdings, may negatively impact the fund’s performance, and may exacerbate other risks to which the fund is subject.
Common stock risk. (For all underlying funds except Core Bond ETF, High Yield ETF and Ultra Short ETF) Common stock represents an ownership interest in a company. The value of a company’s stock may fall or fail to rise as a result of factors directly relating to that company, such as decisions made by its management or lower demand for the company’s products or services. A stock’s value may also fall because of factors affecting not just the company, but also other companies in the same industry or in a number of different industries, such as increases in production costs.
| Growth investing risk.. Growth stocks may be more susceptible to earnings disappointments, and the market may not favor growth-style investing. |
| Value investing risk. Value stocks may fail to rebound, and the market may not favor value-style investing. Companies whose stocks we believe are undervalued by the market may have experienced adverse business developments or may be subject to special risks that have caused their stocks to be out of favor. |
| Small and midsize companies risk. Stocks of small and midsize companies often trade in smaller volumes, and their prices may fluctuate more than stocks of larger companies. Stocks of these companies may therefore be more vulnerable to adverse developments than those of larger companies. |
Industry or sector concentration risk. (For all underlying funds except Core Bond ETF, High Yield ETF and Ultra Short ETF) From time to time, an underlying fund may invest a significant portion of its assets in companies in one or more related industries or sectors, which would make the underlying fund more vulnerable to adverse developments affecting those industries or sectors.
Model and data risk. (For all underlying funds except Sustainable Leaders ETF, Sustainable Future ETF and High Yield ETF) If the quantitative models or data that are used in managing an underlying fund prove to be incorrect or incomplete, investment decisions made in reliance on the models or data may not produce the desired results, and the underlying fund may realize losses. Additionally, market
movements are likely to change the risk levels and risk allocations of the underlying fund. Investments made based on quantitative models may perform differently from the market as a whole.
Foreign investment risk. (For all underlying funds except Ultra Short ETF, Sustainable Leaders ETF and Sustainable Future ETF) The value of international investments traded in foreign currencies may be adversely impacted by fluctuations in exchange rates. International investments, particularly investments in emerging markets, may carry risks associated with potentially less stable economies or governments (such as the risk of seizure by a foreign government, the imposition of currency or other restrictions, or high levels of inflation), and may be or become illiquid. There may be less publicly-available information, or less reliable publicly-available information, about foreign companies (including information related to companies’ ESG practices), particularly with respect to emerging market companies, than publicly-available information regarding U.S. companies. As a result, an underlying fund’s ability to evaluate a foreign company, including with respect to its ESG or sustainability practices, may be more limited than its ability to evaluate a U.S. company.
Geographic focus risk. (For PanAgora International Equity ETF and PanAgora Emerging Markets Equity ETF) From time to time, an underlying fund may invest a significant portion of its assets in companies in one or more related geographic regions, industries or sectors, such as European and Asian countries, which would make the fund more vulnerable to adverse developments affecting those geographic regions, industries or sectors, including political, economic, or other developments adversely impacting ESG or sustainable investing.
Fixed-income investments risk. (For Core Bond ETF, High Yield ETF and Ultra Short ETF) The risks associated with fixed-income investments include interest rate risk, which is the risk that the value of an underlying fund’s investments is likely to fall if interest rates rise. Fixed-income investments are also subject to credit risk, which is the risk that the issuer of a fixed-income investment may default on payment of interest or principal. Credit risk is generally greater for debt not backed by the full faith and credit of the U.S. government, and interest rate risk is generally greater for longer-term debt. Fixed-income investments may be more susceptible to downgrades or defaults during economic downturns or other periods of economic stress. Mortgage-backed investments, unlike traditional debt investments, are also subject to prepayment risk, which means that they may increase in value less than other bonds when interest rates decline and decline in value more than other bonds when interest rates rise. The underlying fund may have to invest the proceeds from prepaid investments, including mortgage-backed investments, in other investments with less attractive terms and yields. The underlying fund’s investments in mortgage-backed securities, and in certain other securities and derivatives, may be or become illiquid. The underlying fund’s investments in mortgage-backed securities may make the underlying fund’s net asset value more susceptible to economic, market, political and other developments affecting the residential and commercial real estate markets and the servicing of mortgage loans secured by real estate properties. During
periods of difficult economic conditions, delinquencies and losses on commercial mortgage-backed investments in particular generally increase, including as a result of the effects of those conditions on commercial real estate markets, the ability of commercial tenants to make loan payments, and the ability of a property to attract and retain commercial tenants.
One of the underlying funds, Putnam High Yield ETF, invests mostly in higher-yield, higher-risk debt investments that are rated below BBB or its equivalent at the time of purchase by any nationally recognized securities rating agency rating such investments, or in unrated investments that Franklin Advisers believes are of comparable quality. The underlying fund may invest up to 15% of the underlying fund’s total assets in debt investments rated below CCC or its equivalent, at the time of purchase, by each rating agency rating such investments, or in unrated investments that Franklin Advisers believes are of comparable quality. This includes investments in the lowest rating category of the rating agency. The underlying fund will not necessarily sell an investment if its rating is reduced after Franklin Advisers buys it. Investments rated below BBB or its equivalent are below-investment-grade in quality. This rating reflects a greater possibility that the issuers may be unable to make timely payments of interest and principal and thus default. If a default occurs, or is perceived as likely to occur, the value of the investment will usually be more volatile and is likely to fall. The value of a debt instrument may also be affected by changes in, or perceptions of, the financial condition of the issuer, borrower, counterparty, or other entity, or underlying collateral or assets, or changes in, or perceptions of, specific or general market, economic, industry, political, regulatory, geopolitical, environmental, public health, and other conditions. A default or expected default could also make it difficult for the underlying fund to sell the investment at a price approximating the value Franklin Advisers had previously placed on it. Lower-rated debt usually has a more limited market than higher-rated debt, which may at times make it difficult for the underlying fund to buy or sell certain debt instruments or to establish their fair values.
Derivatives risk. (For all underlying funds except PanAgora International Equity ETF, PanAgora Emerging Markets Equity ETF, Sustainable Leaders ETF and Sustainable Future ETF) An underlying fund’s use of derivatives may increase the risks of investing in the underlying fund by increasing investment exposure (which may be considered leverage) or, in the case of many over-the-counter instruments, because of the potential inability to terminate or sell derivatives positions and the potential failure of the other party to the instrument to meet its obligations. The risk of a party failing to meet its obligations may increase if the fund has significant investment exposure to that counterparty. The value of derivatives may move in unexpected ways due to unanticipated market movements, the use of leverage, imperfect correlation between the derivative instrument and the reference asset, or other factors, especially in unusual market conditions, and volatility in the value of derivatives could adversely impact the underlying fund’s returns, obligations and exposures. Derivatives are also subject to other risks, including liquidity risk (e.g., liquidity demands arising from the requirement to make payments to a derivative
counterparty), operational risk (e.g., settlement issues or system failure), and legal risk (e.g., insufficient legal documentation or contract enforceability issues).
Floating rate obligations risk. (For Core Bond ETF, High Yield ETF and Ultra Short ETF) To the extent an underlying fund holds floating rate loans, interest rate risk may be reduced but will not be eliminated. While floating rate loans are normally secured by specific collateral or assets of the issuer (so that holders of the loans, such as the underlying fund, will have a priority claim on those assets in the event of default or bankruptcy of the issuer), the value of collateral may be insufficient to meet the issuer’s obligations, and the underlying fund’s access to collateral may be limited by bankruptcy or other insolvency laws. The settlement period (the period between the execution of the trade and the delivery of cash to the purchaser) for floating rate loan transactions is typically longer than seven days, and it is possible that sale proceeds from floating rate loan transactions will not be available to meet redemption obligations.
Portfolio turnover rate risk. From time to time an underlying fund may engage in frequent trading. Funds with high turnover may be more likely to realize capital gains that must be distributed to shareholders as taxable income. High turnover may also cause a fund to pay more brokerage commissions and to incur other transaction costs (including imputed transaction costs), which may detract from performance. A fund’s portfolio turnover rate and the amount of brokerage commissions it pays and transaction costs it incurs will vary over time based on market conditions.
Management and operational risk. There is no guarantee that the investment techniques, analyses, or judgments that Franklin Advisers, Putnam Management or PanAgora, as applicable, applies in making investment decisions for the underlying funds will produce the intended outcome or that the investments they select for the underlying funds will perform as well as other securities that were not selected for the underlying funds. Franklin Advisers, Putnam Management, PanAgora, or the underlying funds’ other service providers, may experience disruptions or operating errors that could negatively impact the underlying funds.
Risks Related to Investing in ETFs
As ETFs, shares of the underlying funds are traded in the secondary market. Prior to trading in the secondary market, shares of the underlying funds are “created” at NAV by market makers, large investors and institutions (collectively, “authorized participants”) only in creation units. A creation transaction generally takes place when an authorized participant deposits into an underlying fund a designated portfolio of securities, assets or other positions (a “creation basket”), and an amount of cash (including any cash representing the value of substituted securities, assets or other positions), if any, in exchange for a specified number of creation units. Similarly, shares of an underlying fund can be redeemed only in creation units, generally for a designated portfolio of securities, assets or other positions held by the underlying fund and an amount of cash (including any portion of such securities for which cash may be substituted), if any.
Fluctuation of net asset value (“NAV”) and share price risk. Shares of the underlying funds may trade at a larger premium or discount to their NAV than shares of other ETFs. The NAV of an underlying fund will generally fluctuate with changes in the market value of the underlying fund’s holdings. Underlying fund shares can be bought and sold in the secondary market at market prices. Disruptions to creations and redemptions, the existence of extreme market volatility or potential lack of an active trading market for an underlying fund’s shares may result in the underlying fund’s shares trading significantly above (at a premium) or below (at a discount) to NAV or to the intraday value of the underlying fund’s holdings. In addition, in stressed market conditions or periods of market disruption or volatility, the market for shares of the underlying funds may become less liquid in response to deteriorating liquidity in the markets for the underlying funds’ portfolio holdings.
Authorized participant concentration risk. Only an authorized participant may engage in creation and redemption transactions directly with an underlying fund. Your fund is not an authorized participant and can only purchase and sell underlying fund shares in the secondary market at market prices or through an authorized participant. The underlying fund may have a limited number of financial institutions that act as authorized participants, none of which are obligated to engage in creation and/or redemption transactions. To the extent that those authorized participants do not engage in creation and redemption orders, there may be a significantly diminished trading market for underlying fund shares, or underlying fund shares may trade at a discount (or premium) to NAV and possibly face trading halts and/or de-listing.
Trading issues risk. The underlying funds have a limited public trading history. Sustainable Leaders ETF and Sustainable Future ETF began trading publicly in May 2021, while PanAgora International Equity ETF, PanAgora Emerging Markets Equity ETF, Core Bond ETF, High Yield ETF, and Ultra Short ETF began trading publicly in January 2023. There can be no assurance that an active trading market will develop or be maintained or that the market for underlying fund shares will operate as intended, which could lead to the underlying funds’ shares trading at wider spreads and larger premiums and discounts to NAV than other actively managed ETFs. As a result, it may cost the fund more to trade underlying fund shares than shares of other ETFs. There is no guarantee that the underlying fund will be able to attract market makers and authorized participants. Market makers and authorized participants are not obligated to make a market in the underlying fund’s shares or to submit purchase and redemption orders for creation units.
The market prices of an underlying fund’s shares are expected to fluctuate, in some cases materially, in response to changes in the underlying fund’s NAV, the intraday value of the underlying fund’s holdings and supply and demand for the underlying fund’s shares. Each underlying fund’s respective investment manager cannot predict whether an underlying fund’s shares will trade above, below or at their NAV or the intraday value of the underlying fund’s holdings. During periods when an underlying fund is trading below its NAV, the fund may incur significant losses if it sells its underlying fund shares.
The securities held by an underlying fund may be traded in markets that close at a different time than the exchange on which the underlying fund’s shares are listed. Liquidity in those securities may be reduced after the applicable closing times. Accordingly, during the time when the exchange is open but after the applicable market closing, fixing or settlement times, bid-ask spreads on the exchange and the corresponding premium or discount to the NAV of the underlying funds’ shares may widen.
Large shareholder risk. Each underlying fund may be an investment option for mutual funds that are managed by Franklin Resources, Inc. (“Franklin Templeton”) and its affiliates as “funds of funds.” Additionally, other investors from time to time may make substantial investments in an underlying fund, including affiliates of Franklin Templeton, through seed capital arrangements. Such shareholders may at times be considered to control an underlying fund. Dispositions of a large number of shares by these shareholders may adversely affect an underlying fund’s liquidity and net assets to the extent such transactions are executed directly with the underlying fund in the form of redemptions through an authorized participant, rather than executed in the secondary market. These redemptions may also force an underlying fund to sell securities, which may increase the underlying fund’s brokerage costs. In addition, underlying fund returns may be adversely affected if an underlying fund holds a portion of its assets in liquid, cash-like investments in connection with or in anticipation of shareholder redemptions. To the extent these large shareholders transact in shares of an underlying fund on the secondary market, such transactions may account for a large percentage of the trading volume on the exchange and may, therefore, have a material effect (upward or downward) on the market price of the underlying fund’s shares.
Cash transactions risk. Some of the underlying funds may effect creations and redemptions in cash or partially in cash. Therefore, an underlying fund may be required to sell portfolio securities, incur transaction costs, and subsequently recognize gains on such sales that the underlying fund might not have recognized if it were to distribute portfolio securities in-kind. As such, investments by a fund in an underlying fund’s shares may be less tax-efficient than an investment in an ETF that distributes portfolio securities entirely in-kind. An underlying fund may also incur transaction costs in connection with creations effected in cash (in whole or in part).
Semi-transparent ETF risk. (For Sustainable Leaders ETF and Sustainable Future ETF) Two of the underlying funds, Putnam Sustainable Leaders ETF and Putnam Sustainable Future ETF (the “Semi-Transparent ETFs”), are different from traditional ETFs, including the other underlying funds. Traditional ETFs disclose to the public what assets they hold each day. However, the Semi-Transparent ETFs do not. This may create additional risks for an investment in the Semi-Transparent ETFs, including that an investor may have to pay more money to trade the Semi-Transparent ETF’s shares in light of the fact that the Semi-Transparent ETF will provide less information to traders, who tend to charge more for trades when they have less information. The price an investor pays to buy or sell an ETF’s shares on an exchange may not
match the value of the ETF’s portfolio, and these price differences may be greater for the Semi-Transparent ETFs compared to other ETFs because they provide less information to traders. These additional risks may be even greater in adverse or uncertain market conditions.
The differences between the Semi-Transparent ETFs and other ETFs may also have advantages. By keeping certain information about the Semi-Transparent ETFs secret, a Semi-Transparent ETF may face less risk that other traders can predict or copy its investment strategy. This may improve the Semi-Transparent ETF’s performance. If other traders are able to copy or predict the Semi-Transparent ETF’s investment strategy, however, this may hurt the Semi-Transparent ETF’s performance.
Tracking basket structure risk. (For Sustainable Leaders ETF and Sustainable Future ETF) The Semi-Transparent ETFs are actively managed ETFs that operate pursuant to an exemptive order from the Securities and Exchange Commission and do not publicly disclose their complete portfolio holdings each business day. Instead, each Semi-Transparent ETF publishes each business day on its website a “Tracking Basket,” which is designed to closely track the daily performance of the Semi-Transparent ETF but is not the Semi-Transparent ETF’s actual portfolio. The Tracking Basket is comprised of: (1) select recently disclosed portfolio holdings and/or select securities from the universe from which the Semi-Transparent ETF’s investments are selected (“Strategy Components”); (2) liquid ETFs that convey information about the types of instruments (that are not otherwise fully represented by the Strategy Components) in which the Semi-Transparent ETF invests; and (3) cash and cash equivalents.
A Semi-Transparent ETF’s Tracking Basket structure may affect the price at which shares of the Semi-Transparent ETF trade in the secondary market. Although the Tracking Basket is intended to provide investors with enough information to allow for an effective arbitrage mechanism that will keep the market price of each Semi-Transparent ETF at or close to its NAV per share, there is a risk that market prices will vary significantly from NAV. The Semi-Transparent ETFs, which trade on the basis of a published Tracking Basket, may trade at a wider bid/ask spread than ETFs that publish their portfolios on a daily basis, and therefore, may cost investors more to trade. These risks may increase during periods of market disruption or volatility. In addition, although each Semi-Transparent ETF seeks to benefit from keeping its portfolio information secret, market participants may attempt to use the Tracking Basket to identify the Semi-Transparent ETF’s trading strategy. If successful, this could result in such market participants engaging in certain predatory trading practices that may have the potential to harm the Semi-Transparent ETF and its shareholders, such as front running the Semi-Transparent ETF’s trades of portfolio securities.
Arbitrage risk. (For Sustainable Leaders ETF and Sustainable Future ETF) Unlike ETFs that publicly disclose their complete portfolio holdings each business day, each Semi-Transparent ETF provides certain other information intended to allow market participants to estimate the value of positions in the Semi-Transparent ETF’s shares.
Although this information is designed to facilitate arbitrage opportunities in the Semi-Transparent ETF’s shares to reduce bid/ask spreads and minimize discounts or premiums between the market price and NAV of the Semi-Transparent ETF shares, there is no guarantee the Semi-Transparent ETF’s arbitrage mechanism will operate as intended and that the Semi-Transparent ETF will not experience wide bid/ask spreads and/or large discounts or premiums to NAV. In addition, market participants may attempt to use the disclosed information to “reverse engineer” the Semi-Transparent ETF’s trading strategy, which, if successful, could increase opportunities for predatory trading practices that may have the potential to negatively impact the Semi-Transparent ETF’s performance.
Trading halt risk. (For Sustainable Leaders ETF and Sustainable Future ETF) There may be circumstances where a security held in a Semi-Transparent ETF’s portfolio but not in the Tracking Basket does not have readily available market quotations. If Putnam Management determines that such circumstance may affect the reliability of the Tracking Basket as an arbitrage vehicle, that information, along with the identity and weighting of that security in the Semi-Transparent ETF’s portfolio, will be publicly disclosed on the Semi-Transparent ETF’s website, and Putnam Management will assess appropriate remedial measures. In these circumstances, market participants may use this information to engage in certain predatory trading practices that may have the potential to harm the Semi-Transparent ETF and its shareholders. In addition, if securities representing 10% or more of the Semi-Transparent ETF’s portfolio do not have readily available market quotations, Putnam Management would promptly request the exchange to halt trading of the Semi-Transparent ETF, meaning that investors (including the fund) would not be able to trade their shares. Trading may also be halted in other circumstances, for example, due to market conditions.
The fund may not achieve its goal, and it is not intended to be a complete investment program. An investment in the fund is not insured or guaranteed by the Federal Deposit Insurance Corporation or any other government agency.
The performance information below gives some indication of the risks associated with an investment in the fund by showing the fund’s performance year to year and over time. Before February 10, 2023, the fund was managed with a materially different investment strategy and may have achieved materially different performance results under its current investment strategy from that shown for periods before this date. The bar chart does not reflect the impact of sales charges. If it did, performance would be lower. Please remember that past performance is not necessarily an indication of future results. Monthly performance figures for the fund are available at www.franklintempleton.com.
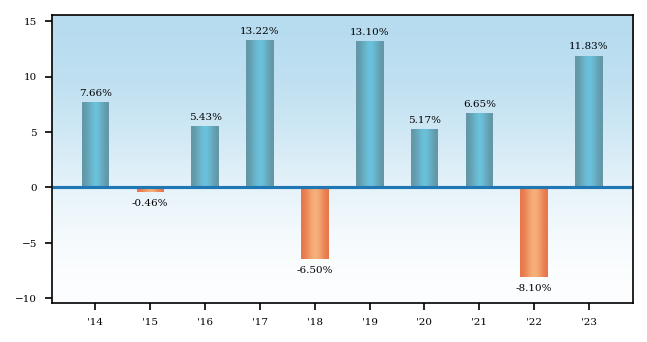
Average Annual Total Returns - Putnam Sustainable Retirement 2030 Fund |
1 Year |
5 Years |
10 Years |
|
|---|---|---|---|---|
| Class A 2030 | 5.40% | 4.21% | 3.93% | |
| Class A 2030 | After Taxes on Distributions | 4.18% | 2.41% | 2.46% | |
| Class A 2030 | After Taxes on Distributions and Sales | 3.26% | 2.73% | 2.60% | |
| Class C 2030 | 10.07% | 4.67% | 3.92% | |
| Class R 2030 | 11.43% | 5.09% | 4.24% | |
| Class R3 2030 | [1] | 11.71% | 5.31% | 4.40% |
| Class R4 2030 | [2] | 11.95% | 5.56% | 4.66% |
| Class R5 2030 | [3] | 12.14% | 5.72% | 4.80% |
| Class R6 2030 | [4] | 12.24% | 5.81% | 4.87% |
| Class Y 2030 | 12.17% | 5.72% | 4.80% | |
| Russell 3000® Index (no deduction for fees, expenses or taxes) | [5] | 25.96% | 15.16% | 11.48% |
| Bloomberg U.S. Aggregate Bond Index (no deduction for fees, expenses or taxes) | [5] | 5.53% | 1.10% | 1.81% |
| S&P Target Date To 2030 Index (no deduction for fees, expenses or taxes) | [5] | 14.44% | 7.90% | 6.01% |
| [1] | Performance for class R3 shares prior to their inception (1/4/21) is derived from the historical performance of class Y shares, adjusted for the higher 12b-1 fees and investor servicing fees applicable to class R3 shares (relative to the comparable fees applicable to class Y shares prior to the inception of class R3 shares). |
| [2] | Performance for class R4 shares prior to their inception (1/4/21) is derived from the historical performance of class Y shares, adjusted for the higher investor servicing fees applicable to class R4 shares (relative to the comparable fees applicable to class Y shares prior to the inception of class R4 shares). |
| [3] | Performance for class R5 shares prior to their inception (1/4/21) is derived from the historical performance of class R6 shares, adjusted for the higher investor servicing fees applicable to class R5 shares (relative to the comparable fees applicable to R6 shares prior to the inception of class R5 shares). |
| [4] | Performance for class R6 shares prior to their inception (9/1/16) is derived from the historical performance of class Y shares and has not been adjusted for the lower investor servicing fees applicable to class R6 shares (relative to the comparable fees applicable to class Y shares prior to the inception of class R6 shares); had it, returns would have been higher. |
| [5] | The table above compares the fund’s returns to the performance of three indexes: (i) the Russell 3000® Index, a broad measure of market performance, (ii) the Bloomberg U.S. Aggregate Bond Index, a broad measure of market performance, and (iii) the S&P Target Date To 2030 Index, an additional index that the Investment Manager believes more closely reflects the fund’s principal investment objective and strategies. |
| Class C share performance reflects conversion to class A shares after eight years. |
| After-tax returns reflect the historical highest individual federal marginal income tax rates and do not reflect state and local taxes. Actual after-tax returns depend on an investor’s tax situation and may differ from those shown. After-tax returns are shown for class A shares only and will vary for other classes. These after-tax returns do not apply if you hold your fund shares through a 401(k) plan, an IRA, or another tax-advantaged arrangement. |
| The Russell 3000® Index measures the performance of the 3,000 largest U.S. companies based on total market capitalization. Source: FTSE. |
| Frank Russell Company is the source and owner of the trademarks, service marks and copyrights related to the Russell Indexes. Russell ® is a trademark of Frank Russell Company. |
| The Bloomberg U.S. Aggregate Bond Index is an unmanaged index of U.S. investment-grade fixed income securities. |
| All Bloomberg indices are provided by Bloomberg Index Services Limited. |
| BLOOMBERG® is a trademark and service mark of Bloomberg Finance L.P. and its affiliates (collectively “Bloomberg”). Bloomberg or Bloomberg’s licensors own all proprietary rights in the Bloomberg Indices. Neither Bloomberg nor Bloomberg’s licensors approve or endorse this material, or guarantees the accuracy or completeness of any information herein, or makes any warranty, express or implied, as to the results to be obtained therefrom, and to the maximum extent allowed by law, neither shall have any liability or responsibility for injury or damages arising in connection therewith. |
| The S&P Target Date To Index Series is designed to represent a small, style-specific derived consensus of asset class exposure and glide path for a specified list of target retirement dates. |
| Securities in the fund do not match those in the indexes and the performance of the fund will differ. |
Putnam Sustainable Retirement 2025 Fund seeks capital appreciation and current income consistent with a decreasing emphasis on capital appreciation and an increasing emphasis on current income as it approaches its target date.
The following tables describe the fees and expenses you may pay if you buy, hold, and sell shares of the fund. You may pay other fees, such as brokerage commissions and other fees to financial intermediaries, which are not reflected in the tables and examples below. You may qualify for sales charge discounts if you and your family invest, or agree to invest in the future, at least $50,000 in Putnam funds. More information about these and other discounts is available from your financial professional and in How do I buy fund shares? beginning on page 227 of the fund’s prospectus, in the Appendix to the fund’s prospectus, and in How to buy shares beginning on page II-3 of the fund’s statement of additional information (“SAI”).
Shareholder Fees - Putnam Sustainable Retirement 2025 Fund |
Class A 2025 |
Class C 2025 |
Class R 2025 |
Class R3 2025 |
Class R4 2025 |
Class R5 2025 |
Class R6 2025 |
Class Y 2025 |
||
|---|---|---|---|---|---|---|---|---|---|---|
| Maximum Sales Charge Imposed on Purchases (as a percentage of Offering Price) | 5.75% | none | none | none | none | none | none | none | ||
| Maximum Deferred Sales Charge (as a percentage) | 1.00% | [1] | 1.00% | [2] | none | none | none | none | none | none |
| [1] | Applies only to certain redemptions of shares bought with no initial sales charge. |
| [2] | This charge is eliminated after one year. |
Annual Fund Operating Expenses - Putnam Sustainable Retirement 2025 Fund |
Class A 2025 |
Class C 2025 |
Class R 2025 |
Class R3 2025 |
Class R4 2025 |
Class R5 2025 |
Class R6 2025 |
Class Y 2025 |
|
|---|---|---|---|---|---|---|---|---|---|
| Management Fees (as a percentage of Assets) | 0.47% | 0.47% | 0.47% | 0.47% | 0.47% | 0.47% | 0.47% | 0.47% | |
| Distribution and Service (12b-1) Fees | 0.25% | 1.00% | 0.50% | 0.25% | none | none | none | none | |
| Other Expenses (as a percentage of Assets): | 0.19% | 0.19% | 0.34% | 0.34% | 0.34% | 0.19% | 0.09% | 0.19% | |
| Acquired Fund Fees and Expenses | 0.43% | 0.43% | 0.43% | 0.43% | 0.43% | 0.43% | 0.43% | 0.43% | |
| Expenses (as a percentage of Assets) | 1.34% | 2.09% | 1.74% | 1.49% | 1.24% | 1.09% | 0.99% | 1.09% | |
| Fee Waiver or Reimbursement | [1] | (0.49%) | (0.49%) | (0.49%) | (0.49%) | (0.49%) | (0.49%) | (0.49%) | (0.49%) |
| Net Expenses (as a percentage of Assets) | 0.85% | 1.60% | 1.25% | 1.00% | 0.75% | 0.60% | 0.50% | 0.60% | |
| [1] | Reflects a contractual obligation of the Investment Manager to limit certain fund expenses through November 30, 2027. This obligation may be modified or discontinued only with approval of the Board of Trustees. |
The following hypothetical example is intended to help you compare the cost of investing in the fund with the cost of investing in other funds. It assumes that you invest $10,000 in the fund for the time periods indicated and then, except as indicated, redeem all your shares at the end of those periods. It assumes a 5% return on your investment each year and that the fund’s operating expenses remain the same. Only the first three years of each period in the example take into account the expense reimbursement described above. Your actual costs may be higher or lower.
Expense Example - Putnam Sustainable Retirement 2025 Fund - USD ($) |
Expense Example, with Redemption, 1 Year |
Expense Example, with Redemption, 3 Years |
Expense Example, with Redemption, 5 Years |
Expense Example, with Redemption, 10 Years |
Expense Example, No Redemption, 1 Year |
Expense Example, No Redemption, 3 Years |
Expense Example, No Redemption, 5 Years |
Expense Example, No Redemption, 10 Years |
|---|---|---|---|---|---|---|---|---|
| Class A 2025 | 657 | 831 | 1,127 | 1,966 | ||||
| Class C 2025 | 263 | 505 | 981 | 2,102 | 163 | 505 | 981 | 2,102 |
| Class R 2025 | 127 | 397 | 798 | 1,922 | ||||
| Class R3 2025 | 102 | 318 | 665 | 1,646 | ||||
| Class R4 2025 | 77 | 240 | 531 | 1,362 | ||||
| Class R5 2025 | 61 | 192 | 450 | 1,188 | ||||
| Class Y 2025 | 61 | 192 | 450 | 1,188 |
The fund pays transaction-related costs, such as commissions, when it buys and sells securities (or “turns over” its portfolio). A higher turnover rate may indicate higher transaction costs and may result in higher taxes when the fund’s shares are held in a taxable account. These costs, which are not reflected in annual fund operating expenses or the above example, affect fund performance. The fund’s turnover rate in the most recent fiscal year was 32%.
Investments
The fund is one of a series of target date funds that invest primarily in exchange-traded funds (“ETFs”) that focus on investments with positive sustainability or environmental, social, and governance (“ESG”) characteristics, referred to as underlying funds. The underlying funds include funds managed by Franklin Advisers, Inc. (“Franklin Advisers” or the “Investment Manager”), the fund’s investment manager, and funds managed by affiliated investment advisers. The fund’s asset allocation strategy may be attractive to investors who plan to retire or otherwise intend to begin making periodic withdrawals of their investments in or about 2025 (the target date). The fund is designed to provide diversification among different asset classes by investing its assets in the underlying funds.
Under normal circumstances, the fund will invest in underlying funds (which, for purposes of this policy, include money market mutual funds advised by the Investment Manager or its affiliates) such that, in the aggregate, it has indirect exposure to investments that meet each underlying fund’s respective sustainability or ESG criteria and that represent at least 80% of the value of its net assets. This policy is non-fundamental and may be changed only after 60 days’ notice to shareholders. The Investment Manager may not apply ESG or sustainability criteria to investments that are not subject to the fund’s 80% policy, and such investments may not meet the applicable ESG or sustainability criteria. Through its investments in underlying funds, the fund makes use of a range of ESG- and sustainability- oriented investment strategies and invests across a variety of asset classes. The ESG or sustainability criteria will differ across the underlying funds. These differences may arise both from differences in the underlying funds’ asset classes (such as the characteristics of non-U.S. versus U.S. issuers, or the structural differences (e.g., position in the capital structure) between equity and fixed-income investments) as well as from different managers’ styles. In implementing an underlying fund’s investment strategy, the portfolio managers of the underlying fund may apply and weigh different ESG criteria differently than the portfolio managers of the other underlying funds. There are also expected to be differences in how the portfolio managers of the underlying funds source ESG-related or sustainability-oriented research (e.g., proprietary versus third-party research) and/or their approach to selecting companies based on ESG or sustainability criteria.
The fund’s target allocations among asset classes and underlying funds will increasingly emphasize capital preservation and income over time and will change gradually based on the number of remaining years until the fund’s target date, as shown in the predetermined “glide path” in the chart under “What are the funds’ and each underlying fund’s main investment strategies and related risks?” The Investment Manager adjusts these allocations at the end of each calendar quarter based on the glide path.
Pending investment in underlying funds, the fund also expects to temporarily invest cash balances resulting from purchase activity by fund shareholders in Putnam Government Money Market Fund, a mutual fund sponsored by the Investment Manager, or in cash or cash equivalents. The fund also expects to invest a portion of its assets in Putnam Government Money Market Fund or in cash or cash equivalents in order to manage shareholder redemptions. The percentage of a fund invested in Putnam Government Money Market Fund is expected to vary over time and will depend on the level of purchase and redemption activity by fund shareholders.
The following table presents your fund’s approximate allocations to each asset class and underlying fund as of September 30, 2024 (taking into account any tactical adjustments described below) and its projected approximate allocations to those asset classes and underlying funds as of September 30, 2025. The table does not reflect temporary investments in Putnam Government Money Market Fund or in cash or cash equivalents. By comparing the percentage allocations of your fund in the table, you can see how its allocations are expected to change during the one-year period beginning on September 30, 2024. The table also shows the approximate allocations of other Putnam Sustainable Retirement Funds, which are designed for investors with different target retirement dates. Over a five-year period, each fund’s allocations will gradually change to resemble the allocations of the fund with the next earliest target date. The table illustrates how a fund’s allocations are expected to change over time to increasingly emphasize capital preservation and income.
| Underlying Fund* | Year | 2065 | 2060 | 2055 | 2050 | 2045 | 2040 | 2035 | 2030 | 2025 (your fund) | Maturity Fund |
| Putnam Sustainable Leaders ETF | 2024 | 48.6% | 47.2% | 44.8% | 42.3% | 39.7% | 36.4% | 31.7% | 21.0% | 14.9% | 14.1% |
| 2025 | 47.6% | 45.8% | 43.3% | 40.7% | 38.4% | 35.2% | 30.3% | 18.6% | 14.3% | 14.1% | |
| Putnam Sustainable Future ETF | 2024 | 23.8% | 23.1% | 21.9% | 20.6% | 19.4% | 17.9% | 15.8% | 10.5% | 7.5% | 7.1% |
| 2025 | 23.8% | 22.9% | 21.7% | 20.4% | 19.2% | 17.6% | 15.2% | 9.3% | 7.1% | 7.1% | |
| Putnam PanAgora ESG Inter-national Equity ETF | 2024 |
17.8% | 17.3% | 16.4% | 15.5% | 14.4% | 12.4% | 9.6% | 6.3% | 4.5% | 4.2% |
| 2025 | 17.8% | 17.2% | 16.2% | 15.3% | 14.2% | 11.9% | 9.1% | 5.6% | 4.3% | 4.2% | |
| Putnam PanAgora ESG Emer-ging Markets Equity ETF | 2024 |
4.9% | 4.8% | 4.5% | 4.2% | 3.8% | 2.2% | 0.1% | 0.0% | 0.0% | 0.0% |
| 2025 | 5.9% | 5.7% | 5.4% | 5.1% | 4.5% | 2.2% | 0.0% | 0.0% | 0.0% | 0.0% | |
| Putnam ESG Core Bond ETF | 2024 | 3.3% | 5.3% | 8.9% | 12.4% | 15.4% | 23.0% | 33.5% | 49.7% | 52.3% | 51.7% |
| 2025 | 3.3% | 5.9% | 9.7% | 13.0% | 16.1% | 24.8% | 35.4% | 53.4% | 51.8% | 51.7% | |
| Putnam ESG High Yield ETF | 2024 | 1.1% | 1.8% | 3.0% | 4.1% | 4.9% | 4.8% | 4.9% | 6.7% | 14.8% | 16.9% |
| 2025 | 1.1% | 2.0% | 3.2% | 4.3% | 4.9% | 4.8% | 5.3% | 7.1% | 16.5% | 16.9% | |
| Putnam ESG Ultra Short ETF | 2024 | 0.5% | 0.5% | 0.5% | 0.9% | 2.4% | 3.3% | 4.4% | 5.8% | 6.0% | 6.0% |
| 2025 | 0.5% | 0.5% | 0.5% | 1.2% | 2.7% | 3.5% | 4.7% | 6.0% | 6.0% | 6.0% | |
| Total Equity** | 2024 | 95.1% | 92.4% | 87.6% | 82.6% | 77.3% | 68.9% | 57.2% | 37.8% | 26.9% | 25.4% |
| 2025 | 95.1% | 91.6% | 86.6% | 81.5% | 76.3% | 66.9% | 54.6% | 33.5% | 25.7% | 25.4% | |
| Total Fixed Income** | 2024 | 4.9% | 7.6% | 12.4% | 17.4% | 22.7% | 31.1% | 42.8% | 62.2% | 73.1% | 74.6% |
| 2025 | 4.9% | 8.4% | 13.4% | 18.5% | 23.7% | 33.1% | 45.4% | 66.5% | 74.3% | 74.6% |
| * | Due to rounding, allocations shown in the table above may not total 100%. In addition, because of rounding in the calculation of allocations among underlying funds and market fluctuations, actual allocations might be more or less than these percentages. |
| ** | Equity and fixed-income allocations are hypothetical estimates based on an assumption that each of Putnam Sustainable Leaders ETF, Putnam Sustainable Future ETF, Putnam PanAgora ESG International Equity ETF, and Putnam PanAgora ESG Emerging Markets Equity ETF is equivalent to an equity investment and each of Putnam ESG Core Bond ETF, Putnam ESG High Yield ETF and Putnam ESG Ultra Short ETF is equivalent to a fixed-income investment. Actual allocations will vary. |
The fund’s target allocations may differ from the allocations shown in the table. The Investment Manager may change the glide path, the fund’s target allocations, and the underlying funds in which it invests at any time, although the Investment Manager generally expects these changes (other than the tactical adjustments described below) to be infrequent and generally in response to longer-term structural changes (e.g., in the average retirement age or life expectancy) that lead the fund’s portfolio managers to determine that a change is advisable. The Investment Manager may also make tactical adjustments from time to time in the fund’s allocations to underlying funds in response to market conditions within a range of +/- 15% from the allocations to fixed-income and equity asset classes as presented in the fund’s glide path.
It is assumed that investors will begin gradual withdrawals from the fund at around the target date. Near the end of the target date year, the fund’s target allocations will correspond to those of Putnam Sustainable Retirement Maturity Fund (“Maturity Fund”), a fund that seeks as high a rate of current income as the Investment Manager believes is consistent with preservation of capital, and the fund will be merged into Maturity Fund. More information about Maturity Fund is available in the prospectus beginning on page 171, and more information about the underlying funds (which are not offered by this prospectus) is included below and under “What are the funds’ and each underlying fund’s main investment strategies and related risks?”
Information about each underlying fund’s investment strategy
Putnam Sustainable Leaders ETF (“Sustainable Leaders ETF”)
Sustainable Leaders ETF invests mainly in common stocks of U.S. companies of any size, with a focus on companies that Putnam Investment Management, LLC (“Putnam Management”), Sustainable Leaders ETF’s investment manager, believes exhibit a commitment to financially material sustainable business practices. Sustainable Leaders ETF may also invest in non-U.S. companies. In evaluating investments for Sustainable Leaders ETF, Putnam Management views “financially material sustainable business practices” as business practices that it believes are reasonably likely to impact the financial condition or operating performance of a company and that relate to environmental, social, or corporate governance issues.
Under normal circumstances, Sustainable Leaders ETF invests at least 80% of the value of its net assets in securities that meet Putnam Management’s sustainability criteria. For a further discussion of Sustainable Leaders ETF’s investment strategy, please turn to the section What are the funds’ and each underlying fund’s main investment strategies and related risks? beginning on page 189.
Putnam Sustainable Future ETF (“Sustainable Future ETF”)
Sustainable Future ETF invests mainly in common stocks of U.S. companies of any size, with a focus on companies whose products and services Putnam Management, Sustainable Future ETF’s investment manager, believes provide solutions that directly contribute to sustainable social, environmental and economic development (Solutions Companies).
Under normal circumstances, Sustainable Future ETF invests at least 80% of the value of its net assets in securities that meet Putnam Management’s sustainability criteria. For a further discussion of Sustainable Future ETF’s investment strategy, please turn to the section What are the funds’ and each underlying fund’s main investment strategies and related risks? beginning on page 189.
Putnam PanAgora ESG International Equity ETF (“PanAgora International Equity ETF”)
PanAgora International Equity ETF invests mainly in common stocks (growth or value stocks or both) of companies of any size outside the United States with a focus on companies that PanAgora International Equity ETF’s subadviser, PanAgora Asset Management, Inc. (“PanAgora”), believes offer attractive benchmark-relative
returns and exhibit positive ESG metrics. Under normal circumstances, PanAgora International Equity ETF invests at least 80% of its net assets in equity securities of companies that meet PanAgora’s ESG criteria. For a further discussion of PanAgora International Equity ETF’s investment strategy, please turn to the section What are the funds’ and each underlying fund’s main investment strategies and related risks? beginning on page 189.
Putnam PanAgora ESG Emerging Markets Equity ETF (“PanAgora Emerging Markets Equity ETF”)
PanAgora Emerging Markets Equity ETF invests mainly in common stocks (growth or value stocks or both) of emerging markets companies of any size with a focus on companies that PanAgora Emerging Markets Equity ETF’s subadviser, PanAgora, believes offer attractive benchmark-relative returns and exhibit positive ESG metrics. Under normal circumstances, PanAgora Emerging Markets Equity ETF invests at least 80% of its net assets in equity securities of emerging markets companies that meet PanAgora’s ESG criteria. For a further discussion of PanAgora Emerging Markets Equity ETF’s investment strategy, please turn to the section What are the funds’ and each underlying fund’s main investment strategies and related risks? beginning on page 189.
Putnam ESG Core Bond ETF (“Core Bond ETF”)
Core Bond ETF invests mainly in a diversified portfolio of investment-grade fixed-income securities with a focus on companies or issuers that Franklin Advisers, Core Bond ETF’s investment manager, believes meet relevant ESG criteria on a sector-specific basis. Under normal circumstances, Core Bond ETF invests at least 80% of the value of its net assets in fixed-income securities that meet Franklin Advisers’ ESG criteria. For a further discussion of Core Bond ETF’s investment strategy, please turn to the section What are the funds’ and each underlying fund’s main investment strategies and related risks? beginning on page 189.
Putnam ESG High Yield ETF (“High Yield ETF”)
High Yield ETF invests mainly in bonds that are below investment grade in quality (sometimes referred to as “junk bonds”) with a focus on companies or issuers that Franklin Advisers, High Yield ETF’s investment manager, believes meet relevant ESG criteria on a sector-specific basis. High Yield ETF invests mainly in bonds that also have one or more of the following characteristics: (1) are obligations of U.S. companies or issuers and (2) have intermediate- to long-term maturities (three years or longer). Under normal circumstances, High Yield ETF invests at least 80% of the value of its net assets in fixed-income securities rated below investment grade that meet Franklin Advisers’ ESG criteria. For a further discussion of High Yield ETF’s investment strategy, please turn to the section What are the funds’ and each underlying fund’s main investment strategies and related risks? beginning on page 189.
Putnam ESG Ultra Short ETF (“Ultra Short ETF”)
Ultra Short ETF invests in a diversified short duration portfolio of fixed-income securities comprised of investment-grade money market and other fixed-income securities, including U.S. dollar-denominated foreign securities of these types, with a focus on companies or issuers that Franklin Advisers, Ultra Short ETF’s investment manager, believes meet relevant ESG criteria, on a sector-specific basis. Under normal circumstances, Ultra Short ETF invests at least 80% of the value of its net assets in fixed-income securities that meet Franklin Advisers’ ESG criteria. For a further discussion of Ultra Short ETF’s investment strategy, please turn to the section What are the funds’ and each underlying fund’s main investment strategies and related risks? beginning on page 189.
It is important to understand that you can lose money by investing in the fund. Losses may occur near, at or after the target date. There is no guarantee that the fund will provide adequate income at and through an investor’s retirement.
The fund’s allocation of assets among asset classes and the underlying funds may hurt performance. An underlying fund may change its investment program or policies without the fund’s approval, which could require the fund to reduce or eliminate its allocation to the underlying fund at an unfavorable time.
The fund invests in underlying funds and indirectly bears expenses related to the underlying funds. However, the Investment Manager has contractually agreed to waive fees, reimburse expenses of, or reimburse the fund through at least November 30, 2027 in an amount equal to the fund’s acquired fund fees and expenses (e.g., the fees and expenses incurred by the fund as a result of its investments in the underlying funds). The Investment Manager also has contractually agreed to waive fees and/or reimburse expenses of each class of shares of the fund through at least November 30, 2027 in an amount sufficient to result in total annual fund operating expenses for class A, C, R, R3, R4, R5, R6 and Y shares of the fund (exclusive of payments under the fund’s distribution plans, brokerage, interest, taxes, investment-related expenses, acquired fund fees and expenses, and extraordinary expenses) that equal 0.60%, 0.60%, 0.75%, 0.75%, 0.75%, 0.60%, 0.50%, and 0.60%, respectively, of the fund’s average net assets.
Pending investment in underlying funds, the fund also expects to temporarily invest cash balances resulting from purchase activity by fund shareholders in Putnam Government Money Market Fund, a money market mutual fund sponsored by the Investment Manager, or in cash or cash equivalents. In addition, the fund expects to invest a portion of its assets in Putnam Government Money Market Fund or in cash or cash equivalents in order to manage shareholder redemptions. Large positions in Putnam Government Money Market Fund or in cash or cash equivalents may dampen performance and may prevent the fund from achieving its goal. These practices may be subject to other risks, as described under Miscellaneous Investments, Investment Practices and Risks in the SAI.
The fund also bears the risks associated with the underlying funds identified below. The relative significance of these risks will vary over time based on the fund’s target allocations to the underlying funds and to equity and fixed-income asset classes, which may change from time to time as discussed above.
Investment Strategy-Related Risks of the Underlying Funds
Sustainability and ESG investing risk. Investing in underlying funds with an ESG or sustainability focus may result in the fund having exposure to underlying funds that invest in certain types of companies, issuers, industries or sectors that the market may not favor. In evaluating an investment opportunity for the underlying funds, Franklin Advisers, Putnam Management or PanAgora may make investment decisions without the availability of optimal ESG-related data (which may be even less available with securitized debt instruments) or based on information and data that is incomplete or inaccurate. Sustainability and ESG metrics are not uniformly defined, and applying such metrics involves subjective assessments. Sustainability and ESG scorings and assessments of issuers can vary across third-party data providers and may change over time. Franklin Advisers, Putnam Management and PanAgora do not rely exclusively on third-party data providers in evaluating sustainability and ESG criteria for the underlying funds. ESG information from third-party data providers may be incomplete, inaccurate or unavailable, particularly with respect to companies in emerging market countries, which may adversely impact the investment process. In addition, the business practices, products or services of issuers in which an underlying fund invests may change over time. As a result of these possibilities, among others, an underlying fund may temporarily hold securities that are inconsistent with the underlying fund’s ESG or sustainability investment criteria. Regulatory changes or interpretations regarding the definitions and/or use of ESG and/or sustainability criteria could have a material adverse effect on the underlying fund’s ability to invest in accordance with its investment policies and/or achieve its investment objective. The underlying funds do not restrict investments based solely on “negative screens”, and the underlying fixed-income funds do not restrict their fixed-income investments to “green bonds” (e.g., U.S. dollar-denominated bonds designated as “green” by the Climate Bonds Initiative). For the underlying funds that pursue fixed-income investment strategies, because fixed-income investments generally represent a promise to pay principal and interest by an issuer, and not an ownership interest, and may involve complex structures, ESG-related investment considerations may have a more limited impact on risk and return (or may have an impact over a different investment time horizon) relative to other asset classes, and this may be particularly true for shorter-term investments. In addition, holders of fixed-income investments do not typically have voting rights, unlike holders of equity investments who have the right to vote on issuer proposals.
Market risk. The value of investments in the underlying funds’ portfolios may fall or fail to rise over extended periods of time for a variety of reasons, including general economic, political or financial market conditions, investor sentiment and market perceptions, government actions, geopolitical events or changes, outbreaks of infectious illnesses or other widespread public health issues (including epidemics and
pandemics), and factors related to a specific issuer, geography, industry or sector. These and other factors may lead to increased volatility and reduced liquidity in the underlying funds’ portfolio holdings, may negatively impact the fund’s performance, and may exacerbate other risks to which the fund is subject.
Common stock risk. (For all underlying funds except Core Bond ETF, High Yield ETF and Ultra Short ETF) Common stock represents an ownership interest in a company. The value of a company’s stock may fall or fail to rise as a result of factors directly relating to that company, such as decisions made by its management or lower demand for the company’s products or services. A stock’s value may also fall because of factors affecting not just the company, but also other companies in the same industry or in a number of different industries, such as increases in production costs.
| Growth investing risk.. Growth stocks may be more susceptible to earnings disappointments, and the market may not favor growth-style investing. |
| Value investing risk. Value stocks may fail to rebound, and the market may not favor value-style investing. Companies whose stocks we believe are undervalued by the market may have experienced adverse business developments or may be subject to special risks that have caused their stocks to be out of favor. |
| Small and midsize companies risk. Stocks of small and midsize companies often trade in smaller volumes, and their prices may fluctuate more than stocks of larger companies. Stocks of these companies may therefore be more vulnerable to adverse developments than those of larger companies. |
Industry or sector concentration risk. (For all underlying funds except Core Bond ETF, High Yield ETF and Ultra Short ETF) From time to time, an underlying fund may invest a significant portion of its assets in companies in one or more related industries or sectors, which would make the underlying fund more vulnerable to adverse developments affecting those industries or sectors.
Model and data risk. (For all underlying funds except Sustainable Leaders ETF, Sustainable Future ETF and High Yield ETF) If the quantitative models or data that are used in managing an underlying fund prove to be incorrect or incomplete, investment decisions made in reliance on the models or data may not produce the desired results, and the underlying fund may realize losses. Additionally, market movements are likely to change the risk levels and risk allocations of the underlying fund. Investments made based on quantitative models may perform differently from the market as a whole.
Foreign investment risk. (For all underlying funds except Ultra Short ETF, Sustainable Leaders ETF and Sustainable Future ETF) The value of international investments traded in foreign currencies may be adversely impacted by fluctuations in exchange rates. International investments, particularly investments in emerging markets, may carry risks associated with potentially less stable economies or governments (such as the risk of seizure by a foreign government, the imposition of currency or other restrictions, or high levels of inflation), and may be or become
illiquid. There may be less publicly-available information, or less reliable publicly-available information, about foreign companies (including information related to companies’ ESG practices), particularly with respect to emerging market companies, than publicly-available information regarding U.S. companies. As a result, an underlying fund’s ability to evaluate a foreign company, including with respect to its ESG or sustainability practices, may be more limited than its ability to evaluate a U.S. company.
Geographic focus risk. (For PanAgora International Equity ETF and PanAgora Emerging Markets Equity ETF) From time to time, an underlying fund may invest a significant portion of its assets in companies in one or more related geographic regions, industries or sectors, such as European and Asian countries, which would make the fund more vulnerable to adverse developments affecting those geographic regions, industries or sectors, including political, economic, or other developments adversely impacting ESG or sustainable investing.
Fixed-income investments risk. (For Core Bond ETF, High Yield ETF and Ultra Short ETF) The risks associated with fixed-income investments include interest rate risk, which is the risk that the value of an underlying fund’s investments is likely to fall if interest rates rise. Fixed-income investments are also subject to credit risk, which is the risk that the issuer of a fixed-income investment may default on payment of interest or principal. Credit risk is generally greater for debt not backed by the full faith and credit of the U.S. government, and interest rate risk is generally greater for longer-term debt. Fixed-income investments may be more susceptible to downgrades or defaults during economic downturns or other periods of economic stress. Mortgage-backed investments, unlike traditional debt investments, are also subject to prepayment risk, which means that they may increase in value less than other bonds when interest rates decline and decline in value more than other bonds when interest rates rise. The underlying fund may have to invest the proceeds from prepaid investments, including mortgage-backed investments, in other investments with less attractive terms and yields. The underlying fund’s investments in mortgage-backed securities, and in certain other securities and derivatives, may be or become illiquid. The underlying fund’s investments in mortgage-backed securities may make the underlying fund’s net asset value more susceptible to economic, market, political and other developments affecting the residential and commercial real estate markets and the servicing of mortgage loans secured by real estate properties. During periods of difficult economic conditions, delinquencies and losses on commercial mortgage-backed investments in particular generally increase, including as a result of the effects of those conditions on commercial real estate markets, the ability of commercial tenants to make loan payments, and the ability of a property to attract and retain commercial tenants.
One of the underlying funds, Putnam High Yield ETF, invests mostly in higher-yield, higher-risk debt investments that are rated below BBB or its equivalent at the time of purchase by any nationally recognized securities rating agency rating such investments, or in unrated investments that Franklin Advisers believes are of comparable quality. The underlying fund may invest up to 15% of the underlying
fund’s total assets in debt investments rated below CCC or its equivalent, at the time of purchase, by each rating agency rating such investments, or in unrated investments that Franklin Advisers believes are of comparable quality. This includes investments in the lowest rating category of the rating agency. The underlying fund will not necessarily sell an investment if its rating is reduced after Franklin Advisers buys it. Investments rated below BBB or its equivalent are below-investment-grade in quality. This rating reflects a greater possibility that the issuers may be unable to make timely payments of interest and principal and thus default. If a default occurs, or is perceived as likely to occur, the value of the investment will usually be more volatile and is likely to fall. The value of a debt instrument may also be affected by changes in, or perceptions of, the financial condition of the issuer, borrower, counterparty, or other entity, or underlying collateral or assets, or changes in, or perceptions of, specific or general market, economic, industry, political, regulatory, geopolitical, environmental, public health, and other conditions. A default or expected default could also make it difficult for the underlying fund to sell the investment at a price approximating the value Franklin Advisers had previously placed on it. Lower-rated debt usually has a more limited market than higher-rated debt, which may at times make it difficult for the underlying fund to buy or sell certain debt instruments or to establish their fair values.
Derivatives risk. (For all underlying funds except PanAgora International Equity ETF, PanAgora Emerging Markets Equity ETF, Sustainable Leaders ETF and Sustainable Future ETF) An underlying fund’s use of derivatives may increase the risks of investing in the underlying fund by increasing investment exposure (which may be considered leverage) or, in the case of many over-the-counter instruments, because of the potential inability to terminate or sell derivatives positions and the potential failure of the other party to the instrument to meet its obligations. The risk of a party failing to meet its obligations may increase if the fund has significant investment exposure to that counterparty. The value of derivatives may move in unexpected ways due to unanticipated market movements, the use of leverage, imperfect correlation between the derivative instrument and the reference asset, or other factors, especially in unusual market conditions, and volatility in the value of derivatives could adversely impact the underlying fund’s returns, obligations and exposures. Derivatives are also subject to other risks, including liquidity risk (e.g., liquidity demands arising from the requirement to make payments to a derivative counterparty), operational risk (e.g., settlement issues or system failure), and legal risk (e.g., insufficient legal documentation or contract enforceability issues).
Floating rate obligations risk. (For Core Bond ETF, High Yield ETF and Ultra Short ETF) To the extent an underlying fund holds floating rate loans, interest rate risk may be reduced but will not be eliminated. While floating rate loans are normally secured by specific collateral or assets of the issuer (so that holders of the loans, such as the underlying fund, will have a priority claim on those assets in the event of default or bankruptcy of the issuer), the value of collateral may be insufficient to meet the issuer’s obligations, and the underlying fund’s access to collateral may be limited by bankruptcy or other insolvency laws. The settlement period (the period
between the execution of the trade and the delivery of cash to the purchaser) for floating rate loan transactions is typically longer than seven days, and it is possible that sale proceeds from floating rate loan transactions will not be available to meet redemption obligations.
Portfolio turnover rate risk. From time to time an underlying fund may engage in frequent trading. Funds with high turnover may be more likely to realize capital gains that must be distributed to shareholders as taxable income. High turnover may also cause a fund to pay more brokerage commissions and to incur other transaction costs (including imputed transaction costs), which may detract from performance. A fund’s portfolio turnover rate and the amount of brokerage commissions it pays and transaction costs it incurs will vary over time based on market conditions.
Management and operational risk. There is no guarantee that the investment techniques, analyses, or judgments that Franklin Advisers, Putnam Management or PanAgora, as applicable, applies in making investment decisions for the underlying funds will produce the intended outcome or that the investments they select for the underlying funds will perform as well as other securities that were not selected for the underlying funds. Franklin Advisers, Putnam Management, PanAgora, or the underlying funds’ other service providers, may experience disruptions or operating errors that could negatively impact the underlying funds.
Risks Related to Investing in ETFs
As ETFs, shares of the underlying funds are traded in the secondary market. Prior to trading in the secondary market, shares of the underlying funds are “created” at NAV by market makers, large investors and institutions (collectively, “authorized participants”) only in creation units. A creation transaction generally takes place when an authorized participant deposits into an underlying fund a designated portfolio of securities, assets or other positions (a “creation basket”), and an amount of cash (including any cash representing the value of substituted securities, assets or other positions), if any, in exchange for a specified number of creation units. Similarly, shares of an underlying fund can be redeemed only in creation units, generally for a designated portfolio of securities, assets or other positions held by the underlying fund and an amount of cash (including any portion of such securities for which cash may be substituted), if any.
Fluctuation of net asset value (“NAV”) and share price risk. Shares of the underlying funds may trade at a larger premium or discount to their NAV than shares of other ETFs. The NAV of an underlying fund will generally fluctuate with changes in the market value of the underlying fund’s holdings. Underlying fund shares can be bought and sold in the secondary market at market prices. Disruptions to creations and redemptions, the existence of extreme market volatility or potential lack of an active trading market for an underlying fund’s shares may result in the underlying fund’s shares trading significantly above (at a premium) or below (at a discount) to NAV or to the intraday value of the underlying fund’s holdings. In addition, in stressed market conditions or periods of market disruption or volatility, the market for shares of the
underlying funds may become less liquid in response to deteriorating liquidity in the markets for the underlying funds’ portfolio holdings.
Authorized participant concentration risk. Only an authorized participant may engage in creation and redemption transactions directly with an underlying fund. Your fund is not an authorized participant and can only purchase and sell underlying fund shares in the secondary market at market prices or through an authorized participant. The underlying fund may have a limited number of financial institutions that act as authorized participants, none of which are obligated to engage in creation and/or redemption transactions. To the extent that those authorized participants do not engage in creation and redemption orders, there may be a significantly diminished trading market for underlying fund shares, or underlying fund shares may trade at a discount (or premium) to NAV and possibly face trading halts and/or de-listing.
Trading issues risk. The underlying funds have a limited public trading history. Sustainable Leaders ETF and Sustainable Future ETF began trading publicly in May 2021, while PanAgora International Equity ETF, PanAgora Emerging Markets Equity ETF, Core Bond ETF, High Yield ETF, and Ultra Short ETF began trading publicly in January 2023. There can be no assurance that an active trading market will develop or be maintained or that the market for underlying fund shares will operate as intended, which could lead to the underlying funds’ shares trading at wider spreads and larger premiums and discounts to NAV than other actively managed ETFs. As a result, it may cost the fund more to trade underlying fund shares than shares of other ETFs. There is no guarantee that the underlying fund will be able to attract market makers and authorized participants. Market makers and authorized participants are not obligated to make a market in the underlying fund’s shares or to submit purchase and redemption orders for creation units.
The market prices of an underlying fund’s shares are expected to fluctuate, in some cases materially, in response to changes in the underlying fund’s NAV, the intraday value of the underlying fund’s holdings and supply and demand for the underlying fund’s shares. Each underlying fund’s respective investment manager cannot predict whether an underlying fund’s shares will trade above, below or at their NAV or the intraday value of the underlying fund’s holdings. During periods when an underlying fund is trading below its NAV, the fund may incur significant losses if it sells its underlying fund shares.
The securities held by an underlying fund may be traded in markets that close at a different time than the exchange on which the underlying fund’s shares are listed. Liquidity in those securities may be reduced after the applicable closing times. Accordingly, during the time when the exchange is open but after the applicable market closing, fixing or settlement times, bid-ask spreads on the exchange and the corresponding premium or discount to the NAV of the underlying funds’ shares may widen.
Large shareholder risk. Each underlying fund may be an investment option for mutual funds that are managed by Franklin Resources, Inc. (“Franklin Templeton”) and its affiliates as “funds of funds.” Additionally, other investors from time to time may make substantial investments in an underlying fund, including affiliates of Franklin Templeton, through seed capital arrangements. Such shareholders may at times be considered to control an underlying fund. Dispositions of a large number of shares by these shareholders may adversely affect an underlying fund’s liquidity and net assets to the extent such transactions are executed directly with the underlying fund in the form of redemptions through an authorized participant, rather than executed in the secondary market. These redemptions may also force an underlying fund to sell securities, which may increase the underlying fund’s brokerage costs. In addition, underlying fund returns may be adversely affected if an underlying fund holds a portion of its assets in liquid, cash-like investments in connection with or in anticipation of shareholder redemptions. To the extent these large shareholders transact in shares of an underlying fund on the secondary market, such transactions may account for a large percentage of the trading volume on the exchange and may, therefore, have a material effect (upward or downward) on the market price of the underlying fund’s shares.
Cash transactions risk. Some of the underlying funds may effect creations and redemptions in cash or partially in cash. Therefore, an underlying fund may be required to sell portfolio securities, incur transaction costs, and subsequently recognize gains on such sales that the underlying fund might not have recognized if it were to distribute portfolio securities in-kind. As such, investments by a fund in an underlying fund’s shares may be less tax-efficient than an investment in an ETF that distributes portfolio securities entirely in-kind. An underlying fund may also incur transaction costs in connection with creations effected in cash (in whole or in part).
Semi-transparent ETF risk. (For Sustainable Leaders ETF and Sustainable Future ETF) Two of the underlying funds, Putnam Sustainable Leaders ETF and Putnam Sustainable Future ETF (the “Semi-Transparent ETFs”), are different from traditional ETFs, including the other underlying funds. Traditional ETFs disclose to the public what assets they hold each day. However, the Semi-Transparent ETFs do not. This may create additional risks for an investment in the Semi-Transparent ETFs, including that an investor may have to pay more money to trade the Semi-Transparent ETF’s shares in light of the fact that the Semi-Transparent ETF will provide less information to traders, who tend to charge more for trades when they have less information. The price an investor pays to buy or sell an ETF’s shares on an exchange may not match the value of the ETF’s portfolio, and these price differences may be greater for the Semi-Transparent ETFs compared to other ETFs because they provide less information to traders. These additional risks may be even greater in adverse or uncertain market conditions.
The differences between the Semi-Transparent ETFs and other ETFs may also have advantages. By keeping certain information about the Semi-Transparent ETFs secret, a Semi-Transparent ETF may face less risk that other traders can predict or copy its investment strategy. This may improve the Semi-Transparent ETF’s performance.
If other traders are able to copy or predict the Semi-Transparent ETF’s investment strategy, however, this may hurt the Semi-Transparent ETF’s performance.
Tracking basket structure risk. (For Sustainable Leaders ETF and Sustainable Future ETF) The Semi-Transparent ETFs are actively managed ETFs that operate pursuant to an exemptive order from the Securities and Exchange Commission and do not publicly disclose their complete portfolio holdings each business day. Instead, each Semi-Transparent ETF publishes each business day on its website a “Tracking Basket,” which is designed to closely track the daily performance of the Semi-Transparent ETF but is not the Semi-Transparent ETF’s actual portfolio. The Tracking Basket is comprised of: (1) select recently disclosed portfolio holdings and/or select securities from the universe from which the Semi-Transparent ETF’s investments are selected (“Strategy Components”); (2) liquid ETFs that convey information about the types of instruments (that are not otherwise fully represented by the Strategy Components) in which the Semi-Transparent ETF invests; and (3) cash and cash equivalents.
A Semi-Transparent ETF’s Tracking Basket structure may affect the price at which shares of the Semi-Transparent ETF trade in the secondary market. Although the Tracking Basket is intended to provide investors with enough information to allow for an effective arbitrage mechanism that will keep the market price of each Semi-Transparent ETF at or close to its NAV per share, there is a risk that market prices will vary significantly from NAV. The Semi-Transparent ETFs, which trade on the basis of a published Tracking Basket, may trade at a wider bid/ask spread than ETFs that publish their portfolios on a daily basis, and therefore, may cost investors more to trade. These risks may increase during periods of market disruption or volatility. In addition, although each Semi-Transparent ETF seeks to benefit from keeping its portfolio information secret, market participants may attempt to use the Tracking Basket to identify the Semi-Transparent ETF’s trading strategy. If successful, this could result in such market participants engaging in certain predatory trading practices that may have the potential to harm the Semi-Transparent ETF and its shareholders, such as front running the Semi-Transparent ETF’s trades of portfolio securities.
Arbitrage risk. (For Sustainable Leaders ETF and Sustainable Future ETF) Unlike ETFs that publicly disclose their complete portfolio holdings each business day, each Semi-Transparent ETF provides certain other information intended to allow market participants to estimate the value of positions in the Semi-Transparent ETF’s shares. Although this information is designed to facilitate arbitrage opportunities in the Semi-Transparent ETF’s shares to reduce bid/ask spreads and minimize discounts or premiums between the market price and NAV of the Semi-Transparent ETF shares, there is no guarantee the Semi-Transparent ETF’s arbitrage mechanism will operate as intended and that the Semi-Transparent ETF will not experience wide bid/ask spreads and/or large discounts or premiums to NAV. In addition, market participants may attempt to use the disclosed information to “reverse engineer” the Semi-Transparent ETF’s trading strategy, which, if successful, could increase opportunities for predatory trading practices that may have the potential to negatively impact the Semi-Transparent ETF’s performance.
Trading halt risk. (For Sustainable Leaders ETF and Sustainable Future ETF) There may be circumstances where a security held in a Semi-Transparent ETF’s portfolio but not in the Tracking Basket does not have readily available market quotations. If Putnam Management determines that such circumstance may affect the reliability of the Tracking Basket as an arbitrage vehicle, that information, along with the identity and weighting of that security in the Semi-Transparent ETF’s portfolio, will be publicly disclosed on the Semi-Transparent ETF’s website, and Putnam Management will assess appropriate remedial measures. In these circumstances, market participants may use this information to engage in certain predatory trading practices that may have the potential to harm the Semi-Transparent ETF and its shareholders. In addition, if securities representing 10% or more of the Semi-Transparent ETF’s portfolio do not have readily available market quotations, Putnam Management would promptly request the exchange to halt trading of the Semi-Transparent ETF, meaning that investors (including the fund) would not be able to trade their shares. Trading may also be halted in other circumstances, for example, due to market conditions.
The fund may not achieve its goal, and it is not intended to be a complete investment program. An investment in the fund is not insured or guaranteed by the Federal Deposit Insurance Corporation or any other government agency.
The performance information below gives some indication of the risks associated with an investment in the fund by showing the fund’s performance year to year and over time. Before February 10, 2023, the fund was managed with a materially different investment strategy and may have achieved materially different performance results under its current investment strategy from that shown for periods before this date. The bar chart does not reflect the impact of sales charges. If it did, performance would be lower. Please remember that past performance is not necessarily an indication of future results. Monthly performance figures for the fund are available at www.franklintempleton.com.
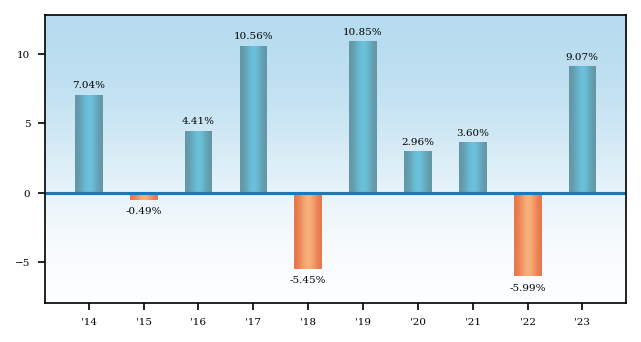
Average Annual Total Returns - Putnam Sustainable Retirement 2025 Fund |
1 Year |
5 Years |
10 Years |
|
|---|---|---|---|---|
| Class A 2025 | 2.79% | 2.70% | 2.88% | |
| Class A 2025 | After Taxes on Distributions | 1.57% | 1.19% | 1.63% | |
| Class A 2025 | After Taxes on Distributions and Sales | 1.69% | 1.62% | 1.83% | |
| Class C 2025 | 7.26% | 3.16% | 2.88% | |
| Class R 2025 | 8.62% | 3.57% | 3.19% | |
| Class R3 2025 | [1] | 8.93% | 3.78% | 3.35% |
| Class R4 2025 | [2] | 9.19% | 4.03% | 3.60% |
| Class R5 2025 | [3] | 9.32% | 4.19% | 3.74% |
| Class R6 2025 | [4] | 9.47% | 4.29% | 3.83% |
| Class Y 2025 | 9.33% | 4.19% | 3.75% | |
| Russell 3000® Index (no deduction for fees, expenses or taxes) | [5] | 25.96% | 15.16% | 11.48% |
| Bloomberg U.S. Aggregate Bond Index (no deduction for fees, expenses or taxes) | [5] | 5.53% | 1.10% | 1.81% |
| S&P Target Date To 2025 Index (no deduction for fees, expenses or taxes) | [5] | 12.44% | 6.78% | 5.35% |
| [1] | Performance for class R3 shares prior to their inception (1/4/21) is derived from the historical performance of class Y shares, adjusted for the higher 12b-1 fees and investor servicing fees applicable to class R3 shares (relative to the comparable fees applicable to class Y shares prior to the inception of class R3 shares). |
| [2] | Performance for class R4 shares prior to their inception (1/4/21) is derived from the historical performance of class Y shares, adjusted for the higher investor servicing fees applicable to class R4 shares (relative to the comparable fees applicable to class Y shares prior to the inception of class R4 shares). |
| [3] | Performance for class R5 shares prior to their inception (1/4/21) is derived from the historical performance of class R6 shares, adjusted for the higher investor servicing fees applicable to class R5 shares (relative to the comparable fees applicable to R6 shares prior to the inception of class R5 shares). |
| [4] | Performance for class R6 shares prior to their inception (9/1/16) is derived from the historical performance of class Y shares and has not been adjusted for the lower investor servicing fees applicable to class R6 shares (relative to the comparable fees applicable to class Y shares prior to the inception of class R6 shares); had it, returns would have been higher. |
| [5] | The table above compares the fund’s returns to the performance of three indexes: (i) the Russell 3000® Index, a broad measure of market performance, (ii) the Bloomberg U.S. Aggregate Bond Index, a broad measure of market performance, and (iii) the S&P Target Date To 2025 Index, an additional index that the Investment Manager believes more closely reflects the fund’s principal investment objective and strategies. |
| Class C share performance reflects conversion to class A shares after eight years. |
| After-tax returns reflect the historical highest individual federal marginal income tax rates and do not reflect state and local taxes. Actual after-tax returns depend on an investor’s tax situation and may differ from those shown. After-tax returns are shown for class A shares only and will vary for other classes. These after-tax returns do not apply if you hold your fund shares through a 401(k) plan, an IRA, or another tax-advantaged arrangement. |
| The Russell 3000® Index measures the performance of the 3,000 largest U.S. companies based on total market capitalization. Source: FTSE. |
| Frank Russell Company is the source and owner of the trademarks, service marks and copyrights related to the Russell Indexes. Russell ® is a trademark of Frank Russell Company. |
| The Bloomberg U.S. Aggregate Bond Index is an unmanaged index of U.S. investment-grade fixed income securities. |
| All Bloomberg indices are provided by Bloomberg Index Services Limited. |
| BLOOMBERG® is a trademark and service mark of Bloomberg Finance L.P. and its affiliates (collectively “Bloomberg”). Bloomberg or Bloomberg’s licensors own all proprietary rights in the Bloomberg Indices. Neither Bloomberg nor Bloomberg’s licensors approve or endorse this material, or guarantees the accuracy or completeness of any information herein, or makes any warranty, express or implied, as to the results to be obtained therefrom, and to the maximum extent allowed by law, neither shall have any liability or responsibility for injury or damages arising in connection therewith. |
| The S&P Target Date To Index Series is designed to represent a small, style-specific derived consensus of asset class exposure and glide path for a specified list of target retirement dates. |
| Securities in the fund do not match those in the indexes and the performance of the fund will differ. |
Putnam Sustainable Retirement Maturity Fund seeks as high a rate of current income as Putnam Investment Management, LLC believes is consistent with preservation of capital.
The following tables describe the fees and expenses you may pay if you buy, hold, and sell shares of the fund. You may pay other fees, such as brokerage commissions and other fees to financial intermediaries, which are not reflected in the tables and examples below. You may qualify for sales charge discounts if you and your family invest, or agree to invest in the future, at least $100,000 in class A shares of Putnam funds. More information about these and other discounts is available from your financial professional and in How do I buy fund shares? beginning on page 227 of the fund’s prospectus, in the Appendix to the fund’s prospectus, and in How to buy shares beginning on page II-3 of the fund’s statement of additional information (“SAI”).
Shareholder Fees - Putnam Sustainable Retirement Maturity Fund |
Class A Maturity |
Class C Maturity |
Class R Maturity |
Class R3 Maturity |
Class R4 Maturity |
Class R5 Maturity |
Class R6 Maturity |
Class Y Maturity |
||
|---|---|---|---|---|---|---|---|---|---|---|
| Maximum Sales Charge Imposed on Purchases (as a percentage of Offering Price) | 4.00% | none | none | none | none | none | none | none | ||
| Maximum Deferred Sales Charge (as a percentage) | 1.00% | [1] | 1.00% | [2] | none | none | none | none | none | none |
| [1] | Applies only to certain redemptions of shares bought with no initial sales charge. |
| [2] | This charge is eliminated after one year. |
Annual Fund Operating Expenses - Putnam Sustainable Retirement Maturity Fund |
Class A Maturity |
Class C Maturity |
Class R Maturity |
Class R3 Maturity |
Class R4 Maturity |
Class R5 Maturity |
Class R6 Maturity |
Class Y Maturity |
|
|---|---|---|---|---|---|---|---|---|---|
| Management Fees (as a percentage of Assets) | 0.46% | 0.46% | 0.46% | 0.46% | 0.46% | 0.46% | 0.46% | 0.46% | |
| Distribution and Service (12b-1) Fees | 0.25% | 1.00% | 0.50% | 0.25% | none | none | none | none | |
| Other Expenses (as a percentage of Assets): | 0.20% | 0.20% | 0.35% | 0.35% | 0.35% | 0.20% | 0.10% | 0.20% | |
| Acquired Fund Fees and Expenses | 0.43% | 0.43% | 0.43% | 0.43% | 0.43% | 0.43% | 0.43% | 0.43% | |
| Expenses (as a percentage of Assets) | 1.34% | 2.09% | 1.74% | 1.49% | 1.24% | 1.09% | 0.99% | 1.09% | |
| Fee Waiver or Reimbursement | [1] | (0.49%) | (0.49%) | (0.49%) | (0.49%) | (0.49%) | (0.49%) | (0.49%) | (0.49%) |
| Net Expenses (as a percentage of Assets) | 0.85% | 1.60% | 1.25% | 1.00% | 0.75% | 0.60% | 0.50% | 0.60% | |
| [1] | Reflects a contractual obligation of the Investment Manager to limit certain fund expenses through November 30, 2027. This obligation may be modified or discontinued only with approval of the Board of Trustees. |
The following hypothetical example is intended to help you compare the cost of investing in the fund with the cost of investing in other funds. It assumes that you invest $10,000 in the fund for the time periods indicated and then, except as indicated, redeem all your shares at the end of those periods. It assumes a 5% return on your investment each year and that the fund’s operating expenses remain the same. Only the first three years of each period in the example take into account the expense reimbursement described above. Your actual costs may be higher or lower.
Expense Example - Putnam Sustainable Retirement Maturity Fund - USD ($) |
Expense Example, with Redemption, 1 Year |
Expense Example, with Redemption, 3 Years |
Expense Example, with Redemption, 5 Years |
Expense Example, with Redemption, 10 Years |
Expense Example, No Redemption, 1 Year |
Expense Example, No Redemption, 3 Years |
Expense Example, No Redemption, 5 Years |
Expense Example, No Redemption, 10 Years |
|---|---|---|---|---|---|---|---|---|
| Class A Maturity | 483 | 660 | 962 | 1,817 | ||||
| Class C Maturity | 263 | 505 | 981 | 2,102 | 163 | 505 | 981 | 2,102 |
| Class R Maturity | 127 | 397 | 798 | 1,922 | ||||
| Class R3 Maturity | 102 | 318 | 665 | 1,646 | ||||
| Class R4 Maturity | 77 | 240 | 531 | 1,362 | ||||
| Class R5 Maturity | 61 | 192 | 450 | 1,188 | ||||
| Class R6 Maturity | 51 | 160 | 395 | 1,071 | ||||
| Class Y Maturity | 61 | 192 | 450 | 1,188 |
The fund pays transaction-related costs, such as commissions, when it buys and sells securities (or “turns over” its portfolio). A higher turnover rate may indicate higher transaction costs and may result in higher taxes when the fund’s shares are held in a taxable account. These costs, which are not reflected in annual fund operating expenses or the above example, affect fund performance. The fund’s turnover rate in the most recent fiscal year was 8%.
Investments
The fund employs an asset allocation strategy designed for investors who are already in retirement or who plan to retire (or otherwise begin withdrawing the invested funds) in the near future. The fund is designed to provide diversification among different asset classes by investing primarily its assets in exchange-traded funds (“ETFs”) that focus on investments with positive sustainability or environmental, social, and governance (“ESG”) characteristics, referred to as underlying funds. The underlying funds include funds managed by Franklin Advisers, Inc. (“Franklin Advisers” or the “Investment Manager”), the fund’s investment manager, and funds managed by affiliated investment advisers.
Under normal circumstances, the fund will invest in underlying funds (which, for purposes of this policy, include money market mutual funds advised by the Investment Manager or its affiliates) such that, in the aggregate, it has indirect exposure to investments that meet each underlying fund’s respective sustainability or ESG criteria and that represent at least 80% of the value of its net assets. This policy is non-fundamental and may be changed only after 60 days’ notice to shareholders. The Investment Manager may not apply ESG or sustainability criteria to investments that are not subject to the fund’s 80% policy, and such investments may not meet the applicable ESG or sustainability criteria. Through its investments in underlying funds, the fund makes use of a range of ESG- and sustainability- oriented investment strategies and invests across a variety of asset classes. The ESG or sustainability criteria will differ across the underlying funds. These differences may arise both from differences in the underlying funds’ asset classes (such as the characteristics of non-U.S. versus U.S. issuers, or the structural differences (e.g., position in the capital structure) between equity and fixed-income investments) as well as from different managers’ styles. In implementing an underlying fund’s investment strategy, the portfolio managers of the underlying fund may apply and weigh different ESG criteria differently than the portfolio managers of the other underlying funds. There are also expected to be differences in how the portfolio managers of the underlying funds source ESG-related or sustainability-oriented research (e.g., proprietary versus third-party research) and/or their approach to selecting companies based on ESG or sustainability criteria.
The following table presents your fund’s approximate allocations to each asset class and underlying fund as of September 30, 2024 (taking into account any tactical adjustments described below), which are not expected to change over time.
| Underlying funds* | |
| Putnam Sustainable Leaders ETF | 14.1% |
| Putnam Sustainable Future ETF | 7.1% |
| Putnam PanAgora ESG International Equity ETF | 4.2% |
| Putnam ESG Core Bond ETF | 51.7% |
| Putnam ESG High Yield ETF | 16.9% |
| Putnam ESG Ultra Short ETF | 6.0% |
| Total Equity** | 25.4% |
| Total Fixed Income** | 74.6% |
| * | Because of rounding in the calculation of allocations among underlying funds and market fluctuations, actual allocations might be more or less than these percentages. Putnam Sustainable Retirement Maturity Fund is not expected to have an allocation to Putnam PanAgora ESG Emerging Markets Equity ETF as of September 30, 2024. |
| ** | Equity and fixed-income allocations are hypothetical estimates based on an assumption that each of Putnam Sustainable Leaders ETF, Putnam Sustainable Future ETF, Putnam PanAgora ESG International Equity ETF, and Putnam PanAgora ESG Emerging Markets Equity ETF is equivalent to an equity investment and each of Putnam ESG Core Bond ETF, Putnam ESG High Yield ETF and Putnam ESG Ultra Short ETF is equivalent to a fixed-income investment. Actual allocations will vary. |
The fund’s target allocations may differ from the allocations shown in the table. The Investment Manager may change the fund’s target allocations and the underlying funds in which it invests at any time, although the Investment Manager generally expects these changes to be infrequent and generally in response to longer-term structural changes (e.g., in the average retirement age or life expectancy) that lead the fund’s portfolio managers to determine that a change is advisable. The Investment Manager rebalances the fund’s investments towards its target allocations on a quarterly basis.
We assume investors will make gradual withdrawals from the fund. More information about the underlying funds (which are not offered by this prospectus) is included below and under “What are the funds’ and each underlying fund’s main investment strategies and related risks?”
Information about each underlying fund’s investment strategy
Putnam Sustainable Leaders ETF (“Sustainable Leaders ETF”)
Sustainable Leaders ETF invests mainly in common stocks of U.S. companies of any size, with a focus on companies that Putnam Investment Management, LLC (“Putnam Management”), Sustainable Leaders ETF’s investment manager, believes exhibit a commitment to financially material sustainable business practices. Sustainable Leaders ETF may also invest in non-U.S. companies. In evaluating investments for Sustainable Leaders ETF, Putnam Management views “financially material sustainable business practices” as business practices that it believes are reasonably likely to impact the financial condition or operating performance of a company and that relate to environmental, social, or corporate governance issues.
Under normal circumstances, Sustainable Leaders ETF invests at least 80% of the value of its net assets in securities that meet Putnam Management’s sustainability criteria. For a further discussion of Sustainable Leaders ETF’s investment strategy, please turn to the section What are the funds’ and each underlying fund’s main investment strategies and related risks? beginning on page 189.
Putnam Sustainable Future ETF (“Sustainable Future ETF”)
Sustainable Future ETF invests mainly in common stocks of U.S. companies of any size, with a focus on companies whose products and services Putnam Management, Sustainable Future ETF’s investment manager, believes provide solutions that directly contribute to sustainable social, environmental and economic development (Solutions Companies).
Under normal circumstances, Sustainable Future ETF invests at least 80% of the value of its net assets in securities that meet Putnam Management’s sustainability criteria. For a further discussion of Sustainable Future ETF’s investment strategy, please turn to the section What are the funds’ and each underlying fund’s main investment strategies and related risks? beginning on page 189.
Putnam PanAgora ESG International Equity ETF (“PanAgora International Equity ETF”)
PanAgora International Equity ETF invests mainly in common stocks (growth or value stocks or both) of companies of any size outside the United States with a focus on companies that PanAgora International Equity ETF’s subadviser, PanAgora Asset Management, Inc. (“PanAgora”), believes offer attractive benchmark-relative returns and exhibit positive ESG metrics. Under normal circumstances, PanAgora International Equity ETF invests at least 80% of its net assets in equity securities of companies that meet PanAgora’s ESG criteria. For a further discussion of PanAgora International Equity ETF’s investment strategy, please turn to the section What are the funds’ and each underlying fund’s main investment strategies and related risks? beginning on page 189.
Putnam PanAgora ESG Emerging Markets Equity ETF (“PanAgora Emerging Markets Equity ETF”)
PanAgora Emerging Markets Equity ETF invests mainly in common stocks (growth or value stocks or both) of emerging markets companies of any size with a focus on companies that PanAgora Emerging Markets Equity ETF’s subadviser, PanAgora, believes offer attractive benchmark-relative returns and exhibit positive ESG metrics. Under normal circumstances, PanAgora Emerging Markets Equity ETF invests at least 80% of its net assets in equity securities of emerging markets companies that meet PanAgora’s ESG criteria. For a further discussion of PanAgora Emerging Markets Equity ETF’s investment strategy, please turn to the section What are the funds’ and each underlying fund’s main investment strategies and related risks? beginning on page 189.
Putnam ESG Core Bond ETF (“Core Bond ETF”)
Core Bond ETF invests mainly in a diversified portfolio of investment-grade fixed-income securities with a focus on companies or issuers that Franklin Advisers, Core Bond ETF’s investment manager, believes meet relevant ESG criteria on a sector-specific basis. Under normal circumstances, Core Bond ETF invests at least 80% of the value of its net assets in fixed-income securities that meet Franklin Advisers’ ESG criteria. For a further discussion of Core Bond ETF’s investment strategy, please turn to the section What are the funds’ and each underlying fund’s main investment strategies and related risks? beginning on page 189.
Putnam ESG High Yield ETF (“High Yield ETF”)
High Yield ETF invests mainly in bonds that are below investment grade in quality (sometimes referred to as “junk bonds”) with a focus on companies or issuers that Franklin Advisers, High Yield ETF’s investment manager, believes meet relevant ESG criteria on a sector-specific basis. High Yield ETF invests mainly in bonds that also have one or more of the following characteristics: (1) are obligations of U.S. companies or issuers and (2) have intermediate- to long-term maturities (three years or longer). Under normal circumstances, High Yield ETF invests at least 80% of the value of its net assets in fixed-income securities rated below investment grade that meet Franklin Advisers’ ESG criteria. For a further discussion of High Yield ETF’s investment strategy, please turn to the section What are the funds’ and each underlying fund’s main investment strategies and related risks? beginning on page 189.
Putnam ESG Ultra Short ETF (“Ultra Short ETF”)
Ultra Short ETF invests in a diversified short duration portfolio of fixed-income securities comprised of investment-grade money market and other fixed-income securities, including U.S. dollar-denominated foreign securities of these types, with a focus on companies or issuers that Franklin Advisers, Ultra Short ETF’s investment manager, believes meet relevant ESG criteria, on a sector-specific basis. Under normal circumstances, Ultra Short ETF invests at least 80% of the value of its net assets in fixed-income securities that meet Franklin Advisers’ ESG criteria. For a further discussion of Ultra Short ETF’s investment strategy, please turn to the section What are the funds’ and each underlying fund’s main investment strategies and related risks? beginning on page 189.
It is important to understand that you can lose money by investing in the fund. Losses may occur near, at or after the target date. There is no guarantee that the fund will provide adequate income at and through an investor’s retirement.
The fund’s allocation of assets among asset classes and the underlying funds may hurt performance. An underlying fund may change its investment program or policies without the fund’s approval, which could require the fund to reduce or eliminate its allocation to the underlying fund at an unfavorable time.
The fund invests in underlying funds and indirectly bears expenses related to the underlying funds. However, the Investment Manager has contractually agreed to waive fees, reimburse expenses of, or reimburse the fund through at least November 30, 2027 in an amount equal to the fund’s acquired fund fees and expenses (e.g., the fees and expenses incurred by the fund as a result of its investments in the underlying funds). The Investment Manager also has contractually agreed to waive fees and/or reimburse expenses of each class of shares of the fund through at least November 30, 2027 in an amount sufficient to result in total annual fund operating expenses for class A, C, R, R3, R4, R5, R6 and Y shares of the fund (exclusive of payments under the fund’s distribution plans, brokerage, interest, taxes, investment-related expenses, acquired fund fees and expenses, and extraordinary expenses) that equal 0.60%, 0.60%, 0.75%, 0.75%, 0.75%, 0.60%, 0.50%, and 0.60%, respectively, of the fund’s average net assets.
Pending investment in underlying funds, the fund also expects to temporarily invest cash balances resulting from purchase activity by fund shareholders in Putnam Government Money Market Fund, a money market mutual fund sponsored the Investment Manager, or in cash or cash equivalents. In addition, the fund expects to invest a portion of its assets in Putnam Government Money Market Fund or in cash or cash equivalents in order to manage shareholder redemptions. Large positions in Putnam Government Money Market Fund or in cash or cash equivalents may dampen performance and may prevent the fund from achieving its goal. These practices may be subject to other risks, as described under Miscellaneous Investments, Investment Practices and Risks in the SAI.
The fund also bears the risks associated with the underlying funds identified below. The relative significance of these risks will vary over time based on the fund’s target allocations to the underlying funds and to equity and fixed-income asset classes, which may change from time to time as discussed above.
Investment Strategy-Related Risks of the Underlying Funds
Sustainability and ESG investing risk. Investing in underlying funds with an ESG or sustainability focus may result in the fund having exposure to underlying funds that invest in certain types of companies, issuers, industries or sectors that the market may not favor. In evaluating an investment opportunity for the underlying funds, Franklin Advisers, Putnam Management or PanAgora may make investment decisions without the availability of optimal ESG-related data (which may be even less available with securitized debt instruments) or based on information and data that is incomplete or inaccurate. Sustainability and ESG metrics are not uniformly defined, and applying such metrics involves subjective assessments. Sustainability and ESG scorings and assessments of issuers can vary across third-party data providers and may change over time. Franklin Advisers, Putnam Management and PanAgora do not rely exclusively on third-party data providers in evaluating sustainability and ESG criteria for the underlying funds. ESG information from third-party data providers may be incomplete, inaccurate or unavailable, particularly with respect to companies in emerging market countries, which may adversely impact
the investment process. In addition, the business practices, products or services of issuers in which an underlying fund invests may change over time. As a result of these possibilities, among others, an underlying fund may temporarily hold securities that are inconsistent with the underlying fund’s ESG or sustainability investment criteria. Regulatory changes or interpretations regarding the definitions and/or use of ESG and/or sustainability criteria could have a material adverse effect on the underlying fund’s ability to invest in accordance with its investment policies and/or achieve its investment objective. The underlying funds do not restrict investments based solely on “negative screens”, and the underlying fixed-income funds do not restrict their fixed-income investments to “green bonds” (e.g., U.S. dollar-denominated bonds designated as “green” by the Climate Bonds Initiative). For the underlying funds that pursue fixed-income investment strategies, because fixed-income investments generally represent a promise to pay principal and interest by an issuer, and not an ownership interest, and may involve complex structures, ESG-related investment considerations may have a more limited impact on risk and return (or may have an impact over a different investment time horizon) relative to other asset classes, and this may be particularly true for shorter-term investments. In addition, holders of fixed-income investments do not typically have voting rights, unlike holders of equity investments who have the right to vote on issuer proposals.
Market risk. The value of investments in the underlying funds’ portfolios may fall or fail to rise over extended periods of time for a variety of reasons, including general economic, political or financial market conditions, investor sentiment and market perceptions, government actions, geopolitical events or changes, outbreaks of infectious illnesses or other widespread public health issues (including epidemics and pandemics), and factors related to a specific issuer, geography, industry or sector. These and other factors may lead to increased volatility and reduced liquidity in the underlying funds’ portfolio holdings, may negatively impact the fund’s performance, and may exacerbate other risks to which the fund is subject.
Common stock risk. (For all underlying funds except Core Bond ETF, High Yield ETF and Ultra Short ETF) Common stock represents an ownership interest in a company. The value of a company’s stock may fall or fail to rise as a result of factors directly relating to that company, such as decisions made by its management or lower demand for the company’s products or services. A stock’s value may also fall because of factors affecting not just the company, but also other companies in the same industry or in a number of different industries, such as increases in production costs.
| Growth investing risk.. Growth stocks may be more susceptible to earnings disappointments, and the market may not favor growth-style investing. |
| Value investing risk. Value stocks may fail to rebound, and the market may not favor value-style investing. Companies whose stocks we believe are undervalued by the market may have experienced adverse business developments or may be subject to special risks that have caused their stocks to be out of favor. |
| Small and midsize companies risk. Stocks of small and midsize companies often trade in smaller volumes, and their prices may fluctuate more than stocks of larger companies. Stocks of these companies may therefore be more vulnerable to adverse developments than those of larger companies. |
Industry or sector concentration risk. (For all underlying funds except Core Bond ETF, High Yield ETF and Ultra Short ETF) From time to time, an underlying fund may invest a significant portion of its assets in companies in one or more related industries or sectors, which would make the underlying fund more vulnerable to adverse developments affecting those industries or sectors.
Model and data risk. (For all underlying funds except Sustainable Leaders ETF, Sustainable Future ETF and High Yield ETF) If the quantitative models or data that are used in managing an underlying fund prove to be incorrect or incomplete, investment decisions made in reliance on the models or data may not produce the desired results, and the underlying fund may realize losses. Additionally, market movements are likely to change the risk levels and risk allocations of the underlying fund. Investments made based on quantitative models may perform differently from the market as a whole.
Foreign investment risk. (For all underlying funds except Ultra Short ETF, Sustainable Leaders ETF and Sustainable Future ETF) The value of international investments traded in foreign currencies may be adversely impacted by fluctuations in exchange rates. International investments, particularly investments in emerging markets, may carry risks associated with potentially less stable economies or governments (such as the risk of seizure by a foreign government, the imposition of currency or other restrictions, or high levels of inflation), and may be or become illiquid. There may be less publicly-available information, or less reliable publicly-available information, about foreign companies (including information related to companies’ ESG practices), particularly with respect to emerging market companies, than publicly-available information regarding U.S. companies. As a result, an underlying fund’s ability to evaluate a foreign company, including with respect to its ESG or sustainability practices, may be more limited than its ability to evaluate a U.S. company.
Geographic focus risk. (For PanAgora International Equity ETF and PanAgora Emerging Markets Equity ETF) From time to time, an underlying fund may invest a significant portion of its assets in companies in one or more related geographic regions, industries or sectors, such as European and Asian countries, which would make the fund more vulnerable to adverse developments affecting those geographic regions, industries or sectors, including political, economic, or other developments adversely impacting ESG or sustainable investing.
Fixed-income investments risk. (For Core Bond ETF, High Yield ETF and Ultra Short ETF) The risks associated with fixed-income investments include interest rate risk, which is the risk that the value of an underlying fund’s investments is likely to fall if interest rates rise. Fixed-income investments are also subject to credit risk, which is the risk that the issuer of a fixed-income investment may default on
payment of interest or principal. Credit risk is generally greater for debt not backed by the full faith and credit of the U.S. government, and interest rate risk is generally greater for longer-term debt. Fixed-income investments may be more susceptible to downgrades or defaults during economic downturns or other periods of economic stress. Mortgage-backed investments, unlike traditional debt investments, are also subject to prepayment risk, which means that they may increase in value less than other bonds when interest rates decline and decline in value more than other bonds when interest rates rise. The underlying fund may have to invest the proceeds from prepaid investments, including mortgage-backed investments, in other investments with less attractive terms and yields. The underlying fund’s investments in mortgage-backed securities, and in certain other securities and derivatives, may be or become illiquid. The underlying fund’s investments in mortgage-backed securities may make the underlying fund’s net asset value more susceptible to economic, market, political and other developments affecting the residential and commercial real estate markets and the servicing of mortgage loans secured by real estate properties. During periods of difficult economic conditions, delinquencies and losses on commercial mortgage-backed investments in particular generally increase, including as a result of the effects of those conditions on commercial real estate markets, the ability of commercial tenants to make loan payments, and the ability of a property to attract and retain commercial tenants.
One of the underlying funds, Putnam High Yield ETF, invests mostly in higher-yield, higher-risk debt investments that are rated below BBB or its equivalent at the time of purchase by any nationally recognized securities rating agency rating such investments, or in unrated investments that Franklin Advisers believes are of comparable quality. The underlying fund may invest up to 15% of the underlying fund’s total assets in debt investments rated below CCC or its equivalent, at the time of purchase, by each rating agency rating such investments, or in unrated investments that Franklin Advisers believes are of comparable quality. This includes investments in the lowest rating category of the rating agency. The underlying fund will not necessarily sell an investment if its rating is reduced after Franklin Advisers buys it. Investments rated below BBB or its equivalent are below-investment-grade in quality. This rating reflects a greater possibility that the issuers may be unable to make timely payments of interest and principal and thus default. If a default occurs, or is perceived as likely to occur, the value of the investment will usually be more volatile and is likely to fall. The value of a debt instrument may also be affected by changes in, or perceptions of, the financial condition of the issuer, borrower, counterparty, or other entity, or underlying collateral or assets, or changes in, or perceptions of, specific or general market, economic, industry, political, regulatory, geopolitical, environmental, public health, and other conditions. A default or expected default could also make it difficult for the underlying fund to sell the investment at a price approximating the value Franklin Advisers had previously placed on it. Lower-rated debt usually has a more limited market than higher-rated debt, which may at times make it difficult for the underlying fund to buy or sell certain debt instruments or to establish their fair values.
Derivatives risk. (For all underlying funds except PanAgora International Equity ETF, PanAgora Emerging Markets Equity ETF, Sustainable Leaders ETF and Sustainable Future ETF) An underlying fund’s use of derivatives may increase the risks of investing in the underlying fund by increasing investment exposure (which may be considered leverage) or, in the case of many over-the-counter instruments, because of the potential inability to terminate or sell derivatives positions and the potential failure of the other party to the instrument to meet its obligations. The risk of a party failing to meet its obligations may increase if the fund has significant investment exposure to that counterparty. The value of derivatives may move in unexpected ways due to unanticipated market movements, the use of leverage, imperfect correlation between the derivative instrument and the reference asset, or other factors, especially in unusual market conditions, and volatility in the value of derivatives could adversely impact the underlying fund’s returns, obligations and exposures. Derivatives are also subject to other risks, including liquidity risk (e.g., liquidity demands arising from the requirement to make payments to a derivative counterparty), operational risk (e.g., settlement issues or system failure), and legal risk (e.g., insufficient legal documentation or contract enforceability issues).
Floating rate obligations risk. (For Core Bond ETF, High Yield ETF and Ultra Short ETF) To the extent an underlying fund holds floating rate loans, interest rate risk may be reduced but will not be eliminated. While floating rate loans are normally secured by specific collateral or assets of the issuer (so that holders of the loans, such as the underlying fund, will have a priority claim on those assets in the event of default or bankruptcy of the issuer), the value of collateral may be insufficient to meet the issuer’s obligations, and the underlying fund’s access to collateral may be limited by bankruptcy or other insolvency laws. The settlement period (the period between the execution of the trade and the delivery of cash to the purchaser) for floating rate loan transactions is typically longer than seven days, and it is possible that sale proceeds from floating rate loan transactions will not be available to meet redemption obligations.
Portfolio turnover rate risk. From time to time an underlying fund may engage in frequent trading. Funds with high turnover may be more likely to realize capital gains that must be distributed to shareholders as taxable income. High turnover may also cause a fund to pay more brokerage commissions and to incur other transaction costs (including imputed transaction costs), which may detract from performance. A fund’s portfolio turnover rate and the amount of brokerage commissions it pays and transaction costs it incurs will vary over time based on market conditions.
Management and operational risk. There is no guarantee that the investment techniques, analyses, or judgments that Franklin Advisers, Putnam Management or PanAgora, as applicable, applies in making investment decisions for the underlying funds will produce the intended outcome or that the investments they select for the underlying funds will perform as well as other securities that were not selected for the underlying funds. Franklin Advisers, Putnam Management, PanAgora, or the underlying funds’ other service providers, may experience disruptions or operating errors that could negatively impact the underlying funds.
Risks Related to Investing in ETFs
As ETFs, shares of the underlying funds are traded in the secondary market. Prior to trading in the secondary market, shares of the underlying funds are “created” at NAV by market makers, large investors and institutions (collectively, “authorized participants”) only in creation units. A creation transaction generally takes place when an authorized participant deposits into an underlying fund a designated portfolio of securities, assets or other positions (a “creation basket”), and an amount of cash (including any cash representing the value of substituted securities, assets or other positions), if any, in exchange for a specified number of creation units. Similarly, shares of an underlying fund can be redeemed only in creation units, generally for a designated portfolio of securities, assets or other positions held by the underlying fund and an amount of cash (including any portion of such securities for which cash may be substituted), if any.
Fluctuation of net asset value (“NAV”) and share price risk. Shares of the underlying funds may trade at a larger premium or discount to their NAV than shares of other ETFs. The NAV of an underlying fund will generally fluctuate with changes in the market value of the underlying fund’s holdings. Underlying fund shares can be bought and sold in the secondary market at market prices. Disruptions to creations and redemptions, the existence of extreme market volatility or potential lack of an active trading market for an underlying fund’s shares may result in the underlying fund’s shares trading significantly above (at a premium) or below (at a discount) to NAV or to the intraday value of the underlying fund’s holdings. In addition, in stressed market conditions or periods of market disruption or volatility, the market for shares of the underlying funds may become less liquid in response to deteriorating liquidity in the markets for the underlying funds’ portfolio holdings.
Authorized participant concentration risk. Only an authorized participant may engage in creation and redemption transactions directly with an underlying fund. Your fund is not an authorized participant and can only purchase and sell underlying fund shares in the secondary market at market prices or through an authorized participant. The underlying fund may have a limited number of financial institutions that act as authorized participants, none of which are obligated to engage in creation and/or redemption transactions. To the extent that those authorized participants do not engage in creation and redemption orders, there may be a significantly diminished trading market for underlying fund shares, or underlying fund shares may trade at a discount (or premium) to NAV and possibly face trading halts and/or de-listing.
Trading issues risk. The underlying funds have a limited public trading history. Sustainable Leaders ETF and Sustainable Future ETF began trading publicly in May 2021, while PanAgora International Equity ETF, PanAgora Emerging Markets Equity ETF, Core Bond ETF, High Yield ETF, and Ultra Short ETF began trading publicly in January 2023. There can be no assurance that an active trading market will develop or be maintained or that the market for underlying fund shares will operate as intended, which could lead to the underlying funds’ shares trading at wider spreads and larger premiums and discounts to NAV than other actively managed ETFs. As a
result, it may cost the fund more to trade underlying fund shares than shares of other ETFs. There is no guarantee that the underlying fund will be able to attract market makers and authorized participants. Market makers and authorized participants are not obligated to make a market in the underlying fund’s shares or to submit purchase and redemption orders for creation units.
The market prices of an underlying fund’s shares are expected to fluctuate, in some cases materially, in response to changes in the underlying fund’s NAV, the intraday value of the underlying fund’s holdings and supply and demand for the underlying fund’s shares. Each underlying fund’s respective investment manager cannot predict whether an underlying fund’s shares will trade above, below or at their NAV or the intraday value of the underlying fund’s holdings. During periods when an underlying fund is trading below its NAV, the fund may incur significant losses if it sells its underlying fund shares.
The securities held by an underlying fund may be traded in markets that close at a different time than the exchange on which the underlying fund’s shares are listed. Liquidity in those securities may be reduced after the applicable closing times. Accordingly, during the time when the exchange is open but after the applicable market closing, fixing or settlement times, bid-ask spreads on the exchange and the corresponding premium or discount to the NAV of the underlying funds’ shares may widen.
Large shareholder risk. Each underlying fund may be an investment option for mutual funds that are managed by Franklin Resources, Inc. (“Franklin Templeton”) and its affiliates as “funds of funds.” Additionally, other investors from time to time may make substantial investments in an underlying fund, including affiliates of Franklin Templeton, through seed capital arrangements. Such shareholders may at times be considered to control an underlying fund. Dispositions of a large number of shares by these shareholders may adversely affect an underlying fund’s liquidity and net assets to the extent such transactions are executed directly with the underlying fund in the form of redemptions through an authorized participant, rather than executed in the secondary market. These redemptions may also force an underlying fund to sell securities, which may increase the underlying fund’s brokerage costs. In addition, underlying fund returns may be adversely affected if an underlying fund holds a portion of its assets in liquid, cash-like investments in connection with or in anticipation of shareholder redemptions. To the extent these large shareholders transact in shares of an underlying fund on the secondary market, such transactions may account for a large percentage of the trading volume on the exchange and may, therefore, have a material effect (upward or downward) on the market price of the underlying fund’s shares.
Cash transactions risk. Some of the underlying funds may effect creations and redemptions in cash or partially in cash. Therefore, an underlying fund may be required to sell portfolio securities, incur transaction costs, and subsequently recognize gains on such sales that the underlying fund might not have recognized if it were to distribute portfolio securities in-kind. As such, investments by a fund in an
underlying fund’s shares may be less tax-efficient than an investment in an ETF that distributes portfolio securities entirely in-kind. An underlying fund may also incur transaction costs in connection with creations effected in cash (in whole or in part).
Semi-transparent ETF risk. (For Sustainable Leaders ETF and Sustainable Future ETF) Two of the underlying funds, Putnam Sustainable Leaders ETF and Putnam Sustainable Future ETF (the “Semi-Transparent ETFs”), are different from traditional ETFs, including the other underlying funds. Traditional ETFs disclose to the public what assets they hold each day. However, the Semi-Transparent ETFs do not. This may create additional risks for an investment in the Semi-Transparent ETFs, including that an investor may have to pay more money to trade the Semi-Transparent ETF’s shares in light of the fact that the Semi-Transparent ETF will provide less information to traders, who tend to charge more for trades when they have less information. The price an investor pays to buy or sell an ETF’s shares on an exchange may not match the value of the ETF’s portfolio, and these price differences may be greater for the Semi-Transparent ETFs compared to other ETFs because they provide less information to traders. These additional risks may be even greater in adverse or uncertain market conditions.
The differences between the Semi-Transparent ETFs and other ETFs may also have advantages. By keeping certain information about the Semi-Transparent ETFs secret, a Semi-Transparent ETF may face less risk that other traders can predict or copy its investment strategy. This may improve the Semi-Transparent ETF’s performance. If other traders are able to copy or predict the Semi-Transparent ETF’s investment strategy, however, this may hurt the Semi-Transparent ETF’s performance.
Tracking basket structure risk. (For Sustainable Leaders ETF and Sustainable Future ETF) The Semi-Transparent ETFs are actively managed ETFs that operate pursuant to an exemptive order from the Securities and Exchange Commission and do not publicly disclose their complete portfolio holdings each business day. Instead, each Semi-Transparent ETF publishes each business day on its website a “Tracking Basket,” which is designed to closely track the daily performance of the Semi-Transparent ETF but is not the Semi-Transparent ETF’s actual portfolio. The Tracking Basket is comprised of: (1) select recently disclosed portfolio holdings and/or select securities from the universe from which the Semi-Transparent ETF’s investments are selected (“Strategy Components”); (2) liquid ETFs that convey information about the types of instruments (that are not otherwise fully represented by the Strategy Components) in which the Semi-Transparent ETF invests; and (3) cash and cash equivalents.
A Semi-Transparent ETF’s Tracking Basket structure may affect the price at which shares of the Semi-Transparent ETF trade in the secondary market. Although the Tracking Basket is intended to provide investors with enough information to allow for an effective arbitrage mechanism that will keep the market price of each Semi-Transparent ETF at or close to its NAV per share, there is a risk that market prices will vary significantly from NAV. The Semi-Transparent ETFs, which trade on the basis of a published Tracking Basket, may trade at a wider bid/ask spread than ETFs that
publish their portfolios on a daily basis, and therefore, may cost investors more to trade. These risks may increase during periods of market disruption or volatility. In addition, although each Semi-Transparent ETF seeks to benefit from keeping its portfolio information secret, market participants may attempt to use the Tracking Basket to identify the Semi-Transparent ETF’s trading strategy. If successful, this could result in such market participants engaging in certain predatory trading practices that may have the potential to harm the Semi-Transparent ETF and its shareholders, such as front running the Semi-Transparent ETF’s trades of portfolio securities.
Arbitrage risk. (For Sustainable Leaders ETF and Sustainable Future ETF) Unlike ETFs that publicly disclose their complete portfolio holdings each business day, each Semi-Transparent ETF provides certain other information intended to allow market participants to estimate the value of positions in the Semi-Transparent ETF’s shares. Although this information is designed to facilitate arbitrage opportunities in the Semi-Transparent ETF’s shares to reduce bid/ask spreads and minimize discounts or premiums between the market price and NAV of the Semi-Transparent ETF shares, there is no guarantee the Semi-Transparent ETF’s arbitrage mechanism will operate as intended and that the Semi-Transparent ETF will not experience wide bid/ask spreads and/or large discounts or premiums to NAV. In addition, market participants may attempt to use the disclosed information to “reverse engineer” the Semi-Transparent ETF’s trading strategy, which, if successful, could increase opportunities for predatory trading practices that may have the potential to negatively impact the Semi-Transparent ETF’s performance.
Trading halt risk. (For Sustainable Leaders ETF and Sustainable Future ETF) There may be circumstances where a security held in a Semi-Transparent ETF’s portfolio but not in the Tracking Basket does not have readily available market quotations. If Putnam Management determines that such circumstance may affect the reliability of the Tracking Basket as an arbitrage vehicle, that information, along with the identity and weighting of that security in the Semi-Transparent ETF’s portfolio, will be publicly disclosed on the Semi-Transparent ETF’s website, and Putnam Management will assess appropriate remedial measures. In these circumstances, market participants may use this information to engage in certain predatory trading practices that may have the potential to harm the Semi-Transparent ETF and its shareholders. In addition, if securities representing 10% or more of the Semi-Transparent ETF’s portfolio do not have readily available market quotations, Putnam Management would promptly request the exchange to halt trading of the Semi-Transparent ETF, meaning that investors (including the fund) would not be able to trade their shares. Trading may also be halted in other circumstances, for example, due to market conditions.
The fund may not achieve its goal, and it is not intended to be a complete investment program. An investment in the fund is not insured or guaranteed by the Federal Deposit Insurance Corporation or any other government agency.
Investor profile
The fund is designed for investors in or near retirement or otherwise seeking an investment for use with a periodic withdrawal program. Investors are encouraged to seek the assistance of a financial advisor in developing a periodic withdrawal program that is appropriate to their personal investment goals and financial circumstances. The fund also serves as the fund into which each of the Putnam Sustainable Retirement Funds will be merged near the end of the target date year of the Putnam Sustainable Retirement Fund. The fund makes no representations regarding its suitability for any particular investor or periodic withdrawal program. Investors should understand that pursuing higher returns may involve higher volatility and that a fund’s performance results may not be sustainable.
The performance information below gives some indication of the risks associated with an investment in the fund by showing the fund’s performance year to year and over time. Before February 10, 2023, the fund was managed with a materially different investment strategy and may have achieved materially different performance results under its current investment strategy from that shown for periods before this date. The bar chart does not reflect the impact of sales charges. If it did, performance would be lower. Please remember that past performance is not necessarily an indication of future results. Monthly performance figures for the fund are available at www.franklintempleton.com.
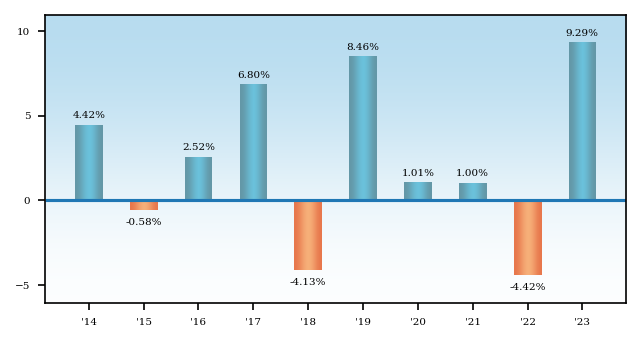
Average Annual Total Returns - Putnam Sustainable Retirement Maturity Fund |
1 Year |
5 Years |
10 Years |
||
|---|---|---|---|---|---|
| Class A Maturity | 4.91% | 2.10% | 1.92% | ||
| Class A Maturity | After Taxes on Distributions | 3.54% | 0.70% | 0.74% | ||
| Class A Maturity | After Taxes on Distributions and Sales | 2.90% | 1.07% | 1.00% | ||
| Class C Maturity | 7.43% | 2.16% | 1.72% | ||
| Class R Maturity | 8.83% | 2.58% | 2.03% | ||
| Class R3 Maturity | [1] | 9.16% | 2.77% | 2.17% | |
| Class R4 Maturity | [2] | 9.39% | 3.03% | 2.43% | |
| Class R5 Maturity | [3] | 9.57% | 3.19% | 2.57% | |
| Class R6 Maturity | [4] | 9.74% | 3.30% | 2.66% | |
| Class Y Maturity | 9.56% | 3.20% | 2.59% | ||
| Bloomberg U.S. Aggregate Bond Index (no deduction for fees, expenses or taxes) | [5] | 5.53% | 1.10% | 1.81% | |
| Russell 3000® Index (no deduction for fees, expenses or taxes) | [5] | 25.96% | 15.16% | 11.48% | |
| S&P Target Date To Retirement Income Index (no deduction for fees, expenses or taxes) | [5] | 10.55% | 5.06% | none | [6] |
| [1] | Performance for class R3 shares prior to their inception (1/4/21) is derived from the historical performance of class Y shares, adjusted for the higher 12b-1 fees and investor servicing fees applicable to class R3 shares (relative to the comparable fees applicable to class Y shares prior to the inception of class R3 shares). |
| [2] | Performance for class R4 shares prior to their inception (1/4/21) is derived from the historical performance of class Y shares, adjusted for the higher investor servicing fees applicable to class R4 shares (relative to the comparable fees applicable to class Y shares prior to the inception of class R4 shares). |
| [3] | Performance for class R5 shares prior to their inception (1/4/21) is derived from the historical performance of class R6 shares, adjusted for the higher investor servicing fees applicable to class R5 shares (relative to the comparable fees applicable to R6 shares prior to the inception of class R5 shares). |
| [4] | Performance for class R6 shares prior to their inception (9/1/16) is derived from the historical performance of class Y shares and has not been adjusted for the lower investor servicing fees applicable to class R6 shares (relative to the comparable fees applicable to class Y shares prior to the inception of class R6 shares); had it, returns would have been higher. |
| [5] | The table above compares the fund’s returns to the performance of three indexes: (i) the Bloomberg U.S. Aggregate Bond Index, a broad measure of market performance, (ii) the Russell 3000® Index, a broad measure of market performance, and (iii) the S&P Target Date To Retirement Income Index, an additional index that the Investment Manager believes more closely reflects the fund’s principal investment objective and strategies. |
| [6] | The S&P Target Date To Retirement Income Index did not commence calculation and publication until 5/30/14. |
| Class C share performance reflects conversion to class A shares after eight years. |
| After-tax returns reflect the historical highest individual federal marginal income tax rates and do not reflect state and local taxes. Actual after-tax returns depend on an investor’s tax situation and may differ from those shown. After-tax returns are shown for class A shares only and will vary for other classes. These after-tax returns do not apply if you hold your fund shares through a 401(k) plan, an IRA, or another tax-advantaged arrangement. |
| The Bloomberg U.S. Aggregate Bond Index is an unmanaged index of U.S. investment-grade fixed income securities. |
| All Bloomberg indices are provided by Bloomberg Index Services Limited. |
| BLOOMBERG® is a trademark and service mark of Bloomberg Finance L.P. and its affiliates (collectively “Bloomberg”). Bloomberg or Bloomberg’s licensors own all proprietary rights in the Bloomberg Indices. Neither Bloomberg nor Bloomberg’s licensors approve or endorse this material, or guarantees the accuracy or completeness of any information herein, or makes any warranty, express or implied, as to the results to be obtained therefrom, and to the maximum extent allowed by law, neither shall have any liability or responsibility for injury or damages arising in connection therewith. |
| The Russell 3000® Index measures the performance of the 3,000 largest U.S. companies based on total market capitalization. Source: FTSE. |
| Frank Russell Company is the source and owner of the trademarks, service marks and copyrights related to the Russell Indexes. Russell ® is a trademark of Frank Russell Company. |
| The S&P Target Date To Retirement Income Index is designed to represent a market consensus of asset class exposure and glide path across the universe of “to” target date fund managers. |
| Securities in the fund do not match those in the indexes and the performance of the fund will differ. |