The Integrity High Income Fund (the “Fund”) seeks to provide a high level of current income
This table describes the fees and expenses that you may pay if you buy, hold, and sell shares of the Fund. You may pay other fees, such as brokerage commissions and other fees to financial intermediaries, which are not reflected in the tables and examples below. You may qualify for sales charge discounts with respect to purchases of Class A shares of the Fund if you and your family invest, or agree to invest in the future, at least $50,000 in the Fund or in other funds in the Integrity/Viking family of funds. More information about these and other discounts is available from your financial professional and in “The Shares Offered; Class A Shares” and “How to Reduce Your Sales Charge” on page 43 and 46, respectively, of the Fund’s prospectus, Appendix A of the Fund’s prospectus, and “Purchase and Redemption of Shares” on page B-51 of the Fund’s statement of additional information.
Shareholder Fees - Integrity High Income Fund - USD ($) |
Class A |
Class C |
Class I |
|---|---|---|---|
| Maximum Sales Charge (Load) Imposed on Purchases (as a percentage of offering price) | 4.25% | none | none |
| Maximum Deferred Sales Charge (Load) (as a percentage of the lesser of purchase price or redemption proceeds) | 1.00% | 1.00% | none |
| Maximum Sales Charge (Load) Imposed on Reinvested Dividends | none | none | none |
| Redemption Fee | none | none | none |
| Exchange Fee | none | none | none |
Annual Fund Operating Expenses - Integrity High Income Fund |
Class A |
Class C |
Class I |
|
|---|---|---|---|---|
| Management Fees | 0.85% | 0.85% | 0.85% | |
| Distribution and Service (12b-1) Fees | 0.25% | 1.00% | none | |
| Other Expenses | 0.55% | 0.55% | 0.55% | |
| Total Annual Fund Operating Expenses | 1.65% | 2.40% | 1.40% | |
| Fee Waivers and Expense Reimbursements | [1] | (0.56%) | (0.56%) | (0.56%) |
| Total Annual Fund Operating Expenses After Fee Waivers and Expense Reimbursements | [1] | 1.09% | 1.84% | 0.84% |
| [1] | The Fund’s investment adviser, Viking Fund Management, LLC (“Viking Management,” “investment manager,” or the “Adviser”), has contractually agreed to waive fees and reimburse expenses through November 29, 2025 so that Total Annual Fund Operating Expenses After Fee Waivers and Expense Reimbursements (excluding taxes, brokerage fees, commissions, extraordinary and non-recurring expenses, and acquired fund fees and expenses) do not exceed 1.09% of average daily net assets for Class A shares, 1.84% of average daily net assets for Class C shares, and 0.84% of average daily net assets for Class I shares. This expense limitation agreement may only be terminated or modified prior to November 29, 2025 with the approval of the Fund’s Board of Trustees. The terms of the expense limitation agreement provide that Viking Management is entitled to recoup such amounts waived or reimbursed for a period of up to three years from the date on which Viking Management waived fees or reimbursed expenses for the Fund. The Fund will make repayments to the Adviser only if such repayment does not cause the annual Fund operating expenses (after the repayment is taken into account) to exceed both (1) the expense limitation in place when such amounts were waived and (2) the Fund’s current expense limitation. |
This Example is intended to help you compare the cost of investing in the Fund with the costs of investing in other mutual funds. The Example assumes you invest $10,000 in the Fund for the time periods indicated and then either redeem or do not redeem your shares at those periods. The Example also assumes that your investment has a 5% return each year, that the Fund’s operating expenses remain the same, and that the contractual expense limitation agreement remains in place for the first year. Although your actual costs may be higher or lower, based on these assumptions your costs would be:
Expense Example - Integrity High Income Fund - USD ($) |
1 Year |
3 Years |
5 Years |
10 Years |
|---|---|---|---|---|
| Class A | 522 | 861 | 1,224 | 2,243 |
| Class C | 277 | 685 | 1,221 | 2,686 |
| Class I | 76 | 378 | 703 | 1,623 |
Expense Example No Redemption |
1 Year |
3 Years |
5 Years |
10 Years |
|---|---|---|---|---|
| Integrity High Income Fund | Class C / No Redemption | USD ($) | 177 | 685 | 1,221 | 2,686 |
The Fund pays transaction costs, such as commissions, when it buys and sells securities (or “turns over” its portfolio). A higher portfolio turnover rate may indicate higher transaction costs and may result in higher taxes when Fund shares are held in a taxable account. These costs, which are not reflected in annual fund operating expenses or in the Example, affect the Fund’s performance. During the most recent fiscal period, the Fund’s portfolio turnover rate was 25.60% of the average value of its portfolio.
The Fund invests in a group of low-quality, high-risk, high yield corporate debt obligations. Under normal circumstances, at least 80% of the Fund’s net assets (plus any borrowings made for investment purposes) will be invested in corporate bonds rated Baa by Moody’s Investors Service (“Moody’s”) or BBB by S&P Global Ratings (“S&P”) or lower. As a result, this includes high yield/lower-rated debt securities (also known as “junk” bonds) that are rated by an independent rating agency to be non-investment grade (e.g., BB or lower by S&P or Ba or lower by Moody’s). Because of their low credit quality, these securities typically pay higher interest rates to compensate investors for the substantial credit risk they assume. The Fund may also invest in corporate issues that have defaulted. In addition, the Fund may invest in Rule 144A securities, which are generally privately placed securities purchased by qualified institutional buyers. While there are no restrictions on maturity, the Fund’s portfolio generally has an average maturity of less than ten years. The Fund seeks capital appreciation from selling bonds above the purchase price.
To select the securities in which to invest, the Fund’s sub-adviser conducts fundamental credit research on each issuer. The Fund will buy securities that the sub-adviser believes are attractively priced relative to current and expected fundamentals. The Fund may consider selling a security if, among other considerations, the issuer’s business fundamentals have deteriorated.
The following bar chart and table provide some indication of the risks of investing in the Fund. The Fund’s past performance (before and after taxes) is not necessarily an indication of how the Fund will perform in the future. Updated performance information is available at www.integrityvikingfunds.com or by calling 800-276-1262.
Prior to August 1, 2009, the Fund was managed by Integrity Money Management, Inc. Since August 1, 2009, the Fund has been managed by Viking Fund Management, LLC. In addition, effective May 5, 2008, the Fund replaced its sub-adviser. Accordingly, the results prior to May 5, 2008 were achieved while the Fund was sub-advised by its previous sub-advisor, and its investment strategies and techniques differed from those of, and may have produced different investment results than those achieved by, J.P. Morgan Investment Management Inc., which became the Fund’s sub-adviser effective May 5, 2008.
The bar chart below shows the variability of the Fund’s performance for Class A shares. The bar chart and highest/lowest quarterly returns that follow do not reflect sales charges, and if these charges were reflected, the returns would be less than those shown.
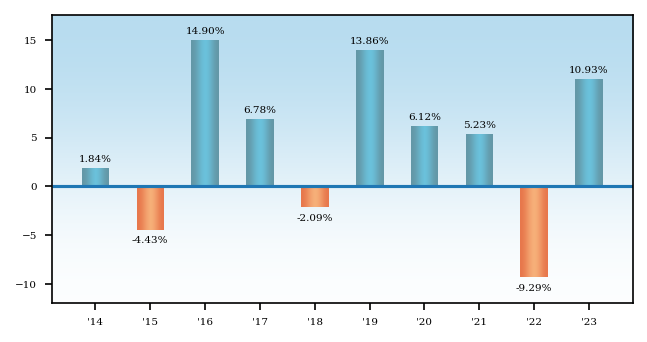
During the ten-year period shown in the bar chart, the highest return for a quarter was 8.47% (quarter ended June 30, 2020) and the lowest return for a quarter was -11.48% (quarter ended March 31, 2020). The Fund’s calendar year-to-date total return as of September 30, 2024 was 7.60%.
The table below shows the Fund’s average annual total returns for 1, 5, and 10 years for Class A and Class C shares, and for 1 year, 5 years, and since inception for Class I shares, and how they compare with those of a broad measure of market performance. The return information below reflects applicable sales charges. After-tax returns are calculated using the historical highest individual federal marginal income tax rates and do not reflect the impact of any state and local taxes. After-tax returns are shown for Class A shares only; after-tax returns for Class C and Class I shares will vary. Actual after-tax returns depend on an investor’s tax situation and may differ from those shown, and after-tax returns shown are not relevant to investors who hold their Fund shares through tax-advantaged arrangements, such as 401(k) plans or individual retirement accounts (“IRAs”).
Average Annual Returns - Integrity High Income Fund |
Label |
1 Year |
5 Years |
10 Years |
Since Inception |
Inception Date |
||||
|---|---|---|---|---|---|---|---|---|---|---|
| Class A | Return Before Taxes | 6.22% | 4.15% | 3.65% | ||||||
| Class A | Return After Taxes on Distributions | Return After Taxes on Distributions | 3.93% | 2.19% | 1.55% | ||||||
| Class A | Return After Taxes on Distributions and Sale of Fund Shares | Return After Taxes on Distributions and Sale of Fund Shares | 3.60% | 2.33% | 1.82% | ||||||
| Class C | Return Before Taxes | 9.24% | 4.27% | 3.34% | ||||||
| Class I | Return Before Taxes | 11.21% | 5.29% | 4.79% | Aug. 01, 2016 | |||||
| Class I | Bloomberg U.S. Aggregate Bond Index(1) (reflects no deduction for fees, expenses, or taxes) | Aug. 01, 2016 | |||||||||
| Class I | Bloomberg U.S. Corporate High Yield Bond Index(2) (reflects no deduction for fees, expenses, or taxes) | Aug. 01, 2016 | |||||||||
| Bloomberg U.S. Aggregate Bond Index(1) (reflects no deduction for fees, expenses, or taxes) | Bloomberg U.S. Aggregate Bond Index(1) (reflects no deduction for fees, expenses, or taxes) | 5.53% | [1] | 5.64% | [1] | 1.81% | [1] | 0.81% | [1] | |
| Bloomberg U.S. Corporate High Yield Bond Index(2) (reflects no deduction for fees, expenses, or taxes) | Bloomberg U.S. Corporate High Yield Bond Index(2) (reflects no deduction for fees, expenses, or taxes) | 13.45% | [2] | 5.37% | [2] | 4.60% | [2] | 4.94% | [2] | |
| [1] | The Bloomberg U.S. Aggregate Bond Index is a broad based, market capitalization-weighted bond market index representing intermediate term investment grade bonds traded in the United States. Investors frequently use the index as a stand-in for measuring the performance of the US bond market. |
| [2] | The Bloomberg U.S. Corporate High Yield Bond Index is an unmanaged index measures the USD-denominated, high yield, fixed-rate corporate bond market. |