Aug. 31, 2024
The Invesco BulletShares 2029 Corporate Bond ETF (the “Fund”) seeks to track the investment results (before fees and expenses) of the Invesco BulletShares® USD Corporate Bond 2029 Index (the “Underlying Index”).
This table describes the fees and expenses that you may pay if you buy, hold, and sell shares of the Fund (“Shares”). You may pay other fees, such as brokerage commissions and other fees to financial intermediaries, which are not reflected in the table and example below.
| Annual Fund Operating Expenses (expenses that you pay each year as a percentage of the value of your investment) | |
| Management Fees | 0.10 % |
| | |
| Other Expenses | None |
| | |
| Total Annual Fund Operating Expenses | 0.10 |
| | |
This example is intended to help you compare the cost of investing in the Fund with the cost of investing in other funds.
The example assumes that you invest $10,000 in the Fund for the time periods indicated and then sell all of your Shares at the end of those periods. The example also assumes that your investment has a 5% return each year and that the Fund's operating expenses remain the same. This example does not include brokerage commissions that investors may pay to buy and sell Shares. Although your actual costs may be higher or lower, your costs, based on these assumptions, would be:
|
1 Year
|
3 Years
|
5 Years
|
10 Years
|
| $10 |
$32 |
$57 |
$129 |
The Fund pays transaction costs, such as commissions, when it purchases and sells securities (or “turns over” its portfolio). A higher portfolio turnover rate will cause the Fund to incur additional transaction costs and may result in higher taxes when Shares are held in a taxable account. These costs, which are not reflected in Total Annual Fund Operating Expenses or in the example, may affect the Fund's performance. During the most recent fiscal year, the Fund's portfolio turnover rate was 0% of the average value of its portfolio.
The Fund generally will invest at least 80% of its total assets in the securities that comprise the Underlying Index. Strictly in accordance with its guidelines and mandated procedures, Invesco Indexing LLC (the “Index Provider”) compiles and maintains the Underlying Index. The Index Provider is affiliated with Invesco Capital Management LLC, the Fund’s investment adviser (the “Adviser”), and Invesco Distributors, Inc., the Fund’s distributor (the “Distributor”).
The Underlying Index seeks to measure the performance of a portfolio of U.S. dollar-denominated investment grade corporate bonds with maturities or, in some cases, “effective maturities” in the year 2029 (collectively, “2029 Bonds”). Certain bonds in which the Fund may invest may contain embedded issuer call options. An embedded issuer call option means that the bond’s issuer has the right to redeem a bond prior to its designated maturity date. Accordingly, the effective maturity date of a bond reflects an assessment of when that bond is likely to be called by the issuer, or in the alternate, the bond’s stated maturity date (if it is not called by the issuer). With respect to establishing the effective maturity of a bond, the effective maturity is the actual year of maturity (i) if no embedded issuer call option exists for a bond; (ii) if a bond contains an embedded issuer call option, with the first call date within 13 months of maturity and a par call price; and (iii) unless the yield to next call date is less than the yield to
maturity, in which case the bond’s effective maturity is deemed to be the year of the next call date.
In selecting components for inclusion in the Underlying Index, the Index Provider begins with an investment universe of U.S. dollar-denominated bonds issued by companies domiciled in the U.S., Canada, Western Europe (which the Index Provider defines, as of the date of this prospectus, to be: Austria, Belgium, Denmark, Finland, France, Germany, Greece, Ireland, Italy, Luxembourg, the Netherlands, Norway, Portugal, Spain, Sweden, Switzerland and the United Kingdom) or Japan. To be eligible for inclusion in the Underlying Index, bonds must (i) be 2029 Bonds (i.e., will mature or will have an effective maturity in the year 2029); (ii) pay a fixed amount of taxable interest; (iii) be rated at least BBB- by S&P Global Ratings, a division of S&P Global Inc. (“S&P”), or Fitch Ratings Inc. (“Fitch”) or at least Baa3 by Moody’s Investors Service, Inc. (“Moody’s”); and (iv) have at least $500 million in face value outstanding (existing bonds in the eligible universe require $400 million in face value outstanding to remain eligible).
2029 Bonds selected for inclusion in the Underlying Index are market value weighted, with a 5% limit on individual issuers applied at each monthly rebalance prior to the final maturing year of the Underlying Index. Bonds held by the Fund generally will be held until they mature, are called or no longer meet the eligibility requirements of the Underlying Index and are removed from the Underlying Index.
As of October 31, 2024, the Underlying Index was comprised of 401 constituents.
The Fund will terminate on or about December 15, 2029 without requiring additional approval by the Board of Trustees (the “Board”) of Invesco Exchange-Traded Self-Indexed Fund Trust (the “Trust”) or Fund shareholders, although the Board may change the termination date. In connection with the termination of the Fund, the Fund will make a cash distribution of its net assets to then-current shareholders after making appropriate provisions for any liabilities of the Fund.
The Fund does not seek to distribute any predetermined amount of cash at maturity. During the maturing year of the Underlying Index (i.e., 2029), no new constituents are added and the Underlying Index rebalances only through June. In the last six months of operation, when the 2029 Bonds held by the Fund mature, the Fund’s portfolio will transition to cash and cash equivalents, including, without limitation, U.S. Treasury Bills and investment grade commercial paper. The Fund should not be confused with a target date fund, which has assets that are managed according to a particular glidepath that illustrates how its investment strategy becomes increasingly conservative over time.
The Fund does not purchase all of the securities in the Underlying Index; instead, the Fund utilizes a “sampling” methodology to seek to achieve its investment objective.
Concentration Policy. The Fund will concentrate its investments (i.e., invest more than 25% of the value of its net assets) in securities of issuers in any one industry or group of industries only to the extent that the Underlying Index reflects a concentration in that industry or group of industries. The Fund will not otherwise concentrate its investments in securities of issuers in any one industry or group of industries.
The bar chart below shows how the Fund has performed. The table below the bar chart shows the Fund’s average annual total returns (before and after taxes). The bar chart and table provide an indication of the risks of investing in the Fund by showing how the Fund’s total returns have varied from year to year and by showing how the Fund’s average annual total returns compared with a broad measure of market performance and additional indices with characteristics relevant to the Fund. The Fund's performance reflects fee waivers, if any, absent which performance would have been lower. Although the information shown in the bar chart and the table gives you some idea of the risks involved in investing in the Fund, the Fund’s past performance (before and after taxes) is not necessarily indicative of how the Fund will perform in the future.
Updated performance information is available online at www.invesco.com/ETFs.
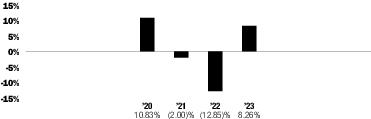
| | Period Ended | Returns |
| Year-to-date | September 30, 2024 | 5.17% |
| Best Quarter | June 30, 2020 | 11.29% |
| Worst Quarter | March 31, 2022 | -6.48% |
| | Inception Date | 1 Year | Since Inception |
| Return Before Taxes | 9/12/2019 | 8.26 % | 1.06 % |
| Return After Taxes on Distributions | | 6.50 | -0.06 |
| Return After Taxes on Distributions and Sale of Fund Shares | | 4.83 | 0.34 |
| | |||
| Invesco BulletShares® USD Corporate Bond 2029 Index (reflects no deduction for fees, expenses or taxes) | | 8.44 | 1.20 |
| | |||
| Bloomberg U.S. Aggregate Bond Index (reflects no deduction for fees, expenses or taxes)1 | | 5.53 | -0.45 |
| | |||
| Bloomberg U.S. Corporate Index (reflects no deduction for fees, expenses or taxes)1 | | 8.52 | 0.40 |
| | |||
1
Effective August 31, 2024, the Fund changed its broad-based securities market benchmark from the Bloomberg U.S. Corporate Index to the Bloomberg U.S. Aggregate Bond Index to reflect that the Bloomberg U.S. Aggregate Bond Index can be considered more broadly representative of the overall applicable securities market.
After-tax returns in the above table are calculated using the historical highest individual federal marginal income tax rates and do not reflect the impact of state and local taxes. Actual after-tax returns depend on an investor's tax situation and may differ from those shown, and after-tax returns shown are not relevant to investors who hold Shares through tax-advantaged arrangements, such as 401(k) plans or individual retirement accounts.