Performance Management
Aug. 31, 2024
The bar chart below shows how the Fund has performed. The table below the bar chart shows the Fund’s average annual total returns (before and after taxes). The bar chart and table provide an indication of the risks of
investing in the Fund by showing how the Fund’s total returns have varied from year to year and by showing how the Fund’s average annual total returns compared with a broad measure of market performance and additional indices with characteristics relevant to the Fund. The Fund's performance reflects fee waivers, if any, absent which performance would have been lower. Although the information shown in the bar chart and the table gives you some idea of the risks involved in investing in the Fund, the Fund’s past performance (before and after taxes) is not necessarily indicative of how the Fund will perform in the future.
The Fund is the successor to the investment performance of the Guggenheim Defensive Equity ETF (the “Predecessor Fund”) as a result of the reorganization of the Predecessor Fund into the Fund, which was consummated after the close of business on April 6, 2018. Accordingly, the performance information shown below for periods ended on or prior to April 6, 2018 is that of the Predecessor Fund.
Updated performance information is available online at www.invesco.com/ETFs.
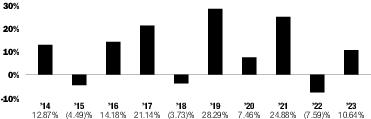
| | Period Ended | Returns |
| Year-to-date | September 30, 2024 | 17.23% |
| Best Quarter | June 30, 2020 | 15.19% |
| Worst Quarter | March 31, 2020 | -19.80% |
| | Inception Date | 1 Year | 5 Years | 10 Years |
| Return Before Taxes | 12/15/2006 | 10.64 % | 11.97 % | 9.71 % |
| Return After Taxes on Distributions | | 10.22 | 11.62 | 9.05 |
| Return After Taxes on Distributions and Sale of Fund Shares | | 6.59 | 9.53 | 7.67 |
| | ||||
| Bloomberg Pricing Power Index (reflects no deduction for fees, expenses or taxes)1 | | |||
| | ||||
| Blended - Invesco Bloomberg Pricing Power Benchmark (reflects no deduction for fees, expenses or taxes)2 | | 11.20 | 12.59 | 10.34 |
| | ||||
| S&P 500® Index (reflects no deduction for fees, expenses or taxes) | | 26.29 | 15.69 | 12.03 |
| | ||||
1
Prior to its commencement date of June 29, 2023, performance for the Underlying Index is not available.
2
The Blended-Invesco Bloomberg Pricing Power Benchmark reflects the performance of the Sabrient Defensive Equity Index, a previous underlying index, for the period prior to October 24, 2016, followed by the performance of the Invesco Defensive Equity Index, the previous underlying index, from October 24, 2016 through August 25, 2023, and the Underlying Index thereafter.
After-tax returns in the above table are calculated using the historical highest individual federal marginal income tax rates and do not reflect the impact of state and local taxes. Actual after-tax returns depend on an investor's tax situation and may differ from those shown, and after-tax returns shown are not relevant to investors who hold Shares through tax-advantaged arrangements, such as 401(k) plans or individual retirement accounts.
The bar chart below shows how the Fund has performed. The table below the bar chart shows the Fund’s average annual total returns (before and after taxes). The bar chart and table provide an indication of the risks of investing in the Fund by showing how the Fund’s total returns have varied from year to year and by showing how the Fund’s average annual total returns compared with a broad measure of market performance and additional indices with characteristics relevant to the Fund. The Fund's performance reflects fee waivers, if any, absent which performance would have been lower. Although the information shown in the bar chart and the table gives you some idea of the risks involved in investing in the Fund, the Fund’s past performance (before and after taxes) is not necessarily indicative of how the Fund will perform in the future.
The Fund is the successor to the investment performance of the Guggenheim BulletShares 2025 Corporate Bond ETF (the “Predecessor Fund”) as a result of the reorganization of the Predecessor Fund into the Fund, which was consummated after the close of business on April 6, 2018. Accordingly, the performance information shown below for periods ending on or prior to April 6, 2018 is that of the Predecessor Fund.
Updated performance information is available online at www.invesco.com/ETFs.
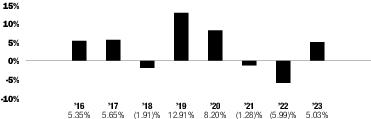
| | Period Ended | Returns |
| Year-to-date | September 30, 2024 | 4.08% |
| Best Quarter | June 30, 2020 | 8.81% |
| Worst Quarter | March 31, 2022 | -4.12% |
| | Inception Date | 1 Year | 5 Years | Since Inception |
| Return Before Taxes | 10/7/2015 | 5.03 % | 3.55 % | 3.12 % |
| Return After Taxes on Distributions | | 3.58 | 2.44 | 1.92 |
| Return After Taxes on Distributions and Sale of Fund Shares | | 2.96 | 2.27 | 1.87 |
| | ||||
| Invesco BulletShares® USD Corporate Bond 2025 Index (reflects no deduction for fees, expenses or taxes) | | 5.16 | 3.66 | 3.32 |
| | ||||
| Bloomberg U.S. Aggregate Bond Index (reflects no deduction for fees, expenses or taxes)1 | | 5.53 | 1.10 | 1.32 |
| | ||||
| Bloomberg U.S. Corporate Index (reflects no deduction for fees, expenses or taxes)1 | | 8.52 | 2.63 | 2.66 |
| | ||||
1
Effective August 31, 2024, the Fund changed its broad-based securities market benchmark from the Bloomberg U.S. Corporate Index to the Bloomberg U.S. Aggregate Bond Index to reflect that the Bloomberg U.S. Aggregate Bond Index can be considered more broadly representative of the overall applicable securities market.
After-tax returns in the above table are calculated using the historical highest individual federal marginal income tax rates and do not reflect the impact of state and local taxes. Actual after-tax returns depend on an investor's tax situation and may differ from those shown, and after-tax returns shown are not relevant to investors who hold Shares through tax-advantaged arrangements, such as 401(k) plans or individual retirement accounts.
The bar chart below shows how the Fund has performed. The table below the bar chart shows the Fund’s average annual total returns (before and after taxes). The bar chart and table provide an indication of the risks of investing in the Fund by showing how the Fund’s total returns have varied from year to year and by showing how the Fund’s average annual total returns compared with a broad measure of market performance and additional indices with characteristics relevant to the Fund. The Fund's performance reflects fee waivers, if any, absent which performance would have been lower. Although the information shown in the bar chart and the table gives you some idea of the risks involved in investing in the Fund, the Fund’s past performance (before and after taxes) is not necessarily indicative of how the Fund will perform in the future.
The Fund is the successor to the investment performance of the Guggenheim BulletShares 2025 High Yield Corporate Bond ETF (the “Predecessor Fund”) as a result of the reorganization of the Predecessor Fund into the Fund, which was consummated after the close of business on May 18, 2018. Accordingly, the performance information shown below for periods ending on or prior to May 18, 2018 is that of the Predecessor Fund.
Updated performance information is available online at www.invesco.com/ETFs.
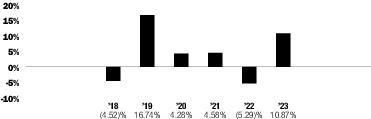
| | Period Ended | Returns |
| Year-to-date | September 30, 2024 | 6.39% |
| Best Quarter | March 31, 2019 | 8.71% |
| Worst Quarter | March 31, 2020 | -12.89% |
| | Inception Date | 1 Year | 5 Years | Since Inception |
| Return Before Taxes | 9/27/2017 | 10.87 % | 5.98 % | 4.05 % |
| Return After Taxes on Distributions | | 7.69 | 3.63 | 1.75 |
| Return After Taxes on Distributions and Sale of Fund Shares | | 6.35 | 3.58 | 2.08 |
| | ||||
| Invesco BulletShares® USD High Yield Corporate Bond 2025 Index (reflects no deduction for fees, expenses or taxes) | | 12.09 | 6.80 | 4.87 |
| | ||||
| Bloomberg U.S. Aggregate Bond Index (reflects no deduction for fees, expenses or taxes)1 | | 5.53 | 1.10 | 0.96 |
| | ||||
| Bloomberg U.S. Corporate High Yield Index (reflects no deduction for fees, expenses or taxes)1 | | 13.44 | 5.37 | 4.02 |
| | ||||
1
Effective August 31, 2024, the Fund changed its broad-based securities market benchmark from the Bloomberg U.S. Corporate High Yield Index to the Bloomberg U.S. Aggregate Bond Index to reflect that the Bloomberg U.S. Aggregate Bond Index can be considered more broadly representative of the overall applicable securities market.
After-tax returns in the above table are calculated using the historical highest individual federal marginal income tax rates and do not reflect the impact of state and local taxes. Actual after-tax returns depend on an investor's tax situation and may differ from those shown, and after-tax returns shown are not relevant to investors who hold Shares through tax-advantaged arrangements, such as 401(k) plans or individual retirement accounts.
The bar chart below shows how the Fund has performed. The table below the bar chart shows the Fund’s average annual total returns (before and after taxes). The bar chart and table provide an indication of the risks of investing in the Fund by showing how the Fund’s total returns have varied from year to year and by showing how the Fund’s average annual total returns compared with a broad measure of market performance and an additional index with characteristics relevant to the Fund. The Fund's performance reflects fee waivers, if any, absent which performance would have been lower. Although the information shown in the bar chart and the table gives you some idea of the risks involved in investing in the Fund, the Fund’s past performance (before and after taxes) is not necessarily indicative of how the Fund will perform in the future.
Updated performance information is available online at www.invesco.com/ETFs.
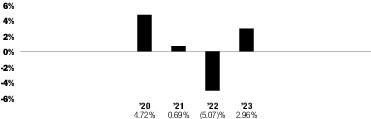
| | Period Ended | Returns |
| Year-to-date | September 30, 2024 | 2.17% |
| Best Quarter | December 31, 2023 | 2.73% |
| Worst Quarter | March 31, 2022 | -4.28% |
| | Inception Date | 1 Year | Since Inception |
| Return Before Taxes | 9/25/2019 | 2.96 % | 0.86 % |
| Return After Taxes on Distributions | | 2.96 | 0.64 |
| Return After Taxes on Distributions and Sale of Fund Shares | | 2.67 | 0.76 |
| | |||
| Invesco BulletShares® Municipal Bond 2025 Index (reflects no deduction for fees, expenses or taxes) | | 3.12 | 1.17 |
| | |||
| Bloomberg Municipal Bond Index (reflects no deduction for fees, expenses or taxes) | | 6.40 | 1.09 |
| | |||
After-tax returns in the above table are calculated using the historical highest individual federal marginal income tax rates and do not reflect the impact of state and local taxes. Actual after-tax returns depend on an investor's tax situation and may differ from those shown, and after-tax returns shown are not relevant to investors who hold Shares through tax-advantaged arrangements, such as 401(k) plans or individual retirement accounts.
The bar chart below shows how the Fund has performed. The table below the bar chart shows the Fund’s average annual total returns (before and after taxes). The bar chart and table provide an indication of the risks of investing in the Fund by showing how the Fund’s total returns have varied from year to year and by showing how the Fund’s average annual total returns compared with a broad measure of market performance and additional indices with characteristics relevant to the Fund. The Fund's performance reflects fee waivers, if any, absent which performance would have been lower. Although the information shown in the bar chart and the table gives you some idea of the risks involved in investing in the Fund, the Fund’s past performance (before and after taxes) is not necessarily indicative of how the Fund will perform in the future.
The Fund is the successor to the investment performance of the Guggenheim BulletShares 2026 Corporate Bond ETF (the “Predecessor Fund”) as a result of the reorganization of the Predecessor Fund into the Fund, which was consummated after the close of business on April 6, 2018. Accordingly, the performance information shown below for periods ending on or prior to April 6, 2018 is that of the Predecessor Fund.
Updated performance information is available online at www.invesco.com/ETFs.
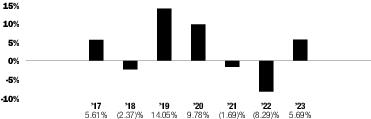
| | Period Ended | Returns |
| Year-to-date | September 30, 2024 | 4.56% |
| Best Quarter | June 30, 2020 | 9.59% |
| Worst Quarter | March 31, 2022 | -5.13% |
| | Inception Date | 1 Year | 5 Years | Since Inception |
| Return Before Taxes | 9/14/2016 | 5.69 % | 3.60 % | 2.45 % |
| Return After Taxes on Distributions | | 4.15 | 2.44 | 1.26 |
| Return After Taxes on Distributions and Sale of Fund Shares | | 3.34 | 2.28 | 1.36 |
| | ||||
| Invesco BulletShares® USD Corporate Bond 2026 Index (reflects no deduction for fees, expenses or taxes) | | 5.85 | 3.71 | 2.53 |
| | ||||
| Bloomberg U.S. Aggregate Bond Index (reflects no deduction for fees, expenses or taxes)1 | | 5.53 | 1.10 | 0.89 |
| | ||||
| Bloomberg U.S. Corporate Index (reflects no deduction for fees, expenses or taxes)1 | | 8.52 | 2.63 | 2.05 |
| | ||||
1
Effective August 31, 2024, the Fund changed its broad-based securities market benchmark from the Bloomberg U.S. Corporate Index to the Bloomberg U.S. Aggregate Bond Index to reflect that the Bloomberg U.S. Aggregate Bond Index can be considered more broadly representative of the overall applicable securities market.
After-tax returns in the above table are calculated using the historical highest individual federal marginal income tax rates and do not reflect the impact of state and local taxes. Actual after-tax returns depend on an investor's tax situation and may differ from those shown, and after-tax returns shown are not relevant to investors who hold Shares through tax-advantaged arrangements, such as 401(k) plans or individual retirement accounts.
The bar chart below shows how the Fund has performed. The table below the bar chart shows the Fund’s average annual total returns (before and after taxes). The bar chart and table provide an indication of the risks of investing in the Fund by showing how the Fund’s total returns have varied from year to year and by showing how the Fund’s average annual total
returns compared with a broad measure of market performance and additional indices with characteristics relevant to the Fund. The Fund's performance reflects fee waivers, if any, absent which performance would have been lower. Although the information shown in the bar chart and the table gives you some idea of the risks involved in investing in the Fund, the Fund’s past performance (before and after taxes) is not necessarily indicative of how the Fund will perform in the future.
Updated performance information is available online at www.invesco.com/ETFs.
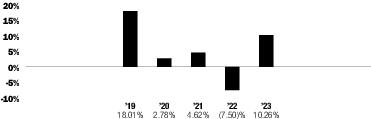
| | Period Ended | Returns |
| Year-to-date | September 30, 2024 | 6.31% |
| Best Quarter | March 31, 2019 | 8.82% |
| Worst Quarter | March 31, 2020 | -13.61% |
| | Inception Date | 1 Year | 5 Years | Since Inception |
| Return Before Taxes | 8/9/2018 | 10.26 % | 5.29 % | 4.08 % |
| Return After Taxes on Distributions | | 7.29 | 3.00 | 1.80 |
| Return After Taxes on Distributions and Sale of Fund Shares | | 5.98 | 3.08 | 2.13 |
| | ||||
| Invesco BulletShares® USD High Yield Corporate Bond 2026 Index (reflects no deduction for fees, expenses or taxes) | | 10.88 | 6.09 | 4.86 |
| | ||||
| Bloomberg U.S. Aggregate Bond Index (reflects no deduction for fees, expenses or taxes)1 | | 5.53 | 1.10 | 1.29 |
| | ||||
| Bloomberg U.S. Corporate High Yield Index (reflects no deduction for fees, expenses or taxes)1 | | 13.44 | 5.37 | 4.24 |
| | ||||
1
Effective August 31, 2024, the Fund changed its broad-based securities market benchmark from the Bloomberg U.S. Corporate High Yield Index to the Bloomberg U.S. Aggregate Bond Index to reflect that the Bloomberg U.S. Aggregate Bond Index can be considered more broadly representative of the overall applicable securities market.
After-tax returns in the above table are calculated using the historical highest individual federal marginal income tax rates and do not reflect the impact of state and local taxes. Actual after-tax returns depend on an investor's tax situation and may differ from those shown, and after-tax returns shown are not relevant to investors who hold Shares through tax-advantaged arrangements, such as 401(k) plans or individual retirement accounts.
The bar chart below shows how the Fund has performed. The table below the bar chart shows the Fund’s average annual total returns (before and after taxes). The bar chart and table provide an indication of the risks of investing in the Fund by showing how the Fund’s total returns have varied from year to year and by showing how the Fund’s average annual total returns compared with a broad measure of market performance and an additional index with characteristics relevant to the Fund. The Fund's performance reflects fee waivers, if any, absent which performance would have been lower. Although the information shown in the bar chart and the table gives you some idea of the risks involved in investing in the Fund, the Fund’s past performance (before and after taxes) is not necessarily indicative of how the Fund will perform in the future.
Updated performance information is available online at www.invesco.com/ETFs.
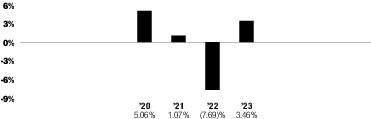
| | Period Ended | Returns |
| Year-to-date | September 30, 2024 | 2.30% |
| Best Quarter | December 31, 2023 | 3.85% |
| Worst Quarter | March 31, 2022 | -5.67% |
| | Inception Date | 1 Year | Since Inception |
| Return Before Taxes | 9/25/2019 | 3.46 % | 0.42 % |
| Return After Taxes on Distributions | | 3.44 | 0.11 |
| Return After Taxes on Distributions and Sale of Fund Shares | | 3.07 | 0.42 |
| | |||
| Invesco BulletShares® Municipal Bond 2026 Index (reflects no deduction for fees, expenses or taxes) | | 3.65 | 0.93 |
| | |||
| Bloomberg Municipal Bond Index (reflects no deduction for fees, expenses or taxes) | | 6.40 | 1.09 |
| | |||
After-tax returns in the above table are calculated using the historical highest individual federal marginal income tax rates and do not reflect the impact of state and local taxes. Actual after-tax returns depend on an investor's tax situation and may differ from those shown, and after-tax returns shown are not relevant to investors who hold Shares through tax-advantaged arrangements, such as 401(k) plans or individual retirement accounts.
The bar chart below shows how the Fund has performed. The table below the bar chart shows the Fund’s average annual total returns (before and after taxes). The bar chart and table provide an indication of the risks of investing in the Fund by showing how the Fund’s total returns have varied from year to year and by showing how the Fund’s average annual total returns compared with a broad measure of market performance and additional indices with characteristics relevant to the Fund. The Fund's performance reflects fee waivers, if any, absent which performance would have been lower. Although the information shown in the bar chart and the table gives you some idea of the risks involved in investing in the Fund, the Fund’s past performance (before and after taxes) is not necessarily indicative of how the Fund will perform in the future.
The Fund is the successor to the investment performance of the Guggenheim BulletShares 2027 Corporate Bond ETF (the “Predecessor Fund”) as a result of the reorganization of the Predecessor Fund into the Fund, which was consummated after the close of business on April 6, 2018. Accordingly, the performance information shown below for periods ending on or prior to April 6, 2018 is that of the Predecessor Fund.
Updated performance information is available online at www.invesco.com/ETFs.
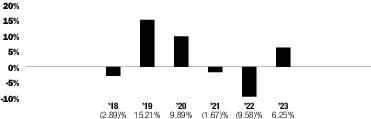
| | Period Ended | Returns |
| Year-to-date | September 30, 2024 | 4.92% |
| Best Quarter | June 30, 2020 | 10.92% |
| Worst Quarter | March 31, 2022 | -5.59% |
| | Inception Date | 1 Year | 5 Years | Since Inception |
| Return Before Taxes | 9/27/2017 | 6.25 % | 3.64 % | 2.55 % |
| Return After Taxes on Distributions | | 4.61 | 2.42 | 1.30 |
| Return After Taxes on Distributions and Sale of Fund Shares | | 3.66 | 2.29 | 1.42 |
| | ||||
| Invesco BulletShares® USD Corporate Bond 2027 Index (reflects no deduction for fees, expenses or taxes) | | 6.42 | 3.75 | 2.71 |
| | ||||
| Bloomberg U.S. Aggregate Bond Index (reflects no deduction for fees, expenses or taxes)1 | | 5.53 | 1.10 | 0.96 |
| | ||||
| Bloomberg U.S. Corporate Index (reflects no deduction for fees, expenses or taxes)1 | | 8.52 | 2.63 | 1.91 |
| | ||||
1
Effective August 31, 2024, the Fund changed its broad-based securities market benchmark from the Bloomberg U.S. Corporate Index to the Bloomberg U.S. Aggregate Bond Index to reflect that the Bloomberg U.S. Aggregate Bond Index can be considered more broadly representative of the overall applicable securities market.
After-tax returns in the above table are calculated using the historical highest individual federal marginal income tax rates and do not reflect the impact of state and local taxes. Actual after-tax returns depend on an investor's tax situation and may differ from those shown, and after-tax returns shown are not relevant to investors who hold Shares through tax-advantaged arrangements, such as 401(k) plans or individual retirement accounts.
The bar chart below shows how the Fund has performed. The table below the bar chart shows the Fund’s average annual total returns (before and after taxes). The bar chart and table provide an indication of the risks of investing in the Fund by showing how the Fund’s total returns have varied from year to year and by showing how the Fund’s average annual total
returns compared with a broad measure of market performance and additional indices with characteristics relevant to the Fund. The Fund's performance reflects fee waivers, if any, absent which performance would have been lower. Although the information shown in the bar chart and the table gives you some idea of the risks involved in investing in the Fund, the Fund’s past performance (before and after taxes) is not necessarily indicative of how the Fund will perform in the future.
Updated performance information is available online at www.invesco.com/ETFs.
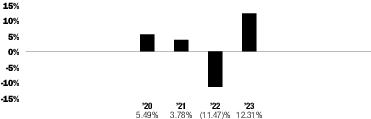
| | Period Ended | Returns |
| Year-to-date | September 30, 2024 | 6.44% |
| Best Quarter | December 31, 2023 | 6.40% |
| Worst Quarter | March 31, 2020 | -11.78% |
| | Inception Date | 1 Year | Since Inception |
| Return Before Taxes | 9/12/2019 | 12.31 % | 2.72 % |
| Return After Taxes on Distributions | | 9.29 | 0.56 |
| Return After Taxes on Distributions and Sale of Fund Shares | | 7.17 | 1.14 |
| | |||
| Invesco BulletShares® USD High Yield Corporate Bond 2027 Index (reflects no deduction for fees, expenses or taxes) | | 12.79 | 3.54 |
| | |||
| Bloomberg U.S. Aggregate Bond Index (reflects no deduction for fees, expenses or taxes)1 | | 5.53 | -0.45 |
| | |||
| Bloomberg U.S. Corporate High Yield Index (reflects no deduction for fees, expenses or taxes)1 | | 13.44 | 3.60 |
| | |||
1
Effective August 31, 2024, the Fund changed its broad-based securities market benchmark from the Bloomberg U.S. Corporate High Yield Index to the Bloomberg U.S. Aggregate Bond Index to reflect that the Bloomberg U.S. Aggregate Bond Index can be considered more broadly representative of the overall applicable securities market.
After-tax returns in the above table are calculated using the historical highest individual federal marginal income tax rates and do not reflect the impact of state and local taxes. Actual after-tax returns depend on an investor's tax situation and may differ from those shown, and after-tax returns shown are not relevant to investors who hold Shares through tax-advantaged arrangements, such as 401(k) plans or individual retirement accounts.
The bar chart below shows how the Fund has performed. The table below the bar chart shows the Fund’s average annual total returns (before and after taxes). The bar chart and table provide an indication of the risks of investing in the Fund by showing how the Fund’s total returns have varied from year to year and by showing how the Fund’s average annual total returns compared with a broad measure of market performance and an additional index with characteristics relevant to the Fund. The Fund's performance reflects fee waivers, if any, absent which performance would have been lower. Although the information shown in the bar chart and the table gives you some idea of the risks involved in investing in the Fund, the Fund’s past performance (before and after taxes) is not necessarily indicative of how the Fund will perform in the future.
Updated performance information is available online at www.invesco.com/ETFs.
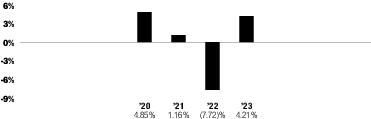
| | Period Ended | Returns |
| Year-to-date | September 30, 2024 | 2.05% |
| Best Quarter | December 31, 2023 | 4.90% |
| Worst Quarter | March 31, 2022 | -6.08% |
| | Inception Date | 1 Year | Since Inception |
| Return Before Taxes | 9/25/2019 | 4.21 % | 0.51 % |
| Return After Taxes on Distributions | | 4.21 | 0.23 |
| Return After Taxes on Distributions and Sale of Fund Shares | | 3.64 | 0.50 |
| | |||
| Invesco BulletShares® Municipal Bond 2027 Index (reflects no deduction for fees, expenses or taxes) | | 4.34 | 0.90 |
| | |||
| Bloomberg Municipal Bond Index (reflects no deduction for fees, expenses or taxes) | | 6.40 | 1.09 |
| | |||
After-tax returns in the above table are calculated using the historical highest individual federal marginal income tax rates and do not reflect the impact of state and local taxes. Actual after-tax returns depend on an investor's tax situation and may differ from those shown, and after-tax returns shown are not relevant to investors who hold Shares through tax-advantaged arrangements, such as 401(k) plans or individual retirement accounts.
The bar chart below shows how the Fund has performed. The table below the bar chart shows the Fund’s average annual total returns (before and after taxes). The bar chart and table provide an indication of the risks of investing in the Fund by showing how the Fund’s total returns have varied from year to year and by showing how the Fund’s average annual total returns compared with a broad measure of market performance and additional indices with characteristics relevant to the Fund. The Fund's performance reflects fee waivers, if any, absent which performance would have been lower. Although the information shown in the bar chart and the table gives you some idea of the risks involved in investing in the Fund, the Fund’s past performance (before and after taxes) is not necessarily indicative of how the Fund will perform in the future.
Updated performance information is available online at www.invesco.com/ETFs.
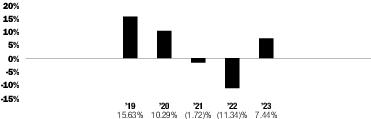
| | Period Ended | Returns |
| Year-to-date | September 30, 2024 | 5.10% |
| Best Quarter | June 30, 2020 | 11.63% |
| Worst Quarter | March 31, 2022 | -6.52% |
| | Inception Date | 1 Year | 5 Years | Since Inception |
| Return Before Taxes | 8/9/2018 | 7.44 % | 3.61 % | 3.29 % |
| Return After Taxes on Distributions | | 5.70 | 2.36 | 2.03 |
| Return After Taxes on Distributions and Sale of Fund Shares | | 4.36 | 2.25 | 1.99 |
| | ||||
| Invesco BulletShares® USD Corporate Bond 2028 Index (reflects no deduction for fees, expenses or taxes) | | 7.59 | 3.74 | 3.47 |
| | ||||
| Bloomberg U.S. Aggregate Bond Index (reflects no deduction for fees, expenses or taxes)1 | | 5.53 | 1.10 | 1.29 |
| | ||||
| Bloomberg U.S. Corporate Index (reflects no deduction for fees, expenses or taxes)1 | | 8.52 | 2.63 | 2.41 |
| | ||||
1
Effective August 31, 2024, the Fund changed its broad-based securities market benchmark from the Bloomberg U.S. Corporate Index to the Bloomberg U.S. Aggregate Bond Index to reflect that the Bloomberg U.S. Aggregate Bond Index can be considered more broadly representative of the overall applicable securities market.
After-tax returns in the above table are calculated using the historical highest individual federal marginal income tax rates and do not reflect the impact of state and local taxes. Actual after-tax returns depend on an investor's tax situation and may differ from those shown, and after-tax returns shown are not relevant to investors who hold Shares through tax-advantaged arrangements, such as 401(k) plans or individual retirement accounts.
The bar chart below shows how the Fund has performed. The table below the bar chart shows the Fund’s average annual total returns (before and after taxes). The bar chart and table provide an indication of the risks of investing in the Fund by showing how the Fund’s total returns have varied from year to year and by showing how the Fund’s average annual total
returns compared with a broad measure of market performance and additional indices with characteristics relevant to the Fund. The Fund's performance reflects fee waivers, if any, absent which performance would have been lower. Although the information shown in the bar chart and the table gives you some idea of the risks involved in investing in the Fund, the Fund’s past performance (before and after taxes) is not necessarily indicative of how the Fund will perform in the future.
Updated performance information is available online at www.invesco.com/ETFs.
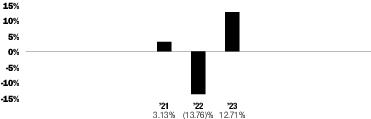
| | Period Ended | Returns |
| Year-to-date | September 30, 2024 | 7.01% |
| Best Quarter | December 31, 2023 | 7.11% |
| Worst Quarter | June 30, 2022 | -11.10% |
| | Inception Date | 1 Year | Since Inception |
| Return Before Taxes | 9/16/2020 | 12.71 % | 1.29 % |
| Return After Taxes on Distributions | | 9.55 | -0.96 |
| Return After Taxes on Distributions and Sale of Fund Shares | | 7.40 | 0.02 |
| | |||
| Invesco BulletShares® USD High Yield Corporate Bond 2028 Index (reflects no deduction for fees, expenses or taxes) | | 13.18 | 1.77 |
| | |||
| Bloomberg U.S. Aggregate Bond Index (reflects no deduction for fees, expenses or taxes)1 | | 5.53 | -2.89 |
| | |||
| Bloomberg U.S. Corporate High Yield Index (reflects no deduction for fees, expenses or taxes)1 | | 13.44 | 3.47 |
| | |||
1
Effective August 31, 2024, the Fund changed its broad-based securities market benchmark from the Bloomberg U.S. Corporate High Yield Index to the Bloomberg U.S. Aggregate Bond Index to reflect that the Bloomberg U.S. Aggregate Bond Index can be considered more broadly representative of the overall applicable securities market.
After-tax returns in the above table are calculated using the historical highest individual federal marginal income tax rates and do not reflect the impact of state and local taxes. Actual after-tax returns depend on an investor's tax situation and may differ from those shown, and after-tax returns shown are not relevant to investors who hold Shares through tax-advantaged arrangements, such as 401(k) plans or individual retirement accounts.
The bar chart below shows how the Fund has performed. The table below the bar chart shows the Fund’s average annual total returns (before and after taxes). The bar chart and table provide an indication of the risks of investing in the Fund by showing how the Fund’s total returns have varied from year to year and by showing how the Fund’s average annual total returns compared with a broad measure of market performance and an additional index with characteristics relevant to the Fund. The Fund's performance reflects fee waivers, if any, absent which performance would have been lower. Although the information shown in the bar chart and the table gives you some idea of the risks involved in investing in the Fund, the Fund’s past performance (before and after taxes) is not necessarily indicative of how the Fund will perform in the future.
Updated performance information is available online at www.invesco.com/ETFs.
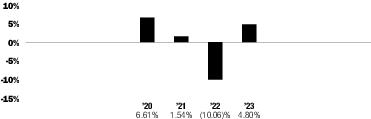
| | Period Ended | Returns |
| Year-to-date | September 30, 2024 | 1.82% |
| Best Quarter | December 31, 2023 | 5.78% |
| Worst Quarter | March 31, 2022 | -7.08% |
| | Inception Date | 1 Year | Since Inception |
| Return Before Taxes | 9/25/2019 | 4.80 % | 0.53 % |
| Return After Taxes on Distributions | | 4.80 | 0.20 |
| Return After Taxes on Distributions and Sale of Fund Shares | | 3.93 | 0.52 |
| | |||
| Invesco BulletShares® Municipal Bond 2028 Index (reflects no deduction for fees, expenses or taxes) | | 5.10 | 0.83 |
| | |||
| Bloomberg Municipal Bond Index (reflects no deduction for fees, expenses or taxes) | | 6.40 | 1.09 |
| | |||
After-tax returns in the above table are calculated using the historical highest individual federal marginal income tax rates and do not reflect the impact of state and local taxes. Actual after-tax returns depend on an investor's tax situation and may differ from those shown, and after-tax returns shown are not relevant to investors who hold Shares through tax-advantaged arrangements, such as 401(k) plans or individual retirement accounts.
The bar chart below shows how the Fund has performed. The table below the bar chart shows the Fund’s average annual total returns (before and after taxes). The bar chart and table provide an indication of the risks of investing in the Fund by showing how the Fund’s total returns have varied from year to year and by showing how the Fund’s average annual total returns compared with a broad measure of market performance and additional indices with characteristics relevant to the Fund. The Fund's performance reflects fee waivers, if any, absent which performance would have been lower. Although the information shown in the bar chart and the table gives you some idea of the risks involved in investing in the Fund, the Fund’s past performance (before and after taxes) is not necessarily indicative of how the Fund will perform in the future.
Updated performance information is available online at www.invesco.com/ETFs.
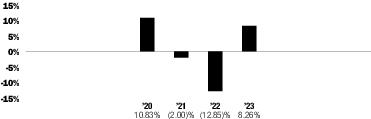
| | Period Ended | Returns |
| Year-to-date | September 30, 2024 | 5.17% |
| Best Quarter | June 30, 2020 | 11.29% |
| Worst Quarter | March 31, 2022 | -6.48% |
| | Inception Date | 1 Year | Since Inception |
| Return Before Taxes | 9/12/2019 | 8.26 % | 1.06 % |
| Return After Taxes on Distributions | | 6.50 | -0.06 |
| Return After Taxes on Distributions and Sale of Fund Shares | | 4.83 | 0.34 |
| | |||
| Invesco BulletShares® USD Corporate Bond 2029 Index (reflects no deduction for fees, expenses or taxes) | | 8.44 | 1.20 |
| | |||
| Bloomberg U.S. Aggregate Bond Index (reflects no deduction for fees, expenses or taxes)1 | | 5.53 | -0.45 |
| | |||
| Bloomberg U.S. Corporate Index (reflects no deduction for fees, expenses or taxes)1 | | 8.52 | 0.40 |
| | |||
1
Effective August 31, 2024, the Fund changed its broad-based securities market benchmark from the Bloomberg U.S. Corporate Index to the Bloomberg U.S. Aggregate Bond Index to reflect that the Bloomberg U.S. Aggregate Bond Index can be considered more broadly representative of the overall applicable securities market.
After-tax returns in the above table are calculated using the historical highest individual federal marginal income tax rates and do not reflect the impact of state and local taxes. Actual after-tax returns depend on an investor's tax situation and may differ from those shown, and after-tax returns shown are not relevant to investors who hold Shares through tax-advantaged arrangements, such as 401(k) plans or individual retirement accounts.
The bar chart below shows how the Fund has performed. The table below the bar chart shows the Fund’s average annual total returns (before and after taxes). The bar chart and table provide an indication of the risks of investing in the Fund by showing how the Fund’s total returns have varied from year to year and by showing how the Fund’s average annual total
returns compared with a broad measure of market performance and additional indices with characteristics relevant to the Fund. The Fund's performance reflects fee waivers, if any, absent which performance would have been lower. Although the information shown in the bar chart and the table gives you some idea of the risks involved in investing in the Fund, the Fund’s past performance (before and after taxes) is not necessarily indicative of how the Fund will perform in the future.
Updated performance information is available online at www.invesco.com/ETFs.
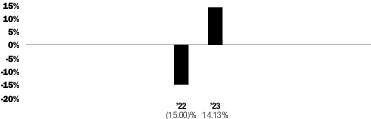
| | Period Ended | Returns |
| Year-to-date | September 30, 2024 | 7.54% |
| Best Quarter | December 31, 2023 | 8.43% |
| Worst Quarter | June 30, 2022 | -11.83% |
| | Inception Date | 1 Year | Since Inception |
| Return Before Taxes | 9/15/2021 | 14.13 % | -1.54 % |
| Return After Taxes on Distributions | | 11.05 | -3.81 |
| Return After Taxes on Distributions and Sale of Fund Shares | | 8.23 | -2.16 |
| | |||
| Invesco BulletShares® USD High Yield Corporate Bond 2029 Index (reflects no deduction for fees, expenses or taxes) | | 14.78 | -1.20 |
| | |||
| Bloomberg U.S. Aggregate Bond Index (reflects no deduction for fees, expenses or taxes)1 | | 5.53 | -4.13 |
| | |||
| Bloomberg U.S. Corporate High Yield Index (reflects no deduction for fees, expenses or taxes)1 | | 13.44 | 0.43 |
| | |||
1
Effective August 31, 2024, the Fund changed its broad-based securities market benchmark from the Bloomberg U.S. Corporate High Yield Index to the Bloomberg U.S. Aggregate Bond Index to reflect that the Bloomberg U.S. Aggregate Bond Index can be considered more broadly representative of the overall applicable securities market.
After-tax returns in the above table are calculated using the historical highest individual federal marginal income tax rates and do not reflect the impact of state and local taxes. Actual after-tax returns depend on an investor's tax situation and may differ from those shown, and after-tax returns shown are not relevant to investors who hold Shares through tax-advantaged arrangements, such as 401(k) plans or individual retirement accounts.
The bar chart below shows how the Fund has performed. The table below the bar chart shows the Fund’s average annual total returns (before and after taxes). The bar chart and table provide an indication of the risks of investing in the Fund by showing how the Fund’s total returns have varied from year to year and by showing how the Fund’s average annual total returns compared with a broad measure of market performance and an additional index with characteristics relevant to the Fund. The Fund's performance reflects fee waivers, if any, absent which performance would have been lower. Although the information shown in the bar chart and the table gives you some idea of the risks involved in investing in the Fund, the Fund’s past performance (before and after taxes) is not necessarily indicative of how the Fund will perform in the future.
Updated performance information is available online at www.invesco.com/ETFs.
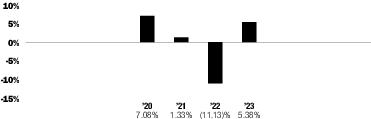
| | Period Ended | Returns |
| Year-to-date | September 30, 2024 | 1.63% |
| Best Quarter | December 31, 2023 | 6.94% |
| Worst Quarter | March 31, 2022 | -7.81% |
| | Inception Date | 1 Year | Since Inception |
| Return Before Taxes | 9/25/2019 | 5.38 % | 0.36 % |
| Return After Taxes on Distributions | | 5.37 | 0.03 |
| Return After Taxes on Distributions and Sale of Fund Shares | | 4.29 | 0.38 |
| | |||
| Invesco BulletShares® Municipal Bond 2029 Index (reflects no deduction for fees, expenses or taxes) | | 5.68 | 0.46 |
| | |||
| Bloomberg Municipal Bond Index (reflects no deduction for fees, expenses or taxes) | | 6.40 | 1.09 |
| | |||
After-tax returns in the above table are calculated using the historical highest individual federal marginal income tax rates and do not reflect the impact of state and local taxes. Actual after-tax returns depend on an investor's tax situation and may differ from those shown, and after-tax returns shown are not relevant to investors who hold Shares through tax-advantaged arrangements, such as 401(k) plans or individual retirement accounts.
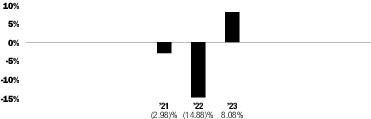
The bar chart below shows how the Fund has performed. The table below the bar chart shows the Fund’s average annual total returns (before and after taxes). The bar chart and table provide an indication of the risks of investing in the Fund by showing how the Fund’s total returns have varied from year to year and by showing how the Fund’s average annual total returns compared with a broad measure of market performance and additional indices with characteristics relevant to the Fund. The Fund's performance reflects fee waivers, if any, absent which performance would have been lower. Although the information shown in the bar chart and the table gives you some idea of the risks involved in investing in the Fund, the Fund’s past performance (before and after taxes) is not necessarily indicative of how the Fund will perform in the future.
Updated performance information is available online at www.invesco.com/ETFs.
| | Period Ended | Returns |
| Year-to-date | September 30, 2024 | 5.70% |
| Best Quarter | December 31, 2023 | 7.54% |
| Worst Quarter | March 31, 2022 | -7.43% |
| | Inception Date | 1 Year | Since Inception |
| Return Before Taxes | 9/16/2020 | 8.08 % | -2.76 % |
| Return After Taxes on Distributions | | 6.24 | -3.88 |
| Return After Taxes on Distributions and Sale of Fund Shares | | 4.73 | -2.55 |
| | |||
| Invesco BulletShares® USD Corporate Bond 2030 Index (reflects no deduction for fees, expenses or taxes) | | 8.23 | -2.71 |
| | |||
| Bloomberg U.S. Aggregate Bond Index (reflects no deduction for fees, expenses or taxes)1 | | 5.53 | -2.89 |
| | |||
| Bloomberg U.S. Corporate Index (reflects no deduction for fees, expenses or taxes)1 | | 8.52 | -2.31 |
| | |||
1
Effective August 31, 2024, the Fund changed its broad-based securities market benchmark from the Bloomberg U.S. Corporate Index to the Bloomberg U.S. Aggregate Bond Index to reflect that the Bloomberg U.S. Aggregate Bond Index can be considered more broadly representative of the overall applicable securities market.
After-tax returns in the above table are calculated using the historical highest individual federal marginal income tax rates and do not reflect the impact of state and local taxes. Actual after-tax returns depend on an investor's tax situation and may differ from those shown, and after-tax returns shown are not relevant to investors who hold Shares through tax-advantaged arrangements, such as 401(k) plans or individual retirement accounts.
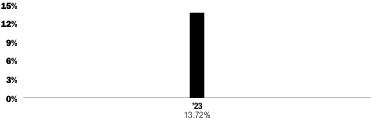
The bar chart below shows how the Fund has performed. The table below the bar chart shows the Fund’s average annual total returns (before and after taxes). The bar chart and table provide an indication of the risks of investing in the Fund by showing how the Fund’s average annual total returns compared with a broad measure of market performance and additional indices with characteristics relevant to the Fund. The Fund's performance reflects fee waivers, if any, absent which performance would have been lower. Although the information shown in the bar chart and the table gives you some idea of the risks involved in investing in the Fund, the Fund’s past performance (before and after taxes) is not necessarily indicative of how the Fund will perform in the future.
Updated performance information is available online at www.invesco.com/ETFs.
| | Period Ended | Returns |
| Year-to-date | September 30, 2024 | 8.58% |
| Best Quarter | December 31, 2023 | 8.25% |
| Worst Quarter | September 30, 2023 | -0.79% |
| | Inception Date | 1 Year | Since Inception |
| Return Before Taxes | 9/8/2022 | 13.72 % | 8.65 % |
| Return After Taxes on Distributions | | 10.52 | 5.53 |
| Return After Taxes on Distributions and Sale of Fund Shares | | 7.98 | 5.19 |
| | |||
| Invesco BulletShares® USD High Yield Corporate Bond 2030 Index (reflects no deduction for fees, expenses or taxes) | | 14.55 | 9.28 |
| | |||
| Bloomberg U.S. Aggregate Bond Index (reflects no deduction for fees, expenses or taxes) | | 5.53 | 2.84 |
| | |||
After-tax returns in the above table are calculated using the historical highest individual federal marginal income tax rates and do not reflect the impact of state and local taxes. Actual after-tax returns depend on an investor's tax situation and may differ from those shown, and after-tax returns shown are not relevant to investors who hold Shares through tax-advantaged arrangements, such as 401(k) plans or individual retirement accounts.
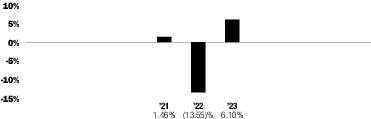
The bar chart below shows how the Fund has performed. The table below the bar chart shows the Fund’s average annual total returns (before and after taxes). The bar chart and table provide an indication of the risks of investing in the Fund by showing how the Fund’s total returns have varied from year to year and by showing how the Fund’s average annual total returns compared with a broad measure of market performance and an additional index with characteristics relevant to the Fund. The Fund's performance reflects fee waivers, if any, absent which performance would have been lower. Although the information shown in the bar chart and the table gives you some idea of the risks involved in investing in the Fund, the Fund’s past performance (before and after taxes) is not necessarily indicative of how the Fund will perform in the future.
Updated performance information is available online at www.invesco.com/ETFs.
| | Period Ended | Returns |
| Year-to-date | September 30, 2024 | 1.36% |
| Best Quarter | December 31, 2023 | 8.08% |
| Worst Quarter | March 31, 2022 | -9.17% |
| | Inception Date | 1 Year | Since Inception |
| Return Before Taxes | 9/16/2020 | 6.10 % | -1.31 % |
| Return After Taxes on Distributions | | 6.09 | -1.77 |
| Return After Taxes on Distributions and Sale of Fund Shares | | 4.73 | -0.98 |
| | |||
| Invesco BulletShares® Municipal Bond 2030 Index (reflects no deduction for fees, expenses or taxes) | | 6.45 | -1.07 |
| | |||
| Bloomberg Municipal Bond Index (reflects no deduction for fees, expenses or taxes) | | 6.40 | 0.18 |
| | |||
After-tax returns in the above table are calculated using the historical highest individual federal marginal income tax rates and do not reflect the impact of state and local taxes. Actual after-tax returns depend on an investor's tax situation and may differ from those shown, and after-tax returns shown are not relevant to investors who hold Shares through tax-advantaged arrangements, such as 401(k) plans or individual retirement accounts.
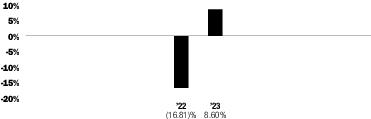
The bar chart below shows how the Fund has performed. The table below the bar chart shows the Fund’s average annual total returns (before and after taxes). The bar chart and table provide an indication of the risks of investing in the Fund by showing how the Fund’s total returns have varied from year to year and by showing how the Fund’s average annual total returns compared with a broad measure of market performance and additional indices with characteristics relevant to the Fund. The Fund's performance reflects fee waivers, if any, absent which performance would have been lower. Although the information shown in the bar chart and the table gives you some idea of the risks involved in investing in the Fund, the Fund’s past performance (before and after taxes) is not necessarily indicative of how the Fund will perform in the future.
Updated performance information is available online at www.invesco.com/ETFs.
| | Period Ended | Returns |
| Year-to-date | September 30, 2024 | 5.55% |
| Best Quarter | December 31, 2023 | 8.52% |
| Worst Quarter | March 31, 2022 | -8.14% |
| | Inception Date | 1 Year | Since Inception |
| Return Before Taxes | 9/15/2021 | 8.60 % | -4.98 % |
| Return After Taxes on Distributions | | 6.56 | -6.41 |
| Return After Taxes on Distributions and Sale of Fund Shares | | 5.02 | -4.37 |
| | |||
| Invesco BulletShares® USD Corporate Bond 2031 Index (reflects no deduction for fees, expenses or taxes) | | 8.74 | -4.87 |
| | |||
| Bloomberg U.S. Aggregate Bond Index (reflects no deduction for fees, expenses or taxes)1 | | 5.53 | -4.13 |
| | |||
| Bloomberg U.S. Corporate Index (reflects no deduction for fees, expenses or taxes)1 | | 8.52 | -4.39 |
| | |||
1
Effective August 31, 2024, the Fund changed its broad-based securities market benchmark from the Bloomberg U.S. Corporate Index to the Bloomberg U.S. Aggregate Bond Index to reflect that the Bloomberg U.S. Aggregate Bond Index can be considered more broadly representative of the overall applicable securities market.
After-tax returns in the above table are calculated using the historical highest individual federal marginal income tax rates and do not reflect the impact of state and local taxes. Actual after-tax returns depend on an investor's tax situation and may differ from those shown, and after-tax returns shown are not relevant to investors who hold Shares through tax-advantaged arrangements, such as 401(k) plans or individual retirement accounts.
No performance information is available for the Fund because it does not yet have a full calendar year of performance history. Once the Fund has a full calendar year of performance information, the Fund will present total return information, which is also accessible on the Fund's website at www.invesco.com/ETFs and provides some indication of the risks of investing in the Fund.
The bar chart below shows how the Fund has performed. The table below the bar chart shows the Fund’s average annual total returns (before and after taxes). The bar chart and table provide an indication of the risks of investing in the Fund by showing how the Fund’s total returns have varied from year to year and by showing how the Fund’s average annual total returns compared with a broad measure of market performance and an additional index with characteristics relevant to the Fund. The Fund's performance reflects fee waivers, if any, absent which performance would have been lower. Although the information shown in the bar chart and the table gives you some idea of the risks involved in investing in the Fund, the Fund’s past performance (before and after taxes) is not necessarily indicative of how the Fund will perform in the future.
Updated performance information is available online at www.invesco.com/ETFs.
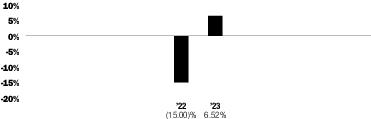
| | Period Ended | Returns |
| Year-to-date | September 30, 2024 | 1.39% |
| Best Quarter | December 31, 2023 | 8.78% |
| Worst Quarter | March 31, 2022 | -10.12% |
| | Inception Date | 1 Year | Since Inception |
| Return Before Taxes | 9/15/2021 | 6.52 % | -4.02 % |
| Return After Taxes on Distributions | | 6.52 | -4.45 |
| Return After Taxes on Distributions and Sale of Fund Shares | | 4.97 | -2.98 |
| | |||
| Invesco BulletShares® Municipal Bond 2031 Index (reflects no deduction for fees, expenses or taxes) | | 6.79 | -4.14 |
| | |||
| Bloomberg Municipal Bond Index (reflects no deduction for fees, expenses or taxes) | | 6.40 | -1.19 |
| | |||
After-tax returns in the above table are calculated using the historical highest individual federal marginal income tax rates and do not reflect the impact of state and local taxes. Actual after-tax returns depend on an investor's tax situation and may differ from those shown, and after-tax returns shown are not relevant to investors who hold Shares through tax-advantaged arrangements, such as 401(k) plans or individual retirement accounts.
The bar chart below shows how the Fund has performed. The table below the bar chart shows the Fund’s average annual total returns (before and after taxes). The bar chart and table provide an indication of the risks of investing in the Fund by showing how the Fund’s average annual total returns compared with a broad measure of market performance and additional indices with characteristics relevant to the Fund. The Fund's performance reflects fee waivers, if any, absent which performance would have been lower. Although the information shown in the bar chart and the table gives you some idea of the risks involved in investing in the Fund, the Fund’s past performance (before and after taxes) is not necessarily indicative of how the Fund will perform in the future.
Updated performance information is available online at www.invesco.com/ETFs.
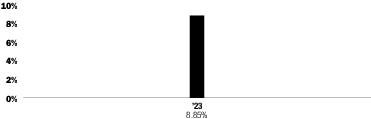
| | Period Ended | Returns |
| Year-to-date | September 30, 2024 | 5.40% |
| Best Quarter | December 31, 2023 | 8.98% |
| Worst Quarter | September 30, 2023 | -3.33% |
| | Inception Date | 1 Year | Since Inception |
| Return Before Taxes | 9/8/2022 | 8.85 % | 7.00 % |
| Return After Taxes on Distributions | | 6.67 | 4.99 |
| Return After Taxes on Distributions and Sale of Fund Shares | | 5.17 | 4.45 |
| | |||
| Invesco BulletShares® USD Corporate Bond 2032 Index (reflects no deduction for fees, expenses or taxes) | | 9.11 | 6.09 |
| | |||
| Bloomberg U.S. Aggregate Bond Index (reflects no deduction for fees, expenses or taxes)1 | | 5.53 | 2.84 |
| | |||
| Bloomberg U.S. Corporate Index (reflects no deduction for fees, expenses or taxes)1 | | 8.52 | 5.82 |
| | |||
1
Effective August 31, 2024, the Fund changed its broad-based securities market benchmark from the Bloomberg U.S. Corporate Index to the Bloomberg U.S. Aggregate Bond Index to reflect that the Bloomberg U.S. Aggregate Bond Index can be considered more broadly representative of the overall applicable securities market.
After-tax returns in the above table are calculated using the historical highest individual federal marginal income tax rates and do not reflect the impact of state and local taxes. Actual after-tax returns depend on an investor's tax situation and may differ from those shown, and after-tax returns shown are not relevant to investors who hold Shares through tax-advantaged arrangements, such as 401(k) plans or individual retirement accounts.
No performance information is available for the Fund because it does not yet have a full calendar year of performance history. Once the Fund has a full calendar year of performance information, the Fund will present total return information, which is also accessible on the Fund's website at www.invesco.com/ETFs and provides some indication of the risks of investing in the Fund.
No performance information is available for the Fund because it does not yet have a full calendar year of performance history. Once the Fund has a full calendar year of performance information, the Fund will present total return information, which is also accessible on the Fund's website at www.invesco.com/ETFs and provides some indication of the risks of investing in the Fund.
No performance information is available for the Fund because it does not yet have a full calendar year of performance history. Once the Fund has a full calendar year of performance information, the Fund will present total return information, which is also accessible on the Fund's website at www.invesco.com/ETFs and provides some indication of the risks of investing in the Fund.
No performance information is available for the Fund because it does not yet have a full calendar year of performance history. Once the Fund has a full calendar year of performance information, the Fund will present total return information, which is also accessible on the Fund's website at
www.invesco.com/ETFs and provides some indication of the risks of investing in the Fund.
No performance information is available for the Fund because it does not yet have a full calendar year of performance history. Once the Fund has a full calendar year of performance information, the Fund will present total return information, which is also accessible on the Fund's website at www.invesco.com/ETFs and provides some indication of the risks of investing in the Fund.
The bar chart below shows how the Fund has performed. The table below the bar chart shows the Fund’s average annual total returns (before and after taxes). The bar chart and table provide an indication of the risks of investing in the Fund by showing how the Fund’s total returns have varied from year to year and by showing how the Fund’s average annual total returns compared with a broad measure of market performance and additional indices with characteristics relevant to the Fund. The Fund's performance reflects fee waivers, if any, absent which performance would have been lower. Although the information shown in the bar chart and the table gives you some idea of the risks involved in investing in the Fund, the Fund’s past performance (before and after taxes) is not necessarily indicative of how the Fund will perform in the future.
Updated performance information is available online at www.invesco.com/ETFs.
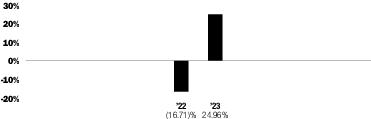
| | Period Ended | Returns |
| Year-to-date | September 30, 2024 | 5.21% |
| Best Quarter | December 31, 2022 | 16.64% |
| Worst Quarter | June 30, 2022 | -13.44% |
| | Inception Date | 1 Year | Since Inception |
| Return Before Taxes | 2/24/2021 | 24.96 % | 4.34 % |
| Return After Taxes on Distributions | | 23.53 | 3.17 |
| Return After Taxes on Distributions and Sale of Fund Shares | | 15.30 | 3.06 |
| | |||
| FTSE Developed ex US Invesco Dynamic Multifactor Index (Net) (reflects reinvested dividends net of withholding taxes, but reflects no deduction for fees, expenses or other taxes) | | 25.70 | 5.02 |
| | |||
| MSCI EAFE® Index (Net) (reflects reinvested dividends net of withholding taxes, but reflects no deduction for fees, expenses or other taxes)1 | | 18.24 | 3.03 |
| | |||
| FTSE Developed ex US Index (Net) (reflects reinvested dividends net of withholding taxes, but reflects no deduction for fees, expenses or other taxes)1 | | 18.06 | 2.64 |
| | |||
1
Effective August 31, 2024, the Fund changed its broad-based securities market benchmark from the FTSE Developed ex US Index (Net) to the MSCI EAFE® Index (Net) to reflect that the MSCI EAFE® Index (Net) can be considered more broadly representative of the overall applicable securities market.
After-tax returns in the above table are calculated using the historical highest individual federal marginal income tax rates and do not reflect the impact of state and local taxes. Actual after-tax returns depend on an investor's tax situation and may differ from those shown, and after-tax returns shown are not relevant to investors who hold Shares through tax-advantaged arrangements, such as 401(k) plans or individual retirement accounts.
The bar chart below shows how the Fund has performed. The table below the bar chart shows the Fund’s average annual total returns (before and after taxes). The bar chart and table provide an indication of the risks of investing in the Fund by showing how the Fund’s total returns have varied from year to year and by showing how the Fund’s average annual total returns compared with a broad measure of market performance and additional indices with characteristics relevant to the Fund. The Fund's performance reflects fee waivers, if any, absent which performance would have been lower. Although the information shown in the bar chart and the table gives you some idea of the risks involved in investing in the Fund, the Fund’s past performance (before and after taxes) is not necessarily indicative of how the Fund will perform in the future.
Updated performance information is available online at www.invesco.com/ETFs.
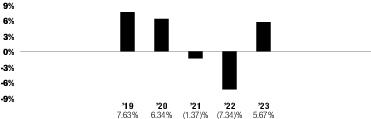
| | Period Ended | Returns |
| Year-to-date | September 30, 2024 | 5.24% |
| Best Quarter | June 30, 2020 | 5.34% |
| Worst Quarter | March 31, 2022 | -4.36% |
| | Inception Date | 1 Year | 5 Years | Since Inception |
| Return Before Taxes | 7/25/2018 | 5.67 % | 2.03 % | 2.12 % |
| Return After Taxes on Distributions | | 4.04 | 0.97 | 1.04 |
| Return After Taxes on Distributions and Sale of Fund Shares | | 3.32 | 1.13 | 1.19 |
| | ||||
| Invesco Investment Grade Defensive Index (reflects no deduction for fees, expenses or taxes) | | 5.88 | 2.22 | 2.32 |
| | ||||
| Bloomberg U.S. Aggregate Bond Index (reflects no deduction for fees, expenses or taxes)1 | | 5.53 | 1.10 | 1.31 |
| | ||||
| iBoxx USD Liquid Investment Grade Index (reflects no deduction for fees, expenses or taxes)1 | | 9.45 | 2.92 | 2.63 |
| | ||||
1
Effective August 31, 2024, the Fund changed its broad-based securities market benchmark from the iBoxx USD Liquid Investment Grade Index to the Bloomberg U.S. Aggregate Bond Index to reflect that the Bloomberg U.S. Aggregate Bond Index can be considered more broadly representative of the overall applicable securities market.
After-tax returns in the above table are calculated using the historical highest individual federal marginal income tax rates and do not reflect the impact of state and local taxes. Actual after-tax returns depend on an investor's tax situation and may differ from those shown, and after-tax returns shown are not relevant to investors who hold Shares through tax-advantaged arrangements, such as 401(k) plans or individual retirement accounts.
The bar chart below shows how the Fund has performed. The table below the bar chart shows the Fund’s average annual total returns (before and after taxes). The bar chart and table provide an indication of the risks of investing in the Fund by showing how the Fund’s total returns have varied from year to year and by showing how the Fund’s average annual total returns compared with a broad measure of market performance and additional indices with characteristics relevant to the Fund. The Fund's performance reflects fee waivers, if any, absent which performance would have been lower. Although the information shown in the bar chart and the table gives you some idea of the risks involved in investing in the Fund, the Fund’s past performance (before and after taxes) is not necessarily indicative of how the Fund will perform in the future.
Updated performance information is available online at www.invesco.com/ETFs.
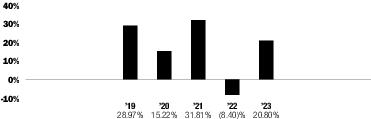
| | Period Ended | Returns |
| Year-to-date | September 30, 2024 | 17.54% |
| Best Quarter | June 30, 2020 | 19.53% |
| Worst Quarter | March 31, 2020 | -22.78% |
| | Inception Date | 1 Year | 5 Years | Since Inception |
| Return Before Taxes | 9/12/2018 | 20.80 % | 16.73 % | 12.93 % |
| Return After Taxes on Distributions | | 20.26 | 16.21 | 12.42 |
| Return After Taxes on Distributions and Sale of Fund Shares | | 12.63 | 13.44 | 10.27 |
| | ||||
| Invesco Strategic US Index (reflects no deduction for fees, expenses or taxes) | | 21.01 | 16.93 | 13.12 |
| | ||||
| Russell 3000® Index (reflects no deduction for fees, expenses or taxes)1 | | 25.96 | 15.16 | 11.10 |
| | ||||
| Russell 1000® Index (reflects no deduction for fees, expenses or taxes)1 | | 26.53 | 15.52 | 11.57 |
| | ||||
1
Effective August 31, 2024, the Fund changed its broad-based securities market benchmark from the Russell 1000® Index to the Russell 3000® Index to reflect that the Russell 3000® Index can be considered more broadly representative of the overall applicable securities market.
After-tax returns in the above table are calculated using the historical highest individual federal marginal income tax rates and do not reflect the impact of state and local taxes. Actual after-tax returns depend on an investor's tax situation and may differ from those shown, and after-tax returns shown are not relevant to investors who hold Shares through tax-advantaged arrangements, such as 401(k) plans or individual retirement accounts.
The bar chart below shows how the Fund has performed. The table below the bar chart shows the Fund’s average annual total returns (before and after taxes). The bar chart and table provide an indication of the risks of investing in the Fund by showing how the Fund’s total returns have varied from year to year and by showing how the Fund’s average annual total returns compared with a broad measure of market performance and additional indices with characteristics relevant to the Fund. The Fund's performance reflects fee waivers, if any, absent which performance would have been lower. Although the information shown in the bar chart and the table gives you some idea of the risks involved in investing in the Fund, the Fund’s past performance (before and after taxes) is not necessarily indicative of how the Fund will perform in the future.
The Fund is the successor to the investment performance of the Oppenheimer Russell 1000® Dynamic Multifactor ETF (the “Predecessor Fund”) as a result of the reorganization of the Predecessor Fund into the Fund, which was consummated after the close of business on May 24, 2019. Accordingly, the performance shown below for periods ending on or prior to May 24, 2019 is that of the Predecessor Fund.
Updated performance information is available online at www.invesco.com/ETFs.
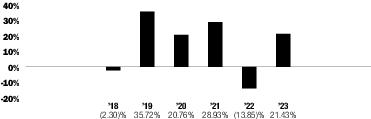
| | Period Ended | Returns |
| Year-to-date | September 30, 2024 | 4.28% |
| Best Quarter | December 31, 2020 | 29.16% |
| Worst Quarter | March 31, 2020 | -21.94% |
| | Inception Date | 1 Year | 5 Years | Since Inception |
| Return Before Taxes | 11/8/2017 | 21.43 % | 17.19 % | 14.15 % |
| Return After Taxes on Distributions | | 20.94 | 16.74 | 13.71 |
| Return After Taxes on Distributions and Sale of Fund Shares | | 12.89 | 13.83 | 11.39 |
| | ||||
| Russell 1000® Invesco Dynamic Multifactor Index (reflects no deduction for fees, expenses or taxes) | | 21.86 | 17.53 | 14.48 |
| | ||||
| Russell 3000® Index (reflects no deduction for fees, expenses or taxes)1 | | 25.96 | 15.16 | 11.82 |
| | ||||
| Russell 1000® Index (reflects no deduction for fees, expenses or taxes)1 | | 26.53 | 15.52 | 12.18 |
| | ||||
1
Effective August 31, 2024, the Fund changed its broad-based securities market benchmark from the Russell 1000® Index to the Russell 3000® Index to reflect that the Russell 3000® Index can be considered more broadly representative of the overall applicable securities market.
After-tax returns in the above table are calculated using the historical highest individual federal marginal income tax rates and do not reflect the impact of state and local taxes. Actual after-tax returns depend on an investor's tax situation and may differ from those shown, and after-tax returns shown are not relevant to investors who hold Shares through tax-advantaged arrangements, such as 401(k) plans or individual retirement accounts.
The bar chart below shows how the Fund has performed. The table below the bar chart shows the Fund’s average annual total returns (before and after taxes). The bar chart and table provide an indication of the risks of investing in the Fund by showing how the Fund’s total returns have varied from year to year and by showing how the Fund’s average annual total
returns compared with a broad measure of market performance and additional indices with characteristics relevant to the Fund. The Fund's performance reflects fee waivers, if any, absent which performance would have been lower. Although the information shown in the bar chart and the table gives you some idea of the risks involved in investing in the Fund, the Fund’s past performance (before and after taxes) is not necessarily indicative of how the Fund will perform in the future.
The Fund is the successor to the investment performance of the Oppenheimer Russell 2000® Dynamic Multifactor ETF (the “Predecessor Fund”) as a result of the reorganization of the Predecessor Fund into the Fund, which was consummated after the close of business on May 24, 2019. Accordingly, the performance shown below for periods ending on or prior to May 24, 2019 is that of the Predecessor Fund.
Updated performance information is available online at www.invesco.com/ETFs.
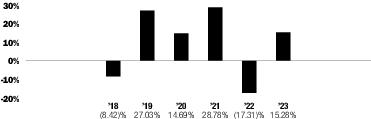
| | Period Ended | Returns |
| Year-to-date | September 30, 2024 | 3.22% |
| Best Quarter | December 31, 2020 | 38.82% |
| Worst Quarter | March 31, 2020 | -33.16% |
| | Inception Date | 1 Year | 5 Years | Since Inception |
| Return Before Taxes | 11/8/2017 | 15.28 % | 12.33 % | 8.92 % |
| Return After Taxes on Distributions | | 14.83 | 11.92 | 8.52 |
| Return After Taxes on Distributions and Sale of Fund Shares | | 9.20 | 9.75 | 7.00 |
| | ||||
| Russell 2000® Invesco Dynamic Multifactor Index (reflects no deduction for fees, expenses or taxes) | | 16.04 | 12.89 | 9.45 |
| | ||||
| Russell 3000® Index (reflects no deduction for fees, expenses or taxes)1 | | 25.96 | 15.16 | 11.82 |
| | ||||
| Russell 2000® Index (reflects no deduction for fees, expenses or taxes)1 | | 16.93 | 9.97 | 6.67 |
| | ||||
1
Effective August 31, 2024, the Fund changed its broad-based securities market benchmark from the Russell 2000® Index to the Russell 3000® Index to reflect that the Russell 3000® Index can be considered more broadly representative of the overall applicable securities market.
After-tax returns in the above table are calculated using the historical highest individual federal marginal income tax rates and do not reflect the impact of state and local taxes. Actual after-tax returns depend on an investor's tax situation and may differ from those shown, and after-tax returns shown are not relevant to investors who hold Shares through tax-advantaged arrangements, such as 401(k) plans or individual retirement accounts.