Aug. 31, 2024
The Fund’s investment objective is current income and,
This table describes the fees and expenses that you may pay if you buy, hold and sell shares of the Fund.
The table and Examples below do not reflect any transaction fees that may be charged by financial intermediaries or commissions that a shareholder may be required to pay directly to its financial intermediary when buying or selling Class Y or Class R6 shares. You may qualify for sales charge discounts if you and your family invest, or agree to invest in the future, at least $50,000 in the Invesco Funds. More information about these and other discounts is available from your financial professional and in the section “Shareholder Account Information – Initial Sales Charges (Class A Shares Only)” on page A-3 of the prospectus and the section “Purchase, Redemption and Pricing of Shares – Purchase and Redemption of Shares” on page L-1 of the statement of additional information (SAI).
| Shareholder Fees (fees paid directly from your investment) | ||||||
| Class: | A | C | R | Y | R5 | R6 |
| Maximum Sales Charge (Load) Imposed on Purchases (as a percentage of offering price) | 5.50 % | None | None | None | None | None |
| | ||||||
| Maximum Deferred Sales Charge (Load) (as a percentage of original purchase price or redemption proceeds, whichever is less) | None1 | 1.00 % | None | None | None | None |
| | ||||||
| Annual Fund Operating Expenses (expenses that you pay each year as a percentage of the value of your investment) | ||||||
| Class: | A | C | R | Y | R5 | R6 |
| Management Fees | 0.35 % | 0.35 % | 0.35 % | 0.35 % | 0.35 % | 0.35 % |
| | ||||||
| Distribution and/or Service (12b-1) Fees | 0.25 | 0.99 | 0.50 | None | None | None |
| | ||||||
| Other Expenses2 | 0.17 | 0.17 | 0.17 | 0.17 | 0.13 | 0.06 |
| | ||||||
| Acquired Fund Fees and Expenses | 0.01 | 0.01 | 0.01 | 0.01 | 0.01 | 0.01 |
| | ||||||
| Total Annual Fund Operating Expenses | 0.78 | 1.52 | 1.03 | 0.53 | 0.49 | 0.42 |
| | ||||||
| Fee Waiver and/or Expense Reimbursement3 | 0.01 | 0.01 | 0.01 | 0.01 | 0.01 | 0.01 |
| | ||||||
| Total Annual Fund Operating Expenses After Fee Waiver and/or Expense Reimbursement | 0.77 | 1.51 | 1.02 | 0.52 | 0.48 | 0.41 |
| | ||||||
| 1 | A contingent deferred sales charge may apply in some cases. See “Shareholder Account Information-Contingent Deferred Sales Charges (CDSCs).” |
| 2 | “Other Expenses” have been restated to reflect current fees. |
| 3 | Invesco Advisers, Inc. (Invesco or the Adviser) has contractually agreed to waive a portion of the Fund’s management fee in an amount equal to the net management fee that Invesco earns on the Fund’s investments in certain affiliated funds, which will have the effect of reducing the Acquired Fund Fees and Expenses. Unless Invesco continues the fee waiver agreement, it will terminate on August 31, 2026. During its term, the fee waiver agreement cannot be terminated or amended to reduce the advisory fee waiver without approval of the Board of Trustees. |
This Example is intended to help you compare the cost of investing in the Fund with the cost of investing in other mutual funds.
The Example assumes that you invest $10,000 in the Fund for the time periods indicated and then redeem all of your shares at the end of those periods. This Example does not include commissions and/or other forms of compensation that investors may pay on transactions in Class Y and Class R6 shares. The Example also assumes that your investment has a 5% return each year and that the Fund’s operating expenses remain equal to the Total Annual Fund Operating Expenses After Fee Waiver and/or Expense Reimbursement in the first year and the Total Annual Fund Operating Expenses thereafter.
Although your actual costs may be higher or lower, based on these assumptions, your costs would be:
| | 1 Year | 3 Years | 5 Years | 10 Years |
| Class A | $624 | $785 | $959 | $1,462 |
| | ||||
| Class C | $254 | $479 | $828 | $1,612 |
| | ||||
| Class R | $104 | $327 | $568 | $1,259 |
| | ||||
| Class Y | $53 | $169 | $295 | $664 |
| | ||||
| Class R5 | $49 | $156 | $273 | $615 |
| | ||||
| Class R6 | $42 | $134 | $234 | $529 |
| | ||||
You would pay the following expenses if you did not redeem your shares:
|
|
1 Year
|
3 Years
|
5 Years
|
10 Years
|
|
Class A
|
$624 |
$785 |
$959 |
$1,462 |
|
|
||||
|
Class C
|
$154 |
$479 |
$828 |
$1,612 |
|
|
||||
|
Class R
|
$104 |
$327 |
$568 |
$1,259 |
|
|
||||
|
Class Y
|
$53 |
$169 |
$295 |
$664 |
|
|
||||
|
Class R5
|
$49 |
$156 |
$273 |
$615 |
|
|
||||
|
Class R6
|
$42 |
$134 |
$234 |
$529 |
|
|
||||
The Fund pays transaction costs, such as commissions, when it buys and sells securities (or “turns over” its portfolio). A higher portfolio turnover rate may indicate higher transaction costs and may result in higher taxes when Fund shares are held in a taxable account. These costs, which are not reflected in annual fund operating expenses or in the Example, affect the Fund’s performance. During the most recent fiscal year, the Fund’s portfolio turnover rate was 139% of the average value of its portfolio.
The Fund invests, under normal circumstances, at least 80% of its net assets (plus any borrowings for investment purposes) in equity and income securities, and in derivatives and other instruments that have economic characteristics similar to such securities.
The Fund may invest in securities of issuers of all capitalization sizes; however, under normal market conditions, it is currently expected that the Fund will invest a substantial percentage of its assets in large-capitalization issuers.
The Fund invests, under normal circumstances, a majority of its net assets in income-producing equity investments, including dividend paying common or preferred stocks, interest paying convertible debentures or bonds, or zero coupon convertible securities (on which the Fund accrues income for tax and accounting purposes, but receives no cash).
The Fund may invest in income-producing equity instruments, debt securities and warrants or rights to acquire such securities, in such proportions as economic conditions indicate would best accomplish the Fund’s objectives. It is the current operating policy of the Fund to invest in debt securities rated investment grade. This operating policy does not apply to convertible securities, which are selected primarily on the basis of their equity characteristics.
The Fund also invests in U.S. government obligations, including Treasury bills and notes, and obligations issued or guaranteed by the U.S. government or its agencies or instrumentalities.
The Fund may invest up to 15% of its net assets in real estate investment trusts (REITs).
The Fund may invest up to 25% of its net assets in securities of foreign issuers, which may include depositary receipts.
The Fund can invest in derivative instruments including forward foreign currency contracts, futures contracts and options.
The Fund can use forward foreign currency contracts to hedge against adverse movements in the foreign currencies in which portfolio securities are denominated.
The Fund can use futures contracts to seek exposure to certain asset classes, to hedge against adverse movements in the foreign currencies in which portfolio securities are denominated and to manage duration.
The Fund can use options to seek investment return or to mitigate risk and to hedge against adverse movements in the foreign currencies in which portfolio securities are denominated.
In selecting securities, the portfolio managers focus on a security’s potential for income with safety of principal and long-term growth of capital. The portfolio managers emphasize a value style of investing, which focuses on undervalued companies with characteristics for improved valuations. The portfolio managers look for catalysts for change that may positively impact a company. This catalyst could come from within the company in the form of new management, operational enhancements, restructuring or reorganization. It could also be an external factor, such as an improvement in industry conditions or a regulatory change. The aim is to uncover these catalysts for change, and then benefit from potential stock price appreciation of the change taking place at the company.
The Fund may dispose of a security when, in the opinion of the portfolio managers, the security reaches the portfolio managers’ estimate of its value or when the portfolio managers identify a more attractive investment opportunity.
In attempting to meet its investment objective or to manage subscription and redemption requests, the Fund may engage in active and frequent trading of portfolio securities.
The bar chart and performance table provide an indication of the risks of investing in the Fund. The bar chart shows changes in the performance of the Fund from year to year as of December 31. The performance table compares the Fund’s performance to that of style-specific benchmarks and a broad-based securities market benchmark (in that order). The Fund's past performance (before and after taxes) is not necessarily an indication of its future performance.
Fund performance reflects any applicable fee waivers and expense reimbursements. Performance returns would be lower without applicable fee waivers and expense reimbursements.
All Fund performance shown assumes the reinvestment of dividends and capital gains and the effect of the Fund’s expenses.
Updated performance information is available on the Fund’s website at www.invesco.com/us.
The bar chart does not reflect sales loads. If it did, the annual total returns shown would be lower.
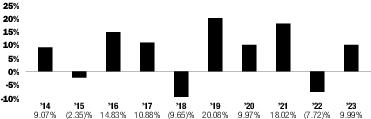
| Class A | Period Ended | Returns |
| Year-to-date | September 30, 2024 | 11.71% |
| Best Quarter | December 31, 2020 | 16.45% |
| Worst Quarter | March 31, 2020 | -20.00% |
| | Inception Date | 1 Year | 5 Years | 10 Years |
| Class A | | | | |
| Return Before Taxes | 8/3/1960 | 3.96 % | 8.38 % | 6.24 % |
| Return After Taxes on Distributions | | 2.18 | 6.41 | 4.35 |
| Return After Taxes on Distributions and Sale of Fund Shares | | 3.35 | 6.28 | 4.54 |
| | ||||
| Class C | 7/6/1993 | 8.25 | 8.80 | 6.21 |
| | ||||
| Class R | 10/1/2002 | 9.65 | 9.31 | 6.57 |
| | ||||
| Class Y | 12/22/2004 | 10.39 | 9.89 | 7.11 |
| | ||||
| Class R5 | 6/1/2010 | 10.33 | 9.95 | 7.18 |
| | ||||
| Class R6 | 9/24/2012 | 10.41 | 10.01 | 7.26 |
| | ||||
| Russell 1000® Value Index (reflects no deduction for fees, expenses or taxes) | | 11.46 | 10.91 | 8.40 |
| | ||||
| Bloomberg U.S. Government/Credit Index (reflects no deduction for fees, expenses or taxes) | | 5.72 | 1.41 | 1.97 |
| | ||||
| S&P 500® Index (reflects no deduction for fees, expenses or taxes) | | 26.29 | 15.69 | 12.03 |
| | ||||
After-tax returns are calculated using the historical highest individual federal marginal income tax rates and do not reflect the impact of state and local taxes. Actual after-tax returns depend on an investor's tax situation and may differ from those shown, and after-tax returns shown are not relevant to investors who hold their Fund shares through tax-advantaged arrangements, such as 401(k) plans, 529 college savings plans or individual retirement accounts. After-tax returns are shown for Class A shares only and after-tax returns for other classes will vary.