Aug. 31, 2024
The Fund’s investment objective is to seek to track the investment results (before fees and expenses) of the Nasdaq-100 Index® (the “Underlying Index”).
This table describes the fees and expenses that you may pay if you buy, hold and sell shares of the Fund.
The table and Examples below do not reflect any transaction fees that may be charged by financial intermediaries, or commissions that a shareholder may be required to pay directly to its financial intermediary when buying or selling Class R6 shares.
| Shareholder Fees (fees paid directly from your investment) | |
| Class: | R6 |
| Maximum Sales Charge (Load) Imposed on Purchases (as a percentage of offering price) | None |
| | |
| Maximum Deferred Sales Charge (Load) (as a percentage of original purchase price or redemption proceeds, whichever is less) | None |
| | |
| Annual Fund Operating Expenses (expenses that you pay each year as a percentage of the value of your investment) | |
| Class: | R6 |
| Management Fees | 0.15 % |
| | |
| Distribution and/or Service (12b-1) Fees | None |
| | |
| Other Expenses | 0.33 |
| | |
| Total Annual Fund Operating Expenses | 0.48 |
| | |
| Fee Waiver and/or Expense Reimbursement1 | 0.19 |
| | |
| Total Annual Fund Operating Expenses After Fee Waiver and/or Expense Reimbursement | 0.29 |
| | |
| 1 | Invesco Advisers, Inc. (Invesco or the Adviser) has contractually agreed to waive advisory fees and/or reimburse expenses to the extent necessary to limit Total Annual Fund Operating Expenses After Fee Waiver and/or Expense Reimbursement (excluding certain items discussed in the SAI) of Class R6 shares to 0.29%, respectively, of the Fund's average daily net assets (the “expense limits”). Unless Invesco continues the fee waiver agreement, it will terminate on December 31, 2025. During its term, the fee waiver agreement cannot be terminated or amended to increase the expense limits without approval of the Board of Trustees. |
This Example is intended to help you compare the cost of investing in the Fund with the cost of investing in other mutual funds.
The Example assumes that you invest $10,000 in the Fund for the time periods indicated and then redeem all of your shares at the end of those periods. This Example does not include commissions and/or other forms of compensation that investors may pay on transactions in Class R6 shares. The Example also assumes that your investment has a 5% return each year and that the Fund’s operating expenses remain equal to the Total Annual Fund Operating Expenses After Fee Waiver and/or Expense Reimbursement in the first year and the Total Annual Fund Operating Expenses thereafter.
Although your actual costs may be higher or lower, based on these assumptions, your costs would be:
| | 1 Year | 3 Years | 5 Years | 10 Years |
| Class R6 | $30 | $135 | $250 | $585 |
| | ||||
You would pay the following expenses if you did not redeem your shares:
|
|
1 Year
|
3 Years
|
5 Years
|
10 Years
|
|
Class R6
|
$30 |
$135 |
$250 |
$585 |
|
|
||||
The Fund pays transaction costs, such as commissions, when it buys and sells securities (or “turns over” its portfolio). A higher portfolio turnover rate may indicate higher transaction costs and may result in higher taxes when Fund shares are held in a taxable account. These costs, which are not reflected in annual fund operating expenses or in the Example, affect the Fund’s performance. During the most recent fiscal year, the Fund’s portfolio turnover rate was 7% of the average value of its portfolio.
The Fund invests, under normal circumstances, at least 80% of its net assets (plus any borrowings for investment purposes) in securities represented in the Underlying Index and in derivatives and other instruments that have economic characteristics similar to such securities. The Underlying Index includes securities of 100 of the largest domestic and international non-financial companies listed on The Nasdaq Stock Market LLC based on market capitalization.
The Underlying Index is a modified market capitalization-weighted (a hybrid between equal weighting and conventional
capitalization weighting) index that reflects companies from all major sectors, except for companies that are classified as “financials” according to the Industry Classification Benchmark (“ICB”), a product of FTSE International Limited. Security types generally eligible for inclusion in the Underlying Index are common stocks, tracking stocks, and American Depositary Receipts including New York Registry Shares. Securities of companies organized as real estate investment trusts (“REITs”), securities of Special Purpose Acquisition Companies (“SPACs”), and “when-issued” securities are not eligible for inclusion in the Underlying Index.
capitalization weighting) index that reflects companies from all major sectors, except for companies that are classified as “financials” according to the Industry Classification Benchmark (“ICB”), a product of FTSE International Limited. Security types generally eligible for inclusion in the Underlying Index are common stocks, tracking stocks, and American Depositary Receipts including New York Registry Shares. Securities of companies organized as real estate investment trusts (“REITs”), securities of Special Purpose Acquisition Companies (“SPACs”), and “when-issued” securities are not eligible for inclusion in the Underlying Index.
In seeking to track the investment results (before fees and expenses) of the Underlying Index, the portfolio managers primarily utilize a “full replication” methodology, pursuant to which the Fund generally invests in all of the securities comprising the Underlying Index in proportion to their weightings in the Underlying Index.
The Fund can invest in derivative instruments, including futures contracts. The Fund can use exchange-traded futures contracts, including index futures, to gain exposure to equity securities represented in the Underlying Index while managing cash balances.
The Fund intends to be diversified in approximately the same proportion as the Underlying Index is diversified. The Fund may be “non-diversified,” as defined in the Investment Company Act of 1940 (1940 Act), solely as a result of a change in relative market capitalization or index weighting of one or more constituents of the Underlying Index. As a “non-diversified” fund, the Fund can invest a greater percentage of its assets in a small group of issuers or in any one issuer than a diversified fund can. Shareholder approval will not be sought when the Fund crosses from diversified to non-diversified status due solely to a change in the relative market capitalization or index weighting of one or more constituents of the Underlying Index. As of August 31, 2024, the Underlying Index is non-diversified, and therefore as of that same date, the Fund is managed as non-diversified solely in accordance with the Underlying Index.
The Fund will concentrate its investments (i.e., invest more than 25% of the value of its total assets) in securities of issuers in any one industry or group of industries only to the extent that the Underlying Index reflects a concentration in that industry or group of industries. The Fund will not otherwise concentrate its investments in securities of issuers in any one industry or group of industries. As of August 31, 2024, the Fund had significant exposure to the information technology sector. The Fund’s portfolio holdings, and the extent to which it concentrates, are likely to change over time.
The bar chart and performance table provide an indication of the risks of investing in the Fund. The bar chart shows changes in the performance of the Fund from year to year as of December 31. The performance table compares the Fund’s performance to that of a style-specific benchmark and a broad-based securities market benchmark (in that order). The Fund's past performance (before and after taxes) is not necessarily an indication of its future performance.
All Fund performance shown assumes the reinvestment of dividends and capital gains and the effect of the Fund’s expenses.
Updated performance information is available on the Fund's website at www.invesco.com/us.
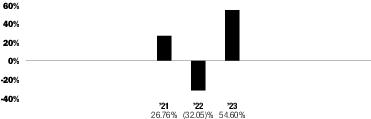
| Class R6 | Period Ended | Returns |
| Year-to-date | September 30, 2024 | 19.63% |
| Best Quarter | March 31, 2023 | 20.63% |
| Worst Quarter | June 30, 2022 | -22.33% |
| | Inception Date | 1 Year | Since Inception |
| Class R6 | | | |
| Return Before Taxes | 10/13/2020 | 54.60 % | 11.58 % |
| Return After Taxes on Distributions | | 54.38 | 11.36 |
| Return After Taxes on Distributions and Sale of Fund Shares | | 32.45 | 9.01 |
| | |||
| Nasdaq-100® Index (reflects no deduction for fees, expenses or taxes) | | 55.13 | 11.74 |
| | |||
| NASDAQ Composite Index (reflects no deduction for fees, expenses or taxes) | | 44.64 | 8.43 |
| | |||
After-tax returns are calculated using the historical highest individual federal marginal income tax rates and do not reflect the impact of state and local taxes. Actual after-tax returns depend on an investor's tax situation and may differ from those shown, and after-tax returns shown are not relevant to investors who hold their Fund shares through tax-advantaged arrangements, such as 401(k) plans, 529 college savings plans or individual retirement accounts.