Performance Management |
Aug. 31, 2024 |
||||||||||||||||||||||||||||||||||||||||||||||||||||||||||||||||||||||||||||||||||||||||||||||||||||||||||||||
|---|---|---|---|---|---|---|---|---|---|---|---|---|---|---|---|---|---|---|---|---|---|---|---|---|---|---|---|---|---|---|---|---|---|---|---|---|---|---|---|---|---|---|---|---|---|---|---|---|---|---|---|---|---|---|---|---|---|---|---|---|---|---|---|---|---|---|---|---|---|---|---|---|---|---|---|---|---|---|---|---|---|---|---|---|---|---|---|---|---|---|---|---|---|---|---|---|---|---|---|---|---|---|---|---|---|---|---|---|---|---|---|
| INVESCO AMERICAN FRANCHISE FUND | INVESCO AMERICAN FRANCHISE FUND | |||||||||||||||||||||||||||||||||||||||||||||||||||||||||||||||||||||||||||||||||||||||||||||||||||||||||||||||
| Prospectus [Line Items] | |||||||||||||||||||||||||||||||||||||||||||||||||||||||||||||||||||||||||||||||||||||||||||||||||||||||||||||||
| Bar Chart and Performance Table [Heading] | Performance Information | ||||||||||||||||||||||||||||||||||||||||||||||||||||||||||||||||||||||||||||||||||||||||||||||||||||||||||||||
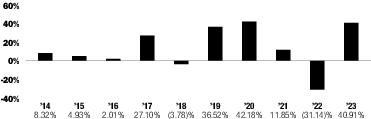
| Performance Narrative [Text Block] | The bar chart and performance table provide an indication of the risks of investing in the Fund. The bar chart shows changes in the performance of the Fund from year to year as of December 31. The performance table compares the Fund’s performance to that of a style-specific benchmark and a broad-based securities market benchmark (in that order). The Fund’s past performance (before and after taxes) is not necessarily an indication of its future performance.
Fund performance reflects any applicable fee waivers and expense reimbursements. Performance returns would be lower without applicable fee waivers and expense reimbursements.
All Fund performance shown assumes the reinvestment of dividends and capital gains and the effect of the Fund’s expenses.
Updated performance information is available on the Fund’s website at www.invesco.com/us.
|
||||||||||||||||||||||||||||||||||||||||||||||||||||||||||||||||||||||||||||||||||||||||||||||||||||||||||||||
| Performance Past Does Not Indicate Future [Text] | The Fund’s past performance (before and after taxes) is not necessarily an indication of its future performance. | ||||||||||||||||||||||||||||||||||||||||||||||||||||||||||||||||||||||||||||||||||||||||||||||||||||||||||||||
| Performance Information Illustrates Variability of Returns [Text] | The bar chart and performance table provide an indication of the risks of investing in the Fund. | ||||||||||||||||||||||||||||||||||||||||||||||||||||||||||||||||||||||||||||||||||||||||||||||||||||||||||||||
| Bar Chart Narrative [Text Block] | The bar chart does not reflect sales loads. If it did, the annual total returns shown would be lower.
|
||||||||||||||||||||||||||||||||||||||||||||||||||||||||||||||||||||||||||||||||||||||||||||||||||||||||||||||
| Bar Chart Does Not Reflect Sales Loads [Text] | The bar chart does not reflect sales loads. If it did, the annual total returns shown would be lower. | ||||||||||||||||||||||||||||||||||||||||||||||||||||||||||||||||||||||||||||||||||||||||||||||||||||||||||||||
| Bar Chart [Heading] | Annual Total Returns | ||||||||||||||||||||||||||||||||||||||||||||||||||||||||||||||||||||||||||||||||||||||||||||||||||||||||||||||
| Bar Chart [Table] |
|
||||||||||||||||||||||||||||||||||||||||||||||||||||||||||||||||||||||||||||||||||||||||||||||||||||||||||||||
| Bar Chart Closing [Text Block] |
|
||||||||||||||||||||||||||||||||||||||||||||||||||||||||||||||||||||||||||||||||||||||||||||||||||||||||||||||
| Year to Date Return, Label [Optional Text] | Year-to-date | ||||||||||||||||||||||||||||||||||||||||||||||||||||||||||||||||||||||||||||||||||||||||||||||||||||||||||||||
| Bar Chart, Year to Date Return | 25.80% | ||||||||||||||||||||||||||||||||||||||||||||||||||||||||||||||||||||||||||||||||||||||||||||||||||||||||||||||
| Bar Chart, Year to Date Return, Date | Sep. 30, 2024 | ||||||||||||||||||||||||||||||||||||||||||||||||||||||||||||||||||||||||||||||||||||||||||||||||||||||||||||||
| Highest Quarterly Return, Label [Optional Text] | Best Quarter | ||||||||||||||||||||||||||||||||||||||||||||||||||||||||||||||||||||||||||||||||||||||||||||||||||||||||||||||
| Highest Quarterly Return | 30.98% | ||||||||||||||||||||||||||||||||||||||||||||||||||||||||||||||||||||||||||||||||||||||||||||||||||||||||||||||
| Highest Quarterly Return, Date | Jun. 30, 2020 | ||||||||||||||||||||||||||||||||||||||||||||||||||||||||||||||||||||||||||||||||||||||||||||||||||||||||||||||
| Lowest Quarterly Return, Label [Optional Text] | Worst Quarter | ||||||||||||||||||||||||||||||||||||||||||||||||||||||||||||||||||||||||||||||||||||||||||||||||||||||||||||||
| Lowest Quarterly Return | (20.33%) | ||||||||||||||||||||||||||||||||||||||||||||||||||||||||||||||||||||||||||||||||||||||||||||||||||||||||||||||
| Lowest Quarterly Return, Date | Jun. 30, 2022 | ||||||||||||||||||||||||||||||||||||||||||||||||||||||||||||||||||||||||||||||||||||||||||||||||||||||||||||||
| Performance Table Heading | Average Annual Total Returns (for the periods ended December 31, 2023) | ||||||||||||||||||||||||||||||||||||||||||||||||||||||||||||||||||||||||||||||||||||||||||||||||||||||||||||||
| Performance Table Uses Highest Federal Rate | After-tax returns are calculated using the historical highest individual federal marginal income tax rates and do not reflect the impact of state and local taxes. | ||||||||||||||||||||||||||||||||||||||||||||||||||||||||||||||||||||||||||||||||||||||||||||||||||||||||||||||
| Performance Table Not Relevant to Tax Deferred | Actual after-tax returns depend on an investor's tax situation and may differ from those shown, and after-tax returns shown are not relevant to investors who hold their Fund shares through tax-advantaged arrangements, such as 401(k) plans, 529 college savings plans or individual retirement accounts. | ||||||||||||||||||||||||||||||||||||||||||||||||||||||||||||||||||||||||||||||||||||||||||||||||||||||||||||||
| Performance [Table] |
|
||||||||||||||||||||||||||||||||||||||||||||||||||||||||||||||||||||||||||||||||||||||||||||||||||||||||||||||
| Performance Table One Class of after Tax Shown [Text] | After-tax returns are shown for Class A shares only and after-tax returns for other classes will vary. | ||||||||||||||||||||||||||||||||||||||||||||||||||||||||||||||||||||||||||||||||||||||||||||||||||||||||||||||
| Index No Deduction for Fees, Expenses, or Taxes [Text] | (reflects no deduction for fees, expenses or taxes) | ||||||||||||||||||||||||||||||||||||||||||||||||||||||||||||||||||||||||||||||||||||||||||||||||||||||||||||||
| Performance Table Closing [Text Block] | After-tax returns are calculated using the historical highest individual federal marginal income tax rates and do not reflect the impact of state and local taxes. Actual after-tax returns depend on an investor's tax situation and may differ from those shown, and after-tax returns shown are not relevant to investors who hold their Fund shares through tax-advantaged arrangements, such as 401(k) plans, 529 college savings plans or individual retirement accounts. After-tax returns are shown for Class A shares only and after-tax returns for other classes will vary.
|
||||||||||||||||||||||||||||||||||||||||||||||||||||||||||||||||||||||||||||||||||||||||||||||||||||||||||||||
| Performance Availability Website Address [Text] | www.invesco.com/us | ||||||||||||||||||||||||||||||||||||||||||||||||||||||||||||||||||||||||||||||||||||||||||||||||||||||||||||||
| INVESCO CORE PLUS BOND FUND | INVESCO CORE PLUS BOND FUND | |||||||||||||||||||||||||||||||||||||||||||||||||||||||||||||||||||||||||||||||||||||||||||||||||||||||||||||||
| Prospectus [Line Items] | |||||||||||||||||||||||||||||||||||||||||||||||||||||||||||||||||||||||||||||||||||||||||||||||||||||||||||||||
| Bar Chart and Performance Table [Heading] | Performance Information | ||||||||||||||||||||||||||||||||||||||||||||||||||||||||||||||||||||||||||||||||||||||||||||||||||||||||||||||
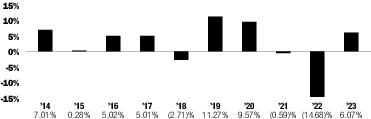
| Performance Narrative [Text Block] | The bar chart and performance table provide an indication of the risks of investing in the Fund. The bar chart shows changes in the performance of the Fund from year to year as of December 31. The performance table compares the Fund's performance to that of a broad-based securities market benchmark. The Fund's past performance (before and after taxes) is not necessarily an indication of its future performance. Fund performance reflects any applicable fee waivers and expense reimbursements. Performance returns would be lower without applicable fee waivers and expense reimbursements.
All Fund performance shown assumes the reinvestment of dividends and capital gains and the effect of the Fund’s expenses.
Updated performance information is available on the Fund's website at www.invesco.com/us.
|
||||||||||||||||||||||||||||||||||||||||||||||||||||||||||||||||||||||||||||||||||||||||||||||||||||||||||||||
| Performance Past Does Not Indicate Future [Text] | The Fund's past performance (before and after taxes) is not necessarily an indication of its future performance. | ||||||||||||||||||||||||||||||||||||||||||||||||||||||||||||||||||||||||||||||||||||||||||||||||||||||||||||||
| Performance Information Illustrates Variability of Returns [Text] | The bar chart and performance table provide an indication of the risks of investing in the Fund. | ||||||||||||||||||||||||||||||||||||||||||||||||||||||||||||||||||||||||||||||||||||||||||||||||||||||||||||||
| Bar Chart Narrative [Text Block] | The bar chart does not reflect sales loads. If it did, the annual total returns shown would be lower.
|
||||||||||||||||||||||||||||||||||||||||||||||||||||||||||||||||||||||||||||||||||||||||||||||||||||||||||||||
| Bar Chart Does Not Reflect Sales Loads [Text] | The bar chart does not reflect sales loads. If it did, the annual total returns shown would be lower. | ||||||||||||||||||||||||||||||||||||||||||||||||||||||||||||||||||||||||||||||||||||||||||||||||||||||||||||||
| Bar Chart [Heading] | Annual Total Returns | ||||||||||||||||||||||||||||||||||||||||||||||||||||||||||||||||||||||||||||||||||||||||||||||||||||||||||||||
| Bar Chart [Table] |
|
||||||||||||||||||||||||||||||||||||||||||||||||||||||||||||||||||||||||||||||||||||||||||||||||||||||||||||||
| Bar Chart Closing [Text Block] |
|
||||||||||||||||||||||||||||||||||||||||||||||||||||||||||||||||||||||||||||||||||||||||||||||||||||||||||||||
| Year to Date Return, Label [Optional Text] | Year-to-date | ||||||||||||||||||||||||||||||||||||||||||||||||||||||||||||||||||||||||||||||||||||||||||||||||||||||||||||||
| Bar Chart, Year to Date Return | 5.99% | ||||||||||||||||||||||||||||||||||||||||||||||||||||||||||||||||||||||||||||||||||||||||||||||||||||||||||||||
| Bar Chart, Year to Date Return, Date | Sep. 30, 2024 | ||||||||||||||||||||||||||||||||||||||||||||||||||||||||||||||||||||||||||||||||||||||||||||||||||||||||||||||
| Highest Quarterly Return, Label [Optional Text] | Best Quarter | ||||||||||||||||||||||||||||||||||||||||||||||||||||||||||||||||||||||||||||||||||||||||||||||||||||||||||||||
| Highest Quarterly Return | 7.37% | ||||||||||||||||||||||||||||||||||||||||||||||||||||||||||||||||||||||||||||||||||||||||||||||||||||||||||||||
| Highest Quarterly Return, Date | Jun. 30, 2020 | ||||||||||||||||||||||||||||||||||||||||||||||||||||||||||||||||||||||||||||||||||||||||||||||||||||||||||||||
| Lowest Quarterly Return, Label [Optional Text] | Worst Quarter | ||||||||||||||||||||||||||||||||||||||||||||||||||||||||||||||||||||||||||||||||||||||||||||||||||||||||||||||
| Lowest Quarterly Return | (7.22%) | ||||||||||||||||||||||||||||||||||||||||||||||||||||||||||||||||||||||||||||||||||||||||||||||||||||||||||||||
| Lowest Quarterly Return, Date | Jun. 30, 2022 | ||||||||||||||||||||||||||||||||||||||||||||||||||||||||||||||||||||||||||||||||||||||||||||||||||||||||||||||
| Performance Table Heading | Average Annual Total Returns (for the periods ended December 31, 2023) | ||||||||||||||||||||||||||||||||||||||||||||||||||||||||||||||||||||||||||||||||||||||||||||||||||||||||||||||
| Performance Table Uses Highest Federal Rate | After-tax returns are calculated using the historical highest individual federal marginal income tax rates and do not reflect the impact of state and local taxes. | ||||||||||||||||||||||||||||||||||||||||||||||||||||||||||||||||||||||||||||||||||||||||||||||||||||||||||||||
| Performance Table Not Relevant to Tax Deferred | Actual after-tax returns depend on an investor's tax situation and may differ from those shown, and after-tax returns shown are not relevant to investors who hold their Fund shares through tax-advantaged arrangements, such as 401(k) plans, 529 college savings plans or individual retirement accounts. | ||||||||||||||||||||||||||||||||||||||||||||||||||||||||||||||||||||||||||||||||||||||||||||||||||||||||||||||
| Performance [Table] |
|
||||||||||||||||||||||||||||||||||||||||||||||||||||||||||||||||||||||||||||||||||||||||||||||||||||||||||||||
| Performance Table One Class of after Tax Shown [Text] | After-tax returns are shown for Class A shares only and after-tax returns for other classes will vary. | ||||||||||||||||||||||||||||||||||||||||||||||||||||||||||||||||||||||||||||||||||||||||||||||||||||||||||||||
| Index No Deduction for Fees, Expenses, or Taxes [Text] | (reflects no deduction for fees, expenses or taxes) | ||||||||||||||||||||||||||||||||||||||||||||||||||||||||||||||||||||||||||||||||||||||||||||||||||||||||||||||
| Performance Table Closing [Text Block] | After-tax returns are calculated using the historical highest individual federal marginal income tax rates and do not reflect the impact of state and local taxes. Actual after-tax returns depend on an investor's tax situation and may differ from those shown, and after-tax returns shown are not relevant to investors who hold their Fund shares through tax-advantaged arrangements, such as 401(k) plans, 529 college savings plans or individual retirement accounts. After-tax returns are shown for Class A shares only and after-tax returns for other classes will vary.
|
||||||||||||||||||||||||||||||||||||||||||||||||||||||||||||||||||||||||||||||||||||||||||||||||||||||||||||||
| Performance Availability Website Address [Text] | www.invesco.com/us | ||||||||||||||||||||||||||||||||||||||||||||||||||||||||||||||||||||||||||||||||||||||||||||||||||||||||||||||
| Invesco Discovery Fund | Invesco Discovery Fund | |||||||||||||||||||||||||||||||||||||||||||||||||||||||||||||||||||||||||||||||||||||||||||||||||||||||||||||||
| Prospectus [Line Items] | |||||||||||||||||||||||||||||||||||||||||||||||||||||||||||||||||||||||||||||||||||||||||||||||||||||||||||||||
| Bar Chart and Performance Table [Heading] | Performance Information | ||||||||||||||||||||||||||||||||||||||||||||||||||||||||||||||||||||||||||||||||||||||||||||||||||||||||||||||
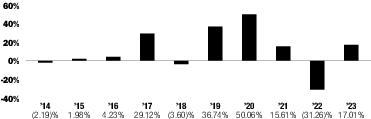
| Performance Narrative [Text Block] | The bar chart and performance table provide an indication of the risks of investing in the Fund. The Fund has adopted the performance of the Oppenheimer Discovery Fund (the predecessor fund) as the result of a reorganization of the predecessor fund into the Fund, which was consummated after the close of business on May 24, 2019 (the “Reorganization”). Prior to the Reorganization, the Fund had not yet commenced operations. The bar chart shows changes in the performance of the predecessor fund and the Fund from year to year as of December 31. The performance table compares the predecessor fund’s and the Fund’s performance to that of a broad measure of market performance and additional indices with characteristics relevant to the Fund. The Fund’s (and the predecessor fund’s) past performance (before and after taxes) is not necessarily an indication of how the Fund will perform in the future.
The returns shown for periods ending on or prior to May 24, 2019 are those of the Class A, Class C, Class R, Class Y and Class I shares of the predecessor fund. Class A, Class C, Class R, Class Y and Class I shares of the predecessor fund were reorganized into Class A, Class C, Class R, Class Y and Class R6 shares, respectively, of the Fund after the close of business on May 24, 2019. Class A, Class C, Class R, Class Y and Class R6 shares’ returns of the Fund will be different from the returns of the predecessor fund as they have different expenses. Performance for Class A shares has been restated to reflect the Fund’s applicable sales charge.
Fund performance reflects any applicable fee waivers and expense reimbursements. Performance returns would be lower without applicable fee waivers and expense reimbursements.
All Fund performance shown assumes the reinvestment of dividends and capital gains and the effect of the Fund’s expenses.
Updated performance information is available on the Fund’s website at www.invesco.com/us.
|
||||||||||||||||||||||||||||||||||||||||||||||||||||||||||||||||||||||||||||||||||||||||||||||||||||||||||||||
| Performance Past Does Not Indicate Future [Text] | The Fund’s (and the predecessor fund’s) past performance (before and after taxes) is not necessarily an indication of how the Fund will perform in the future. | ||||||||||||||||||||||||||||||||||||||||||||||||||||||||||||||||||||||||||||||||||||||||||||||||||||||||||||||
| Performance Information Illustrates Variability of Returns [Text] | The bar chart and performance table provide an indication of the risks of investing in the Fund. | ||||||||||||||||||||||||||||||||||||||||||||||||||||||||||||||||||||||||||||||||||||||||||||||||||||||||||||||
| Bar Chart Narrative [Text Block] | The bar chart does not reflect sales loads. If it did, the annual total returns shown would be lower.
|
||||||||||||||||||||||||||||||||||||||||||||||||||||||||||||||||||||||||||||||||||||||||||||||||||||||||||||||
| Bar Chart Does Not Reflect Sales Loads [Text] | The bar chart does not reflect sales loads. If it did, the annual total returns shown would be lower. | ||||||||||||||||||||||||||||||||||||||||||||||||||||||||||||||||||||||||||||||||||||||||||||||||||||||||||||||
| Bar Chart [Heading] | Annual Total Returns | ||||||||||||||||||||||||||||||||||||||||||||||||||||||||||||||||||||||||||||||||||||||||||||||||||||||||||||||
| Bar Chart [Table] |
|
||||||||||||||||||||||||||||||||||||||||||||||||||||||||||||||||||||||||||||||||||||||||||||||||||||||||||||||
| Bar Chart Closing [Text Block] |
|
||||||||||||||||||||||||||||||||||||||||||||||||||||||||||||||||||||||||||||||||||||||||||||||||||||||||||||||
| Year to Date Return, Label [Optional Text] | Year-to-date | ||||||||||||||||||||||||||||||||||||||||||||||||||||||||||||||||||||||||||||||||||||||||||||||||||||||||||||||
| Bar Chart, Year to Date Return | 21.12% | ||||||||||||||||||||||||||||||||||||||||||||||||||||||||||||||||||||||||||||||||||||||||||||||||||||||||||||||
| Bar Chart, Year to Date Return, Date | Sep. 30, 2024 | ||||||||||||||||||||||||||||||||||||||||||||||||||||||||||||||||||||||||||||||||||||||||||||||||||||||||||||||
| Highest Quarterly Return, Label [Optional Text] | Best Quarter | ||||||||||||||||||||||||||||||||||||||||||||||||||||||||||||||||||||||||||||||||||||||||||||||||||||||||||||||
| Highest Quarterly Return | 33.80% | ||||||||||||||||||||||||||||||||||||||||||||||||||||||||||||||||||||||||||||||||||||||||||||||||||||||||||||||
| Highest Quarterly Return, Date | Jun. 30, 2020 | ||||||||||||||||||||||||||||||||||||||||||||||||||||||||||||||||||||||||||||||||||||||||||||||||||||||||||||||
| Lowest Quarterly Return, Label [Optional Text] | Worst Quarter | ||||||||||||||||||||||||||||||||||||||||||||||||||||||||||||||||||||||||||||||||||||||||||||||||||||||||||||||
| Lowest Quarterly Return | (22.11%) | ||||||||||||||||||||||||||||||||||||||||||||||||||||||||||||||||||||||||||||||||||||||||||||||||||||||||||||||
| Lowest Quarterly Return, Date | Jun. 30, 2022 | ||||||||||||||||||||||||||||||||||||||||||||||||||||||||||||||||||||||||||||||||||||||||||||||||||||||||||||||
| Performance Table Heading | Average Annual Total Returns (for the periods ended December 31, 2023) | ||||||||||||||||||||||||||||||||||||||||||||||||||||||||||||||||||||||||||||||||||||||||||||||||||||||||||||||
| Performance Table Uses Highest Federal Rate | After-tax returns are calculated using the historical highest individual federal marginal income tax rates and do not reflect the impact of state and local taxes. | ||||||||||||||||||||||||||||||||||||||||||||||||||||||||||||||||||||||||||||||||||||||||||||||||||||||||||||||
| Performance Table Not Relevant to Tax Deferred | Actual after-tax returns depend on an investor's tax situation and may differ from those shown, and after-tax returns shown are not relevant to investors who hold their Fund shares through tax-advantaged arrangements, such as 401(k) plans, 529 college savings plans or individual retirement accounts. | ||||||||||||||||||||||||||||||||||||||||||||||||||||||||||||||||||||||||||||||||||||||||||||||||||||||||||||||
| Performance [Table] |
1
Performance shown prior to the inception date is that of the Fund’s and the predecessor fund’s Class A shares at net asset value and includes the 12b-1 fees applicable to that class. Although invested in the same portfolio of securities, Class R5 shares' returns of the Fund will be different from Class A shares' returns of the Fund and the predecessor fund as they have different expenses. |
||||||||||||||||||||||||||||||||||||||||||||||||||||||||||||||||||||||||||||||||||||||||||||||||||||||||||||||
| Performance Table One Class of after Tax Shown [Text] | After-tax returns are shown for Class A shares only and after-tax returns for other classes will vary. | ||||||||||||||||||||||||||||||||||||||||||||||||||||||||||||||||||||||||||||||||||||||||||||||||||||||||||||||
| Index No Deduction for Fees, Expenses, or Taxes [Text] | (reflects no deduction for fees, expenses or taxes) | ||||||||||||||||||||||||||||||||||||||||||||||||||||||||||||||||||||||||||||||||||||||||||||||||||||||||||||||
| Performance Table Closing [Text Block] | After-tax returns are calculated using the historical highest individual federal marginal income tax rates and do not reflect the impact of state and local taxes. Actual after-tax returns depend on an investor's tax situation and may differ from those shown, and after-tax returns shown are not relevant to investors who hold their Fund shares through tax-advantaged arrangements, such as 401(k) plans, 529 college savings plans or individual retirement accounts. After-tax returns are shown for Class A shares only and after-tax returns for other classes will vary.
|
||||||||||||||||||||||||||||||||||||||||||||||||||||||||||||||||||||||||||||||||||||||||||||||||||||||||||||||
| Performance Availability Website Address [Text] | www.invesco.com/us | ||||||||||||||||||||||||||||||||||||||||||||||||||||||||||||||||||||||||||||||||||||||||||||||||||||||||||||||
| Invesco Discovery Large Cap Fund | Invesco Discovery Large Cap Fund | |||||||||||||||||||||||||||||||||||||||||||||||||||||||||||||||||||||||||||||||||||||||||||||||||||||||||||||||
| Prospectus [Line Items] | |||||||||||||||||||||||||||||||||||||||||||||||||||||||||||||||||||||||||||||||||||||||||||||||||||||||||||||||
| Bar Chart and Performance Table [Heading] | Performance Information | ||||||||||||||||||||||||||||||||||||||||||||||||||||||||||||||||||||||||||||||||||||||||||||||||||||||||||||||
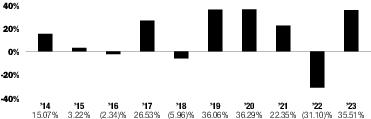
| Performance Narrative [Text Block] | The bar chart and performance table provide an indication of the risks of investing in the Fund. The Fund has adopted the performance of the Oppenheimer Capital Appreciation Fund (the predecessor fund) as the result of a reorganization of the predecessor fund into the Fund, which was consummated after the close of business on May 24, 2019 (the “Reorganization”). Prior to the Reorganization, the Fund had not yet commenced operations. The bar chart shows changes in the performance of the predecessor fund and the Fund from year to year as of December 31. The performance table compares the predecessor fund’s and the Fund’s performance to that of a broad measure of market performance and an additional index with characteristics relevant to the Fund. The Fund’s (and the predecessor fund’s) past performance (before and after taxes) is not necessarily an indication of how the Fund will perform in the future.
The returns shown for periods ending on or prior to May 24, 2019 are those of the Class A, Class C, Class R, Class Y and Class I shares of the predecessor fund. Class A, Class C, Class R, Class Y and Class I shares of the predecessor fund were reorganized into Class A, Class C, Class R, Class Y and Class R6 shares, respectively, of the Fund after the close of business on May 24, 2019. Class A, Class C, Class R, Class Y and Class R6 shares’ returns of the Fund will be different from the returns of the predecessor fund as they have different expenses. Performance for Class A shares has been restated to reflect the Fund’s applicable sales charge.
Fund performance reflects any applicable fee waivers and expense reimbursements. Performance returns would be lower without applicable fee waivers and expense reimbursements.
All Fund performance shown assumes the reinvestment of dividends and capital gains and the effect of the Fund’s expenses.
Updated performance information is available on the Fund’s website at www.invesco.com/us.
|
||||||||||||||||||||||||||||||||||||||||||||||||||||||||||||||||||||||||||||||||||||||||||||||||||||||||||||||
| Performance Past Does Not Indicate Future [Text] | The Fund’s (and the predecessor fund’s) past performance (before and after taxes) is not necessarily an indication of how the Fund will perform in the future. | ||||||||||||||||||||||||||||||||||||||||||||||||||||||||||||||||||||||||||||||||||||||||||||||||||||||||||||||
| Performance Information Illustrates Variability of Returns [Text] | The bar chart and performance table provide an indication of the risks of investing in the Fund. | ||||||||||||||||||||||||||||||||||||||||||||||||||||||||||||||||||||||||||||||||||||||||||||||||||||||||||||||
| Bar Chart Narrative [Text Block] | The bar chart does not reflect sales loads. If it did, the annual total returns shown would be lower.
|
||||||||||||||||||||||||||||||||||||||||||||||||||||||||||||||||||||||||||||||||||||||||||||||||||||||||||||||
| Bar Chart Does Not Reflect Sales Loads [Text] | The bar chart does not reflect sales loads. If it did, the annual total returns shown would be lower. | ||||||||||||||||||||||||||||||||||||||||||||||||||||||||||||||||||||||||||||||||||||||||||||||||||||||||||||||
| Bar Chart [Heading] | Annual Total Returns | ||||||||||||||||||||||||||||||||||||||||||||||||||||||||||||||||||||||||||||||||||||||||||||||||||||||||||||||
| Bar Chart [Table] |
|
||||||||||||||||||||||||||||||||||||||||||||||||||||||||||||||||||||||||||||||||||||||||||||||||||||||||||||||
| Bar Chart Closing [Text Block] |
|
||||||||||||||||||||||||||||||||||||||||||||||||||||||||||||||||||||||||||||||||||||||||||||||||||||||||||||||
| Year to Date Return, Label [Optional Text] | Year-to-date | ||||||||||||||||||||||||||||||||||||||||||||||||||||||||||||||||||||||||||||||||||||||||||||||||||||||||||||||
| Bar Chart, Year to Date Return | 26.33% | ||||||||||||||||||||||||||||||||||||||||||||||||||||||||||||||||||||||||||||||||||||||||||||||||||||||||||||||
| Bar Chart, Year to Date Return, Date | Sep. 30, 2024 | ||||||||||||||||||||||||||||||||||||||||||||||||||||||||||||||||||||||||||||||||||||||||||||||||||||||||||||||
| Highest Quarterly Return, Label [Optional Text] | Best Quarter | ||||||||||||||||||||||||||||||||||||||||||||||||||||||||||||||||||||||||||||||||||||||||||||||||||||||||||||||
| Highest Quarterly Return | 29.99% | ||||||||||||||||||||||||||||||||||||||||||||||||||||||||||||||||||||||||||||||||||||||||||||||||||||||||||||||
| Highest Quarterly Return, Date | Jun. 30, 2020 | ||||||||||||||||||||||||||||||||||||||||||||||||||||||||||||||||||||||||||||||||||||||||||||||||||||||||||||||
| Lowest Quarterly Return, Label [Optional Text] | Worst Quarter | ||||||||||||||||||||||||||||||||||||||||||||||||||||||||||||||||||||||||||||||||||||||||||||||||||||||||||||||
| Lowest Quarterly Return | (20.37%) | ||||||||||||||||||||||||||||||||||||||||||||||||||||||||||||||||||||||||||||||||||||||||||||||||||||||||||||||
| Lowest Quarterly Return, Date | Jun. 30, 2022 | ||||||||||||||||||||||||||||||||||||||||||||||||||||||||||||||||||||||||||||||||||||||||||||||||||||||||||||||
| Performance Table Heading | Average Annual Total Returns (for the periods ended December 31, 2023) | ||||||||||||||||||||||||||||||||||||||||||||||||||||||||||||||||||||||||||||||||||||||||||||||||||||||||||||||
| Performance Table Uses Highest Federal Rate | After-tax returns are calculated using the historical highest individual federal marginal income tax rates and do not reflect the impact of state and local taxes. | ||||||||||||||||||||||||||||||||||||||||||||||||||||||||||||||||||||||||||||||||||||||||||||||||||||||||||||||
| Performance Table Not Relevant to Tax Deferred | Actual after-tax returns depend on an investor's tax situation and may differ from those shown, and after-tax returns shown are not relevant to investors who hold their Fund shares through tax-advantaged arrangements, such as 401(k) plans, 529 college savings plans or individual retirement accounts. | ||||||||||||||||||||||||||||||||||||||||||||||||||||||||||||||||||||||||||||||||||||||||||||||||||||||||||||||
| Performance [Table] |
1
Performance shown prior to the inception date is that of the Fund’s and the predecessor fund’s Class A shares at net asset value and includes the 12b-1 fees applicable to that class. Although invested in the same portfolio of securities, Class R5 shares' returns of the Fund will be different from Class A shares' returns of the Fund and the predecessor fund as they have different expenses. |
||||||||||||||||||||||||||||||||||||||||||||||||||||||||||||||||||||||||||||||||||||||||||||||||||||||||||||||
| Performance Table One Class of after Tax Shown [Text] | After-tax returns are shown for Class A shares only and after-tax returns for other classes will vary. | ||||||||||||||||||||||||||||||||||||||||||||||||||||||||||||||||||||||||||||||||||||||||||||||||||||||||||||||
| Index No Deduction for Fees, Expenses, or Taxes [Text] | (reflects no deduction for fees, expenses or taxes) | ||||||||||||||||||||||||||||||||||||||||||||||||||||||||||||||||||||||||||||||||||||||||||||||||||||||||||||||
| Performance Table Closing [Text Block] | After-tax returns are calculated using the historical highest individual federal marginal income tax rates and do not reflect the impact of state and local taxes. Actual after-tax returns depend on an investor's tax situation and may differ from those shown, and after-tax returns shown are not relevant to investors who hold their Fund shares through tax-advantaged arrangements, such as 401(k) plans, 529 college savings plans or individual retirement accounts. After-tax returns are shown for Class A shares only and after-tax returns for other classes will vary.
|
||||||||||||||||||||||||||||||||||||||||||||||||||||||||||||||||||||||||||||||||||||||||||||||||||||||||||||||
| Performance Availability Website Address [Text] | www.invesco.com/us | ||||||||||||||||||||||||||||||||||||||||||||||||||||||||||||||||||||||||||||||||||||||||||||||||||||||||||||||
| INVESCO EQUALLY-WEIGHTED S&P 500 FUND | INVESCO EQUALLY-WEIGHTED S&P 500 FUND | |||||||||||||||||||||||||||||||||||||||||||||||||||||||||||||||||||||||||||||||||||||||||||||||||||||||||||||||
| Prospectus [Line Items] | |||||||||||||||||||||||||||||||||||||||||||||||||||||||||||||||||||||||||||||||||||||||||||||||||||||||||||||||
| Bar Chart and Performance Table [Heading] | Performance Information | ||||||||||||||||||||||||||||||||||||||||||||||||||||||||||||||||||||||||||||||||||||||||||||||||||||||||||||||
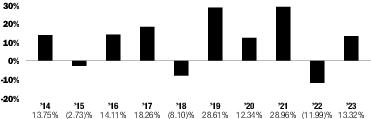
| Performance Narrative [Text Block] | The bar chart and performance table provide an indication of the risks of investing in the Fund. The bar chart shows changes in the performance of the Fund from year to year as of December 31. The performance table compares the Fund’s performance to that of a style-specific benchmark and a broad-based securities market benchmark (in that order). The Fund's past performance (before and after taxes) is not necessarily an indication of its future performance.
Fund performance reflects any applicable fee waivers and expense reimbursements. Performance returns would be lower without applicable fee waivers and expense reimbursements.
All Fund performance shown assumes the reinvestment of dividends and capital gains and the effect of the Fund’s expenses.
Updated performance information is available on the Fund's website at www.invesco.com/us.
|
||||||||||||||||||||||||||||||||||||||||||||||||||||||||||||||||||||||||||||||||||||||||||||||||||||||||||||||
| Performance Past Does Not Indicate Future [Text] | The Fund's past performance (before and after taxes) is not necessarily an indication of its future performance. | ||||||||||||||||||||||||||||||||||||||||||||||||||||||||||||||||||||||||||||||||||||||||||||||||||||||||||||||
| Performance Information Illustrates Variability of Returns [Text] | The bar chart and performance table provide an indication of the risks of investing in the Fund. | ||||||||||||||||||||||||||||||||||||||||||||||||||||||||||||||||||||||||||||||||||||||||||||||||||||||||||||||
| Bar Chart Narrative [Text Block] | The bar chart does not reflect sales loads. If it did, the annual total returns shown would be lower.
|
||||||||||||||||||||||||||||||||||||||||||||||||||||||||||||||||||||||||||||||||||||||||||||||||||||||||||||||
| Bar Chart Does Not Reflect Sales Loads [Text] | The bar chart does not reflect sales loads. If it did, the annual total returns shown would be lower. | ||||||||||||||||||||||||||||||||||||||||||||||||||||||||||||||||||||||||||||||||||||||||||||||||||||||||||||||
| Bar Chart [Heading] | Annual Total Returns | ||||||||||||||||||||||||||||||||||||||||||||||||||||||||||||||||||||||||||||||||||||||||||||||||||||||||||||||
| Bar Chart [Table] |
|
||||||||||||||||||||||||||||||||||||||||||||||||||||||||||||||||||||||||||||||||||||||||||||||||||||||||||||||
| Bar Chart Closing [Text Block] |
|
||||||||||||||||||||||||||||||||||||||||||||||||||||||||||||||||||||||||||||||||||||||||||||||||||||||||||||||
| Year to Date Return, Label [Optional Text] | Year-to-date | ||||||||||||||||||||||||||||||||||||||||||||||||||||||||||||||||||||||||||||||||||||||||||||||||||||||||||||||
| Bar Chart, Year to Date Return | 14.72% | ||||||||||||||||||||||||||||||||||||||||||||||||||||||||||||||||||||||||||||||||||||||||||||||||||||||||||||||
| Bar Chart, Year to Date Return, Date | Sep. 30, 2024 | ||||||||||||||||||||||||||||||||||||||||||||||||||||||||||||||||||||||||||||||||||||||||||||||||||||||||||||||
| Highest Quarterly Return, Label [Optional Text] | Best Quarter | ||||||||||||||||||||||||||||||||||||||||||||||||||||||||||||||||||||||||||||||||||||||||||||||||||||||||||||||
| Highest Quarterly Return | 21.78% | ||||||||||||||||||||||||||||||||||||||||||||||||||||||||||||||||||||||||||||||||||||||||||||||||||||||||||||||
| Highest Quarterly Return, Date | Jun. 30, 2020 | ||||||||||||||||||||||||||||||||||||||||||||||||||||||||||||||||||||||||||||||||||||||||||||||||||||||||||||||
| Lowest Quarterly Return, Label [Optional Text] | Worst Quarter | ||||||||||||||||||||||||||||||||||||||||||||||||||||||||||||||||||||||||||||||||||||||||||||||||||||||||||||||
| Lowest Quarterly Return | (26.84%) | ||||||||||||||||||||||||||||||||||||||||||||||||||||||||||||||||||||||||||||||||||||||||||||||||||||||||||||||
| Lowest Quarterly Return, Date | Mar. 31, 2020 | ||||||||||||||||||||||||||||||||||||||||||||||||||||||||||||||||||||||||||||||||||||||||||||||||||||||||||||||
| Performance Table Heading | Average Annual Total Returns (for the periods ended December 31, 2023) | ||||||||||||||||||||||||||||||||||||||||||||||||||||||||||||||||||||||||||||||||||||||||||||||||||||||||||||||
| Performance Table Uses Highest Federal Rate | After-tax returns are calculated using the historical highest individual federal marginal income tax rates and do not reflect the impact of state and local taxes. | ||||||||||||||||||||||||||||||||||||||||||||||||||||||||||||||||||||||||||||||||||||||||||||||||||||||||||||||
| Performance Table Not Relevant to Tax Deferred | Actual after-tax returns depend on an investor's tax situation and may differ from those shown, and after-tax returns shown are not relevant to investors who hold their Fund shares through tax-advantaged arrangements, such as 401(k) plans, 529 college savings plans or individual retirement accounts. | ||||||||||||||||||||||||||||||||||||||||||||||||||||||||||||||||||||||||||||||||||||||||||||||||||||||||||||||
| Performance [Table] |
|
||||||||||||||||||||||||||||||||||||||||||||||||||||||||||||||||||||||||||||||||||||||||||||||||||||||||||||||
| Performance Table One Class of after Tax Shown [Text] | After-tax returns are shown for Class A shares only and after-tax returns for other classes will vary. | ||||||||||||||||||||||||||||||||||||||||||||||||||||||||||||||||||||||||||||||||||||||||||||||||||||||||||||||
| Index No Deduction for Fees, Expenses, or Taxes [Text] | (reflects no deduction for fees, expenses or taxes) | ||||||||||||||||||||||||||||||||||||||||||||||||||||||||||||||||||||||||||||||||||||||||||||||||||||||||||||||
| Performance Table Closing [Text Block] | After-tax returns are calculated using the historical highest individual federal marginal income tax rates and do not reflect the impact of state and local taxes. Actual after-tax returns depend on an investor's tax situation and may differ from those shown, and after-tax returns shown are not relevant to investors who hold their Fund shares through tax-advantaged arrangements, such as 401(k) plans, 529 college savings plans or individual retirement accounts. After-tax returns are shown for Class A shares only and after-tax returns for other classes will vary.
|
||||||||||||||||||||||||||||||||||||||||||||||||||||||||||||||||||||||||||||||||||||||||||||||||||||||||||||||
| Performance Availability Website Address [Text] | www.invesco.com/us | ||||||||||||||||||||||||||||||||||||||||||||||||||||||||||||||||||||||||||||||||||||||||||||||||||||||||||||||
| INVESCO EQUITY AND INCOME FUND | INVESCO EQUITY AND INCOME FUND | |||||||||||||||||||||||||||||||||||||||||||||||||||||||||||||||||||||||||||||||||||||||||||||||||||||||||||||||
| Prospectus [Line Items] | |||||||||||||||||||||||||||||||||||||||||||||||||||||||||||||||||||||||||||||||||||||||||||||||||||||||||||||||
| Bar Chart and Performance Table [Heading] | Performance Information | ||||||||||||||||||||||||||||||||||||||||||||||||||||||||||||||||||||||||||||||||||||||||||||||||||||||||||||||
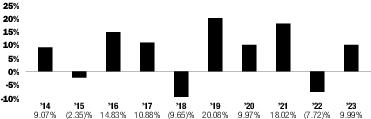
| Performance Narrative [Text Block] | The bar chart and performance table provide an indication of the risks of investing in the Fund. The bar chart shows changes in the performance of the Fund from year to year as of December 31. The performance table compares the Fund’s performance to that of style-specific benchmarks and a broad-based securities market benchmark (in that order). The Fund's past performance (before and after taxes) is not necessarily an indication of its future performance.
Fund performance reflects any applicable fee waivers and expense reimbursements. Performance returns would be lower without applicable fee waivers and expense reimbursements.
All Fund performance shown assumes the reinvestment of dividends and capital gains and the effect of the Fund’s expenses.
Updated performance information is available on the Fund’s website at www.invesco.com/us.
|
||||||||||||||||||||||||||||||||||||||||||||||||||||||||||||||||||||||||||||||||||||||||||||||||||||||||||||||
| Performance Past Does Not Indicate Future [Text] | The Fund's past performance (before and after taxes) is not necessarily an indication of its future performance. | ||||||||||||||||||||||||||||||||||||||||||||||||||||||||||||||||||||||||||||||||||||||||||||||||||||||||||||||
| Performance Information Illustrates Variability of Returns [Text] | The bar chart and performance table provide an indication of the risks of investing in the Fund. | ||||||||||||||||||||||||||||||||||||||||||||||||||||||||||||||||||||||||||||||||||||||||||||||||||||||||||||||
| Bar Chart Narrative [Text Block] | The bar chart does not reflect sales loads. If it did, the annual total returns shown would be lower.
|
||||||||||||||||||||||||||||||||||||||||||||||||||||||||||||||||||||||||||||||||||||||||||||||||||||||||||||||
| Bar Chart Does Not Reflect Sales Loads [Text] | The bar chart does not reflect sales loads. If it did, the annual total returns shown would be lower. | ||||||||||||||||||||||||||||||||||||||||||||||||||||||||||||||||||||||||||||||||||||||||||||||||||||||||||||||
| Bar Chart [Heading] | Annual Total Returns | ||||||||||||||||||||||||||||||||||||||||||||||||||||||||||||||||||||||||||||||||||||||||||||||||||||||||||||||
| Bar Chart [Table] |
|
||||||||||||||||||||||||||||||||||||||||||||||||||||||||||||||||||||||||||||||||||||||||||||||||||||||||||||||
| Bar Chart Closing [Text Block] |
|
||||||||||||||||||||||||||||||||||||||||||||||||||||||||||||||||||||||||||||||||||||||||||||||||||||||||||||||
| Year to Date Return, Label [Optional Text] | Year-to-date | ||||||||||||||||||||||||||||||||||||||||||||||||||||||||||||||||||||||||||||||||||||||||||||||||||||||||||||||
| Bar Chart, Year to Date Return | 11.71% | ||||||||||||||||||||||||||||||||||||||||||||||||||||||||||||||||||||||||||||||||||||||||||||||||||||||||||||||
| Bar Chart, Year to Date Return, Date | Sep. 30, 2024 | ||||||||||||||||||||||||||||||||||||||||||||||||||||||||||||||||||||||||||||||||||||||||||||||||||||||||||||||
| Highest Quarterly Return, Label [Optional Text] | Best Quarter | ||||||||||||||||||||||||||||||||||||||||||||||||||||||||||||||||||||||||||||||||||||||||||||||||||||||||||||||
| Highest Quarterly Return | 16.45% | ||||||||||||||||||||||||||||||||||||||||||||||||||||||||||||||||||||||||||||||||||||||||||||||||||||||||||||||
| Highest Quarterly Return, Date | Dec. 31, 2020 | ||||||||||||||||||||||||||||||||||||||||||||||||||||||||||||||||||||||||||||||||||||||||||||||||||||||||||||||
| Lowest Quarterly Return, Label [Optional Text] | Worst Quarter | ||||||||||||||||||||||||||||||||||||||||||||||||||||||||||||||||||||||||||||||||||||||||||||||||||||||||||||||
| Lowest Quarterly Return | (20.00%) | ||||||||||||||||||||||||||||||||||||||||||||||||||||||||||||||||||||||||||||||||||||||||||||||||||||||||||||||
| Lowest Quarterly Return, Date | Mar. 31, 2020 | ||||||||||||||||||||||||||||||||||||||||||||||||||||||||||||||||||||||||||||||||||||||||||||||||||||||||||||||
| Performance Table Heading | Average Annual Total Returns (for the periods ended December 31, 2023) | ||||||||||||||||||||||||||||||||||||||||||||||||||||||||||||||||||||||||||||||||||||||||||||||||||||||||||||||
| Performance Table Uses Highest Federal Rate | After-tax returns are calculated using the historical highest individual federal marginal income tax rates and do not reflect the impact of state and local taxes. | ||||||||||||||||||||||||||||||||||||||||||||||||||||||||||||||||||||||||||||||||||||||||||||||||||||||||||||||
| Performance Table Not Relevant to Tax Deferred | Actual after-tax returns depend on an investor's tax situation and may differ from those shown, and after-tax returns shown are not relevant to investors who hold their Fund shares through tax-advantaged arrangements, such as 401(k) plans, 529 college savings plans or individual retirement accounts. | ||||||||||||||||||||||||||||||||||||||||||||||||||||||||||||||||||||||||||||||||||||||||||||||||||||||||||||||
| Performance [Table] |
|
||||||||||||||||||||||||||||||||||||||||||||||||||||||||||||||||||||||||||||||||||||||||||||||||||||||||||||||
| Performance Table One Class of after Tax Shown [Text] | After-tax returns are shown for Class A shares only and after-tax returns for other classes will vary. | ||||||||||||||||||||||||||||||||||||||||||||||||||||||||||||||||||||||||||||||||||||||||||||||||||||||||||||||
| Index No Deduction for Fees, Expenses, or Taxes [Text] | (reflects no deduction for fees, expenses or taxes) | ||||||||||||||||||||||||||||||||||||||||||||||||||||||||||||||||||||||||||||||||||||||||||||||||||||||||||||||
| Performance Table Closing [Text Block] | After-tax returns are calculated using the historical highest individual federal marginal income tax rates and do not reflect the impact of state and local taxes. Actual after-tax returns depend on an investor's tax situation and may differ from those shown, and after-tax returns shown are not relevant to investors who hold their Fund shares through tax-advantaged arrangements, such as 401(k) plans, 529 college savings plans or individual retirement accounts. After-tax returns are shown for Class A shares only and after-tax returns for other classes will vary.
|
||||||||||||||||||||||||||||||||||||||||||||||||||||||||||||||||||||||||||||||||||||||||||||||||||||||||||||||
| Performance Availability Website Address [Text] | www.invesco.com/us | ||||||||||||||||||||||||||||||||||||||||||||||||||||||||||||||||||||||||||||||||||||||||||||||||||||||||||||||
| Invesco Floating Rate ESG Fund | Invesco Floating Rate ESG Fund | |||||||||||||||||||||||||||||||||||||||||||||||||||||||||||||||||||||||||||||||||||||||||||||||||||||||||||||||
| Prospectus [Line Items] | |||||||||||||||||||||||||||||||||||||||||||||||||||||||||||||||||||||||||||||||||||||||||||||||||||||||||||||||
| Bar Chart and Performance Table [Heading] | Performance Information | ||||||||||||||||||||||||||||||||||||||||||||||||||||||||||||||||||||||||||||||||||||||||||||||||||||||||||||||
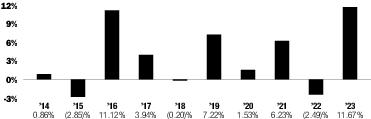
| Performance Narrative [Text Block] | The bar chart and performance table provide an indication of the risks of investing in the Fund. For periods prior to August 21, 2020, performance shown is that of the Fund using its previous investment strategy, which did not apply ESG criteria. Therefore, the performance shown for periods prior to August 21, 2020 may have differed had the Fund’s current investment strategy been in effect. The bar chart shows changes in the performance of the Fund from year to year as of December 31. The performance table compares the Fund's performance to that of a style-specific benchmark and a broad-based securities market benchmark (in that order). The Fund's past performance (before and after taxes) is not necessarily an indication of its future performance.
Fund performance reflects any applicable fee waivers and expense reimbursements. Performance returns would be lower without applicable fee waivers and expense reimbursements.
All Fund performance shown assumes the reinvestment of dividends and capital gains and the effect of the Fund’s expenses.
Updated performance information is available on the Fund's website at www.invesco.com/us.
|
||||||||||||||||||||||||||||||||||||||||||||||||||||||||||||||||||||||||||||||||||||||||||||||||||||||||||||||
| Performance Past Does Not Indicate Future [Text] | The Fund's past performance (before and after taxes) is not necessarily an indication of its future performance. | ||||||||||||||||||||||||||||||||||||||||||||||||||||||||||||||||||||||||||||||||||||||||||||||||||||||||||||||
| Performance Information Illustrates Variability of Returns [Text] | The bar chart and performance table provide an indication of the risks of investing in the Fund. | ||||||||||||||||||||||||||||||||||||||||||||||||||||||||||||||||||||||||||||||||||||||||||||||||||||||||||||||
| Bar Chart Narrative [Text Block] | The bar chart does not reflect sales loads. If it did, the annual total returns shown would be lower.
|
||||||||||||||||||||||||||||||||||||||||||||||||||||||||||||||||||||||||||||||||||||||||||||||||||||||||||||||
| Bar Chart Does Not Reflect Sales Loads [Text] | The bar chart does not reflect sales loads. If it did, the annual total returns shown would be lower. | ||||||||||||||||||||||||||||||||||||||||||||||||||||||||||||||||||||||||||||||||||||||||||||||||||||||||||||||
| Bar Chart [Heading] | Annual Total Returns | ||||||||||||||||||||||||||||||||||||||||||||||||||||||||||||||||||||||||||||||||||||||||||||||||||||||||||||||
| Bar Chart [Table] |
|
||||||||||||||||||||||||||||||||||||||||||||||||||||||||||||||||||||||||||||||||||||||||||||||||||||||||||||||
| Bar Chart Closing [Text Block] |
|
||||||||||||||||||||||||||||||||||||||||||||||||||||||||||||||||||||||||||||||||||||||||||||||||||||||||||||||
| Year to Date Return, Label [Optional Text] | Year-to-date | ||||||||||||||||||||||||||||||||||||||||||||||||||||||||||||||||||||||||||||||||||||||||||||||||||||||||||||||
| Bar Chart, Year to Date Return | 5.62% | ||||||||||||||||||||||||||||||||||||||||||||||||||||||||||||||||||||||||||||||||||||||||||||||||||||||||||||||
| Bar Chart, Year to Date Return, Date | Sep. 30, 2024 | ||||||||||||||||||||||||||||||||||||||||||||||||||||||||||||||||||||||||||||||||||||||||||||||||||||||||||||||
| Highest Quarterly Return, Label [Optional Text] | Best Quarter | ||||||||||||||||||||||||||||||||||||||||||||||||||||||||||||||||||||||||||||||||||||||||||||||||||||||||||||||
| Highest Quarterly Return | 7.04% | ||||||||||||||||||||||||||||||||||||||||||||||||||||||||||||||||||||||||||||||||||||||||||||||||||||||||||||||
| Highest Quarterly Return, Date | Jun. 30, 2020 | ||||||||||||||||||||||||||||||||||||||||||||||||||||||||||||||||||||||||||||||||||||||||||||||||||||||||||||||
| Lowest Quarterly Return, Label [Optional Text] | Worst Quarter | ||||||||||||||||||||||||||||||||||||||||||||||||||||||||||||||||||||||||||||||||||||||||||||||||||||||||||||||
| Lowest Quarterly Return | (12.03%) | ||||||||||||||||||||||||||||||||||||||||||||||||||||||||||||||||||||||||||||||||||||||||||||||||||||||||||||||
| Lowest Quarterly Return, Date | Mar. 31, 2020 | ||||||||||||||||||||||||||||||||||||||||||||||||||||||||||||||||||||||||||||||||||||||||||||||||||||||||||||||
| Performance Table Heading | Average Annual Total Returns (for the periods ended December 31, 2023) | ||||||||||||||||||||||||||||||||||||||||||||||||||||||||||||||||||||||||||||||||||||||||||||||||||||||||||||||
| Performance Table Uses Highest Federal Rate | After-tax returns are calculated using the historical highest individual federal marginal income tax rates and do not reflect the impact of state and local taxes. | ||||||||||||||||||||||||||||||||||||||||||||||||||||||||||||||||||||||||||||||||||||||||||||||||||||||||||||||
| Performance Table Not Relevant to Tax Deferred | Actual after-tax returns depend on an investor's tax situation and may differ from those shown, and after-tax returns shown are not relevant to investors who hold their Fund shares through tax-advantaged arrangements, such as 401(k) plans, 529 college savings plans or individual retirement accounts. | ||||||||||||||||||||||||||||||||||||||||||||||||||||||||||||||||||||||||||||||||||||||||||||||||||||||||||||||
| Performance [Table] |
|
||||||||||||||||||||||||||||||||||||||||||||||||||||||||||||||||||||||||||||||||||||||||||||||||||||||||||||||
| Performance Table One Class of after Tax Shown [Text] | After-tax returns are shown for Class A shares only and after-tax returns for other classes will vary. | ||||||||||||||||||||||||||||||||||||||||||||||||||||||||||||||||||||||||||||||||||||||||||||||||||||||||||||||
| Index No Deduction for Fees, Expenses, or Taxes [Text] | (reflects no deduction for fees, expenses or taxes) | ||||||||||||||||||||||||||||||||||||||||||||||||||||||||||||||||||||||||||||||||||||||||||||||||||||||||||||||
| Performance Table Closing [Text Block] | After-tax returns are calculated using the historical highest individual federal marginal income tax rates and do not reflect the impact of state and local taxes. Actual after-tax returns depend on an investor's tax situation and may differ from those shown, and after-tax returns shown are not relevant to investors who hold their Fund shares through tax-advantaged arrangements, such as 401(k) plans, 529 college savings plans or individual retirement accounts. After-tax returns are shown for Class A shares only and after-tax returns for other classes will vary.
|
||||||||||||||||||||||||||||||||||||||||||||||||||||||||||||||||||||||||||||||||||||||||||||||||||||||||||||||
| Performance Availability Website Address [Text] | www.invesco.com/us | ||||||||||||||||||||||||||||||||||||||||||||||||||||||||||||||||||||||||||||||||||||||||||||||||||||||||||||||
| Invesco Global Real Estate Income Fund | Invesco Global Real Estate Income Fund | |||||||||||||||||||||||||||||||||||||||||||||||||||||||||||||||||||||||||||||||||||||||||||||||||||||||||||||||
| Prospectus [Line Items] | |||||||||||||||||||||||||||||||||||||||||||||||||||||||||||||||||||||||||||||||||||||||||||||||||||||||||||||||
| Bar Chart and Performance Table [Heading] | Performance Information | ||||||||||||||||||||||||||||||||||||||||||||||||||||||||||||||||||||||||||||||||||||||||||||||||||||||||||||||
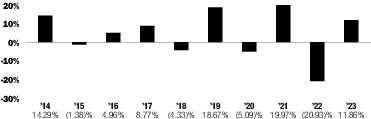
| Performance Narrative [Text Block] | The bar chart and performance table provide an indication of the risks of investing in the Fund. The bar chart shows changes in the performance of the Fund from year to year as of December 31. The performance table compares the Fund’s performance to that of a style-specific benchmark and a broad-based securities market benchmark (in that order). The Fund’s past performance (before and after taxes) is not necessarily an indication of its future performance. Fund performance reflects any applicable fee waivers and expense reimbursements. Performance returns would be lower without applicable fee waivers and expense reimbursements. All Fund performance shown assumes the reinvestment of dividends and capital gains and the effect of the Fund’s expenses. Updated performance information is available on the Fund’s website at www.invesco.com/us.
|
||||||||||||||||||||||||||||||||||||||||||||||||||||||||||||||||||||||||||||||||||||||||||||||||||||||||||||||
| Performance Past Does Not Indicate Future [Text] | The Fund’s past performance (before and after taxes) is not necessarily an indication of its future performance. | ||||||||||||||||||||||||||||||||||||||||||||||||||||||||||||||||||||||||||||||||||||||||||||||||||||||||||||||
| Performance Information Illustrates Variability of Returns [Text] | The bar chart and performance table provide an indication of the risks of investing in the Fund. | ||||||||||||||||||||||||||||||||||||||||||||||||||||||||||||||||||||||||||||||||||||||||||||||||||||||||||||||
| Bar Chart Narrative [Text Block] | The bar chart does not reflect sales loads. If it did, the annual total returns shown would be lower.
|
||||||||||||||||||||||||||||||||||||||||||||||||||||||||||||||||||||||||||||||||||||||||||||||||||||||||||||||
| Bar Chart Does Not Reflect Sales Loads [Text] | The bar chart does not reflect sales loads. If it did, the annual total returns shown would be lower. | ||||||||||||||||||||||||||||||||||||||||||||||||||||||||||||||||||||||||||||||||||||||||||||||||||||||||||||||
| Bar Chart [Heading] | Annual Total Returns | ||||||||||||||||||||||||||||||||||||||||||||||||||||||||||||||||||||||||||||||||||||||||||||||||||||||||||||||
| Bar Chart [Table] |
|
||||||||||||||||||||||||||||||||||||||||||||||||||||||||||||||||||||||||||||||||||||||||||||||||||||||||||||||
| Bar Chart Closing [Text Block] |
|
||||||||||||||||||||||||||||||||||||||||||||||||||||||||||||||||||||||||||||||||||||||||||||||||||||||||||||||
| Year to Date Return, Label [Optional Text] | Year-to-date | ||||||||||||||||||||||||||||||||||||||||||||||||||||||||||||||||||||||||||||||||||||||||||||||||||||||||||||||
| Bar Chart, Year to Date Return | 7.00% | ||||||||||||||||||||||||||||||||||||||||||||||||||||||||||||||||||||||||||||||||||||||||||||||||||||||||||||||
| Bar Chart, Year to Date Return, Date | Sep. 30, 2024 | ||||||||||||||||||||||||||||||||||||||||||||||||||||||||||||||||||||||||||||||||||||||||||||||||||||||||||||||
| Highest Quarterly Return, Label [Optional Text] | Best Quarter | ||||||||||||||||||||||||||||||||||||||||||||||||||||||||||||||||||||||||||||||||||||||||||||||||||||||||||||||
| Highest Quarterly Return | 12.62% | ||||||||||||||||||||||||||||||||||||||||||||||||||||||||||||||||||||||||||||||||||||||||||||||||||||||||||||||
| Highest Quarterly Return, Date | Dec. 31, 2023 | ||||||||||||||||||||||||||||||||||||||||||||||||||||||||||||||||||||||||||||||||||||||||||||||||||||||||||||||
| Lowest Quarterly Return, Label [Optional Text] | Worst Quarter | ||||||||||||||||||||||||||||||||||||||||||||||||||||||||||||||||||||||||||||||||||||||||||||||||||||||||||||||
| Lowest Quarterly Return | (22.73%) | ||||||||||||||||||||||||||||||||||||||||||||||||||||||||||||||||||||||||||||||||||||||||||||||||||||||||||||||
| Lowest Quarterly Return, Date | Mar. 31, 2020 | ||||||||||||||||||||||||||||||||||||||||||||||||||||||||||||||||||||||||||||||||||||||||||||||||||||||||||||||
| Performance Table Heading | Average Annual Total Returns (for the periods ended December 31, 2023) | ||||||||||||||||||||||||||||||||||||||||||||||||||||||||||||||||||||||||||||||||||||||||||||||||||||||||||||||
| Performance Table Uses Highest Federal Rate | After-tax returns are calculated using the historical highest individual federal marginal income tax rates and do not reflect the impact of state and local taxes. | ||||||||||||||||||||||||||||||||||||||||||||||||||||||||||||||||||||||||||||||||||||||||||||||||||||||||||||||
| Performance Table Not Relevant to Tax Deferred | Actual after-tax returns depend on an investor's tax situation and may differ from those shown, and after-tax returns shown are not relevant to investors who hold their Fund shares through tax-advantaged arrangements, such as 401(k) plans, 529 college savings plans or individual retirement accounts. | ||||||||||||||||||||||||||||||||||||||||||||||||||||||||||||||||||||||||||||||||||||||||||||||||||||||||||||||
| Performance [Table] |
|
||||||||||||||||||||||||||||||||||||||||||||||||||||||||||||||||||||||||||||||||||||||||||||||||||||||||||||||
| Performance Table One Class of after Tax Shown [Text] | After-tax returns are shown for Class A shares only and after-tax returns for other classes will vary. | ||||||||||||||||||||||||||||||||||||||||||||||||||||||||||||||||||||||||||||||||||||||||||||||||||||||||||||||
| Index No Deduction for Fees, Expenses, or Taxes [Text] | (reflects reinvested dividends net of withholding taxes, but reflects no deduction for fees, expenses or other taxes) | ||||||||||||||||||||||||||||||||||||||||||||||||||||||||||||||||||||||||||||||||||||||||||||||||||||||||||||||
| Performance Table Closing [Text Block] | After-tax returns are calculated using the historical highest individual federal marginal income tax rates and do not reflect the impact of state and local taxes. Actual after-tax returns depend on an investor's tax situation and may differ from those shown, and after-tax returns shown are not relevant to investors who hold their Fund shares through tax-advantaged arrangements, such as 401(k) plans, 529 college savings plans or individual retirement accounts. After-tax returns are shown for Class A shares only and after-tax returns for other classes will vary.
|
||||||||||||||||||||||||||||||||||||||||||||||||||||||||||||||||||||||||||||||||||||||||||||||||||||||||||||||
| Performance Availability Website Address [Text] | www.invesco.com/us | ||||||||||||||||||||||||||||||||||||||||||||||||||||||||||||||||||||||||||||||||||||||||||||||||||||||||||||||
| INVESCO GROWTH AND INCOME FUND | INVESCO GROWTH AND INCOME FUND | |||||||||||||||||||||||||||||||||||||||||||||||||||||||||||||||||||||||||||||||||||||||||||||||||||||||||||||||
| Prospectus [Line Items] | |||||||||||||||||||||||||||||||||||||||||||||||||||||||||||||||||||||||||||||||||||||||||||||||||||||||||||||||
| Bar Chart and Performance Table [Heading] | Performance Information | ||||||||||||||||||||||||||||||||||||||||||||||||||||||||||||||||||||||||||||||||||||||||||||||||||||||||||||||
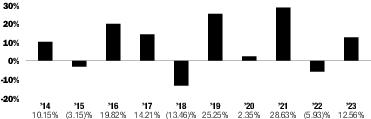
| Performance Narrative [Text Block] | The bar chart and performance table provide an indication of the risks of investing in the Fund. The bar chart shows changes in the performance of the Fund from year to year as of December 31. The performance table compares the Fund’s performance to that of a style-specific benchmark and a broad-based securities market benchmark (in that order). The Fund’s past performance (before and after taxes) is not necessarily an indication of its future performance.
Fund performance reflects any applicable fee waivers and expense reimbursements. Performance returns would be lower without applicable fee waivers and expense reimbursements.
All Fund performance shown assumes the reinvestment of dividends and capital gains and the effect of the Fund’s expenses.
Updated performance information is available on the Fund’s website at www.invesco.com/us.
|
||||||||||||||||||||||||||||||||||||||||||||||||||||||||||||||||||||||||||||||||||||||||||||||||||||||||||||||
| Performance Past Does Not Indicate Future [Text] | The Fund’s past performance (before and after taxes) is not necessarily an indication of its future performance. | ||||||||||||||||||||||||||||||||||||||||||||||||||||||||||||||||||||||||||||||||||||||||||||||||||||||||||||||
| Performance Information Illustrates Variability of Returns [Text] | The bar chart and performance table provide an indication of the risks of investing in the Fund. | ||||||||||||||||||||||||||||||||||||||||||||||||||||||||||||||||||||||||||||||||||||||||||||||||||||||||||||||
| Bar Chart Narrative [Text Block] | The bar chart does not reflect sales loads. If it did, the annual total returns shown would be lower.
|
||||||||||||||||||||||||||||||||||||||||||||||||||||||||||||||||||||||||||||||||||||||||||||||||||||||||||||||
| Bar Chart Does Not Reflect Sales Loads [Text] | The bar chart does not reflect sales loads. If it did, the annual total returns shown would be lower. | ||||||||||||||||||||||||||||||||||||||||||||||||||||||||||||||||||||||||||||||||||||||||||||||||||||||||||||||
| Bar Chart [Heading] | Annual Total Returns | ||||||||||||||||||||||||||||||||||||||||||||||||||||||||||||||||||||||||||||||||||||||||||||||||||||||||||||||
| Bar Chart [Table] |
|
||||||||||||||||||||||||||||||||||||||||||||||||||||||||||||||||||||||||||||||||||||||||||||||||||||||||||||||
| Bar Chart Closing [Text Block] |
|
||||||||||||||||||||||||||||||||||||||||||||||||||||||||||||||||||||||||||||||||||||||||||||||||||||||||||||||
| Year to Date Return, Label [Optional Text] | Year-to-date | ||||||||||||||||||||||||||||||||||||||||||||||||||||||||||||||||||||||||||||||||||||||||||||||||||||||||||||||
| Bar Chart, Year to Date Return | 15.42% | ||||||||||||||||||||||||||||||||||||||||||||||||||||||||||||||||||||||||||||||||||||||||||||||||||||||||||||||
| Bar Chart, Year to Date Return, Date | Sep. 30, 2024 | ||||||||||||||||||||||||||||||||||||||||||||||||||||||||||||||||||||||||||||||||||||||||||||||||||||||||||||||
| Highest Quarterly Return, Label [Optional Text] | Best Quarter | ||||||||||||||||||||||||||||||||||||||||||||||||||||||||||||||||||||||||||||||||||||||||||||||||||||||||||||||
| Highest Quarterly Return | 22.29% | ||||||||||||||||||||||||||||||||||||||||||||||||||||||||||||||||||||||||||||||||||||||||||||||||||||||||||||||
| Highest Quarterly Return, Date | Dec. 31, 2020 | ||||||||||||||||||||||||||||||||||||||||||||||||||||||||||||||||||||||||||||||||||||||||||||||||||||||||||||||
| Lowest Quarterly Return, Label [Optional Text] | Worst Quarter | ||||||||||||||||||||||||||||||||||||||||||||||||||||||||||||||||||||||||||||||||||||||||||||||||||||||||||||||
| Lowest Quarterly Return | (31.43%) | ||||||||||||||||||||||||||||||||||||||||||||||||||||||||||||||||||||||||||||||||||||||||||||||||||||||||||||||
| Lowest Quarterly Return, Date | Mar. 31, 2020 | ||||||||||||||||||||||||||||||||||||||||||||||||||||||||||||||||||||||||||||||||||||||||||||||||||||||||||||||
| Performance Table Heading | Average Annual Total Returns (for the periods ended December 31, 2023) | ||||||||||||||||||||||||||||||||||||||||||||||||||||||||||||||||||||||||||||||||||||||||||||||||||||||||||||||
| Performance Table Uses Highest Federal Rate | After-tax returns are calculated using the historical highest individual federal marginal income tax rates and do not reflect the impact of state and local taxes. | ||||||||||||||||||||||||||||||||||||||||||||||||||||||||||||||||||||||||||||||||||||||||||||||||||||||||||||||
| Performance Table Not Relevant to Tax Deferred | Actual after-tax returns depend on an investor's tax situation and may differ from those shown, and after-tax returns shown are not relevant to investors who hold their Fund shares through tax-advantaged arrangements, such as 401(k) plans, 529 college savings plans or individual retirement accounts. | ||||||||||||||||||||||||||||||||||||||||||||||||||||||||||||||||||||||||||||||||||||||||||||||||||||||||||||||
| Performance [Table] |
|
||||||||||||||||||||||||||||||||||||||||||||||||||||||||||||||||||||||||||||||||||||||||||||||||||||||||||||||
| Performance Table One Class of after Tax Shown [Text] | After-tax returns are shown for Class A shares only and after-tax returns for other classes will vary. | ||||||||||||||||||||||||||||||||||||||||||||||||||||||||||||||||||||||||||||||||||||||||||||||||||||||||||||||
| Index No Deduction for Fees, Expenses, or Taxes [Text] | (reflects no deduction for fees, expenses or taxes) | ||||||||||||||||||||||||||||||||||||||||||||||||||||||||||||||||||||||||||||||||||||||||||||||||||||||||||||||
| Performance Table Closing [Text Block] | After-tax returns are calculated using the historical highest individual federal marginal income tax rates and do not reflect the impact of state and local taxes. Actual after-tax returns depend on an investor's tax situation and may differ from those shown, and after-tax returns shown are not relevant to investors who hold their Fund shares through tax-advantaged arrangements, such as 401(k) plans, 529 college savings plans or individual retirement accounts. After-tax returns are shown for Class A shares only and after-tax returns for other classes will vary.
|
||||||||||||||||||||||||||||||||||||||||||||||||||||||||||||||||||||||||||||||||||||||||||||||||||||||||||||||
| Performance Availability Website Address [Text] | www.invesco.com/us | ||||||||||||||||||||||||||||||||||||||||||||||||||||||||||||||||||||||||||||||||||||||||||||||||||||||||||||||
| Invesco Income Advantage U.S. Fund | Invesco Income Advantage U.S. Fund | |||||||||||||||||||||||||||||||||||||||||||||||||||||||||||||||||||||||||||||||||||||||||||||||||||||||||||||||
| Prospectus [Line Items] | |||||||||||||||||||||||||||||||||||||||||||||||||||||||||||||||||||||||||||||||||||||||||||||||||||||||||||||||
| Bar Chart and Performance Table [Heading] | Performance Information | ||||||||||||||||||||||||||||||||||||||||||||||||||||||||||||||||||||||||||||||||||||||||||||||||||||||||||||||
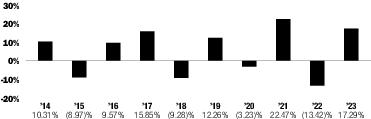
| Performance Narrative [Text Block] | The bar chart and performance table provide an indication of the risks of investing in the Fund. The bar chart shows changes in the performance of the Fund from year to year as of December 31. For periods prior to July 15, 2021, performance shown is that of the Fund using its previous investment strategy. Therefore, the past performance shown for periods prior to July 15, 2021 may have differed had the Fund's current investment strategy been in effect. The performance table compares the Fund's performance to that of a broad-based securities market benchmark. The Fund's past performance (before and after taxes) is not necessarily an indication of its future performance. Fund performance reflects any applicable fee waivers and expense reimbursements. Performance returns would be lower without applicable fee waivers and expense reimbursements.
All Fund performance shown assumes the reinvestment of dividends and capital gains and the effect of the Fund’s expenses.
Updated performance information is available on the Fund's website at www.invesco.com/us.
|
||||||||||||||||||||||||||||||||||||||||||||||||||||||||||||||||||||||||||||||||||||||||||||||||||||||||||||||
| Performance Past Does Not Indicate Future [Text] | The Fund's past performance (before and after taxes) is not necessarily an indication of its future performance. | ||||||||||||||||||||||||||||||||||||||||||||||||||||||||||||||||||||||||||||||||||||||||||||||||||||||||||||||
| Performance Information Illustrates Variability of Returns [Text] | The bar chart and performance table provide an indication of the risks of investing in the Fund. | ||||||||||||||||||||||||||||||||||||||||||||||||||||||||||||||||||||||||||||||||||||||||||||||||||||||||||||||
| Bar Chart Narrative [Text Block] | The bar chart does not reflect sales loads. If it did, the annual total returns shown would be lower.
|
||||||||||||||||||||||||||||||||||||||||||||||||||||||||||||||||||||||||||||||||||||||||||||||||||||||||||||||
| Bar Chart Does Not Reflect Sales Loads [Text] | The bar chart does not reflect sales loads. If it did, the annual total returns shown would be lower. | ||||||||||||||||||||||||||||||||||||||||||||||||||||||||||||||||||||||||||||||||||||||||||||||||||||||||||||||
| Bar Chart [Heading] | Annual Total Returns | ||||||||||||||||||||||||||||||||||||||||||||||||||||||||||||||||||||||||||||||||||||||||||||||||||||||||||||||
| Bar Chart [Table] |
|
||||||||||||||||||||||||||||||||||||||||||||||||||||||||||||||||||||||||||||||||||||||||||||||||||||||||||||||
| Bar Chart Closing [Text Block] |
|
||||||||||||||||||||||||||||||||||||||||||||||||||||||||||||||||||||||||||||||||||||||||||||||||||||||||||||||
| Year to Date Return, Label [Optional Text] | Year-to-date | ||||||||||||||||||||||||||||||||||||||||||||||||||||||||||||||||||||||||||||||||||||||||||||||||||||||||||||||
| Bar Chart, Year to Date Return | 16.02% | ||||||||||||||||||||||||||||||||||||||||||||||||||||||||||||||||||||||||||||||||||||||||||||||||||||||||||||||
| Bar Chart, Year to Date Return, Date | Sep. 30, 2024 | ||||||||||||||||||||||||||||||||||||||||||||||||||||||||||||||||||||||||||||||||||||||||||||||||||||||||||||||
| Highest Quarterly Return, Label [Optional Text] | Best Quarter | ||||||||||||||||||||||||||||||||||||||||||||||||||||||||||||||||||||||||||||||||||||||||||||||||||||||||||||||
| Highest Quarterly Return | 14.59% | ||||||||||||||||||||||||||||||||||||||||||||||||||||||||||||||||||||||||||||||||||||||||||||||||||||||||||||||
| Highest Quarterly Return, Date | Jun. 30, 2020 | ||||||||||||||||||||||||||||||||||||||||||||||||||||||||||||||||||||||||||||||||||||||||||||||||||||||||||||||
| Lowest Quarterly Return, Label [Optional Text] | Worst Quarter | ||||||||||||||||||||||||||||||||||||||||||||||||||||||||||||||||||||||||||||||||||||||||||||||||||||||||||||||
| Lowest Quarterly Return | (22.74%) | ||||||||||||||||||||||||||||||||||||||||||||||||||||||||||||||||||||||||||||||||||||||||||||||||||||||||||||||
| Lowest Quarterly Return, Date | Mar. 31, 2020 | ||||||||||||||||||||||||||||||||||||||||||||||||||||||||||||||||||||||||||||||||||||||||||||||||||||||||||||||
| Performance Table Heading | Average Annual Total Returns (for the periods ended December 31, 2023) | ||||||||||||||||||||||||||||||||||||||||||||||||||||||||||||||||||||||||||||||||||||||||||||||||||||||||||||||
| Performance Table Uses Highest Federal Rate | After-tax returns are calculated using the historical highest individual federal marginal income tax rates and do not reflect the impact of state and local taxes. | ||||||||||||||||||||||||||||||||||||||||||||||||||||||||||||||||||||||||||||||||||||||||||||||||||||||||||||||
| Performance Table Not Relevant to Tax Deferred | Actual after-tax returns depend on an investor's tax situation and may differ from those shown, and after-tax returns shown are not relevant to investors who hold their Fund shares through tax-advantaged arrangements, such as 401(k) plans, 529 college savings plans or individual retirement accounts. | ||||||||||||||||||||||||||||||||||||||||||||||||||||||||||||||||||||||||||||||||||||||||||||||||||||||||||||||
| Performance [Table] |
1
Performance shown prior to the inception date is that of the Fund's Class A shares at net asset value and includes the 12b-1 fees applicable to that class. Although invested in the same portfolio of securities, Class R6 shares' returns of the Fund will be different from Class A shares' returns of the Fund as they have different expenses. |
||||||||||||||||||||||||||||||||||||||||||||||||||||||||||||||||||||||||||||||||||||||||||||||||||||||||||||||
| Performance Table One Class of after Tax Shown [Text] | After-tax returns are shown for Class A shares only and after-tax returns for other classes will vary. | ||||||||||||||||||||||||||||||||||||||||||||||||||||||||||||||||||||||||||||||||||||||||||||||||||||||||||||||
| Index No Deduction for Fees, Expenses, or Taxes [Text] | (reflects no deduction for fees, expenses or taxes) | ||||||||||||||||||||||||||||||||||||||||||||||||||||||||||||||||||||||||||||||||||||||||||||||||||||||||||||||
| Performance Table Closing [Text Block] | After-tax returns are calculated using the historical highest individual federal marginal income tax rates and do not reflect the impact of state and local taxes. Actual after-tax returns depend on an investor's tax situation and may differ from those shown, and after-tax returns shown are not relevant to investors who hold their Fund shares through tax-advantaged arrangements, such as 401(k) plans, 529 college savings plans or individual retirement accounts. After-tax returns are shown for Class A shares only and after-tax returns for other classes will vary.
|
||||||||||||||||||||||||||||||||||||||||||||||||||||||||||||||||||||||||||||||||||||||||||||||||||||||||||||||
| Performance Availability Website Address [Text] | www.invesco.com/us | ||||||||||||||||||||||||||||||||||||||||||||||||||||||||||||||||||||||||||||||||||||||||||||||||||||||||||||||
| Invesco Nasdaq 100 Index Fund | Invesco Nasdaq 100 Index Fund | |||||||||||||||||||||||||||||||||||||||||||||||||||||||||||||||||||||||||||||||||||||||||||||||||||||||||||||||
| Prospectus [Line Items] | |||||||||||||||||||||||||||||||||||||||||||||||||||||||||||||||||||||||||||||||||||||||||||||||||||||||||||||||
| Bar Chart and Performance Table [Heading] | Performance Information | ||||||||||||||||||||||||||||||||||||||||||||||||||||||||||||||||||||||||||||||||||||||||||||||||||||||||||||||
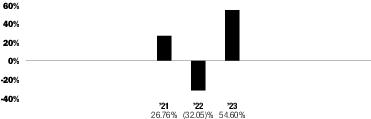
| Performance Narrative [Text Block] | The bar chart and performance table provide an indication of the risks of investing in the Fund. The bar chart shows changes in the performance of the Fund from year to year as of December 31. The performance table compares the Fund’s performance to that of a style-specific benchmark and a broad-based securities market benchmark (in that order). The Fund's past performance (before and after taxes) is not necessarily an indication of its future performance.
All Fund performance shown assumes the reinvestment of dividends and capital gains and the effect of the Fund’s expenses.
Updated performance information is available on the Fund's website at www.invesco.com/us.
|
||||||||||||||||||||||||||||||||||||||||||||||||||||||||||||||||||||||||||||||||||||||||||||||||||||||||||||||
| Performance Past Does Not Indicate Future [Text] | The Fund's past performance (before and after taxes) is not necessarily an indication of its future performance. | ||||||||||||||||||||||||||||||||||||||||||||||||||||||||||||||||||||||||||||||||||||||||||||||||||||||||||||||
| Performance Information Illustrates Variability of Returns [Text] | The bar chart and performance table provide an indication of the risks of investing in the Fund. | ||||||||||||||||||||||||||||||||||||||||||||||||||||||||||||||||||||||||||||||||||||||||||||||||||||||||||||||
| Bar Chart [Heading] | Annual Total Returns | ||||||||||||||||||||||||||||||||||||||||||||||||||||||||||||||||||||||||||||||||||||||||||||||||||||||||||||||
| Bar Chart [Table] |
|
||||||||||||||||||||||||||||||||||||||||||||||||||||||||||||||||||||||||||||||||||||||||||||||||||||||||||||||
| Bar Chart Closing [Text Block] |
|
||||||||||||||||||||||||||||||||||||||||||||||||||||||||||||||||||||||||||||||||||||||||||||||||||||||||||||||
| Year to Date Return, Label [Optional Text] | Year-to-date | ||||||||||||||||||||||||||||||||||||||||||||||||||||||||||||||||||||||||||||||||||||||||||||||||||||||||||||||
| Bar Chart, Year to Date Return | 19.63% | ||||||||||||||||||||||||||||||||||||||||||||||||||||||||||||||||||||||||||||||||||||||||||||||||||||||||||||||
| Bar Chart, Year to Date Return, Date | Sep. 30, 2024 | ||||||||||||||||||||||||||||||||||||||||||||||||||||||||||||||||||||||||||||||||||||||||||||||||||||||||||||||
| Highest Quarterly Return, Label [Optional Text] | Best Quarter | ||||||||||||||||||||||||||||||||||||||||||||||||||||||||||||||||||||||||||||||||||||||||||||||||||||||||||||||
| Highest Quarterly Return | 20.63% | ||||||||||||||||||||||||||||||||||||||||||||||||||||||||||||||||||||||||||||||||||||||||||||||||||||||||||||||
| Highest Quarterly Return, Date | Mar. 31, 2023 | ||||||||||||||||||||||||||||||||||||||||||||||||||||||||||||||||||||||||||||||||||||||||||||||||||||||||||||||
| Lowest Quarterly Return, Label [Optional Text] | Worst Quarter | ||||||||||||||||||||||||||||||||||||||||||||||||||||||||||||||||||||||||||||||||||||||||||||||||||||||||||||||
| Lowest Quarterly Return | (22.33%) | ||||||||||||||||||||||||||||||||||||||||||||||||||||||||||||||||||||||||||||||||||||||||||||||||||||||||||||||
| Lowest Quarterly Return, Date | Jun. 30, 2022 | ||||||||||||||||||||||||||||||||||||||||||||||||||||||||||||||||||||||||||||||||||||||||||||||||||||||||||||||
| Performance Table Heading | Average Annual Total Returns (for the periods ended December 31, 2023) | ||||||||||||||||||||||||||||||||||||||||||||||||||||||||||||||||||||||||||||||||||||||||||||||||||||||||||||||
| Performance Table Uses Highest Federal Rate | After-tax returns are calculated using the historical highest individual federal marginal income tax rates and do not reflect the impact of state and local taxes. | ||||||||||||||||||||||||||||||||||||||||||||||||||||||||||||||||||||||||||||||||||||||||||||||||||||||||||||||
| Performance Table Not Relevant to Tax Deferred | Actual after-tax returns depend on an investor's tax situation and may differ from those shown, and after-tax returns shown are not relevant to investors who hold their Fund shares through tax-advantaged arrangements, such as 401(k) plans, 529 college savings plans or individual retirement accounts. | ||||||||||||||||||||||||||||||||||||||||||||||||||||||||||||||||||||||||||||||||||||||||||||||||||||||||||||||
| Performance [Table] |
|
||||||||||||||||||||||||||||||||||||||||||||||||||||||||||||||||||||||||||||||||||||||||||||||||||||||||||||||
| Index No Deduction for Fees, Expenses, or Taxes [Text] | (reflects no deduction for fees, expenses or taxes) | ||||||||||||||||||||||||||||||||||||||||||||||||||||||||||||||||||||||||||||||||||||||||||||||||||||||||||||||
| Performance Table Closing [Text Block] | After-tax returns are calculated using the historical highest individual federal marginal income tax rates and do not reflect the impact of state and local taxes. Actual after-tax returns depend on an investor's tax situation and may differ from those shown, and after-tax returns shown are not relevant to investors who hold their Fund shares through tax-advantaged arrangements, such as 401(k) plans, 529 college savings plans or individual retirement accounts.
|
||||||||||||||||||||||||||||||||||||||||||||||||||||||||||||||||||||||||||||||||||||||||||||||||||||||||||||||
| Performance Availability Website Address [Text] | www.invesco.com/us | ||||||||||||||||||||||||||||||||||||||||||||||||||||||||||||||||||||||||||||||||||||||||||||||||||||||||||||||
| INVESCO S&P 500 INDEX FUND | INVESCO S&P 500 INDEX FUND | |||||||||||||||||||||||||||||||||||||||||||||||||||||||||||||||||||||||||||||||||||||||||||||||||||||||||||||||
| Prospectus [Line Items] | |||||||||||||||||||||||||||||||||||||||||||||||||||||||||||||||||||||||||||||||||||||||||||||||||||||||||||||||
| Bar Chart and Performance Table [Heading] | Performance Information | ||||||||||||||||||||||||||||||||||||||||||||||||||||||||||||||||||||||||||||||||||||||||||||||||||||||||||||||
| Performance Narrative [Text Block] | The bar chart and performance table provide an indication of the risks of investing in the Fund. The bar chart shows changes in the performance of the Fund from year to year as of December 31. The performance table compares the Fund's performance to that of a broad-based securities market benchmark. The Fund's past performance (before and after taxes) is not necessarily an indication of its future performance. Fund performance reflects any applicable fee waivers and expense reimbursements. Performance returns would be lower without applicable fee waivers and expense reimbursements.
All Fund performance shown assumes the reinvestment of dividends and capital gains and the effect of the Fund’s expenses.
Updated performance information is available on the Fund's website at www.invesco.com/us.
|
||||||||||||||||||||||||||||||||||||||||||||||||||||||||||||||||||||||||||||||||||||||||||||||||||||||||||||||
| Performance Past Does Not Indicate Future [Text] | The Fund's past performance (before and after taxes) is not necessarily an indication of its future performance. | ||||||||||||||||||||||||||||||||||||||||||||||||||||||||||||||||||||||||||||||||||||||||||||||||||||||||||||||
| Performance Information Illustrates Variability of Returns [Text] | The bar chart and performance table provide an indication of the risks of investing in the Fund. | ||||||||||||||||||||||||||||||||||||||||||||||||||||||||||||||||||||||||||||||||||||||||||||||||||||||||||||||
| Bar Chart Narrative [Text Block] | The bar chart does not reflect sales loads. If it did, the annual total returns shown would be lower.
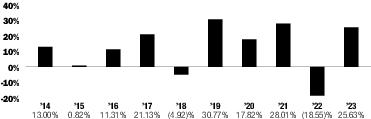
|
||||||||||||||||||||||||||||||||||||||||||||||||||||||||||||||||||||||||||||||||||||||||||||||||||||||||||||||
| Bar Chart Does Not Reflect Sales Loads [Text] | The bar chart does not reflect sales loads. If it did, the annual total returns shown would be lower. | ||||||||||||||||||||||||||||||||||||||||||||||||||||||||||||||||||||||||||||||||||||||||||||||||||||||||||||||
| Bar Chart [Heading] | Annual Total Returns | ||||||||||||||||||||||||||||||||||||||||||||||||||||||||||||||||||||||||||||||||||||||||||||||||||||||||||||||
| Bar Chart [Table] |
|
||||||||||||||||||||||||||||||||||||||||||||||||||||||||||||||||||||||||||||||||||||||||||||||||||||||||||||||
| Bar Chart Closing [Text Block] |
|
||||||||||||||||||||||||||||||||||||||||||||||||||||||||||||||||||||||||||||||||||||||||||||||||||||||||||||||
| Year to Date Return, Label [Optional Text] | Year-to-date | ||||||||||||||||||||||||||||||||||||||||||||||||||||||||||||||||||||||||||||||||||||||||||||||||||||||||||||||
| Bar Chart, Year to Date Return | 21.58% | ||||||||||||||||||||||||||||||||||||||||||||||||||||||||||||||||||||||||||||||||||||||||||||||||||||||||||||||
| Bar Chart, Year to Date Return, Date | Sep. 30, 2024 | ||||||||||||||||||||||||||||||||||||||||||||||||||||||||||||||||||||||||||||||||||||||||||||||||||||||||||||||
| Highest Quarterly Return, Label [Optional Text] | Best Quarter | ||||||||||||||||||||||||||||||||||||||||||||||||||||||||||||||||||||||||||||||||||||||||||||||||||||||||||||||
| Highest Quarterly Return | 20.41% | ||||||||||||||||||||||||||||||||||||||||||||||||||||||||||||||||||||||||||||||||||||||||||||||||||||||||||||||
| Highest Quarterly Return, Date | Jun. 30, 2020 | ||||||||||||||||||||||||||||||||||||||||||||||||||||||||||||||||||||||||||||||||||||||||||||||||||||||||||||||
| Lowest Quarterly Return, Label [Optional Text] | Worst Quarter | ||||||||||||||||||||||||||||||||||||||||||||||||||||||||||||||||||||||||||||||||||||||||||||||||||||||||||||||
| Lowest Quarterly Return | (19.70%) | ||||||||||||||||||||||||||||||||||||||||||||||||||||||||||||||||||||||||||||||||||||||||||||||||||||||||||||||
| Lowest Quarterly Return, Date | Mar. 31, 2020 | ||||||||||||||||||||||||||||||||||||||||||||||||||||||||||||||||||||||||||||||||||||||||||||||||||||||||||||||
| Performance Table Heading | Average Annual Total Returns (for the periods ended December 31, 2023) | ||||||||||||||||||||||||||||||||||||||||||||||||||||||||||||||||||||||||||||||||||||||||||||||||||||||||||||||
| Performance Table Uses Highest Federal Rate | After-tax returns are calculated using the historical highest individual federal marginal income tax rates and do not reflect the impact of state and local taxes. | ||||||||||||||||||||||||||||||||||||||||||||||||||||||||||||||||||||||||||||||||||||||||||||||||||||||||||||||
| Performance Table Not Relevant to Tax Deferred | Actual after-tax returns depend on an investor's tax situation and may differ from those shown, and after-tax returns shown are not relevant to investors who hold their Fund shares through tax-advantaged arrangements, such as 401(k) plans, 529 college savings plans or individual retirement accounts. | ||||||||||||||||||||||||||||||||||||||||||||||||||||||||||||||||||||||||||||||||||||||||||||||||||||||||||||||
| Performance [Table] |
1
Performance shown prior to the inception date is that of the Fund’s Class A shares at net asset value and includes the 12b-1 fees applicable to that class. Although invested in the same portfolio of securities, Class R6 shares' returns of the Fund will be different from Class A shares' returns of the Fund as they have different expenses. |
||||||||||||||||||||||||||||||||||||||||||||||||||||||||||||||||||||||||||||||||||||||||||||||||||||||||||||||
| Performance Table One Class of after Tax Shown [Text] | After-tax returns are shown for Class A shares only and after-tax returns for other classes will vary. | ||||||||||||||||||||||||||||||||||||||||||||||||||||||||||||||||||||||||||||||||||||||||||||||||||||||||||||||
| Index No Deduction for Fees, Expenses, or Taxes [Text] | (reflects no deduction for fees, expenses or taxes) | ||||||||||||||||||||||||||||||||||||||||||||||||||||||||||||||||||||||||||||||||||||||||||||||||||||||||||||||
| Performance Table Closing [Text Block] | After-tax returns are calculated using the historical highest individual federal marginal income tax rates and do not reflect the impact of state and local taxes. Actual after-tax returns depend on an investor's tax situation and may differ from those shown, and after-tax returns shown are not relevant to investors who hold their Fund shares through tax-advantaged arrangements, such as 401(k) plans, 529 college savings plans or individual retirement accounts. After-tax returns are shown for Class A shares only and after-tax returns for other classes will vary.
|
||||||||||||||||||||||||||||||||||||||||||||||||||||||||||||||||||||||||||||||||||||||||||||||||||||||||||||||
| Performance Availability Website Address [Text] | www.invesco.com/us | ||||||||||||||||||||||||||||||||||||||||||||||||||||||||||||||||||||||||||||||||||||||||||||||||||||||||||||||
| Invesco Senior Floating Rate Fund | Invesco Senior Floating Rate Fund | |||||||||||||||||||||||||||||||||||||||||||||||||||||||||||||||||||||||||||||||||||||||||||||||||||||||||||||||
| Prospectus [Line Items] | |||||||||||||||||||||||||||||||||||||||||||||||||||||||||||||||||||||||||||||||||||||||||||||||||||||||||||||||
| Bar Chart and Performance Table [Heading] | Performance Information | ||||||||||||||||||||||||||||||||||||||||||||||||||||||||||||||||||||||||||||||||||||||||||||||||||||||||||||||
| Performance Narrative [Text Block] | The bar chart and performance table provide an indication of the risks of investing in the Fund. The Fund has adopted the performance of the Oppenheimer Senior Floating Rate Fund (the predecessor fund) as the result of a reorganization consummated after the close of business on May 24, 2019 (the “Reorganization”). Prior to the Reorganization, the Fund had not yet commenced operations. The bar chart shows changes in the performance of the predecessor fund and the Fund from year to year as of December 31. The performance table compares the predecessor fund’s and the Fund’s performance to that of a broad measure of market performance and an additional index with characteristics relevant to the Fund. The Fund’s (and the predecessor fund’s) past performance (before and after taxes) is not necessarily an indication of how the Fund will perform in the future.
The returns shown for periods ending on or prior to May 24, 2019 are those of the Class A, Class C, Class R, Class Y and Class I shares of the predecessor fund. Class A, Class C, Class R, Class Y and Class I shares of the predecessor fund were reorganized into Class A, Class C, Class R, Class Y and Class R6 shares, respectively, of the Fund after the close of business on May 24, 2019. Class A, Class C, Class R, Class Y and Class R6 shares’ returns of the Fund will be different from the returns of the predecessor fund as they have different expenses.
Fund performance reflects any applicable fee waivers and expense reimbursements. Performance returns would be lower without applicable fee waivers and expense reimbursements.
All Fund performance shown assumes the reinvestment of dividends and capital gains and the effect of the Fund’s expenses.
Updated performance information is available on the Fund’s website at www.invesco.com/us.
|
||||||||||||||||||||||||||||||||||||||||||||||||||||||||||||||||||||||||||||||||||||||||||||||||||||||||||||||
| Performance Past Does Not Indicate Future [Text] | The Fund’s (and the predecessor fund’s) past performance (before and after taxes) is not necessarily an indication of how the Fund will perform in the future. | ||||||||||||||||||||||||||||||||||||||||||||||||||||||||||||||||||||||||||||||||||||||||||||||||||||||||||||||
| Performance Information Illustrates Variability of Returns [Text] | The bar chart and performance table provide an indication of the risks of investing in the Fund. | ||||||||||||||||||||||||||||||||||||||||||||||||||||||||||||||||||||||||||||||||||||||||||||||||||||||||||||||
| Bar Chart Narrative [Text Block] | The bar chart does not reflect sales loads. If it did, the annual total returns shown would be lower.
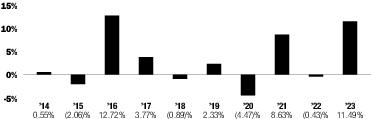
|
||||||||||||||||||||||||||||||||||||||||||||||||||||||||||||||||||||||||||||||||||||||||||||||||||||||||||||||
| Bar Chart Does Not Reflect Sales Loads [Text] | The bar chart does not reflect sales loads. If it did, the annual total returns shown would be lower. | ||||||||||||||||||||||||||||||||||||||||||||||||||||||||||||||||||||||||||||||||||||||||||||||||||||||||||||||
| Bar Chart [Heading] | Annual Total Returns | ||||||||||||||||||||||||||||||||||||||||||||||||||||||||||||||||||||||||||||||||||||||||||||||||||||||||||||||
| Bar Chart [Table] |
|
||||||||||||||||||||||||||||||||||||||||||||||||||||||||||||||||||||||||||||||||||||||||||||||||||||||||||||||
| Bar Chart Closing [Text Block] |
|
||||||||||||||||||||||||||||||||||||||||||||||||||||||||||||||||||||||||||||||||||||||||||||||||||||||||||||||
| Year to Date Return, Label [Optional Text] | Year-to-date | ||||||||||||||||||||||||||||||||||||||||||||||||||||||||||||||||||||||||||||||||||||||||||||||||||||||||||||||
| Bar Chart, Year to Date Return | 6.49% | ||||||||||||||||||||||||||||||||||||||||||||||||||||||||||||||||||||||||||||||||||||||||||||||||||||||||||||||
| Bar Chart, Year to Date Return, Date | Sep. 30, 2024 | ||||||||||||||||||||||||||||||||||||||||||||||||||||||||||||||||||||||||||||||||||||||||||||||||||||||||||||||
| Highest Quarterly Return, Label [Optional Text] | Best Quarter | ||||||||||||||||||||||||||||||||||||||||||||||||||||||||||||||||||||||||||||||||||||||||||||||||||||||||||||||
| Highest Quarterly Return | 5.09% | ||||||||||||||||||||||||||||||||||||||||||||||||||||||||||||||||||||||||||||||||||||||||||||||||||||||||||||||
| Highest Quarterly Return, Date | Jun. 30, 2020 | ||||||||||||||||||||||||||||||||||||||||||||||||||||||||||||||||||||||||||||||||||||||||||||||||||||||||||||||
| Lowest Quarterly Return, Label [Optional Text] | Worst Quarter | ||||||||||||||||||||||||||||||||||||||||||||||||||||||||||||||||||||||||||||||||||||||||||||||||||||||||||||||
| Lowest Quarterly Return | (15.83%) | ||||||||||||||||||||||||||||||||||||||||||||||||||||||||||||||||||||||||||||||||||||||||||||||||||||||||||||||
| Lowest Quarterly Return, Date | Mar. 31, 2020 | ||||||||||||||||||||||||||||||||||||||||||||||||||||||||||||||||||||||||||||||||||||||||||||||||||||||||||||||
| Performance Table Heading | Average Annual Total Returns (for the periods ended December 31, 2023) | ||||||||||||||||||||||||||||||||||||||||||||||||||||||||||||||||||||||||||||||||||||||||||||||||||||||||||||||
| Performance Table Market Index Changed | The “Custom Invesco Senior Floating Rate Index” reflects the performance of the Credit Suisse Leveraged Loan Index through September 30, 2014 and the J.P. Morgan Leveraged Loan Index from October 1, 2014. | ||||||||||||||||||||||||||||||||||||||||||||||||||||||||||||||||||||||||||||||||||||||||||||||||||||||||||||||
| Performance Table Uses Highest Federal Rate | After-tax returns are calculated using the historical highest individual federal marginal income tax rates and do not reflect the impact of state and local taxes. | ||||||||||||||||||||||||||||||||||||||||||||||||||||||||||||||||||||||||||||||||||||||||||||||||||||||||||||||
| Performance Table Not Relevant to Tax Deferred | Actual after-tax returns depend on an investor's tax situation and may differ from those shown, and after-tax returns shown are not relevant to investors who hold their Fund shares through tax-advantaged arrangements, such as 401(k) plans, 529 college savings plans or individual retirement accounts. | ||||||||||||||||||||||||||||||||||||||||||||||||||||||||||||||||||||||||||||||||||||||||||||||||||||||||||||||
| Performance [Table] |
1
Performance shown prior to the inception date is that of the predecessor fund’s Class A shares at net asset value and includes the 12b-1 fees applicable to that class. Although invested in the same portfolio of securities, Class R5 shares' returns of the Fund will be different from Class A shares' returns of the predecessor fund as they have different expenses. 2
The “Custom Invesco Senior Floating Rate Index” reflects the performance of the Credit Suisse Leveraged Loan Index through September 30, 2014 and the J.P. Morgan Leveraged Loan Index from October 1, 2014. |
||||||||||||||||||||||||||||||||||||||||||||||||||||||||||||||||||||||||||||||||||||||||||||||||||||||||||||||
| Performance Table One Class of after Tax Shown [Text] | After-tax returns are shown for Class A shares only and after-tax returns for other classes will vary. | ||||||||||||||||||||||||||||||||||||||||||||||||||||||||||||||||||||||||||||||||||||||||||||||||||||||||||||||
| Index No Deduction for Fees, Expenses, or Taxes [Text] | (reflects no deduction for fees, expenses or taxes) | ||||||||||||||||||||||||||||||||||||||||||||||||||||||||||||||||||||||||||||||||||||||||||||||||||||||||||||||
| Performance Table Closing [Text Block] | After-tax returns are calculated using the historical highest individual federal marginal income tax rates and do not reflect the impact of state and local taxes. Actual after-tax returns depend on an investor's tax situation and may differ from those shown, and after-tax returns shown are not relevant to investors who hold their Fund shares through tax-advantaged arrangements, such as 401(k) plans, 529 college savings plans or individual retirement accounts. After-tax returns are shown for Class A shares only and after-tax returns for other classes will vary.
|
||||||||||||||||||||||||||||||||||||||||||||||||||||||||||||||||||||||||||||||||||||||||||||||||||||||||||||||
| Performance Availability Website Address [Text] | www.invesco.com/us | ||||||||||||||||||||||||||||||||||||||||||||||||||||||||||||||||||||||||||||||||||||||||||||||||||||||||||||||
| Invesco Short Duration High Yield Municipal Fund | Invesco Short Duration High Yield Municipal Fund | |||||||||||||||||||||||||||||||||||||||||||||||||||||||||||||||||||||||||||||||||||||||||||||||||||||||||||||||
| Prospectus [Line Items] | |||||||||||||||||||||||||||||||||||||||||||||||||||||||||||||||||||||||||||||||||||||||||||||||||||||||||||||||
| Bar Chart and Performance Table [Heading] | Performance Information | ||||||||||||||||||||||||||||||||||||||||||||||||||||||||||||||||||||||||||||||||||||||||||||||||||||||||||||||
| Performance Narrative [Text Block] | The bar chart and performance table provide an indication of the risks of investing in the Fund. The bar chart shows changes in the performance of the Fund from year to year as of December 31. The performance table compares the Fund's performance to that of style-specific benchmarks and broad-based securities market benchmarks (in that order). The Fund's past performance (before and after taxes) is not necessarily an indication of its future performance. Fund performance reflects any applicable fee waivers and expense reimbursements. Performance returns would be lower without applicable fee waivers and expense reimbursements. All Fund performance shown assumes the reinvestment of dividends and capital gains and the effect of the Fund’s expenses. Updated performance information is available on the Fund's website at www.invesco.com/us.
|
||||||||||||||||||||||||||||||||||||||||||||||||||||||||||||||||||||||||||||||||||||||||||||||||||||||||||||||
| Performance Past Does Not Indicate Future [Text] | The Fund's past performance (before and after taxes) is not necessarily an indication of its future performance. | ||||||||||||||||||||||||||||||||||||||||||||||||||||||||||||||||||||||||||||||||||||||||||||||||||||||||||||||
| Performance Information Illustrates Variability of Returns [Text] | The bar chart and performance table provide an indication of the risks of investing in the Fund. | ||||||||||||||||||||||||||||||||||||||||||||||||||||||||||||||||||||||||||||||||||||||||||||||||||||||||||||||
| Bar Chart Narrative [Text Block] | The bar chart does not reflect sales loads. If it did, the annual total returns shown would be lower.
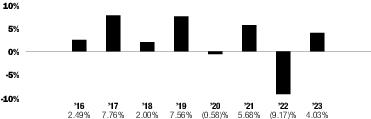
|
||||||||||||||||||||||||||||||||||||||||||||||||||||||||||||||||||||||||||||||||||||||||||||||||||||||||||||||
| Bar Chart Does Not Reflect Sales Loads [Text] | The bar chart does not reflect sales loads. If it did, the annual total returns shown would be lower. | ||||||||||||||||||||||||||||||||||||||||||||||||||||||||||||||||||||||||||||||||||||||||||||||||||||||||||||||
| Bar Chart [Heading] | Annual Total Returns | ||||||||||||||||||||||||||||||||||||||||||||||||||||||||||||||||||||||||||||||||||||||||||||||||||||||||||||||
| Bar Chart [Table] |
|
||||||||||||||||||||||||||||||||||||||||||||||||||||||||||||||||||||||||||||||||||||||||||||||||||||||||||||||
| Bar Chart Closing [Text Block] |
|
||||||||||||||||||||||||||||||||||||||||||||||||||||||||||||||||||||||||||||||||||||||||||||||||||||||||||||||
| Year to Date Return, Label [Optional Text] | Year-to-date | ||||||||||||||||||||||||||||||||||||||||||||||||||||||||||||||||||||||||||||||||||||||||||||||||||||||||||||||
| Bar Chart, Year to Date Return | 6.43% | ||||||||||||||||||||||||||||||||||||||||||||||||||||||||||||||||||||||||||||||||||||||||||||||||||||||||||||||
| Bar Chart, Year to Date Return, Date | Sep. 30, 2024 | ||||||||||||||||||||||||||||||||||||||||||||||||||||||||||||||||||||||||||||||||||||||||||||||||||||||||||||||
| Highest Quarterly Return, Label [Optional Text] | Best Quarter | ||||||||||||||||||||||||||||||||||||||||||||||||||||||||||||||||||||||||||||||||||||||||||||||||||||||||||||||
| Highest Quarterly Return | 4.72% | ||||||||||||||||||||||||||||||||||||||||||||||||||||||||||||||||||||||||||||||||||||||||||||||||||||||||||||||
| Highest Quarterly Return, Date | Dec. 31, 2023 | ||||||||||||||||||||||||||||||||||||||||||||||||||||||||||||||||||||||||||||||||||||||||||||||||||||||||||||||
| Lowest Quarterly Return, Label [Optional Text] | Worst Quarter | ||||||||||||||||||||||||||||||||||||||||||||||||||||||||||||||||||||||||||||||||||||||||||||||||||||||||||||||
| Lowest Quarterly Return | (6.93%) | ||||||||||||||||||||||||||||||||||||||||||||||||||||||||||||||||||||||||||||||||||||||||||||||||||||||||||||||
| Lowest Quarterly Return, Date | Mar. 31, 2020 | ||||||||||||||||||||||||||||||||||||||||||||||||||||||||||||||||||||||||||||||||||||||||||||||||||||||||||||||
| Performance Table Heading | Average Annual Total Returns (for the periods ended December 31, 2023) | ||||||||||||||||||||||||||||||||||||||||||||||||||||||||||||||||||||||||||||||||||||||||||||||||||||||||||||||
| Performance Table Market Index Changed | Effective April 1, 2024, the Fund changed its broad-based securities market benchmark from the Bloomberg U.S. Aggregate Bond Index to the S&P Municipal Bond Index. The Fund believes the S&P Municipal Bond Index is a more appropriate comparison for evaluating the Fund’s performance. | ||||||||||||||||||||||||||||||||||||||||||||||||||||||||||||||||||||||||||||||||||||||||||||||||||||||||||||||
| Performance Table Uses Highest Federal Rate | After-tax returns are calculated using the historical highest individual federal marginal income tax rates and do not reflect the impact of state and local taxes. | ||||||||||||||||||||||||||||||||||||||||||||||||||||||||||||||||||||||||||||||||||||||||||||||||||||||||||||||
| Performance Table Not Relevant to Tax Deferred | Actual after-tax returns depend on an investor's tax situation and may differ from those shown, and after-tax returns shown are not relevant to investors who hold their Fund shares through tax-advantaged arrangements, such as 401(k) plans, 529 college savings plans or individual retirement accounts. | ||||||||||||||||||||||||||||||||||||||||||||||||||||||||||||||||||||||||||||||||||||||||||||||||||||||||||||||
| Performance [Table] |
1
Performance shown prior to the inception date is that of the Fund's Class A shares at net asset value and includes the 12b-1 fees applicable to that class. Although invested in the same portfolio of securities, Class R6 shares' returns of the Fund will be different from Class A shares' returns of the Fund as they have different expenses. 2
The Custom Invesco Short Duration High Yield Municipal Index is composed of 60% S&P Municipal Bond High Yield Index and 40% S&P Municipal Bond Short Index. 3
Effective April 1, 2024, the Fund changed its broad-based securities market benchmark from the Bloomberg U.S. Aggregate Bond Index to the S&P Municipal Bond Index. The Fund believes the S&P Municipal Bond Index is a more appropriate comparison for evaluating the Fund’s performance. |
||||||||||||||||||||||||||||||||||||||||||||||||||||||||||||||||||||||||||||||||||||||||||||||||||||||||||||||
| Performance Table One Class of after Tax Shown [Text] | After-tax returns are shown for Class A shares only and after-tax returns for other classes will vary. | ||||||||||||||||||||||||||||||||||||||||||||||||||||||||||||||||||||||||||||||||||||||||||||||||||||||||||||||
| Index No Deduction for Fees, Expenses, or Taxes [Text] | (reflects no deduction for fees, expenses or taxes) | ||||||||||||||||||||||||||||||||||||||||||||||||||||||||||||||||||||||||||||||||||||||||||||||||||||||||||||||
| Performance Table Closing [Text Block] | After-tax returns are calculated using the historical highest individual federal marginal income tax rates and do not reflect the impact of state and local taxes. Actual after-tax returns depend on an investor's tax situation and may differ from those shown, and after-tax returns shown are not relevant to investors who hold their Fund shares through tax-advantaged arrangements, such as 401(k) plans, 529 college savings plans or individual retirement accounts. After-tax returns are shown for Class A shares only and after-tax returns for other classes will vary.
|
||||||||||||||||||||||||||||||||||||||||||||||||||||||||||||||||||||||||||||||||||||||||||||||||||||||||||||||
| Performance Availability Website Address [Text] | www.invesco.com/us | ||||||||||||||||||||||||||||||||||||||||||||||||||||||||||||||||||||||||||||||||||||||||||||||||||||||||||||||
| Invesco Short Term Municipal Fund | Invesco Short Term Municipal Fund | |||||||||||||||||||||||||||||||||||||||||||||||||||||||||||||||||||||||||||||||||||||||||||||||||||||||||||||||
| Prospectus [Line Items] | |||||||||||||||||||||||||||||||||||||||||||||||||||||||||||||||||||||||||||||||||||||||||||||||||||||||||||||||
| Bar Chart and Performance Table [Heading] | Performance Information | ||||||||||||||||||||||||||||||||||||||||||||||||||||||||||||||||||||||||||||||||||||||||||||||||||||||||||||||
| Performance Narrative [Text Block] | The bar chart and performance table provide an indication of the risks of investing in the Fund. The Fund has adopted the performance of the Oppenheimer Short Term Municipal Fund (the predecessor fund) as the result of a reorganization of the predecessor fund into the Fund, which was consummated after the close of business on May 24, 2019 (the “Reorganization”). Prior to the Reorganization, the Fund had not yet commenced operations. The bar chart shows changes in the performance of the predecessor fund and the Fund from year to year as of December 31. The performance table compares the predecessor fund’s and the Fund’s performance to that of a broad measure of market performance and an additional index with characteristics relevant to the Fund. The Fund’s (and the predecessor fund’s) past performance (before and after taxes) is not necessarily an indication of how the Fund will perform in the future.
Fund performance reflects any applicable fee waivers and expense reimbursements. Performance returns would be lower without applicable fee waivers and expense reimbursements.
All Fund performance shown assumes the reinvestment of dividends and capital gains and the effect of the Fund’s expenses.
Updated performance information is available on the Fund’s website at www.invesco.com/us.
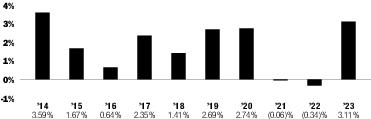
|
||||||||||||||||||||||||||||||||||||||||||||||||||||||||||||||||||||||||||||||||||||||||||||||||||||||||||||||
| Performance Past Does Not Indicate Future [Text] | The Fund’s (and the predecessor fund’s) past performance (before and after taxes) is not necessarily an indication of how the Fund will perform in the future. | ||||||||||||||||||||||||||||||||||||||||||||||||||||||||||||||||||||||||||||||||||||||||||||||||||||||||||||||
| Performance Information Illustrates Variability of Returns [Text] | The bar chart and performance table provide an indication of the risks of investing in the Fund. | ||||||||||||||||||||||||||||||||||||||||||||||||||||||||||||||||||||||||||||||||||||||||||||||||||||||||||||||
| Bar Chart [Heading] | Annual Total Returns | ||||||||||||||||||||||||||||||||||||||||||||||||||||||||||||||||||||||||||||||||||||||||||||||||||||||||||||||
| Bar Chart [Table] |
|
||||||||||||||||||||||||||||||||||||||||||||||||||||||||||||||||||||||||||||||||||||||||||||||||||||||||||||||
| Bar Chart Closing [Text Block] |
|
||||||||||||||||||||||||||||||||||||||||||||||||||||||||||||||||||||||||||||||||||||||||||||||||||||||||||||||
| Year to Date Return, Label [Optional Text] | Year-to-date | ||||||||||||||||||||||||||||||||||||||||||||||||||||||||||||||||||||||||||||||||||||||||||||||||||||||||||||||
| Bar Chart, Year to Date Return | 2.44% | ||||||||||||||||||||||||||||||||||||||||||||||||||||||||||||||||||||||||||||||||||||||||||||||||||||||||||||||
| Bar Chart, Year to Date Return, Date | Sep. 30, 2024 | ||||||||||||||||||||||||||||||||||||||||||||||||||||||||||||||||||||||||||||||||||||||||||||||||||||||||||||||
| Highest Quarterly Return, Label [Optional Text] | Best Quarter | ||||||||||||||||||||||||||||||||||||||||||||||||||||||||||||||||||||||||||||||||||||||||||||||||||||||||||||||
| Highest Quarterly Return | 2.16% | ||||||||||||||||||||||||||||||||||||||||||||||||||||||||||||||||||||||||||||||||||||||||||||||||||||||||||||||
| Highest Quarterly Return, Date | Dec. 31, 2023 | ||||||||||||||||||||||||||||||||||||||||||||||||||||||||||||||||||||||||||||||||||||||||||||||||||||||||||||||
| Lowest Quarterly Return, Label [Optional Text] | Worst Quarter | ||||||||||||||||||||||||||||||||||||||||||||||||||||||||||||||||||||||||||||||||||||||||||||||||||||||||||||||
| Lowest Quarterly Return | (0.96%) | ||||||||||||||||||||||||||||||||||||||||||||||||||||||||||||||||||||||||||||||||||||||||||||||||||||||||||||||
| Lowest Quarterly Return, Date | Dec. 31, 2016 | ||||||||||||||||||||||||||||||||||||||||||||||||||||||||||||||||||||||||||||||||||||||||||||||||||||||||||||||
| Performance Table Heading | Average Annual Total Returns (for the periods ended December 31, 2023) | ||||||||||||||||||||||||||||||||||||||||||||||||||||||||||||||||||||||||||||||||||||||||||||||||||||||||||||||
| Performance Table Market Index Changed | Effective April 1, 2024, the Fund changed its broad-based securities market benchmark from the Bloomberg U.S. Aggregate Bond Index to the S&P Municipal Bond Index. The Fund believes the S&P Municipal Bond Index is a more appropriate comparison for evaluating the Fund’s performance. | ||||||||||||||||||||||||||||||||||||||||||||||||||||||||||||||||||||||||||||||||||||||||||||||||||||||||||||||
| Performance Table Uses Highest Federal Rate | After-tax returns are calculated using the historical highest individual federal marginal income tax rates and do not reflect the impact of state and local taxes. | ||||||||||||||||||||||||||||||||||||||||||||||||||||||||||||||||||||||||||||||||||||||||||||||||||||||||||||||
| Performance Table Not Relevant to Tax Deferred | Actual after-tax returns depend on an investor's tax situation and may differ from those shown, and after-tax returns shown are not relevant to investors who hold their Fund shares through tax-advantaged arrangements, such as 401(k) plans, 529 college savings plans or individual retirement accounts. | ||||||||||||||||||||||||||||||||||||||||||||||||||||||||||||||||||||||||||||||||||||||||||||||||||||||||||||||
| Performance [Table] |
1
Performance shown prior to the inception date is that of the Fund’s and the predecessor fund’s Class A shares at net asset value and includes the 12b-1 fees applicable to that class. Although invested in the same portfolio of securities, Class R6 shares' returns of the Fund will be different from Class A shares' returns of the Fund and the predecessor fund as they have different expenses. 2
Effective April 1, 2024, the Fund changed its broad-based securities market benchmark from the Bloomberg U.S. Aggregate Bond Index to the S&P Municipal Bond Index. The Fund believes the S&P Municipal Bond Index is a more appropriate comparison for evaluating the Fund’s performance. |
||||||||||||||||||||||||||||||||||||||||||||||||||||||||||||||||||||||||||||||||||||||||||||||||||||||||||||||
| Performance Table One Class of after Tax Shown [Text] | After-tax returns are shown for Class A shares only and after-tax returns for other classes will vary. | ||||||||||||||||||||||||||||||||||||||||||||||||||||||||||||||||||||||||||||||||||||||||||||||||||||||||||||||
| Index No Deduction for Fees, Expenses, or Taxes [Text] | (reflects no deduction for fees, expenses or taxes) | ||||||||||||||||||||||||||||||||||||||||||||||||||||||||||||||||||||||||||||||||||||||||||||||||||||||||||||||
| Performance Table Closing [Text Block] | After-tax returns are calculated using the historical highest individual federal marginal income tax rates and do not reflect the impact of state and local taxes. Actual after-tax returns depend on an investor's tax situation and may differ from those shown, and after-tax returns shown are not relevant to investors who hold their Fund shares through tax-advantaged arrangements, such as 401(k) plans, 529 college savings plans or individual retirement accounts. After-tax returns are shown for Class A shares only and after-tax returns for other classes will vary.
|
||||||||||||||||||||||||||||||||||||||||||||||||||||||||||||||||||||||||||||||||||||||||||||||||||||||||||||||
| Performance Availability Website Address [Text] | www.invesco.com/us | ||||||||||||||||||||||||||||||||||||||||||||||||||||||||||||||||||||||||||||||||||||||||||||||||||||||||||||||
| Invesco SMA Municipal Bond Fund | Invesco SMA Municipal Bond Fund | |||||||||||||||||||||||||||||||||||||||||||||||||||||||||||||||||||||||||||||||||||||||||||||||||||||||||||||||
| Prospectus [Line Items] | |||||||||||||||||||||||||||||||||||||||||||||||||||||||||||||||||||||||||||||||||||||||||||||||||||||||||||||||
| Bar Chart and Performance Table [Heading] | Performance Information | ||||||||||||||||||||||||||||||||||||||||||||||||||||||||||||||||||||||||||||||||||||||||||||||||||||||||||||||
| Performance Narrative [Text Block] | No performance information is available for the Fund because it has not yet completed a full calendar year of operations. In the future, the Fund will disclose performance information in a bar chart and performance table. Such disclosure will give some indication of the risks of an investment in the Fund by comparing the Fund’s performance with a broad measure of market performance and an additional index with characteristics similar to the Fund, along with showing changes in the Fund’s performance from year to year. Past performance (before and after taxes) is not necessarily an indication of its future performance. In addition, performance does not reflect the fees and expenses paid by participants at the wrap fee, separately managed or other discretionary account level. You should evaluate the performance of the Fund in the context of your managed account program.
|
||||||||||||||||||||||||||||||||||||||||||||||||||||||||||||||||||||||||||||||||||||||||||||||||||||||||||||||
| Performance Past Does Not Indicate Future [Text] | Past performance (before and after taxes) is not necessarily an indication of its future performance. | ||||||||||||||||||||||||||||||||||||||||||||||||||||||||||||||||||||||||||||||||||||||||||||||||||||||||||||||
| Performance One Year or Less [Text] | No performance information is available for the Fund because it has not yet completed a full calendar year of operations. | ||||||||||||||||||||||||||||||||||||||||||||||||||||||||||||||||||||||||||||||||||||||||||||||||||||||||||||||