The AXS Market Neutral Fund (the “Fund”) seeks long-term growth of capital independent of stock market direction.
This table describes the fees and expenses that you may pay if you buy, hold and sell shares of the Fund. You may pay other fees, such as brokerage commissions and other fees to financial intermediaries, which are not reflected in the table and example below.
Shareholder Fees - AXS Market Neutral Fund - USD ($) |
Investor Class Shares |
Class I Shares |
|---|---|---|
| Redemption fee if redeemed within 30 days of purchase (as a percentage of amount redeemed) | 1.00% | 1.00% |
| Wire fee | $ 20 | $ 20 |
| Overnight check delivery fee | 25 | 25 |
| Retirement account fees (annual maintenance fee) | $ 15 | $ 15 |
Annual Fund Operating Expenses - AXS Market Neutral Fund |
Investor Class Shares |
Class I Shares |
|
|---|---|---|---|
| Management fees | [1] | 1.40% | 1.40% |
| Distribution (Rule 12b-1) fees | [1] | 0.25% | none |
| Other expenses | [1] | 1.06% | 1.06% |
| Acquired fund fees and expenses | [1],[2] | 0.89% | 0.89% |
| Total annual fund operating expenses | [1] | 3.60% | 3.35% |
| Fee Waivers and Expense Reimbursement | [1],[3] | (1.01%) | (1.01%) |
| Total annual fund operating expenses after fee waivers and expense reimbursement | [1],[3] | 2.59% | 2.34% |
| [1] | Annual Fund Operating Expenses have been restated to reflect current fees, as of December 19, 2024. |
| [2] | Acquired fund fees and expenses are based on estimated amounts for the current fiscal year. |
| [3] | The Fund’s advisor has contractually agreed to waive its fees and/or pay for operating expenses of the Fund to ensure that total annual fund operating expenses (excluding any taxes, leverage interest, brokerage commissions, dividend and interest expenses on short sales, acquired fund fees and expenses (as determined in accordance with SEC Form N-1A), expenses incurred in connection with any merger or reorganization, and extraordinary expenses such as litigation expenses) do not exceed 1.70% and 1.45% of the average daily net assets of the Investor Class shares and Class I shares of the Fund, respectively. This agreement is in effect until January 31, 2026, and it may be terminated before that date only by the Trust’s Board of Trustees. The Fund’s advisor is permitted to seek reimbursement from the Fund, subject to certain limitations, of fees waived or payments made to the Fund for a period ending three years from the date of the waiver or payment. Such reimbursement may be requested from the Fund if the reimbursement will not cause the Fund’s annual expense ratio to exceed the lesser of (a) the expense limitation in effect at the time such fees were waived or payments made, or (b) the expense limitation in effect at the time of the reimbursement. Reimbursements of fees waived or payments made will be made on a “first in, first out” basis so that the oldest fees waived or payments are satisfied first. |
This example is intended to help you compare the cost of investing in the Fund with the cost of investing in other mutual funds. The example assumes that you invest $10,000 in the Fund for the time periods indicated and then redeem all of your shares at the end of those periods. The example also assumes that your investment has a 5% return each year and that the Fund’s operating expenses remain the same. The example reflects the Fund’s contractual fee waiver and/or expense reimbursement only for the term of the contractual fee waiver and/or expense reimbursement.
Although your actual costs may be higher or lower, based on these assumptions your costs would be:
Expense Example - AXS Market Neutral Fund - USD ($) |
One Year |
Three Years |
Five Years |
Ten Years |
|---|---|---|---|---|
| Investor Class Shares | 262 | 1,010 | 1,779 | 3,797 |
| Class I Shares | 237 | 936 | 1,659 | 3,572 |
The Fund pays transaction costs, such as commissions, when it buys and sells securities (or “turns over” its portfolio). A higher portfolio turnover may indicate higher transaction costs and may result in higher taxes when Fund shares are held in a taxable account. These costs, which are not reflected in annual fund operating expenses or in the example, affect the Fund’s performance. During the most recent fiscal year, the Fund’s portfolio turnover rate was 30% of the average value of its portfolio.
The Fund seeks to achieve its investment objective by balancing “long” and “short” positions. To do this, the Fund will invest in pairs of equity securities, such as leveraged and inverse exchange-traded funds (“ETFs”) as well as equities of U.S. companies, in equalized long and short exposures for which AXS Investments LLC, the Fund’s investment advisor (the “Advisor”), believes that the long position of the pairing will outperform the short position over a longer-term basis (at least one-year). Leveraged ETFs are designed to produce returns that are a multiple of the index or security to which they are linked. Inverse ETFs are constructed by using various derivatives for the purpose of profiting from a decline in the value of underlying index or underlying security. The Fund may invest in the securities of issuers of any size.
When the Fund takes a long position, it purchases shares of a stock or ETF outright. The Fund increases in value when the market price of the stock or ETF exceeds the cost per share to acquire the stock or ETF. In addition, the Fund will earn dividend income when dividends are paid on stocks and ETFs owned by the Fund. When the Fund takes a short position, it either: 1) sells at the current market price a stock it does not own but has borrowed, or 2) buys an inverse ETF in anticipation that the market price of the stock or inverse ETF’s underlying index or underlying security will decline or underperform the corresponding long positions in the Fund’s portfolio. To complete, or close out, a short sale transaction, the Fund buys the same stock in the market at a later date and returns it to the lender. To complete or close out an inverse ETF position, the Fund will sell its shares. In a short sale transaction, the Fund will make money if the market price of the borrowed stock goes down further than the borrowing costs, including dividend expenses when stocks held short pay dividends, and the Fund is able to replace the borrowed stock. While it is not guaranteed, the Advisor expects that dividend income will exceed dividend expense on an annual basis. Alternatively, if the price of the stock goes up after the short sale and before the short position is closed, the Fund will lose money on that position because it will have to pay more to replace the borrowed stock than the Fund received when the Fund sold the stock short.
Under normal circumstances, the Fund intends to generally remain “market neutral” on an “exposure-adjusted basis.” As used here, “exposure-adjusted” means that the Fund will periodically equalize the leverage exposure used by the long position in each pair with the short or inverse position of that pair. For example, when the leverage of the short positions is higher than the leverage of the long positions, fewer dollars of short positions are needed to offset the leverage of the
long positions. In this case, the Fund will be “net long” on a dollar basis (i.e., more dollars invested in the long positions than in the short positions), but will still be “market neutral” on an exposure-adjusted basis. An “exposure-adjusted market neutral” strategy typically seeks to derive total returns strictly from stock picking Alpha, with none of the return over time coming from the general up and down movement of the broader stock market (described further below). Over time, since the Fund is exposure-adjusted market neutral, the Fund’s total return is expected to be largely independent of the positive or negative total returns of the broad stock market.
An actively managed stock portfolio’s gross investment return is generally driven by three factors: (i) the overall stock market’s return (i.e., in the Fund’s case, the overall stock market’s return is measured using the S&P 500® Total Return Index, the Fund’s benchmark); (ii) the sensitivity of the portfolio to changes in prices in the overall stock market (i.e., the portfolio’s Beta relative to the stock market); and (iii) the Advisor’s ability to do better or worse than what would be predicted by multiplying the market’s return by the portfolio’s Beta (i.e., (i) times (ii) above). This last component (iii) is called Alpha and is the risk-adjusted outperformance or underperformance of the portfolio relative to the stock market. Since the Fund has generally attempted to hedge all of the overall market’s returns on an exposure-adjusted basis through its short positions, all of the Fund’s net return is expected to be solely the Alpha generated by the Advisor, less all of the Fund’s fees and expenses.
By employing this long/short exposure-adjusted market neutral investment strategy, the Fund seeks to limit its volatility relative to movements in the overall stock market and limit downside risk during market declines. The Fund may achieve a gain if the securities in its long portfolio outperform the securities in its short portfolio, each taken as a whole, even if the short positions generate a loss, as long as the loss in the short portfolio does not exceed the gain in the long portfolio. Conversely, the Fund may incur a loss if the securities in its short portfolio outperform the securities in its long portfolio. The Advisor attempts to achieve returns for the Fund that at least exceed the return on short-term fixed-income securities, with the broader goal of generating attractive risk-adjusted total returns compared to the S&P 500® Total Return Index.
The Fund may use borrowings or short sales for investment purposes (i.e., leverage). The Fund’s use of short positions will add financial leverage that is similar to borrowing money for investment purposes. In determining when and to what extent to employ leverage, the Advisor will consider factors such as the relative risks and returns expected from the portfolio as a whole and the costs of such transactions. Borrowings may be structured as secured or unsecured loans and may have fixed or variable interest rates. The Fund may borrow or use short sales (i.e., leverage) to the maximum extent permitted by the Investment Company Act of 1940, as amended (the “1940 Act”). The Fund will use leverage when the Advisor believes the return from the additional investments will be greater than the costs associated with the borrowing. The Fund may at times hold long and short positions that in the aggregate exceed the value of its net assets (i.e., so that the Fund is effectively leveraged).
The Advisor selects securities for purchase or short sale based on the Advisor’s volatility expectations, in an effort to capture spreads between certain securities. Spreads can occur as a result of the compounding of returns. Accordingly, the Fund may invest in leveraged ETFs that track a multiple of the quarterly or monthly returns of the underlying security or index, and short sell leveraged ETFs that track a multiple of the inverse daily returns of the underlying security or index. In addition, the Fund may hold long or short positions in stocks of U.S. companies and long positions in leveraged inverse ETFs of those companies.
The Advisor will periodically reconstitute and rebalance the Fund’s portfolio, which may result in significant portfolio turnover. A higher rate of portfolio turnover increases transaction expenses, which may negatively affect the Fund’s performance. High portfolio turnover also may result in the realization of substantial net short-term capital gains, which, when distributed, are taxable to shareholders as ordinary income.
The bar chart and table below provide some indication of the risks of investing in the Fund by showing changes in the Fund’s performance from year to year for Class I shares and by showing how the average annual total returns of each class of the Fund compare with the average annual total returns of the S&P 500® Total Return Index, a broad-based market index, and an additional index. Performance for classes other than those shown may vary from the performance shown to the extent the expenses for those classes differ. Updated performance information is available at the Fund’s website, www.axsinvestments.com or by calling the Fund at 1-833-AXS-ALTS (1-833-297-2587). The Fund’s past performance, before and after taxes, is not necessarily an indication of how the Fund will perform in the future.
The Fund acquired the assets and liabilities of the AXS Market Neutral Fund (formerly, the Cognios Market Neutral Large Cap Fund), a series of M3Sixty Funds Trust (the “Predecessor Fund”), following the reorganization of the Predecessor Fund on March 5, 2021. As a result of the acquisition, the Fund is the accounting successor of the Predecessor Fund. Performance results shown in the bar chart and the performance table below for the periods prior to March 5, 2021 reflect the performance of the Predecessor Fund prior to the commencement of the Fund’s operations.
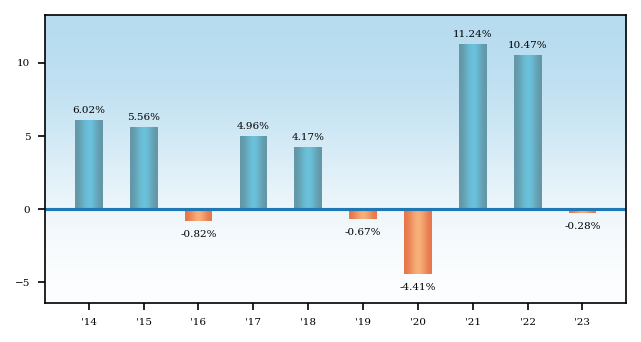
| Class I Shares | ||
| Highest Calendar Quarter Return at NAV | 9.16% | Quarter Ended 12/31/2021 |
| Lowest Calendar Quarter Return at NAV | (5.02)% | Quarter Ended 09/30/2016 |
Average Annual Returns - AXS Market Neutral Fund |
Label |
One Year |
Five Years |
Ten Years |
|||
|---|---|---|---|---|---|---|---|
| Class I Shares | Class I Shares – Return Before Taxes | (0.28%) | 3.08% | 3.60% | |||
| Class I Shares | Return After Taxes on Distributions | Class I Shares – Return After Taxes on Distributions | (0.60%) | [1] | 3.01% | [1] | 3.00% | [1] |
| Class I Shares | Return After Taxes on Distributions and Sale of Fund Shares | Class I Shares – Return After Taxes on Distributions and Sale of Fund Shares | 0.06% | [1] | 2.38% | [1] | 2.59% | [1] |
| Investor Class Shares | Investor Class Shares – Return Before Taxes | (0.59%) | 2.82% | 3.36% | |||
| S&P 500® Total Return Index (reflects no deductions for fees, expenses or taxes) | S&P 500® Total Return Index** (reflects no deductions for fees, expenses or taxes) | 26.29% | [2] | 15.69% | [2] | 12.03% | [2] |
| Bloomberg Aggregate Bond Index (reflects no deductions for fees, expenses or taxes) | Bloomberg Aggregate Bond Index (reflects no deductions for fees, expenses or taxes) | 5.53% | 1.10% | 1.81% | |||
| [1] | After-tax returns are calculated using the historical highest individual federal marginal income tax rates and do not reflect the impact of state and local taxes. Actual after-tax returns depend on an investor’s tax situation and may differ from those shown. After-tax returns shown are not relevant to investors who hold their Fund shares through tax-deferred arrangements, such as 401(k) plans or individual retirement accounts. After-tax returns are shown for Class I Shares only and after-tax returns for classes other than Class I will vary from returns shown for Class I Shares. |
| [2] | The S&P 500® Total Return Index is a broad unmanaged index of 500 stocks, which is widely recognized as representative of the equity market in general. It is a market-value weighted index. Please note that indices do not take into account any fees and expenses of investing in the individual securities that they track, and individuals cannot invest directly in any index. |