v3.24.4
Performance Management
Aug. 31, 2024
Invesco Treasury Portfolio - Cash Management Class | Invesco Treasury Portfolio  
Prospectus [Line Items]  
Bar Chart and Performance Table [Heading] Performance Information
Performance Narrative [Text Block]
The bar chart and performance table provide an indication of the risks of investing in the Fund. The bar chart shows changes in the performance of the Fund from year to year as of December 31. The Fund's past performance is not necessarily an indication of its future performance. Fund performance reflects any applicable fee waivers and expense reimbursements. Performance returns would be lower without applicable fee waivers and expense reimbursements. Updated performance information is available on the Fund's website at www.invesco.com/us.
All Fund performance shown assumes the reinvestment of dividends and capital gains and the effect of the Fund’s expenses.
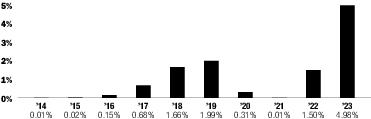
Performance Past Does Not Indicate Future [Text] The Fund's past performance is not necessarily an indication of its future performance.
Performance Information Illustrates Variability of Returns [Text] The bar chart and performance table provide an indication of the risks of investing in the Fund.
Bar Chart [Heading] Annual Total Returns
Bar Chart [Table]
Bar Chart Closing [Text Block]
Cash Management
Period Ended
Returns
Year-to-date
September 30, 2024
3.90%
Best Quarter
December 31, 2023
1.31%
Worst Quarter
December 31, 2021
0.00%
Year to Date Return, Label [Optional Text] Year-to-date
Bar Chart, Year to Date Return 3.90%
Bar Chart, Year to Date Return, Date Sep. 30, 2024
Highest Quarterly Return, Label [Optional Text] Best Quarter
Highest Quarterly Return 1.31%
Highest Quarterly Return, Date Dec. 31, 2023
Lowest Quarterly Return, Label [Optional Text] Worst Quarter
Lowest Quarterly Return none
Lowest Quarterly Return, Date Dec. 31, 2021
Performance Table Heading Average Annual Total Returns (for the periods ended December 31, 2023) 
Performance [Table]
 
Inception
Date
1
Year
5
Years
10
Years
Cash Management Class
8/18/1993
4.98
%
1.74
%
1.12
%
Performance Availability Website Address [Text] www.invesco.com/us
Invesco Government & Agency Portfolio - Cash Management Class | Invesco Government & Agency Portfolio  
Prospectus [Line Items]  
Bar Chart and Performance Table [Heading] Performance Information
Performance Narrative [Text Block]
The bar chart and performance table provide an indication of the risks of investing in the Fund. The bar chart shows changes in the performance of the Fund from year to year as of December 31. The Fund's past performance is not necessarily an indication of its future performance. Fund performance reflects any applicable fee waivers and expense reimbursements. Performance returns would be lower without applicable fee waivers and expense reimbursements. Updated performance information is available on the Fund's website at www.invesco.com/us.
All Fund performance shown assumes the reinvestment of dividends and capital gains and the effect of the Fund’s expenses.
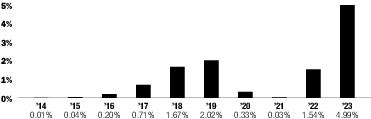
Performance Past Does Not Indicate Future [Text] The Fund's past performance is not necessarily an indication of its future performance.
Performance Information Illustrates Variability of Returns [Text] The bar chart and performance table provide an indication of the risks of investing in the Fund.
Bar Chart [Heading] Annual Total Returns
Bar Chart [Table]
Bar Chart Closing [Text Block]
Cash Management
Period Ended
Returns
Year-to-date
September 30, 2024
3.91%
Best Quarter
December 31, 2023
1.31%
Worst Quarter
December 31, 2020
0.00%
Year to Date Return, Label [Optional Text] Year-to-date
Bar Chart, Year to Date Return 3.91%
Bar Chart, Year to Date Return, Date Sep. 30, 2024
Highest Quarterly Return, Label [Optional Text] Best Quarter
Highest Quarterly Return 1.31%
Highest Quarterly Return, Date Dec. 31, 2023
Lowest Quarterly Return, Label [Optional Text] Worst Quarter
Lowest Quarterly Return none
Lowest Quarterly Return, Date Dec. 31, 2020
Performance Table Heading Average Annual Total Returns (for the periods ended December 31, 2023) 
Performance [Table]
 
Inception
Date
1
Year
5
Years
10
Years
Cash Management Class
9/1/1998
4.99
%
1.77
%
1.14
%
Performance Availability Website Address [Text] www.invesco.com/us
Invesco Treasury Obligations Portfolio - Cash Management Class | Invesco Treasury Obligations Portfolio  
Prospectus [Line Items]  
Bar Chart and Performance Table [Heading] Performance Information
Performance Narrative [Text Block]
The bar chart and performance table provide an indication of the risks of investing in the Fund. The bar chart shows changes in the performance of the Fund from year to year as of December 31. The Fund's past performance is not necessarily an indication of its future performance. Fund performance reflects any applicable fee waivers and expense reimbursements. Performance returns would be lower without applicable fee waivers and expense reimbursements. Updated performance information is available on the Fund's website at www.invesco.com/us.
All Fund performance shown assumes the reinvestment of dividends and capital gains and the effect of the Fund’s expenses.
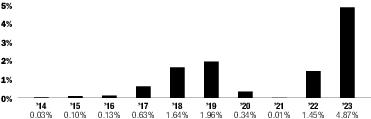
Performance Past Does Not Indicate Future [Text] The Fund's past performance is not necessarily an indication of its future performance.
Performance Information Illustrates Variability of Returns [Text] The bar chart and performance table provide an indication of the risks of investing in the Fund.
Bar Chart [Heading] Annual Total Returns
Bar Chart [Table]
Bar Chart Closing [Text Block]
Cash Management
Period Ended
Returns
Year-to-date
September 30, 2024
3.86%
Best Quarter
December 31, 2023
1.30%
Worst Quarter
December 31, 2021
0.00%
Year to Date Return, Label [Optional Text] Year-to-date
Bar Chart, Year to Date Return 3.86%
Bar Chart, Year to Date Return, Date Sep. 30, 2024
Highest Quarterly Return, Label [Optional Text] Best Quarter
Highest Quarterly Return 1.30%
Highest Quarterly Return, Date Dec. 31, 2023
Lowest Quarterly Return, Label [Optional Text] Worst Quarter
Lowest Quarterly Return none
Lowest Quarterly Return, Date Dec. 31, 2021
Performance Table Heading Average Annual Total Returns (for the periods ended December 31, 2023) 
Performance [Table]
 
Inception
Date
1
Year
5
Years
10
Years
Cash Management Class
12/30/1999
4.87
%
1.71
%
1.11
%
Performance Availability Website Address [Text] www.invesco.com/us
Invesco Treasury Portfolio - CAVU Securities Class | Invesco Treasury Portfolio  
Prospectus [Line Items]  
Bar Chart and Performance Table [Heading] Performance Information
Performance Narrative [Text Block]
The bar chart and performance table provide an indication of the risks of investing in the Fund. The bar chart shows changes in the performance of the Fund from year to year as of December 31. The Fund's past performance is not necessarily an indication of its future performance. Fund performance reflects any applicable fee waivers and expense reimbursements. Performance returns would be lower without applicable fee waivers and expense reimbursements.
All Fund performance shown assumes the reinvestment of dividends and capital gains and the effect of the Fund’s expenses.
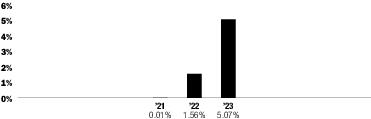
Performance Past Does Not Indicate Future [Text] The Fund's past performance is not necessarily an indication of its future performance.
Performance Information Illustrates Variability of Returns [Text] The bar chart and performance table provide an indication of the risks of investing in the Fund.
Bar Chart [Heading] Annual Total Returns
Bar Chart [Table]
Bar Chart Closing [Text Block]
CAVU Securities
Period Ended
Returns
Year-to-date
September 30, 2024
3.96%
Best Quarter
December 31, 2023
1.33%
Worst Quarter
December 31, 2021
0.00%
Year to Date Return, Label [Optional Text] Year-to-date
Bar Chart, Year to Date Return 3.96%
Bar Chart, Year to Date Return, Date Sep. 30, 2024
Highest Quarterly Return, Label [Optional Text] Best Quarter
Highest Quarterly Return 1.33%
Highest Quarterly Return, Date Dec. 31, 2023
Lowest Quarterly Return, Label [Optional Text] Worst Quarter
Lowest Quarterly Return none
Lowest Quarterly Return, Date Dec. 31, 2021
Performance Table Heading Average Annual Total Returns (for the periods ended December 31, 2023) 
Performance [Table]
 
Inception
Date
1
Year
5
Years
10
Years
CAVU Securities Class1
12/18/2020
5.07
%
1.80
%
1.17
%
1
Performance shown prior to the inception date is that of the Fund’s Institutional Class shares. The inception date of the Fund’s Institutional Class shares is April 12, 1984. Although invested in the same portfolio of securities, CAVU Securities Class shares' returns of the Fund will be different from Institutional Class returns of the Fund as they have different expenses.
Performance Table Footnotes, Reason Performance Information for Class Different from Immediately Preceding Period [Text] Performance shown prior to the inception date is that of the Fund’s Institutional Class shares. The inception date of the Fund’s Institutional Class shares is April 12, 1984. Although invested in the same portfolio of securities, CAVU Securities Class shares' returns of the Fund will be different from Institutional Class returns of the Fund as they have different expenses.
Invesco Government & Agency Portfolio - CAVU Securities Class | Invesco Government & Agency Portfolio  
Prospectus [Line Items]  
Bar Chart and Performance Table [Heading] Performance Information
Performance Narrative [Text Block]
The bar chart and performance table provide an indication of the risks of investing in the Fund. The bar chart shows changes in the performance of the Fund from year to year as of December 31. The Fund's past performance is not necessarily an indication of its future performance. Fund performance reflects any applicable fee waivers and expense reimbursements. Performance returns would be lower without applicable fee waivers and expense reimbursements.
All Fund performance shown assumes the reinvestment of dividends and capital gains and the effect of the Fund’s expenses.
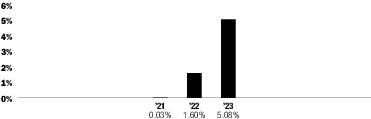
Performance Past Does Not Indicate Future [Text] The Fund's past performance is not necessarily an indication of its future performance.
Performance Information Illustrates Variability of Returns [Text] The bar chart and performance table provide an indication of the risks of investing in the Fund.
Bar Chart [Heading] Annual Total Returns
Bar Chart [Table]
Bar Chart Closing [Text Block]
CAVU Securities
Period Ended
Returns
Year-to-date
September 30, 2024
3.97%
Best Quarter
December 31, 2023
1.33%
Worst Quarter
December 31, 2021
0.01%
Year to Date Return, Label [Optional Text] Year-to-date
Bar Chart, Year to Date Return 3.97%
Bar Chart, Year to Date Return, Date Sep. 30, 2024
Highest Quarterly Return, Label [Optional Text] Best Quarter
Highest Quarterly Return 1.33%
Highest Quarterly Return, Date Dec. 31, 2023
Lowest Quarterly Return, Label [Optional Text] Worst Quarter
Lowest Quarterly Return 0.01%
Lowest Quarterly Return, Date Dec. 31, 2021
Performance Table Heading Average Annual Total Returns (for the periods ended December 31, 2023) 
Performance [Table]
 
Inception
Date
1
Year
5
Years
10
Years
CAVU Securities Class1
12/18/2020
5.08
%
1.82
%
1.20
%
1
Performance shown prior to the inception date is that of the Fund’s Institutional Class shares. The inception date of the Fund’s Institutional Class shares is September 1, 1998. Although invested in the same portfolio of securities, CAVU Securities Class shares' returns of the Fund will be different from Institutional Class returns of the Fund as they have different expenses.
Performance Table Footnotes, Reason Performance Information for Class Different from Immediately Preceding Period [Text] Performance shown prior to the inception date is that of the Fund’s Institutional Class shares. The inception date of the Fund’s Institutional Class shares is September 1, 1998. Although invested in the same portfolio of securities, CAVU Securities Class shares' returns of the Fund will be different from Institutional Class returns of the Fund as they have different expenses.
Invesco Treasury Portfolio - Corporate Class | Invesco Treasury Portfolio  
Prospectus [Line Items]  
Bar Chart and Performance Table [Heading] Performance Information
Performance Narrative [Text Block]
The bar chart and performance table provide an indication of the risks of investing in the Fund. The bar chart shows changes in the performance of the Fund from year to year as of December 31. The Fund's past performance is not necessarily an indication of its future performance. Fund performance reflects any applicable fee waivers and expense reimbursements. Performance returns would be lower without applicable fee waivers and expense reimbursements. Updated performance information is available on the Fund's website at www.invesco.com/us.
All Fund performance shown assumes the reinvestment of dividends and capital gains and the effect of the Fund’s expenses.
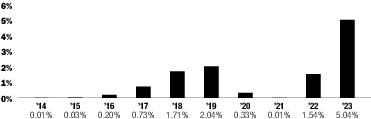
Performance Past Does Not Indicate Future [Text] The Fund's past performance is not necessarily an indication of its future performance.
Performance Information Illustrates Variability of Returns [Text] The bar chart and performance table provide an indication of the risks of investing in the Fund.
Bar Chart [Heading] Annual Total Returns
Bar Chart [Table]
Bar Chart Closing [Text Block]
Corporate
Period Ended
Returns
Year-to-date
September 30, 2024
3.93%
Best Quarter
December 31, 2023
1.33%
Worst Quarter
December 31, 2021
0.00%
Year to Date Return, Label [Optional Text] Year-to-date
Bar Chart, Year to Date Return 3.93%
Bar Chart, Year to Date Return, Date Sep. 30, 2024
Highest Quarterly Return, Label [Optional Text] Best Quarter
Highest Quarterly Return 1.33%
Highest Quarterly Return, Date Dec. 31, 2023
Lowest Quarterly Return, Label [Optional Text] Worst Quarter
Lowest Quarterly Return none
Lowest Quarterly Return, Date Dec. 31, 2021
Performance Table Heading Average Annual Total Returns (for the periods ended December 31, 2023) 
Performance [Table]
 
Inception
Date
1
Year
5
Years
10
Years
Corporate Class
8/1/2005
5.04
%
1.78
%
1.15
%
Performance Availability Website Address [Text] www.invesco.com/us
Invesco Government & Agency Portfolio - Corporate Class | Invesco Government & Agency Portfolio  
Prospectus [Line Items]  
Bar Chart and Performance Table [Heading] Performance Information
Performance Narrative [Text Block]
The bar chart and performance table provide an indication of the risks of investing in the Fund. The bar chart shows changes in the performance of the Fund from year to year as of December 31. The Fund's past performance is not necessarily an indication of its future performance. Fund performance reflects any applicable fee waivers and expense reimbursements. Performance returns would be lower without applicable fee waivers and expense reimbursements. Updated performance information is available on the Fund's website at www.invesco.com/us.
All Fund performance shown assumes the reinvestment of dividends and capital gains and the effect of the Fund’s expenses.
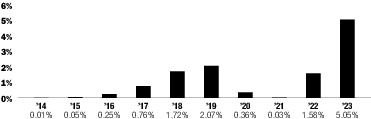
Performance Past Does Not Indicate Future [Text] The Fund's past performance is not necessarily an indication of its future performance.
Performance Information Illustrates Variability of Returns [Text] The bar chart and performance table provide an indication of the risks of investing in the Fund.
Bar Chart [Heading] Annual Total Returns
Bar Chart [Table]
Bar Chart Closing [Text Block]
Corporate
Period Ended
Returns
Year-to-date
September 30, 2024
3.95%
Best Quarter
December 31, 2023
1.33%
Worst Quarter
December 31, 2020
0.00%
Year to Date Return, Label [Optional Text] Year-to-date
Bar Chart, Year to Date Return 3.95%
Bar Chart, Year to Date Return, Date Sep. 30, 2024
Highest Quarterly Return, Label [Optional Text] Best Quarter
Highest Quarterly Return 1.33%
Highest Quarterly Return, Date Dec. 31, 2023
Lowest Quarterly Return, Label [Optional Text] Worst Quarter
Lowest Quarterly Return none
Lowest Quarterly Return, Date Dec. 31, 2020
Performance Table Heading Average Annual Total Returns (for the periods ended December 31, 2023) 
Performance [Table]
 
Inception
Date
1
Year
5
Years
10
Years
Corporate Class
6/30/2005
5.05
%
1.80
%
1.18
%
Performance Availability Website Address [Text] www.invesco.com/us
Invesco Treasury Obligations Portfolio - Corporate Class | Invesco Treasury Obligations Portfolio  
Prospectus [Line Items]  
Bar Chart and Performance Table [Heading] Performance Information
Performance Narrative [Text Block]
The bar chart and performance table provide an indication of the risks of investing in the Fund. The bar chart shows changes in the performance of the Fund from year to year as of December 31. The Fund's past performance is not necessarily an indication of its future performance. Fund performance reflects any applicable fee waivers and expense reimbursements. Performance returns would be lower without applicable fee waivers and expense reimbursements. Updated performance information is available on the Fund's website at www.invesco.com/us.
All Fund performance shown assumes the reinvestment of dividends and capital gains and the effect of the Fund’s expenses.
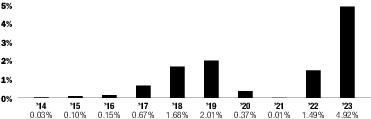
Performance Past Does Not Indicate Future [Text] The Fund's past performance is not necessarily an indication of its future performance.
Performance Information Illustrates Variability of Returns [Text] The bar chart and performance table provide an indication of the risks of investing in the Fund.
Bar Chart [Heading] Annual Total Returns
Bar Chart [Table]
Bar Chart Closing [Text Block]
Corporate
Period Ended
Returns
Year-to-date
September 30, 2024
3.90%
Best Quarter
December 31, 2023
1.32%
Worst Quarter
December 31, 2021
0.00%
Year to Date Return, Label [Optional Text] Year-to-date
Bar Chart, Year to Date Return 3.90%
Bar Chart, Year to Date Return, Date Sep. 30, 2024
Highest Quarterly Return, Label [Optional Text] Best Quarter
Highest Quarterly Return 1.32%
Highest Quarterly Return, Date Dec. 31, 2023
Lowest Quarterly Return, Label [Optional Text] Worst Quarter
Lowest Quarterly Return none
Lowest Quarterly Return, Date Dec. 31, 2021
Performance Table Heading Average Annual Total Returns (for the periods ended December 31, 2023) 
Performance [Table]
 
Inception
Date
1
Year
5
Years
10
Years
Corporate Class
2/23/2006
4.92
%
1.75
%
1.14
%
Performance Availability Website Address [Text] www.invesco.com/us
Invesco Treasury Portfolio - Institutional Class | Invesco Treasury Portfolio  
Prospectus [Line Items]  
Bar Chart and Performance Table [Heading] Performance Information
Performance Narrative [Text Block]
The bar chart and performance table provide an indication of the risks of investing in the Fund. The bar chart shows changes in the performance of the Fund from year to year as of December 31. The Fund's past performance is not necessarily an indication of its future performance. Fund performance reflects any applicable fee waivers and expense reimbursements. Performance returns would be lower without applicable fee waivers and expense reimbursements. Updated performance information is available on the Fund's website at www.invesco.com/us.
All Fund performance shown assumes the reinvestment of dividends and capital gains and the effect of the Fund’s expenses.
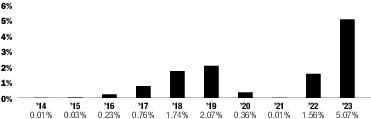
Performance Past Does Not Indicate Future [Text] The Fund's past performance is not necessarily an indication of its future performance.
Performance Information Illustrates Variability of Returns [Text] The bar chart and performance table provide an indication of the risks of investing in the Fund.
Bar Chart [Heading] Annual Total Returns
Bar Chart [Table]
Bar Chart Closing [Text Block]
Institutional
Period Ended
Returns
Year-to-date
September 30, 2024
3.96%
Best Quarter
December 31, 2023
1.33%
Worst Quarter
December 31, 2021
0.00%
Year to Date Return, Label [Optional Text] Year-to-date
Bar Chart, Year to Date Return 3.96%
Bar Chart, Year to Date Return, Date Sep. 30, 2024
Highest Quarterly Return, Label [Optional Text] Best Quarter
Highest Quarterly Return 1.33%
Highest Quarterly Return, Date Dec. 31, 2023
Lowest Quarterly Return, Label [Optional Text] Worst Quarter
Lowest Quarterly Return none
Lowest Quarterly Return, Date Dec. 31, 2021
Performance Table Heading Average Annual Total Returns (for the periods ended December 31, 2023) 
Performance [Table]
 
Inception
Date
1
Year
5
Years
10
Years
Institutional Class
4/12/1984
5.07
%
1.80
%
1.17
%
Performance Availability Website Address [Text] www.invesco.com/us
Invesco Government & Agency Portfolio - Institutional Class | Invesco Government & Agency Portfolio  
Prospectus [Line Items]  
Bar Chart and Performance Table [Heading] Performance Information
Performance Narrative [Text Block]
The bar chart and performance table provide an indication of the risks of investing in the Fund. The bar chart shows changes in the performance of the Fund from year to year as of December 31. The Fund's past performance is not necessarily an indication of its future performance. Fund performance reflects any applicable fee waivers and expense reimbursements. Performance returns would be lower without applicable fee waivers and expense reimbursements. Updated performance information is available on the Fund's website at www.invesco.com/us.
All Fund performance shown assumes the reinvestment of dividends and capital gains and the effect of the Fund’s expenses.
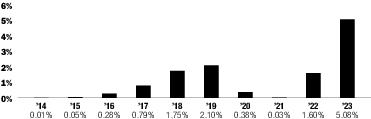
Performance Past Does Not Indicate Future [Text] The Fund's past performance is not necessarily an indication of its future performance.
Performance Information Illustrates Variability of Returns [Text] The bar chart and performance table provide an indication of the risks of investing in the Fund.
Bar Chart [Heading] Annual Total Returns
Bar Chart [Table]
Bar Chart Closing [Text Block]
Institutional
Period Ended
Returns
Year-to-date
September 30, 2024
3.97%
Best Quarter
December 31, 2023
1.33%
Worst Quarter
December 31, 2020
0.00%
Year to Date Return, Label [Optional Text] Year-to-date
Bar Chart, Year to Date Return 3.97%
Bar Chart, Year to Date Return, Date Sep. 30, 2024
Highest Quarterly Return, Label [Optional Text] Best Quarter
Highest Quarterly Return 1.33%
Highest Quarterly Return, Date Dec. 31, 2023
Lowest Quarterly Return, Label [Optional Text] Worst Quarter
Lowest Quarterly Return none
Lowest Quarterly Return, Date Dec. 31, 2020
Performance Table Heading Average Annual Total Returns (for the periods ended December 31, 2023) 
Performance [Table]
 
Inception
Date
1
Year
5
Years
10
Years
Institutional Class
9/1/1998
5.08
%
1.82
%
1.20
%
Performance Availability Website Address [Text] www.invesco.com/us
Invesco Treasury Obligations Portfolio - Institutional Class | Invesco Treasury Obligations Portfolio  
Prospectus [Line Items]  
Bar Chart and Performance Table [Heading] Performance Information
Performance Narrative [Text Block]
The bar chart and performance table provide an indication of the risks of investing in the Fund. The bar chart shows changes in the performance of the Fund from year to year as of December 31. The Fund's past performance is not necessarily an indication of its future performance. Fund performance reflects any applicable fee waivers and expense reimbursements. Performance returns would be lower without applicable fee waivers and expense reimbursements. Updated performance information is available on the Fund's website at www.invesco.com/us.
All Fund performance shown assumes the reinvestment of dividends and capital gains and the effect of the Fund’s expenses.
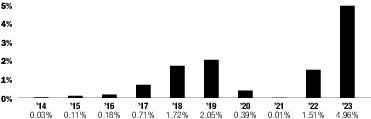
Performance Past Does Not Indicate Future [Text] The Fund's past performance is not necessarily an indication of its future performance.
Performance Information Illustrates Variability of Returns [Text] The bar chart and performance table provide an indication of the risks of investing in the Fund.
Bar Chart [Heading] Annual Total Returns
Bar Chart [Table]
Bar Chart Closing [Text Block]
Institutional
Period Ended
Returns
Year-to-date
September 30, 2024
3.92%
Best Quarter
December 31, 2023
1.32%
Worst Quarter
December 31, 2021
0.00%
Year to Date Return, Label [Optional Text] Year-to-date
Bar Chart, Year to Date Return 3.92%
Bar Chart, Year to Date Return, Date Sep. 30, 2024
Highest Quarterly Return, Label [Optional Text] Best Quarter
Highest Quarterly Return 1.32%
Highest Quarterly Return, Date Dec. 31, 2023
Lowest Quarterly Return, Label [Optional Text] Worst Quarter
Lowest Quarterly Return none
Lowest Quarterly Return, Date Dec. 31, 2021
Performance Table Heading Average Annual Total Returns (for the periods ended December 31, 2023) 
Performance [Table]
 
Inception
Date
1
Year
5
Years
10
Years
Institutional Class
8/17/1990
4.96
%
1.77
%
1.16
%
Performance Availability Website Address [Text] www.invesco.com/us
Invesco Treasury Portfolio - Personal Investment Class | Invesco Treasury Portfolio  
Prospectus [Line Items]  
Bar Chart and Performance Table [Heading] Performance Information
Performance Narrative [Text Block]
The bar chart and performance table provide an indication of the risks of investing in the Fund. The bar chart shows changes in the performance of the Fund from year to year as of December 31. The Fund's past performance is not necessarily an indication of its future performance. Fund performance reflects any applicable fee waivers and expense reimbursements. Performance returns would be lower without applicable fee waivers and expense reimbursements. Updated performance information is available on the Fund's website at www.invesco.com/us.
All Fund performance shown assumes the reinvestment of dividends and capital gains and the effect of the Fund’s expenses.
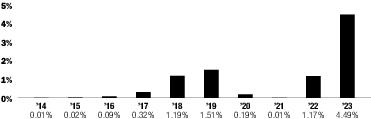
Performance Past Does Not Indicate Future [Text] The Fund's past performance is not necessarily an indication of its future performance.
Performance Information Illustrates Variability of Returns [Text] The bar chart and performance table provide an indication of the risks of investing in the Fund.
Bar Chart [Heading] Annual Total Returns
Bar Chart [Table]
Bar Chart Closing [Text Block]
Personal
Period Ended
Returns
Year-to-date
September 30, 2024
3.53%
Best Quarter
December 31, 2023
1.19%
Worst Quarter
March 31, 2022
0.00%
Year to Date Return, Label [Optional Text] Year-to-date
Bar Chart, Year to Date Return 3.53%
Bar Chart, Year to Date Return, Date Sep. 30, 2024
Highest Quarterly Return, Label [Optional Text] Best Quarter
Highest Quarterly Return 1.19%
Highest Quarterly Return, Date Dec. 31, 2023
Lowest Quarterly Return, Label [Optional Text] Worst Quarter
Lowest Quarterly Return none
Lowest Quarterly Return, Date Mar. 31, 2022
Performance Table Heading Average Annual Total Returns (for the periods ended December 31, 2023) 
Performance [Table]
 
Inception
Date
1
Year
5
Years
10
Years
Personal Investment Class
8/8/1991
4.49
%
1.46
%
0.89
%
Performance Availability Website Address [Text] www.invesco.com/us
Invesco Government & Agency Portfolio - Personal Investment Class | Invesco Government & Agency Portfolio  
Prospectus [Line Items]  
Bar Chart and Performance Table [Heading] Performance Information
Performance Narrative [Text Block]
The bar chart and performance table provide an indication of the risks of investing in the Fund. The bar chart shows changes in the performance of the Fund from year to year as of December 31. The Fund's past performance is not necessarily an indication of its future performance. Fund performance reflects any applicable fee waivers and expense reimbursements. Performance returns would be lower without applicable fee waivers and expense reimbursements. Updated performance information is available on the Fund's website at www.invesco.com/us.
All Fund performance shown assumes the reinvestment of dividends and capital gains and the effect of the Fund’s expenses.
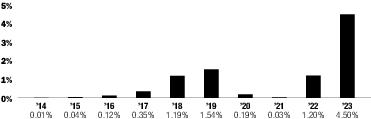
Performance Past Does Not Indicate Future [Text] The Fund's past performance is not necessarily an indication of its future performance.
Performance Information Illustrates Variability of Returns [Text] The bar chart and performance table provide an indication of the risks of investing in the Fund.
Bar Chart [Heading] Annual Total Returns
Bar Chart [Table]
Bar Chart Closing [Text Block]
Personal
Period Ended
Returns
Year-to-date
September 30, 2024
3.55%
Best Quarter
December 31, 2023
1.19%
Worst Quarter
December 31, 2020
0.00%
Year to Date Return, Label [Optional Text] Year-to-date
Bar Chart, Year to Date Return 3.55%
Bar Chart, Year to Date Return, Date Sep. 30, 2024
Highest Quarterly Return, Label [Optional Text] Best Quarter
Highest Quarterly Return 1.19%
Highest Quarterly Return, Date Dec. 31, 2023
Lowest Quarterly Return, Label [Optional Text] Worst Quarter
Lowest Quarterly Return none
Lowest Quarterly Return, Date Dec. 31, 2020
Performance Table Heading Average Annual Total Returns (for the periods ended December 31, 2023) 
Performance [Table]
 
Inception
Date
1
Year
5
Years
10
Years
Personal Investment Class
1/31/2000
4.50
%
1.48
%
0.91
%
Performance Availability Website Address [Text] www.invesco.com/us
Invesco Treasury Obligations Portfolio - Personal Investment Class | Invesco Treasury Obligations Portfolio  
Prospectus [Line Items]  
Bar Chart and Performance Table [Heading] Performance Information
Performance Narrative [Text Block]
The bar chart and performance table provide an indication of the risks of investing in the Fund. The bar chart shows changes in the performance of the Fund from year to year as of December 31. The Fund's past performance is not necessarily an indication of its future performance. Fund performance reflects any applicable fee waivers and expense reimbursements. Performance returns would be lower without applicable fee waivers and expense reimbursements. Updated performance information is available on the Fund's website at www.invesco.com/us.
All Fund performance shown assumes the reinvestment of dividends and capital gains and the effect of the Fund’s expenses.
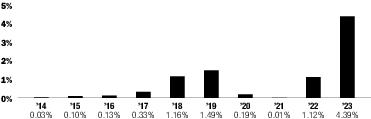
Performance Past Does Not Indicate Future [Text] The Fund's past performance is not necessarily an indication of its future performance.
Performance Information Illustrates Variability of Returns [Text] The bar chart and performance table provide an indication of the risks of investing in the Fund.
Bar Chart [Heading] Annual Total Returns
Bar Chart [Table]
Bar Chart Closing [Text Block]
Personal
Period Ended
Returns
Year-to-date
September 30, 2024
3.50%
Best Quarter
December 31, 2023
1.19%
Worst Quarter
March 31, 2022
0.00%
Year to Date Return, Label [Optional Text] Year-to-date
Bar Chart, Year to Date Return 3.50%
Bar Chart, Year to Date Return, Date Sep. 30, 2024
Highest Quarterly Return, Label [Optional Text] Best Quarter
Highest Quarterly Return 1.19%
Highest Quarterly Return, Date Dec. 31, 2023
Lowest Quarterly Return, Label [Optional Text] Worst Quarter
Lowest Quarterly Return none
Lowest Quarterly Return, Date Mar. 31, 2022
Performance Table Heading Average Annual Total Returns (for the periods ended December 31, 2023) 
Performance [Table]
 
Inception
Date
1
Year
5
Years
10
Years
Personal Investment Class
5/31/2001
4.39
%
1.43
%
0.89
%
Performance Availability Website Address [Text] www.invesco.com/us
Invesco Government & Agency Portfolio - Premier Class | Invesco Government & Agency Portfolio  
Prospectus [Line Items]  
Bar Chart and Performance Table [Heading] Performance Information
Performance Narrative [Text Block]
The bar chart and performance table provide an indication of the risks of investing in the Fund. The bar chart shows changes in the performance of the Fund from year to year as of December 31. The Fund's past performance is not necessarily an indication of its future performance.
Fund performance reflects any applicable fee waivers and expense reimbursements. Performance returns would be lower without applicable fee waivers and expense reimbursements. Updated performance information is available on the Fund's website at www.invesco.com/us.
Premier Class Shares of the Fund have less than a year of performance; therefore, the returns shown are those of the Fund’s Institutional Class shares. Although the Premier Class shares are invested in the same portfolio of securities, Premier Class shares’ returns of the Fund will be different from Institutional Class returns of the Fund as they have different expenses.
All Fund performance shown assumes the reinvestment of dividends and capital gains and the effect of the Fund’s expenses.
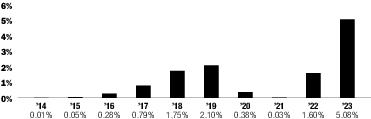
Performance Past Does Not Indicate Future [Text] The Fund's past performance is not necessarily an indication of its future performance.
Performance Information Illustrates Variability of Returns [Text] The bar chart and performance table provide an indication of the risks of investing in the Fund.
Performance One Year or Less [Text] Premier Class Shares of the Fund have less than a year of performance; therefore, the returns shown are those of the Fund’s Institutional Class shares.
Bar Chart [Heading] Annual Total Returns
Bar Chart [Table]
Bar Chart Closing [Text Block]
Institutional
Period Ended
Returns
Year-to-date
September 30, 2024
3.97%
Best Quarter
December 31, 2023
1.33%
Worst Quarter
December 31, 2020
0.00%
Year to Date Return, Label [Optional Text] Year-to-date
Bar Chart, Year to Date Return 3.97%
Bar Chart, Year to Date Return, Date Sep. 30, 2024
Highest Quarterly Return, Label [Optional Text] Best Quarter
Highest Quarterly Return 1.33%
Highest Quarterly Return, Date Dec. 31, 2023
Lowest Quarterly Return, Label [Optional Text] Worst Quarter
Lowest Quarterly Return none
Lowest Quarterly Return, Date Dec. 31, 2020
Performance Table Heading Average Annual Total Returns (for the periods ended December 31, 2023) 
Performance [Table]
 
Inception
Date
1
Year
5
Years
10
Years
Premier Class1
6/7/2024
5.08
%
1.82
%
1.20
%
1
Premier Class shares’ performance shown prior to the inception date is that of the Fund’s Institutional Class shares. Institutional Class shares’ performance reflects any applicable fee waivers and/or expense reimbursements. The inception date of the Fund’s Institutional Class shares is September 1, 1998.
Performance Table Footnotes, Reason Performance Information for Class Different from Immediately Preceding Period [Text] Premier Class shares’ performance shown prior to the inception date is that of the Fund’s Institutional Class shares. Institutional Class shares’ performance reflects any applicable fee waivers and/or expense reimbursements. The inception date of the Fund’s Institutional Class shares is September 1, 1998.
Performance Availability Website Address [Text] www.invesco.com/us
Invesco Treasury Portfolio - Private Investment Class | Invesco Treasury Portfolio  
Prospectus [Line Items]  
Bar Chart and Performance Table [Heading] Performance Information
Performance Narrative [Text Block]
The bar chart and performance table provide an indication of the risks of investing in the Fund. The bar chart shows changes in the performance of the Fund from year to year as of December 31. The Fund's past performance is not necessarily an indication of its future performance. Fund performance reflects any applicable fee waivers and expense reimbursements. Performance returns would be lower without applicable fee waivers and expense reimbursements. Updated performance information is available on the Fund's website at www.invesco.com/us.
All Fund performance shown assumes the reinvestment of dividends and capital gains and the effect of the Fund’s expenses.
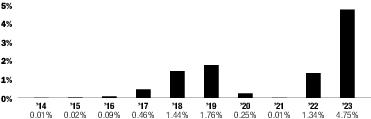
Performance Past Does Not Indicate Future [Text] The Fund's past performance is not necessarily an indication of its future performance.
Performance Information Illustrates Variability of Returns [Text] The bar chart and performance table provide an indication of the risks of investing in the Fund.
Bar Chart [Heading] Annual Total Returns
Bar Chart [Table]
Bar Chart Closing [Text Block]
Private
Period Ended
Returns
Year-to-date
September 30, 2024
3.72%
Best Quarter
December 31, 2023
1.26%
Worst Quarter
March 31, 2022
0.00%
Year to Date Return, Label [Optional Text] Year-to-date
Bar Chart, Year to Date Return 3.72%
Bar Chart, Year to Date Return, Date Sep. 30, 2024
Highest Quarterly Return, Label [Optional Text] Best Quarter
Highest Quarterly Return 1.26%
Highest Quarterly Return, Date Dec. 31, 2023
Lowest Quarterly Return, Label [Optional Text] Worst Quarter
Lowest Quarterly Return none
Lowest Quarterly Return, Date Mar. 31, 2022
Performance Table Heading Average Annual Total Returns (for the periods ended December 31, 2023) 
Performance [Table]
 
Inception
Date
1
Year
5
Years
10
Years
Private Investment Class
11/22/1991
4.75
%
1.61
%
1.00
%
Performance Availability Website Address [Text] www.invesco.com/us
Invesco Government & Agency Portfolio - Private Investment Class | Invesco Government & Agency Portfolio  
Prospectus [Line Items]  
Bar Chart and Performance Table [Heading] Performance Information
Performance Narrative [Text Block]
The bar chart and performance table provide an indication of the risks of investing in the Fund. The bar chart shows changes in the performance of the Fund from year to year as of December 31. The Fund's past performance is not necessarily an indication of its future performance. Fund performance reflects any applicable fee waivers and expense reimbursements. Performance returns would be lower without applicable fee waivers and expense reimbursements. Updated performance information is available on the Fund's website at www.invesco.com/us.
All Fund performance shown assumes the reinvestment of dividends and capital gains and the effect of the Fund’s expenses.
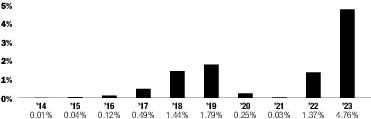
Performance Past Does Not Indicate Future [Text] The Fund's past performance is not necessarily an indication of its future performance.
Performance Information Illustrates Variability of Returns [Text] The bar chart and performance table provide an indication of the risks of investing in the Fund.
Bar Chart [Heading] Annual Total Returns
Bar Chart [Table]
Bar Chart Closing [Text Block]
Private
Period Ended
Returns
Year-to-date
September 30, 2024
3.74%
Best Quarter
December 31, 2023
1.26%
Worst Quarter
December 31, 2020
0.00%
Year to Date Return, Label [Optional Text] Year-to-date
Bar Chart, Year to Date Return 3.74%
Bar Chart, Year to Date Return, Date Sep. 30, 2024
Highest Quarterly Return, Label [Optional Text] Best Quarter
Highest Quarterly Return 1.26%
Highest Quarterly Return, Date Dec. 31, 2023
Lowest Quarterly Return, Label [Optional Text] Worst Quarter
Lowest Quarterly Return none
Lowest Quarterly Return, Date Dec. 31, 2020
Performance Table Heading Average Annual Total Returns (for the periods ended December 31, 2023) 
Performance [Table]
 
Inception
Date
1
Year
5
Years
10
Years
Private Investment Class
9/1/1998
4.76
%
1.63
%
1.02
%
Performance Availability Website Address [Text] www.invesco.com/us
Invesco Treasury Obligations Portfolio - Private Investment Class | Invesco Treasury Obligations Portfolio  
Prospectus [Line Items]  
Bar Chart and Performance Table [Heading] Performance Information
Performance Narrative [Text Block]
The bar chart and performance table provide an indication of the risks of investing in the Fund. The bar chart shows changes in the performance of the Fund from year to year as of December 31. The Fund's past performance is not necessarily an indication of its future performance. Fund performance reflects any applicable fee waivers and expense reimbursements. Performance returns would be lower without applicable fee waivers and expense reimbursements. Updated performance information is available on the Fund's website at www.invesco.com/us.
All Fund performance shown assumes the reinvestment of dividends and capital gains and the effect of the Fund’s expenses.
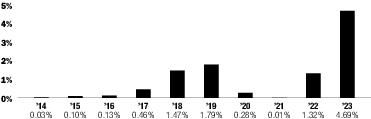
Performance Past Does Not Indicate Future [Text] The Fund's past performance is not necessarily an indication of its future performance.
Performance Information Illustrates Variability of Returns [Text] The bar chart and performance table provide an indication of the risks of investing in the Fund.
Bar Chart [Heading] Annual Total Returns
Bar Chart [Table]
Bar Chart Closing [Text Block]
Private
Period Ended
Returns
Year-to-date
September 30, 2024
3.73%
Best Quarter
December 31, 2023
1.26%
Worst Quarter
March 31, 2022
0.00%
Year to Date Return, Label [Optional Text] Year-to-date
Bar Chart, Year to Date Return 3.73%
Bar Chart, Year to Date Return, Date Sep. 30, 2024
Highest Quarterly Return, Label [Optional Text] Best Quarter
Highest Quarterly Return 1.26%
Highest Quarterly Return, Date Dec. 31, 2023
Lowest Quarterly Return, Label [Optional Text] Worst Quarter
Lowest Quarterly Return none
Lowest Quarterly Return, Date Mar. 31, 2022
Performance Table Heading Average Annual Total Returns (for the periods ended December 31, 2023) 
Performance [Table]
 
Inception
Date
1
Year
5
Years
10
Years
Private Investment Class
12/21/1994
4.69
%
1.60
%
1.02
%
Performance Availability Website Address [Text] www.invesco.com/us
Invesco Treasury Portfolio - Reserve Class | Invesco Treasury Portfolio  
Prospectus [Line Items]  
Bar Chart and Performance Table [Heading] Performance Information
Performance Narrative [Text Block]
The bar chart and performance table provide an indication of the risks of investing in the Fund. The bar chart shows changes in the performance of the Fund from year to year as of December 31. The Fund's past performance is not necessarily an indication of its future performance. Fund performance reflects any applicable fee waivers and expense reimbursements. Performance returns would be lower without applicable fee waivers and expense reimbursements. Updated performance information is available on the Fund's website at www.invesco.com/us.
All Fund performance shown assumes the reinvestment of dividends and capital gains and the effect of the Fund’s expenses.
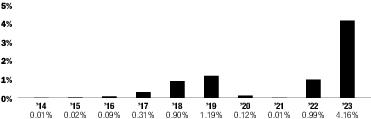
Performance Past Does Not Indicate Future [Text] The Fund's past performance is not necessarily an indication of its future performance.
Performance Information Illustrates Variability of Returns [Text] The bar chart and performance table provide an indication of the risks of investing in the Fund.
Bar Chart [Heading] Annual Total Returns
Bar Chart [Table]
Bar Chart Closing [Text Block]
Reserve
Period Ended
Returns
Year-to-date
September 30, 2024
3.28%
Best Quarter
December 31, 2023
1.11%
Worst Quarter
March 31, 2022
0.00%
Year to Date Return, Label [Optional Text] Year-to-date
Bar Chart, Year to Date Return 3.28%
Bar Chart, Year to Date Return, Date Sep. 30, 2024
Highest Quarterly Return, Label [Optional Text] Best Quarter
Highest Quarterly Return 1.11%
Highest Quarterly Return, Date Dec. 31, 2023
Lowest Quarterly Return, Label [Optional Text] Worst Quarter
Lowest Quarterly Return none
Lowest Quarterly Return, Date Mar. 31, 2022
Performance Table Heading Average Annual Total Returns (for the periods ended December 31, 2023) 
Performance [Table]
 
Inception
Date
1
Year
5
Years
10
Years
Reserve Class
1/4/1999
4.16
%
1.28
%
0.77
%
Performance Availability Website Address [Text] www.invesco.com/us
Invesco Government & Agency Portfolio - Reserve Class | Invesco Government & Agency Portfolio  
Prospectus [Line Items]  
Bar Chart and Performance Table [Heading] Performance Information
Performance Narrative [Text Block]
The bar chart and performance table provide an indication of the risks of investing in the Fund. The bar chart shows changes in the performance of the Fund from year to year as of December 31. The Fund's past performance is not necessarily an indication of its future performance. Fund performance reflects any applicable fee waivers and expense reimbursements. Performance returns would be lower without applicable fee waivers and expense reimbursements. Updated performance information is available on the Fund's website at www.invesco.com/us.
All Fund performance shown assumes the reinvestment of dividends and capital gains and the effect of the Fund’s expenses.
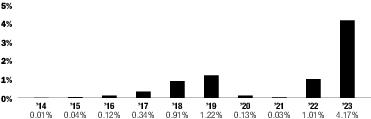
Performance Past Does Not Indicate Future [Text] The Fund's past performance is not necessarily an indication of its future performance.
Performance Information Illustrates Variability of Returns [Text] The bar chart and performance table provide an indication of the risks of investing in the Fund.
Bar Chart [Heading] Annual Total Returns
Bar Chart [Table]
Bar Chart Closing [Text Block]
Reserve
Period Ended
Returns
Year-to-date
September 30, 2024
3.30%
Best Quarter
December 31, 2023
1.11%
Worst Quarter
December 31, 2020
0.00%
Year to Date Return, Label [Optional Text] Year-to-date
Bar Chart, Year to Date Return 3.30%
Bar Chart, Year to Date Return, Date Sep. 30, 2024
Highest Quarterly Return, Label [Optional Text] Best Quarter
Highest Quarterly Return 1.11%
Highest Quarterly Return, Date Dec. 31, 2023
Lowest Quarterly Return, Label [Optional Text] Worst Quarter
Lowest Quarterly Return none
Lowest Quarterly Return, Date Dec. 31, 2020
Performance Table Heading Average Annual Total Returns (for the periods ended December 31, 2023) 
Performance [Table]
 
Inception
Date
1
Year
5
Years
10
Years
Reserve Class
1/26/2000
4.17
%
1.30
%
0.79
%
Performance Availability Website Address [Text] www.invesco.com/us
Invesco Treasury Obligations Portfolio - Reserve Class | Invesco Treasury Obligations Portfolio  
Prospectus [Line Items]  
Bar Chart and Performance Table [Heading] Performance Information
Performance Narrative [Text Block]
The bar chart and performance table provide an indication of the risks of investing in the Fund. The bar chart shows changes in the performance of the Fund from year to year as of December 31. The Fund's past performance is not necessarily an indication of its future performance. Fund performance reflects any applicable fee waivers and expense reimbursements. Performance returns would be lower without applicable fee waivers and expense reimbursements. Updated performance information is available on the Fund's website at www.invesco.com/us.
All Fund performance shown assumes the reinvestment of dividends and capital gains and the effect of the Fund’s expenses.
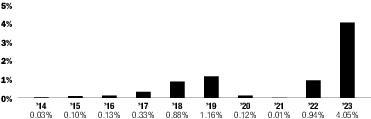
Performance Past Does Not Indicate Future [Text] The Fund's past performance is not necessarily an indication of its future performance.
Performance Information Illustrates Variability of Returns [Text] The bar chart and performance table provide an indication of the risks of investing in the Fund.
Bar Chart [Heading] Annual Total Returns
Bar Chart [Table]
Bar Chart Closing [Text Block]
Reserve
Period Ended
Returns
Year-to-date
September 30, 2024
3.25%
Best Quarter
December 31, 2023
1.10%
Worst Quarter
March 31, 2022
0.00%
Year to Date Return, Label [Optional Text] Year-to-date
Bar Chart, Year to Date Return 3.25%
Bar Chart, Year to Date Return, Date Sep. 30, 2024
Highest Quarterly Return, Label [Optional Text] Best Quarter
Highest Quarterly Return 1.10%
Highest Quarterly Return, Date Dec. 31, 2023
Lowest Quarterly Return, Label [Optional Text] Worst Quarter
Lowest Quarterly Return none
Lowest Quarterly Return, Date Mar. 31, 2022
Performance Table Heading Average Annual Total Returns (for the periods ended December 31, 2023) 
Performance [Table]
 
Inception
Date
1
Year
5
Years
10
Years
Reserve Class
6/23/2003
4.05
%
1.25
%
0.77
%
Performance Availability Website Address [Text] www.invesco.com/us
Invesco Treasury Portfolio - Resource Class | Invesco Treasury Portfolio  
Prospectus [Line Items]  
Bar Chart and Performance Table [Heading] Performance Information
Performance Narrative [Text Block]
The bar chart and performance table provide an indication of the risks of investing in the Fund. The bar chart shows changes in the performance of the Fund from year to year as of December 31. The Fund's past performance is not necessarily an indication of its future performance. Fund performance reflects any applicable fee waivers and expense reimbursements. Performance returns would be lower without applicable fee waivers and expense reimbursements. Updated performance information is available on the Fund's website at www.invesco.com/us.
All Fund performance shown assumes the reinvestment of dividends and capital gains and the effect of the Fund’s expenses.
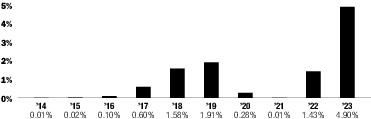
Performance Past Does Not Indicate Future [Text] The Fund's past performance is not necessarily an indication of its future performance.
Performance Information Illustrates Variability of Returns [Text] The bar chart and performance table provide an indication of the risks of investing in the Fund.
Bar Chart [Heading] Annual Total Returns
Bar Chart [Table]
Bar Chart Closing [Text Block]
Resource
Period Ended
Returns
Year-to-date
September 30, 2024
3.83%
Best Quarter
December 31, 2023
1.29%
Worst Quarter
March 31, 2022
0.00%
Year to Date Return, Label [Optional Text] Year-to-date
Bar Chart, Year to Date Return 3.83%
Bar Chart, Year to Date Return, Date Sep. 30, 2024
Highest Quarterly Return, Label [Optional Text] Best Quarter
Highest Quarterly Return 1.29%
Highest Quarterly Return, Date Dec. 31, 2023
Lowest Quarterly Return, Label [Optional Text] Worst Quarter
Lowest Quarterly Return none
Lowest Quarterly Return, Date Mar. 31, 2022
Performance Table Heading Average Annual Total Returns (for the periods ended December 31, 2023) 
Performance [Table]
 
Inception
Date
1
Year
5
Years
10
Years
Resource Class
3/6/1996
4.90
%
1.69
%
1.07
%
Performance Availability Website Address [Text] www.invesco.com/us
Invesco Government & Agency Portfolio - Resource Class | Invesco Government & Agency Portfolio  
Prospectus [Line Items]  
Bar Chart and Performance Table [Heading] Performance Information
Performance Narrative [Text Block]
The bar chart and performance table provide an indication of the risks of investing in the Fund. The bar chart shows changes in the performance of the Fund from year to year as of December 31. The Fund's past performance is not necessarily an indication of its future performance. Fund performance reflects any applicable fee waivers and expense reimbursements. Performance returns would be lower without applicable fee waivers and expense reimbursements. Updated performance information is available on the Fund's website at www.invesco.com/us.
All Fund performance shown assumes the reinvestment of dividends and capital gains and the effect of the Fund’s expenses.
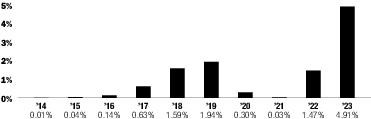
Performance Past Does Not Indicate Future [Text] The Fund's past performance is not necessarily an indication of its future performance.
Performance Information Illustrates Variability of Returns [Text] The bar chart and performance table provide an indication of the risks of investing in the Fund.
Bar Chart [Heading] Annual Total Returns
Bar Chart [Table]
Bar Chart Closing [Text Block]
Resource
Period Ended
Returns
Year-to-date
September 30, 2024
3.85%
Best Quarter
December 31, 2023
1.29%
Worst Quarter
December 31, 2020
0.00%
Year to Date Return, Label [Optional Text] Year-to-date
Bar Chart, Year to Date Return 3.85%
Bar Chart, Year to Date Return, Date Sep. 30, 2024
Highest Quarterly Return, Label [Optional Text] Best Quarter
Highest Quarterly Return 1.29%
Highest Quarterly Return, Date Dec. 31, 2023
Lowest Quarterly Return, Label [Optional Text] Worst Quarter
Lowest Quarterly Return none
Lowest Quarterly Return, Date Dec. 31, 2020
Performance Table Heading Average Annual Total Returns (for the periods ended December 31, 2023) 
Performance [Table]
 
Inception
Date
1
Year
5
Years
10
Years
Resource Class
9/1/1998
4.91
%
1.71
%
1.10
%
Performance Availability Website Address [Text] www.invesco.com/us
Invesco Treasury Obligations Portfolio - Resource Class | Invesco Treasury Obligations Portfolio  
Prospectus [Line Items]  
Bar Chart and Performance Table [Heading] Performance Information
Performance Narrative [Text Block]
The bar chart and performance table provide an indication of the risks of investing in the Fund. The bar chart shows changes in the performance of the Fund from year to year as of December 31. The Fund's past performance is not necessarily an indication of its future performance. Fund performance reflects any applicable fee waivers and expense reimbursements. Performance returns would be lower without applicable fee waivers and expense reimbursements. Updated performance information is available on the Fund's website at www.invesco.com/us.
All Fund performance shown assumes the reinvestment of dividends and capital gains and the effect of the Fund’s expenses.
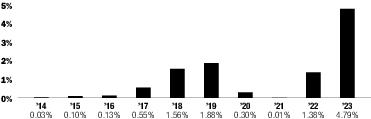
Performance Past Does Not Indicate Future [Text] The Fund's past performance is not necessarily an indication of its future performance.
Performance Information Illustrates Variability of Returns [Text] The bar chart and performance table provide an indication of the risks of investing in the Fund.
Bar Chart [Heading] Annual Total Returns
Bar Chart [Table]
Bar Chart Closing [Text Block]
Resource
Period Ended
Returns
Year-to-date
September 30, 2024
3.80%
Best Quarter
December 31, 2023
1.28%
Worst Quarter
March 31, 2022
0.00%
Year to Date Return, Label [Optional Text] Year-to-date
Bar Chart, Year to Date Return 3.80%
Bar Chart, Year to Date Return, Date Sep. 30, 2024
Highest Quarterly Return, Label [Optional Text] Best Quarter
Highest Quarterly Return 1.28%
Highest Quarterly Return, Date Dec. 31, 2023
Lowest Quarterly Return, Label [Optional Text] Worst Quarter
Lowest Quarterly Return none
Lowest Quarterly Return, Date Mar. 31, 2022
Performance Table Heading Average Annual Total Returns (for the periods ended December 31, 2023) 
Performance [Table]
 
Inception
Date
1
Year
5
Years
10
Years
Resource Class
12/30/1999
4.79
%
1.66
%
1.06
%
Performance Availability Website Address [Text] www.invesco.com/us