To seek growth and income.
This table describes the fees and expenses that you may pay if you buy and hold shares of the World Energy Fund. You may qualify for sales charge discounts if you and your family invest or agree to invest in the future, at least $200,000 in Cavanal Hill Funds. More information on these and other discounts is available from your financial professional and in the section “Initial Sales Charge (Bond and Equity Funds, Class A Shares Only)” on page 43 of the prospectus and “Contingent Deferred Sales Charges (CDSC-Class A and C Only)” on page 44 in the prospectus and in the section “Additional Purchase and Redemption Information” on page 34 of the Statement of Additional Information. An investor transacting in Institutional Shares, which do not have any front-end sales charge, contingent deferred sales charge, or other asset-based fee for sales or distribution, may be required to pay a commission to a broker or other financial intermediary for effecting such transactions on an agency basis. Such commissions are not reflected in the tables or the example below. Shares of the Fund are available in other share classes that have different fees and expenses.
Shareholder Fees - World Energy Fund |
A Shares |
C Shares |
Investor Shares |
Institutional Shares |
||
|---|---|---|---|---|---|---|
| Maximum Sales Charge (Load) imposed on Purchases (as a percentage of offering price) | 2.00% | none | none | none | ||
| Maximum Deferred Sales Charge (Load) (as a percentage of the lesser of original purchase price or redemption proceeds) | 1.00% | [1] | 1.00% | [1] | none | none |
| [1] | Class A Shares are available with no front-end sales charge on investments of $200,000 or more. There is, however, a contingent deferred sales charge (CDSC) of 1.00% on any Class A Shares upon which a dealer concession was paid that are sold within one year of purchase. In addition, while C Shares are offered at NAV, without any initial sales charge, a 1.00% CDSC may be charged on any C Shares upon which a dealer concession has been paid that are sold within one year of purchase. |
Annual Fund Operating Expenses - World Energy Fund |
A Shares |
C Shares |
Investor Shares |
Institutional Shares |
|
|---|---|---|---|---|---|
| Management Fees | 0.60% | 0.60% | 0.60% | 0.60% | |
| Distribution and/or Service (12b-1) Fees | 0.25% | 1.00% | 0.25% | ||
| Other Expenses | 0.43% | 0.58% | 0.58% | 0.58% | |
| Shareholder Servicing Fees | 0.10% | 0.25% | 0.25% | 0.25% | |
| Acquired Fund Fees and Expenses | 0.03% | 0.03% | 0.03% | 0.03% | |
| Total Annual Fund Operating Expenses | 1.31% | 2.21% | 1.46% | 1.21% | |
| Less Fee Waivers | [1] | (0.13%) | (0.28%) | (0.28%) | (0.28%) |
| Total Annual Fund Operating Expenses After Fee Waivers | 1.18% | 1.93% | 1.18% | 0.93% | |
| [1] | The Adviser has contractually agreed to waive fees payable to it or reimburse certain expenses so that expenses (other than extraordinary expenses and any Acquired Fund Fees and Expenses) for each Class do not exceed 0.90%, plus class-specific fees until December 31, 2025. Affiliates of the Adviser have contractually agreed to waive all Shareholder Servicing Fees to which they are entitled. The affiliate waivers result in a reduction of the Shareholder Servicing Fee paid by all purchasers of a Class to the extent shown in the table. Contractual waivers are in place for the period through December 31, 2025 and may only be terminated or modified with the approval of the Fund’s Board of Trustees. |
This example is intended to help you compare the cost of investing in the Fund with the cost of investing in other mutual funds. The example assumes that you invest $10,000 in the Fund for the time periods indicated and then redeem all of your shares at the end of those periods. The example also assumes that your investment has a 5% return each year and that the Fund’s operating expenses remain the same. Although your actual costs may be higher or lower, based on these assumptions your costs would be:
Expense Example - World Energy Fund - USD ($) |
1 Year |
3 Years |
5 Years |
10 Years |
|---|---|---|---|---|
| A Shares | 318 | 594 | 892 | 1,736 |
| C Shares | 196 | 664 | 1,159 | 2,522 |
| Investor Shares | 120 | 434 | 771 | 1,722 |
| Institutional Shares | 95 | 356 | 638 | 1,441 |
The World Energy Fund pays transaction costs, such as commissions, when it buys and sells securities (or “turns over” its portfolio). A higher portfolio turnover rate may indicate higher transaction costs and may result in higher taxes when Fund shares are held in a taxable account. These costs, which are not reflected in annual fund operating expenses or in the example, affect the Fund’s performance. During the most recent fiscal year, the Fund’s portfolio turnover rate was 161% of the average value of its portfolio.
To pursue its objective, under normal circumstances, the Fund invests at least 80% of its net assets in a wide range of energy-related financial instruments issued in the U.S. and markets around the world. This policy will not be changed without at least 60 days prior notice to shareholders. Energy-related financial instruments may include foreign and domestic securities of issuers that derive more than fifty percent of their assets, revenue or income from activities related to the exploration, extraction, mining, research, development, conservation, refinement, production, transfer, transmission, and transportation of conventional, alternative, renewable and sustainable energy sources, as well as utilities, petrochemicals, plastics, and suppliers and servicers to such industries. Investments typically include a combination of common stock, bonds, exchange traded funds (“ETFs”) and exchange traded notes (“ETNs”) but may also include other asset types that are related to energy industry activities. The Fund’s energy-related financial instruments may include sponsored and unsponsored ADRs and GDRs. The Fund may also seek to provide exposure to the investment returns of commodities through investment in commodity-linked derivative instruments, commodity futures, options on commodity future contracts, and investment vehicles that focus on commodities such as ETFs that invest in commodities, commodity options and futures.
The Fund may engage in active and frequent trading.
Under normal market conditions, the Fund will invest at least 40%, but may invest up to 100%, of its net assets in the securities of issuers organized or having their principal place of business outside the U.S. or doing a substantial amount of business outside the U.S. The Fund will consider an issuer to be doing a substantial amount of business outside the U.S. if it derives more than 50% of its assets, revenue or income outside of the U.S. or is an international focused ETF or ETN. Under normal market conditions, the Fund invests in issuers from at least three different countries. The Adviser invests the Fund’s assets based on its judgment about issuers, risk, prices of securities, market conditions, potential returns, and other economic factors in the U.S. and around the world.
The Fund may invest in long and short positions in securities of issuers of any market capitalization, emerging market securities, American depositary receipts, European depositary receipts, global depositary receipts, and master limited partnerships (“MLPs”). The Fund may also invest in pooled investment vehicles, including other registered investment companies (“RICs”), ETNs and ETFs, including leveraged and inverse ETFs.
The Fund may invest in fixed income securities of any credit quality and maturity, including those of defaulted/distressed issuers. These securities can be rated below investment grade (“junk bonds” or high yield securities) and thus rated below Baa3 by Moody’s, BBB- by S&P or BBB- by Fitch Ratings Ltd. or unrated and securities in default. Fixed income investments may include foreign and domestic sovereign issued securities.
The bar chart and the performance table below illustrate some of the risks and return volatility of an investment in the Fund by showing changes in the Fund’s performance from year to year and by showing how the Fund’s average annual returns for 1 and 5 years and since inception compare with those of a broad measure of market performance. The Fund’s past performance (before or after taxes) does not necessarily indicate how the Fund will perform in the future. Updated performance information may be obtained on the Fund’s website www.cavanalhillfunds.com or by calling 1-800-762-7085.
This bar chart shows changes in the Fund’s performance from year to year1. The returns for A Shares, C Shares and Institutional Shares will differ from the returns for Investor Shares (which are shown in the bar chart) because of differences in the expenses of each class.
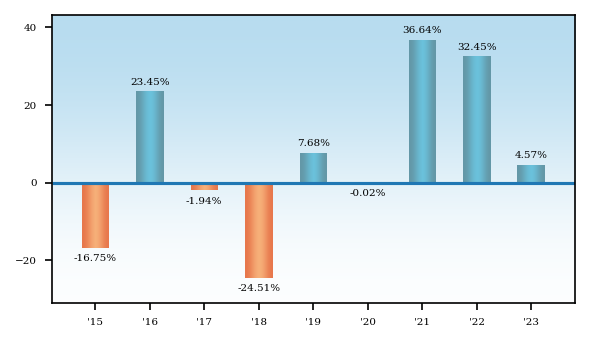
1The performance information shown above is based on a calendar year. The Fund’s total return from 1/1/24 to 9/30/24 was 6.10%.
This table compares the Fund’s average annual total returns for periods ended December 31, 2023 to those of the S&P 500 Index and the MSCI World Energy Index. The A Shares initially imposed a sales charge of 5.50% which was reduced to 3.50% on December 31, 2014 and then to 2.00% on December 26, 2017. The stated returns assume the highest historical federal marginal income and capital gains tax rates. These after-tax returns do not reflect the effect of any applicable state and local taxes. Actual after-tax returns depend on an investor’s tax situation and may differ from those shown. After-tax returns are not relevant to investors holding shares through tax-deferred programs, such as IRA or 401(k) plans. After-tax returns are shown only for the Investor Class Shares and after-tax returns for other shares will vary.
Average Annual Returns - World Energy Fund |
Label |
1 Year |
5 Years |
Since Inception |
Inception Date |
|---|---|---|---|---|---|
| Investor Shares | Return Before Taxes | 4.57% | 15.30% | 4.12% | Feb. 03, 2014 |
| Investor Shares | Return After Taxes on Distributions | Return After Taxes on Distributions | 4.18% | 14.80% | 3.78% | Feb. 03, 2014 |
| Investor Shares | Return After Taxes on Distributions and Sale of Fund Shares | Return After Taxes on Distributions and Sale of Fund Shares | 2.97% | 12.23% | 3.17% | Feb. 03, 2014 |
| Institutional Shares | Return Before Taxes | 4.93% | 15.60% | 4.42% | Feb. 03, 2014 |
| A Shares | Return Before Taxes (With Load) | 2.49% | 14.83% | 3.93% | Feb. 03, 2014 |
| C Shares | Return Before Taxes | 3.82% | 14.42% | 3.37% | Feb. 03, 2014 |
| S&P 500 Index (reflects no deduction for expenses, fees or taxes) | S&P 500 Index (reflects no deduction for expenses, fees or taxes) | 24.23% | 13.73% | 10.70% | Feb. 03, 2014 |
| MSCI World Energy Index (reflects no deduction for expenses, fees or taxes) | MSCI World Energy Index (reflects no deduction for expenses, fees or taxes) | 3.53% | 11.11% | 3.83% | Feb. 03, 2014 |