To seek current income with liquidity and stability of principal.
This table describes the fees and expenses that you may pay if you buy and hold shares of the Government Securities Money Market Fund. An investor transacting in Institutional Shares, which do not have any front-end sales charge, contingent deferred sales charge, or other asset-based fee for sales or distribution, may be required to pay a commission to a broker or other financial intermediary for effecting such transactions on an agency basis. Such commissions are not reflected in the tables or the example below. Shares of the Fund are available in other share classes that have different fees and expenses.
Annual Fund Operating Expenses - Government Securities Money Market Fund |
Administrative |
Institutional |
Select |
Premier |
|
|---|---|---|---|---|---|
| Management Fees | 0.05% | 0.05% | 0.05% | 0.05% | |
| Distribution and/or Service (12b-1) Fees | 0.25% | 0.50% | |||
| Other Expenses | 0.39% | 0.39% | 0.39% | 0.39% | |
| Shareholder Servicing Fees | 0.25% | 0.25% | 0.25% | 0.25% | |
| Acquired Fund Fees and Expenses | 0.01% | 0.01% | 0.01% | 0.01% | |
| Total Annual Fund Operating Expenses | 0.70% | 0.45% | 0.45% | 0.95% | |
| Less Fee Waivers† | [1] | (0.17%) | (0.25%) | (0.25%) | |
| Total Annual Fund Operating Expenses After Fee Waivers | 0.70% | 0.28% | 0.20% | 0.70% | |
| [1] | Affiliates of the Adviser have contractually agreed to waive all Shareholder Servicing Fees to which they are entitled paid by Select and Premier Shares and 0.17% paid by Institutional Shares. The affiliate waivers result in a reduction of the Shareholder Servicing Fee paid by all purchasers of a Class to the extent shown in the table. Contractual waivers are in place for the period through December 31, 2025 and may only be terminated or modified with the approval of the Fund’s Board of Trustees. |
This example is intended to help you compare the cost of investing in the Fund with the cost of investing in other mutual funds. The example assumes that you invest $10,000 in the Fund for the time periods indicated and then redeem all of your shares at the end of those periods. The example also assumes that your investment has a 5% return each year and that the Fund’s operating expenses remain the same. Although your actual costs may be higher or lower, based on these assumptions your costs would be:
Expense Example - Government Securities Money Market Fund - USD ($) |
1 Year |
3 Years |
5 Years |
10 Years |
|---|---|---|---|---|
| Administrative | 72 | 224 | 390 | 871 |
| Institutional | 29 | 127 | 235 | 550 |
| Select | 20 | 119 | 227 | 543 |
| Premier | 72 | 278 | 501 | 1,144 |
To pursue its objective, under normal circumstances, the Fund invests at least 99.5% of its total assets in cash, U.S. Government Securities, or repurchase agreements collateralized by U.S. Government Securities and other U.S. Government Security investment companies. The Fund also invests at least 80% of its net assets in U.S. Government Securities or repurchase agreements collateralized by U.S. Government Securities. These policies will not be changed without at least 60 days prior notice to shareholders.
The dollar-weighted average portfolio maturity of the Fund will not exceed 60 days and the dollar-weighted average portfolio life cannot exceed 120 days.
The bar chart and the performance table below illustrate some of the risks and return volatility of an investment in the Fund by showing changes in the Fund’s performance from year to year and by showing the Fund’s average annual returns for 1, 5 and 10 years. The Fund’s past performance does not necessarily indicate how the Fund will perform in the future. Prior to April 2016, the Fund was named the Cash Management Fund. Updated performance information may be obtained on the Fund’s website www.cavanalhillfunds.com or by calling 1-800-762-7085.
This bar chart shows changes in the Fund’s performance from year to year1. The returns for Institutional, Select and Premier Shares will differ from the returns for Administrative Shares (which are shown in the bar chart) because of differences in the expenses of each Class.
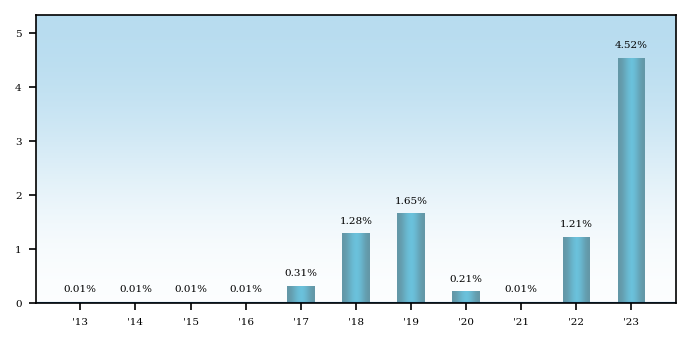
1The performance information shown above is based on a calendar year. The Fund’s total return from 1/1/24 to 9/30/24 was 3.55%.
This table shows the Fund’s average annual total returns for periods ended December 31, 2023. The Select Shares commenced operations on September 15, 2016. The performance shown for periods prior to commencement of operations of the Select Shares is that of the Institutional Shares. The shares would have substantially similar performance because shares are invested in the same portfolio of securities. The performance shown is lower than actual returns would have been because the predecessor class had a higher expense ratio.
Average Annual Returns - Government Securities Money Market Fund |
1 Year |
5 Years |
10 Years |
|---|---|---|---|
| Administrative | 4.52% | 1.51% | 0.91% |
| Institutional | 4.89% | 1.69% | 1.07% |
| Premier | 4.68% | 1.67% | 1.07% |
| Select | 4.98% | 1.75% | 1.11% |
Yield
The 7-day yield for the period ended 12/31/23 was 4.82% for Administrative Shares; 5.26% for Institutional Shares; 4.82% for Premier Shares; and 5.34% for Select Shares.
You may obtain the most current yield information for the Fund by calling (800) 762-7085.