Total return, consisting of long-term capital appreciation and current income.
These tables describe the fees and expenses that you may pay if you buy, hold and sell shares of the fund. You may pay other fees, such as brokerage commissions and other fees to financial intermediaries, which are not reflected in the table or example below. You may qualify for sales charge discounts on purchases of Class A shares if you or your family invest, or agree to invest in the future, at least $50,000 in the UBS family of funds. More information about these and other discounts and waivers, as well as eligibility requirements for each share class, is available from your financial advisor and in "Managing your fund account" beginning on page 20 of this prospectus and in "Reduced sales charges, additional purchase, exchange and redemption information and other services" beginning on page 58 of the fund's Statement of Additional Information ("SAI"). Different intermediaries and financial professionals may make available different sales charge waivers or discounts. These variations are described in Appendix A beginning on page A-1 of this prospectus (Intermediary-Specific Sales Charge Waivers and Discounts).
In addition to the fees and expenses described below, you may also be required to pay commissions or other fees to your broker for transactions in Class P shares. Class A and P shares of the fund have different fees and expenses as shown below.
|
Class A |
Class P |
||||||||||
|
Maximum front-end sales charge (load) imposed on purchases (as a % of the offering price) |
5.50 |
% |
None |
||||||||
|
Maximum deferred sales charge (load) (as a % of the lesser of the offering or the redemption price) |
None1 |
None |
|||||||||
|
Exchange fee |
None |
None |
|||||||||
|
Class A |
Class P |
||||||||||
|
Management fees |
0.50 |
% |
0.50 |
% |
|||||||
|
Service (12b-1) fees |
0.25 |
None |
|||||||||
|
Other expenses |
0.28 |
0.26 |
|||||||||
|
Acquired fund fees and expenses2 |
0.01 |
0.01 |
|||||||||
|
Total annual fund operating expenses |
1.04 |
0.77 |
|||||||||
1 Purchases of $1 million or more that were not subject to a front-end sales charge are subject to a 1% contingent deferred sales charge ("CDSC") if sold within one year of the purchase date.
2 Since the "Acquired fund fees and expenses" are not directly borne by the fund, they are not reflected in the fund's financial statements, and therefore the amounts listed in "Total annual fund operating expenses" will differ from those presented in the Financial highlights.
This example is intended to help you compare the cost of investing in the fund with the cost of investing in other mutual funds. The example assumes that you invest $10,000 in the fund for the time periods indicated and then redeem all of your shares at the end of those periods unless otherwise stated. The example also assumes that your investment has a 5% return each year and that the fund's operating expenses remain the same.
Although your actual costs may be higher or lower, based on these assumptions your costs would be:
|
1 year |
3 years |
5 years |
10 years |
||||||||||||||||
|
Class A |
$ |
650 |
$ |
863 |
$ |
1,092 |
$ |
1,751 |
|||||||||||
|
Class P |
79 |
246 |
428 |
954 |
|||||||||||||||
The fund pays transaction costs, such as commissions or dealer spreads, when it buys and sells securities (or "turns over" its portfolio). A higher portfolio turnover rate may indicate higher transaction costs and may result in higher taxes when fund shares are held in a taxable account. These costs, which are not reflected in annual fund operating expenses or in the example, affect the fund's performance. During the most recent fiscal year, the fund's portfolio turnover rate was 58% of the average value of its portfolio.
Principal investments
Under normal circumstances, the fund invests at least 80% of its net assets (plus borrowings for investment purposes, if any) in US fixed income and equity securities. The following are the ranges within which the fund, under normal market circumstances, expects to allocate its assets among the various asset classes: (1) US equities—20-90%; (2) investment grade fixed income—0-70%; (3) high yield fixed income—0-15%; and (4) cash equivalents—0-50%. The fund may exceed these ranges and may modify them in the future.
Investments in fixed income securities, which are not subject to any credit rating or maturity limitations, may include debt securities of the US government, its agencies and instrumentalities; debt securities of US corporations; and mortgage-backed securities and asset-backed securities. There are different types of US government securities, including those issued or guaranteed by the US government, its agencies and its instrumentalities, and they have different types of government support. Some are supported by the full faith and credit of the US, while others are supported by (1) the ability of the issuer to borrow from the US Treasury; (2) the credit of the issuing agency, instrumentality or government-sponsored entity; (3) pools of assets, such as mortgages; or (4) the US government in some other way.
Investments in equity securities may include dividend-paying securities, common stock and preferred stock. Equity investments may include large, intermediate and small capitalization companies. The fund may also invest in other securities, such as initial public offerings ("IPOs").
The fund may, but is not required to, use exchange-traded or over-the-counter derivative instruments for risk management purposes or as part of the fund's investment strategies. The derivatives in which the fund may invest include futures, index options, forward agreements, swap agreements (specifically, total return swaps, interest rate swaps, and credit default swaps), equity participation notes and equity linked notes. All of these derivatives may be used for risk management purposes, such as hedging against a specific security or currency (except with respect to equity participation notes and equity linked notes), or to manage or adjust the risk profile of the fund. In addition, all of the derivative instruments listed above may be used for investment (non-hedging) purposes to earn income; to enhance returns; to replace more traditional direct investments; to obtain exposure to certain markets; or to establish net short positions for individual markets, currencies or securities. Futures on indices and forward agreements may also be used to adjust the fund's portfolio duration.
UBS Asset Management (Americas) LLC ("UBS AM"), the fund's investment advisor, actively manages the fund. As such, increased portfolio turnover may result in higher levels of brokerage commissions, transaction costs and taxable gains and may therefore adversely affect fund performance. The fund also may invest in other open-end investment companies advised by UBS AM and in exchange-traded funds ("ETFs") in order to pursue its investment objective. The fund pays expenses associated with such investments.
Management process
The fund is a multi-asset fund and allocates its assets among the major domestic asset classes (US fixed-income, including US high yield (lower-rated) securities, and US equities) based upon UBS AM's assessment of prevailing market conditions in the US and abroad. In determining the asset allocation of the fund, UBS AM may utilize fundamental valuation and market behavior indicators to construct the fund's portfolio.
Within the equity portion of the fund, UBS AM may focus on securities whose fundamental values (UBS AM's assessment of what a security is worth) it believes are greater than their market prices. UBS AM then compares its assessment of a security's value against the prevailing market prices with the aim of constructing a portfolio of stocks with attractive relative price/value characteristics.
UBS AM's fixed income strategy combines judgments about the absolute value of the fixed income universe and the relative value of issuer sectors, maturity intervals, duration of securities, quality and coupon segments and specific circumstances facing the issuers of fixed income securities. Duration management involves adjusting the sensitivity to interest rates of the holdings. UBS AM manages duration by choosing a maturity mix that provides opportunity for appreciation while also limiting interest rate risk.
The fund may invest in cash or cash equivalent instruments, including shares of an affiliated investment company. When market conditions warrant, the fund may make substantial temporary defensive investments in cash equivalents, which may affect its ability to pursue its investment objective.
Risk/return bar chart and table
The performance information that follows shows the fund's performance information in a bar chart and an average annual total returns table. The bar chart does not reflect the sales charges of the fund's Class A shares; if it did, the total returns shown would be lower. The information provides some indication of the risks of investing in the fund by showing changes in the fund's performance from year to year and by showing how the fund's average annual total returns compare with those of the S&P 500 Index, which represents a broad measure of market performance, as well as an additional index over time. The UBS U.S. Allocation Fund Benchmark is an unmanaged benchmark compiled by UBS AM that shows how the fund's performance compares to a benchmark constructed as follows: 65% Russell 3000 Index, 30% Bloomberg US Aggregate Index, and 5% BofA Merrill Lynch US High Yield Cash Pay Constrained Index. The fund's past performance (before and after taxes) is not necessarily an indication of how the fund will perform in the future. Updated performance for the fund is available at www.ubs.com/us/en/assetmanagement/funds/mutual-fund-performance.
After-tax returns are calculated using the historical highest individual federal marginal income tax rates and do not reflect the impact of state and local taxes. Actual after-tax returns depend on an investor's tax situation and may differ from those shown. In addition, the after-tax returns shown are not relevant to investors who hold fund shares through tax-advantaged arrangements, such as 401(k) plans or individual retirement accounts. After-tax returns for other classes will vary from the Class A shares' after-tax returns shown.
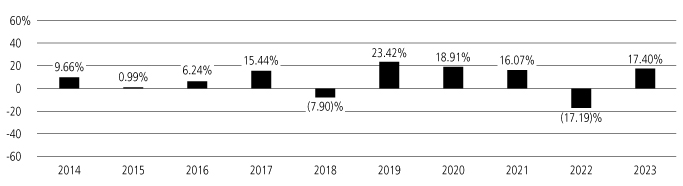
Total return January 1 – September 30, 2024: 13.23%
Best quarter during calendar years shown—2Q 2020: 16.24%
Worst quarter during calendar years shown—1Q 2020: (14.53)%
|
Class |
1 year |
5 years |
10 years |
||||||||||||
|
Class A |
|||||||||||||||
|
Return before taxes |
10.94 |
% |
9.37 |
% |
6.95 |
% |
|||||||||
|
Return after taxes on distributions |
10.31 |
7.24 |
5.51 |
||||||||||||
|
Return after taxes on distributions and sale of fund shares |
6.47 |
6.95 |
5.24 |
||||||||||||
|
Class P* |
|||||||||||||||
|
Return before taxes |
17.72 |
10.91 |
7.84 |
||||||||||||
|
S&P 500 Index |
26.29 |
15.69 |
12.03 |
||||||||||||
|
UBS U.S. Allocation Fund Benchmark (Indices reflect no deduction for fees, expenses or taxes.) |
18.96 |
10.60 |
8.39 |
||||||||||||
* Effective July 28, 2014, Class Y shares were redesignated as Class P shares.