Aug. 31, 2024
The fund’s goal is to track as closely as possible, before fees and expenses, the total return of the FTSE Developed Small Cap ex US Liquid Index.
This table describes the fees and expenses you may pay if you buy, hold and sell shares of the fund. You may pay other fees, such as brokerage commissions and other fees to financial intermediaries, which are not reflected in the table and Example below.
| Shareholder Fees (fees paid directly from your investment) | | |||
| | | | None | |
| Annual Fund Operating Expenses (expenses that you pay each year as a % of the value of your investment) | | |||
| Management fees | | | 0.11 | |
| Other expenses | | | None | |
| Total annual fund operating expenses | | | 0.11 | |
This example is intended to help you compare the cost of investing in the fund with the cost of investing in other funds. The example assumes that you invest $10,000 in the fund for the time periods indicated and then sell all of your shares at the end of those time periods. The example also assumes that your investment has a 5% return each year and that the fund’s operating expenses remain the same. Your actual costs may be higher or lower.
| | Expenses on a $10,000 Investment | | |||||||||||||||||||||
| | 1 Year | | | 3 Years | | | 5 Years | | | 10 Years | | ||||||||||||
| | | $ | 11 | | | | | $ | 35 | | | | | $ | 62 | | | | | $ | 141 | | |
The fund pays transaction costs, such as commissions, when it buys and sells securities (or “turns over” its portfolio). A higher portfolio turnover may indicate higher transaction costs and may result in higher taxes when fund shares are held in a taxable account. These costs, which are not reflected in the annual fund operating expenses or in the example, affect the fund’s performance. During the most recent fiscal year, the fund’s portfolio turnover rate was 14% of the average value of its portfolio.
To pursue its goal, the fund generally invests in stocks that are included in the FTSE Developed Small Cap ex US Liquid Index†. The
index is comprised of small capitalization companies in developed countries outside the United States, as defined by the index provider. The index defines the small capitalization universe as approximately the bottom 10% of the eligible universe with a minimum free float capitalization of $150 million. As of August 31, 2024, the index was composed of 2,134 stocks in 25 developed market countries.
It is the fund’s policy that under normal circumstances it will invest at least 90% of its net assets (including, for this purpose, any borrowings for investment purposes) in these stocks, including depositary receipts representing securities of the index; such depositary receipts may be in the form of American Depositary Receipts (ADRs), Global Depositary Receipts (GDRs) and European Depositary Receipts (EDRs). The fund will notify its shareholders at least 60 days before changing this policy. The fund may sell securities that are represented in the index in anticipation of their removal from the index, or buy securities that are not yet represented in the index in anticipation of their addition to the index. The fund generally expects that its country weightings will be similar to those of the index.
Under normal circumstances, the fund may invest up to 10% of its net assets in securities not included in the index. The principal types of these investments include those that the investment adviser believes will help the fund track the index, such as investments in (a) securities that are not represented in the index but the investment adviser anticipates will be added to the index or as necessary to reflect various corporate actions (such as mergers and spin-offs); (b) other investment companies; and (c) derivatives, principally futures contracts. The fund may use futures contracts and other derivatives primarily to seek returns on the fund’s otherwise uninvested cash assets to help it better track the index. The fund may also invest in cash and cash equivalents, including money market funds, and may lend its securities to minimize the difference in performance that naturally exists between an index fund and its corresponding index. The fund does not hedge its exposure to foreign currencies.
Because it may not be possible or practicable to purchase all of the stocks in the index, the investment adviser seeks to track the total return of the index by using sampling techniques. Sampling techniques involve investing in a limited number of index securities which, when taken together, are expected to perform similarly to the index as a whole. These techniques are based on a variety of factors, including performance attributes, tax considerations, country weightings, capitalization, industry factors, risk factors and other characteristics. The fund generally expects that its portfolio
†
Index ownership — FTSE is a trademark of the London Stock Exchange Group companies (LSEG) and is used by the fund under license. The Schwab International Small-Cap Equity ETF is not sponsored, endorsed, sold or promoted by FTSE nor LSEG and neither FTSE nor LSEG makes any representation regarding the advisability of investing in shares of the fund. Fees payable under the license are paid by the investment adviser.
will hold less than the total number of securities in the index, but reserves the right to hold as many securities as it believes necessary to achieve the fund’s investment objective.
The fund will concentrate its investments (i.e., hold more than 25% of its total assets) in a particular industry, group of industries or sector to approximately the same extent that the index is so concentrated.
The bar chart below shows how the fund’s investment results have varied from year to year, and the following table shows how the fund’s average annual total returns for various periods compared to that of one or more indices. The MSCI EAFE Index (Net) serves as the fund’s regulatory index and provides a broad measure of market performance. The fund generally invests in securities that are included in the FTSE Developed Small Cap ex US Liquid Index (Net). The fund does not seek to track the regulatory index. This information provides some indication of the risks of investing in the fund. All figures assume distributions were reinvested. Keep in mind that future performance (both before and after taxes) may differ from past performance. For current performance information, please see
www.schwabassetmanagement.com/prospectus.
www.schwabassetmanagement.com/prospectus.
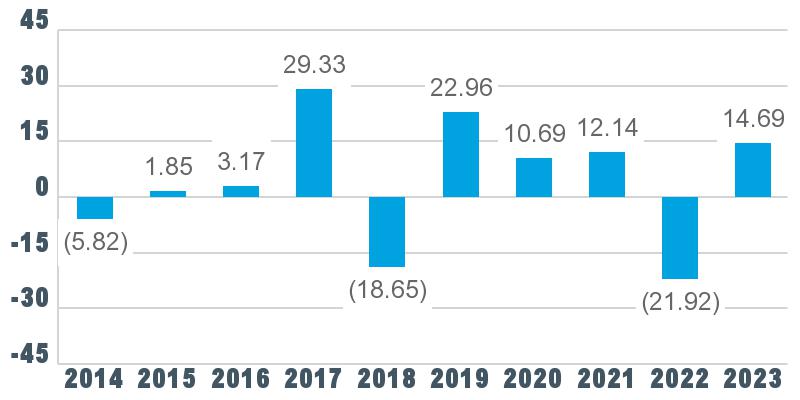
Best Quarter: 21.93% Q2 2020
Worst Quarter: (29.92%) Q1 2020
Year-to-date performance (before taxes) as of 9/30/24: 10.88%
| Average Annual Total Returns as of 12/31/23 | | ||||||||||||||||||
| | | | 1 Year | | | 5 Years | | | 10 Years | | |||||||||
| Before taxes | | | | | 14.69% | | | | | | 6.45% | | | | | | 3.59% | | |
| After taxes on distributions | | | | | 13.99% | | | | | | 5.85% | | | | | | 2.99% | | |
| After taxes on distributions and sale of shares | | | | | 9.35% | | | | | | 5.07% | | | | | | 2.76% | | |
| Comparative Indices (reflects no deduction for expenses or taxes) | | | | | | | | | | | | | | | | | | | |
| MSCI EAFE Index (Net)(1) | | | | | 18.24% | | | | | | 8.16% | | | | | | 4.28% | | |
| FTSE Developed Small Cap ex US Liquid Index (Net)(1) | | | | | 14.52% | | | | | | 6.29% | | | | | | 3.47% | | |
(1)
The net version of the index reflects reinvested dividends net of withholding taxes, but reflects no deductions for expenses or other taxes.
The after-tax figures reflect the highest individual federal income tax rates in effect during the period and do not reflect the impact of state and local taxes. Your actual after-tax returns depend on your individual tax situation. In addition, after-tax returns are not relevant if you hold your fund shares through a tax-deferred arrangement, such as a 401(k) plan, an individual retirement account (IRA) or other tax-advantaged account.