Performance Management
Aug. 31, 2024
Because the fund has not completed a full calendar year of operations, no performance figures are given. Once the fund has completed a full calendar year of operations, a bar chart and table will be included that will provide some indication of the risks of investing in the fund by showing the variability of the fund’s returns and comparing the fund’s performance to one or more indices. For current performance information, once available, please see
www.schwabassetmanagement.com/prospectus.
www.schwabassetmanagement.com/prospectus.
The bar chart below shows how the fund’s investment results have varied from year to year, and the following table shows how the fund’s average annual total returns for various periods compared to that of one or more indices. The MSCI EAFE Index (Net) serves as the fund’s regulatory index and provides a broad measure of market performance. The fund generally invests in securities that are included in the Dow Jones International Dividend 100 Index (Net). The fund does not seek to track the regulatory index. This information provides some indication of the risks of investing in the fund. All figures assume distributions were reinvested. Keep in mind that future performance (both before and after taxes) may differ from past performance. For current performance information, please see
www.schwabassetmanagement.com/prospectus.
www.schwabassetmanagement.com/prospectus.
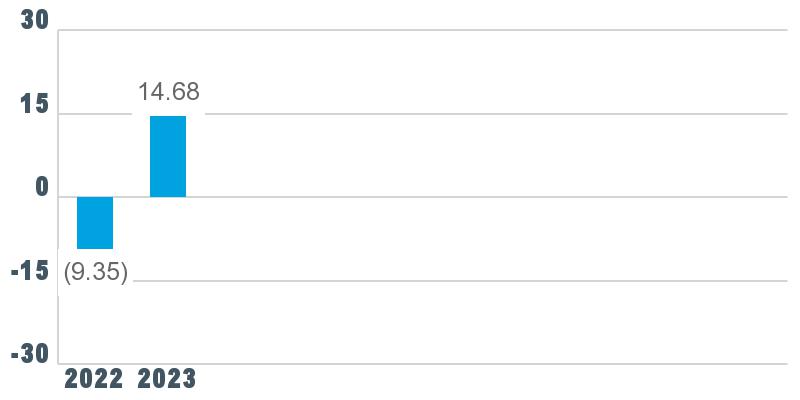
Best Quarter: 14.67% Q4 2022
Worst Quarter: (12.35%) Q2 2022
Year-to-date performance (before taxes) as of 9/30/24: 9.53%
| Average Annual Total Returns as of 12/31/23 | | ||||||||||||
| | | | 1 Year | | | Since Inception (04/29/21) | | ||||||
| Before taxes | | | | | 14.68% | | | | | | 3.09% | | |
| After taxes on distributions | | | | | 13.89% | | | | | | 2.43% | | |
| After taxes on distributions and sale of shares | | | | | 9.71% | | | | | | 2.51% | | |
| Comparative Indices (reflects no deduction for expenses or taxes) | | | | | | | | | | | | | |
| MSCI EAFE Index (Net)(1) | | | | | 18.24% | | | | | | 1.68% | | |
| Dow Jones International Dividend 100 Index (Net)(1) | | | | | 14.74% | | | | | | 3.16% | | |
(1)
The net version of the index reflects reinvested dividends net of withholding taxes, but reflects no deductions for expenses or other taxes.
The after-tax figures reflect the highest individual federal income tax rates in effect during the period and do not reflect the impact of state and local taxes. Your actual after-tax returns depend on your individual tax situation. In addition, after-tax returns are not relevant if you hold your fund shares through a tax-deferred arrangement, such as a 401(k) plan, an individual retirement account (IRA) or other tax-advantaged account. In some cases, the return after taxes on distributions and sale of shares may exceed the fund’s other returns due to an assumed benefit from any losses on a sale of shares at the end of the measurement period.
The bar chart below shows how the fund’s investment results have varied from year to year, and the following table shows how the fund’s average annual total returns for various periods compared to that of one or more indices. The MSCI EAFE Index (Net) serves as the fund’s regulatory index and provides a broad measure of market performance. The fund generally invests in securities that are included in the FTSE Developed ex US Index (Net). The fund does not seek to track the regulatory index. This information provides some indication of the risks of investing in the fund. All figures assume distributions were reinvested. Keep in mind that future performance (both before and after taxes) may differ from past performance. For current performance information, please see
www.schwabassetmanagement.com/prospectus.
www.schwabassetmanagement.com/prospectus.
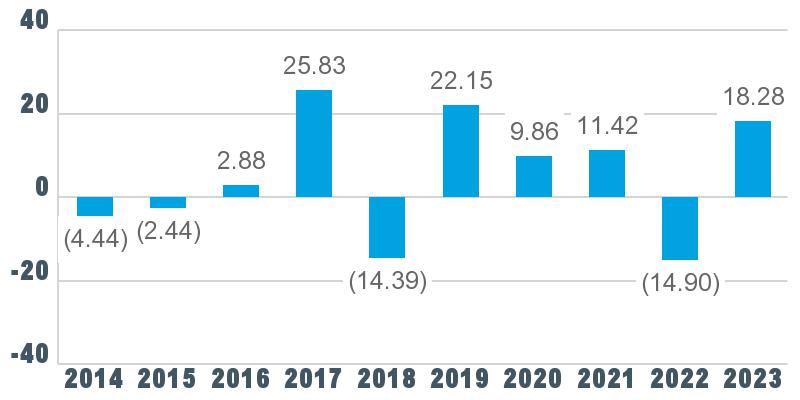
Best Quarter: 16.96% Q4 2020
Worst Quarter: (23.12%) Q1 2020
Year-to-date performance (before taxes) as of 9/30/24: 12.32%
| Average Annual Total Returns as of 12/31/23 | | ||||||||||||||||||
| | | | 1 Year | | | 5 Years | | | 10 Years | | |||||||||
| Before taxes | | | | | 18.28% | | | | | | 8.52% | | | | | | 4.51% | | |
| After taxes on distributions | | | | | 17.55% | | | | | | 7.91% | | | | | | 3.96% | | |
| After taxes on distributions and sale of shares | | | | | 11.50% | | | | | | 6.77% | | | | | | 3.58% | | |
| Comparative Indices (reflects no deduction for expenses or taxes) | | | | | | | | | | | | | | | | | | | |
| MSCI EAFE Index (Net)(1) | | | | | 18.24% | | | | | | 8.16% | | | | | | 4.28% | | |
| FTSE Developed ex US Index (Net)(1) | | | | | 18.06% | | | | | | 8.37% | | | | | | 4.41% | | |
(1)
The net version of the index reflects reinvested dividends net of withholding taxes, but reflects no deductions for expenses or other taxes.
The after-tax figures reflect the highest individual federal income tax rates in effect during the period and do not reflect the impact of state and local taxes. Your actual after-tax returns depend on your individual tax situation. In addition, after-tax returns are not relevant if you hold your fund shares through a tax-deferred arrangement, such as a 401(k) plan, an individual retirement account (IRA) or other tax-advantaged account.
The bar chart below shows how the fund’s investment results have varied from year to year, and the following table shows how the fund’s average annual total returns for various periods compared to that of one or more indices. The MSCI EAFE Index (Net) serves as the fund’s regulatory index and provides a broad measure of market performance. The fund generally invests in securities that are included in the FTSE Developed Small Cap ex US Liquid Index (Net). The fund does not seek to track the regulatory index. This information provides some indication of the risks of investing in the fund. All figures assume distributions were reinvested. Keep in mind that future performance (both before and after taxes) may differ from past performance. For current performance information, please see
www.schwabassetmanagement.com/prospectus.
www.schwabassetmanagement.com/prospectus.
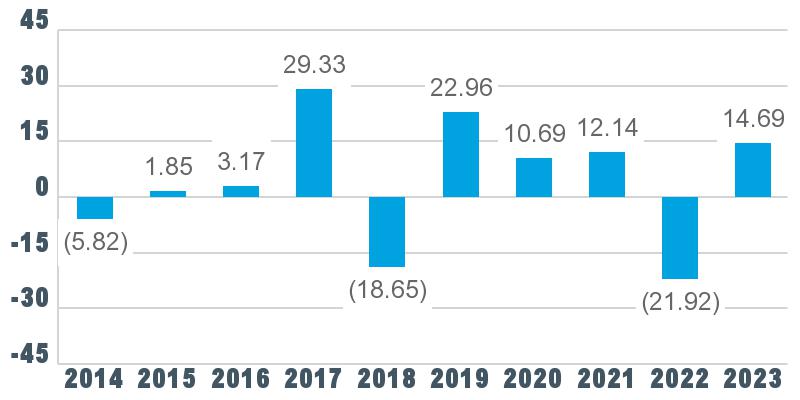
Best Quarter: 21.93% Q2 2020
Worst Quarter: (29.92%) Q1 2020
Year-to-date performance (before taxes) as of 9/30/24: 10.88%
| Average Annual Total Returns as of 12/31/23 | | ||||||||||||||||||
| | | | 1 Year | | | 5 Years | | | 10 Years | | |||||||||
| Before taxes | | | | | 14.69% | | | | | | 6.45% | | | | | | 3.59% | | |
| After taxes on distributions | | | | | 13.99% | | | | | | 5.85% | | | | | | 2.99% | | |
| After taxes on distributions and sale of shares | | | | | 9.35% | | | | | | 5.07% | | | | | | 2.76% | | |
| Comparative Indices (reflects no deduction for expenses or taxes) | | | | | | | | | | | | | | | | | | | |
| MSCI EAFE Index (Net)(1) | | | | | 18.24% | | | | | | 8.16% | | | | | | 4.28% | | |
| FTSE Developed Small Cap ex US Liquid Index (Net)(1) | | | | | 14.52% | | | | | | 6.29% | | | | | | 3.47% | | |
(1)
The net version of the index reflects reinvested dividends net of withholding taxes, but reflects no deductions for expenses or other taxes.
The after-tax figures reflect the highest individual federal income tax rates in effect during the period and do not reflect the impact of state and local taxes. Your actual after-tax returns depend on your individual tax situation. In addition, after-tax returns are not relevant if you hold your fund shares through a tax-deferred arrangement, such as a 401(k) plan, an individual retirement account (IRA) or other tax-advantaged account.
The bar chart below shows how the fund’s investment results have varied from year to year, and the following table shows how the fund’s average annual total returns for various periods compared to that
of one or more indices. The MSCI Emerging Markets Index (Net) serves as the fund’s regulatory index and provides a broad measure of market performance. The fund generally invests in securities that are included in the FTSE Emerging Index (Net). The fund does not seek to track the regulatory index. This information provides some indication of the risks of investing in the fund. All figures assume distributions were reinvested. Keep in mind that future performance (both before and after taxes) may differ from past performance. For current performance information, please see
www.schwabassetmanagement.com/prospectus.
www.schwabassetmanagement.com/prospectus.
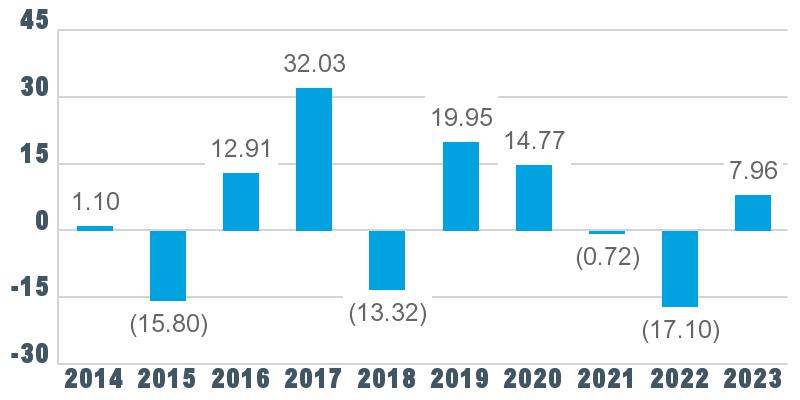
Best Quarter: 18.35% Q2 2020
Worst Quarter: (24.21%) Q1 2020
Year-to-date performance (before taxes) as of 9/30/24: 19.05%
| Average Annual Total Returns as of 12/31/23 | | ||||||||||||||||||
| | | | 1 Year | | | 5 Years | | | 10 Years | | |||||||||
| Before taxes | | | | | 7.96% | | | | | | 4.11% | | | | | | 3.01% | | |
| After taxes on distributions | | | | | 6.84% | | | | | | 3.31% | | | | | | 2.32% | | |
| After taxes on distributions and sale of shares | | | | | 5.24% | | | | | | 3.12% | | | | | | 2.28% | | |
| Comparative Indices (reflects no deduction for expenses or taxes) | | | | | | | | | | | | | | | | | | | |
| MSCI Emerging Markets Index (Net)(1) | | | | | 9.83% | | | | | | 3.69% | | | | | | 2.66% | | |
| FTSE Emerging Index (Net)(1) | | | | | 8.64% | | | | | | 4.40% | | | | | | 3.22% | | |
(1)
The net version of the index reflects reinvested dividends net of withholding taxes, but reflects no deductions for expenses or other taxes.
The after-tax figures reflect the highest individual federal income tax rates in effect during the period and do not reflect the impact of state and local taxes. Your actual after-tax returns depend on your individual tax situation. In addition, after-tax returns are not relevant if you hold your fund shares through a tax-deferred arrangement, such as a 401(k) plan, an individual retirement account (IRA) or other tax-advantaged account.
The bar chart below shows how the fund’s investment results have varied from year to year, and the following table shows how the fund’s average annual total returns for various periods compared to that of one or more indices. This information provides some indication of the risks of investing in the fund. All figures assume distributions were reinvested. Keep in mind that future performance (both before and after taxes) may differ from past performance. For current performance information, please see
www.schwabassetmanagement.com/prospectus.
www.schwabassetmanagement.com/prospectus.
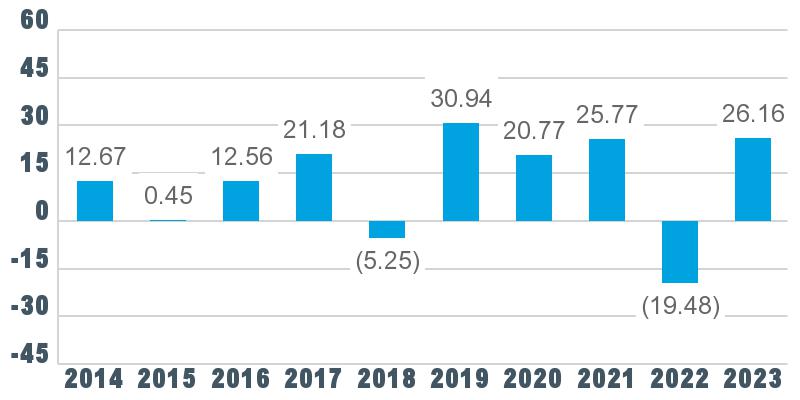
Best Quarter: 22.04% Q2 2020
Worst Quarter: (20.91%) Q1 2020
Year-to-date performance (before taxes) as of 9/30/24: 20.65%
| Average Annual Total Returns as of 12/31/23 | | ||||||||||||||||||
| | | | 1 Year | | | 5 Years | | | 10 Years | | |||||||||
| Before taxes | | | | | 26.16% | | | | | | 15.10% | | | | | | 11.44% | | |
| After taxes on distributions | | | | | 25.69% | | | | | | 14.62% | | | | | | 10.95% | | |
| After taxes on distributions and sale of shares | | | | | 15.74% | | | | | | 12.07% | | | | | | 9.35% | | |
| Comparative Index (reflects no deduction for expenses or taxes) | | | | | | | | | | | | | | | | | | | |
| Dow Jones U.S. Broad Stock Market Index | | | | | 26.15% | | | | | | 15.11% | | | | | | 11.45% | | |
The after-tax figures reflect the highest individual federal income tax rates in effect during the period and do not reflect the impact of state and local taxes. Your actual after-tax returns depend on your individual tax situation. In addition, after-tax returns are not relevant if you hold your fund shares through a tax-deferred arrangement, such as a 401(k) plan, an individual retirement account (IRA) or other tax-advantaged account.
The bar chart below shows how the fund’s investment results have varied from year to year, and the following table shows how the fund’s average annual total returns for various periods compared to that of one or more indices. The Russell 1000® Index serves as the fund’s regulatory index and provides a broad measure of market performance. The fund generally invests in securities that are included in the Schwab 1000 Index. The fund does not seek to track the regulatory index. This information provides some indication of the risks of investing in the fund. All figures assume distributions were reinvested. Keep in mind that future performance (both before and after taxes) may differ from past performance. For current performance information, please see
www.schwabassetmanagement.com/prospectus.
www.schwabassetmanagement.com/prospectus.
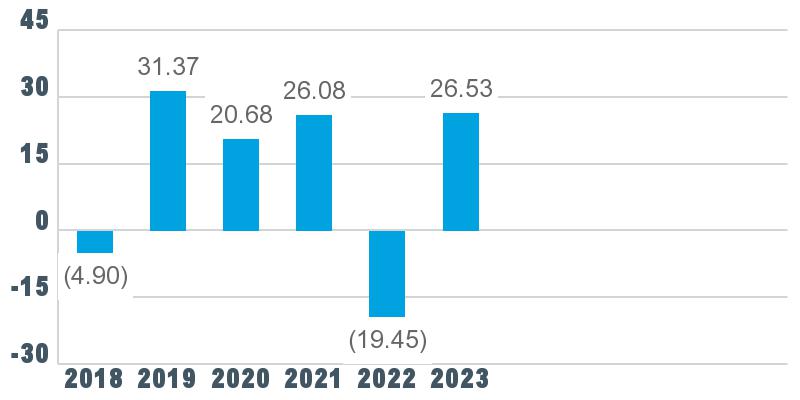
Best Quarter: 21.72% Q2 2020
Worst Quarter: (20.23%) Q1 2020
Year-to-date performance (before taxes) as of 9/30/24: 21.19%
| Average Annual Total Returns as of 12/31/23 | | ||||||||||||||||||
| | | | 1 Year | | | 5 Year | | | Since Inception (10/11/17) | | |||||||||
| Before taxes | | | | | 26.53% | | | | | | 15.30% | | | | | | 12.12% | | |
| After taxes on distributions | | | | | 26.06% | | | | | | 14.83% | | | | | | 11.68% | | |
| After taxes on distributions and sale of shares | | | | | 15.96% | | | | | | 12.24% | | | | | | 9.69% | | |
| Comparative Indices (reflects no deduction for expenses or taxes) | | | | | | | | | | | | | | | | | | | |
| Russell 1000® Index | | | | | 26.53% | | | | | | 15.52% | | | | | | 12.32% | | |
| Schwab 1000 Index | | | | | 26.54% | | | | | | 15.35% | | | | | | 12.18% | | |
The after-tax figures reflect the highest individual federal income tax rates in effect during the period and do not reflect the impact of state and local taxes. Your actual after-tax returns depend on your individual tax situation. In addition, after-tax returns are not relevant if you hold your fund shares through a tax-deferred arrangement, such as a 401(k) plan, an individual retirement account (IRA) or other tax-advantaged account.
The bar chart below shows how the fund’s investment results have varied from year to year, and the following table shows how the fund’s average annual total returns for various periods compared to that of one or more indices. The S&P 500® Index serves as the fund’s regulatory index and provides a broad measure of market
performance. The fund generally invests in securities that are included in the Dow Jones U.S. Large-Cap Total Stock Market Index. The fund does not seek to track the regulatory index. This information provides some indication of the risks of investing in the fund. All figures assume distributions were reinvested. Keep in mind that future performance (both before and after taxes) may differ from past performance. For current performance information, please see
www.schwabassetmanagement.com/prospectus.
www.schwabassetmanagement.com/prospectus.
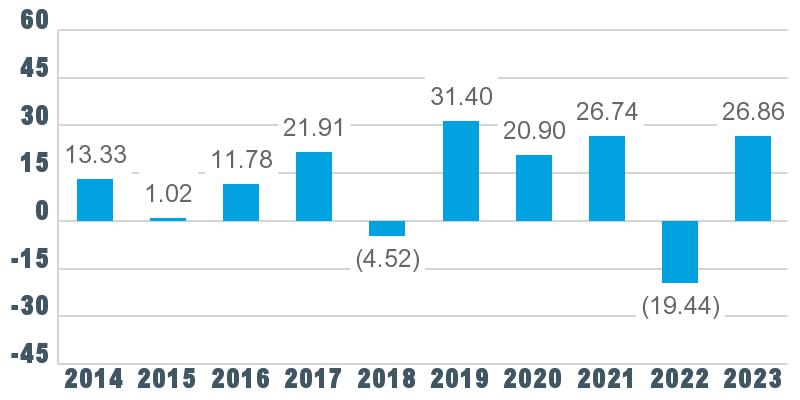
Best Quarter: 21.60% Q2 2020
Worst Quarter: (19.86%) Q1 2020
Year-to-date performance (before taxes) as of 9/30/24: 21.50%
| Average Annual Total Returns as of 12/31/23 | | ||||||||||||||||||
| | | | 1 Year | | | 5 Years | | | 10 Years | | |||||||||
| Before taxes | | | | | 26.86% | | | | | | 15.53% | | | | | | 11.85% | | |
| After taxes on distributions | | | | | 26.39% | | | | | | 15.05% | | | | | | 11.36% | | |
| After taxes on distributions and sale of shares | | | | | 16.16% | | | | | | 12.43% | | | | | | 9.72% | | |
| Comparative Indices (reflects no deduction for expenses or taxes) | | | | | | | | | | | | | | | | | | | |
| S&P 500® Index | | | | | 26.29% | | | | | | 15.69% | | | | | | 12.03% | | |
| Dow Jones U.S. Large-Cap Total Stock Market Index | | | | | 26.86% | | | | | | 15.55% | | | | | | 11.88% | | |
The after-tax figures reflect the highest individual federal income tax rates in effect during the period and do not reflect the impact of state and local taxes. Your actual after-tax returns depend on your individual tax situation. In addition, after-tax returns are not relevant if you hold your fund shares through a tax-deferred arrangement, such as a 401(k) plan, an individual retirement account (IRA) or other tax-advantaged account.
The bar chart below shows how the fund’s investment results have varied from year to year, and the following table shows how the fund’s average annual total returns for various periods compared to that of one or more indices. The S&P 500® Index serves as the fund’s regulatory index and provides a broad measure of market performance. The fund generally invests in securities that are included in the Dow Jones U.S. Large-Cap Growth Total Stock Market Index. The fund does not seek to track the regulatory index. This information provides some indication of the risks of investing in the fund. All figures assume distributions were reinvested. Keep in mind that future performance (both before and after taxes) may differ from past performance. For current performance information, please see
www.schwabassetmanagement.com/prospectus.
www.schwabassetmanagement.com/prospectus.
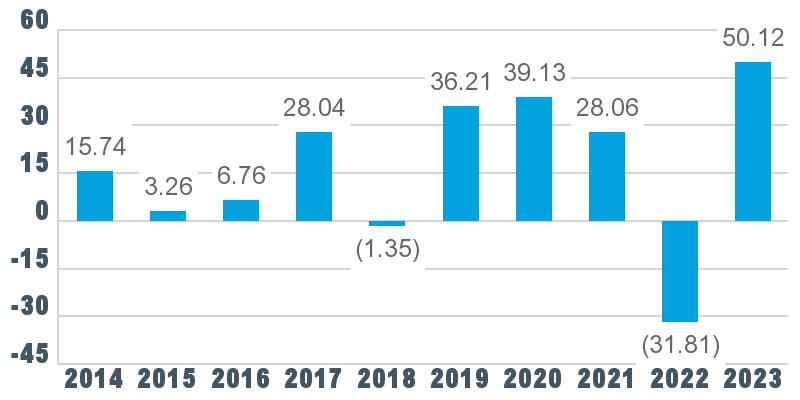
Best Quarter: 27.73% Q2 2020
Worst Quarter: (22.27%) Q2 2022
Year-to-date performance (before taxes) as of 9/30/24: 25.96%
| Average Annual Total Returns as of 12/31/23 | | ||||||||||||||||||
| | | | 1 Year | | | 5 Years | | | 10 Years | | |||||||||
| Before taxes | | | | | 50.12% | | | | | | 19.96% | | | | | | 14.88% | | |
| After taxes on distributions | | | | | 49.93% | | | | | | 19.78% | | | | | | 14.63% | | |
| After taxes on distributions and sale of shares | | | | | 29.77% | | | | | | 16.28% | | | | | | 12.52% | | |
| Comparative Indices (reflects no deduction for expenses or taxes) | | | | | | | | | | | | | | | | | | | |
| S&P 500® Index | | | | | 26.29% | | | | | | 15.69% | | | | | | 12.03% | | |
| Dow Jones U.S. Large-Cap Growth Total Stock Market Index | | | | | 50.13% | | | | | | 19.99% | | | | | | 14.93% | | |
The after-tax figures reflect the highest individual federal income tax rates in effect during the period and do not reflect the impact of state and local taxes. Your actual after-tax returns depend on your individual tax situation. In addition, after-tax returns are not relevant if you hold your fund shares through a tax-deferred arrangement, such as a 401(k) plan, an individual retirement account (IRA) or other tax-advantaged account.
The bar chart below shows how the fund’s investment results have varied from year to year, and the following table shows how the fund’s average annual total returns for various periods compared to that of one or more indices. The S&P 500® Index serves as the fund’s regulatory index and provides a broad measure of market performance. The fund generally invests in securities that are included in the Dow Jones U.S. Large-Cap Value Total Stock Market Index. The fund does not seek to track the regulatory index. This information provides some indication of the risks of investing in the fund. All figures assume distributions were reinvested. Keep in mind that future performance (both before and after taxes) may differ from past performance. For current performance information, please see
www.schwabassetmanagement.com/prospectus.
www.schwabassetmanagement.com/prospectus.
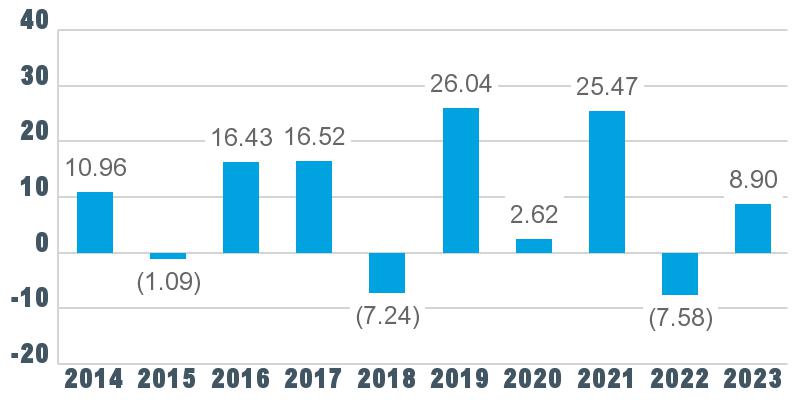
Best Quarter: 14.80% Q4 2020
Worst Quarter: (25.77%) Q1 2020
Year-to-date performance (before taxes) as of 9/30/24: 16.59%
| Average Annual Total Returns as of 12/31/23 | | ||||||||||||||||||
| | | | 1 Year | | | 5 Years | | | 10 Years | | |||||||||
| Before taxes | | | | | 8.90% | | | | | | 10.31% | | | | | | 8.48% | | |
| After taxes on distributions | | | | | 8.22% | | | | | | 9.56% | | | | | | 7.77% | | |
| After taxes on distributions and sale of shares | | | | | 5.66% | | | | | | 8.05% | | | | | | 6.74% | | |
| Comparative Indices (reflects no deduction for expenses or taxes) | | | | | | | | | | | | | | | | | | | |
| S&P 500® Index | | | | | 26.29% | | | | | | 15.69% | | | | | | 12.03% | | |
| Dow Jones U.S. Large-Cap Value Total Stock Market Index | | | | | 8.92% | | | | | | 10.35% | | | | | | 8.53% | | |
The after-tax figures reflect the highest individual federal income tax rates in effect during the period and do not reflect the impact of state and local taxes. Your actual after-tax returns depend on your individual tax situation. In addition, after-tax returns are not relevant if you hold your fund shares through a tax-deferred arrangement, such as a 401(k) plan, an individual retirement account (IRA) or other tax-advantaged account.
The bar chart below shows how the fund’s investment results have varied from year to year, and the following table shows how the fund’s average annual total returns for various periods compared to that of one or more indices. The S&P 500® Index serves as the fund’s regulatory index and provides a broad measure of market performance. The fund generally invests in securities that are included in the Dow Jones U.S. Mid-Cap Total Stock Market Index. The fund does not seek to track the regulatory index. This information provides some indication of the risks of investing in the fund. All figures assume distributions were reinvested. Keep in mind that future performance (both before and after taxes) may differ from past performance. For current performance information, please see
www.schwabassetmanagement.com/prospectus.
www.schwabassetmanagement.com/prospectus.
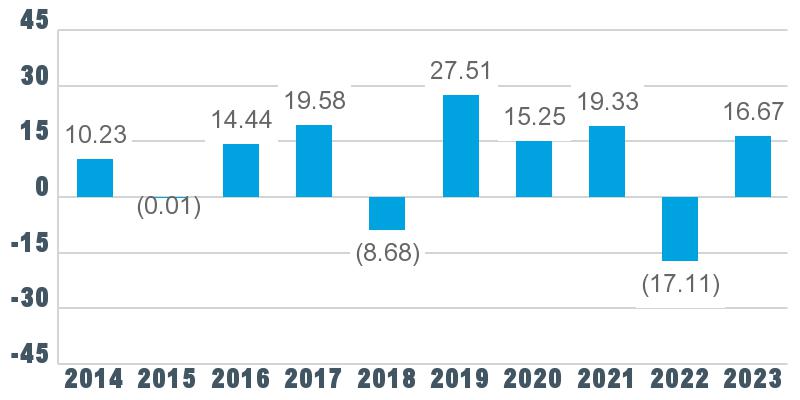
Best Quarter: 25.17% Q2 2020
Worst Quarter: (29.61%) Q1 2020
Year-to-date performance (before taxes) as of 9/30/24: 11.61%
| Average Annual Total Returns as of 12/31/23 | | ||||||||||||||||||
| | | | 1 Year | | | 5 Years | | | 10 Years | | |||||||||
| Before taxes | | | | | 16.67% | | | | | | 11.14% | | | | | | 8.85% | | |
| After taxes on distributions | | | | | 16.15% | | | | | | 10.67% | | | | | | 8.39% | | |
| After taxes on distributions and sale of shares | | | | | 10.07% | | | | | | 8.75% | | | | | | 7.09% | | |
| Comparative Indices (reflects no deduction for expenses or taxes) | | | | | | | | | | | | | | | | | | | |
| S&P 500® Index | | | | | 26.29% | | | | | | 15.69% | | | | | | 12.03% | | |
| Dow Jones U.S. Mid-Cap Total Stock Market Index | | | | | 16.65% | | | | | | 11.15% | | | | | | 8.87% | | |
The after-tax figures reflect the highest individual federal income tax rates in effect during the period and do not reflect the impact of state and local taxes. Your actual after-tax returns depend on your individual tax situation. In addition, after-tax returns are not relevant if you hold your fund shares through a tax-deferred arrangement, such as a 401(k) plan, an individual retirement account (IRA) or other tax-advantaged account.
The bar chart below shows how the fund’s investment results have varied from year to year, and the following table shows how the fund’s average annual total returns for various periods compared to that of one or more indices. The S&P 500® Index serves as the fund’s regulatory index and provides a broad measure of market performance. The fund generally invests in securities that are included in the Dow Jones U.S. Small-Cap Total Stock Market Index. The fund does not seek to track the regulatory index. This information provides some indication of the risks of investing in the fund. All figures assume distributions were reinvested. Keep in mind that future performance (both before and after taxes) may differ from past performance. For current performance information, please see
www.schwabassetmanagement.com/prospectus.
www.schwabassetmanagement.com/prospectus.
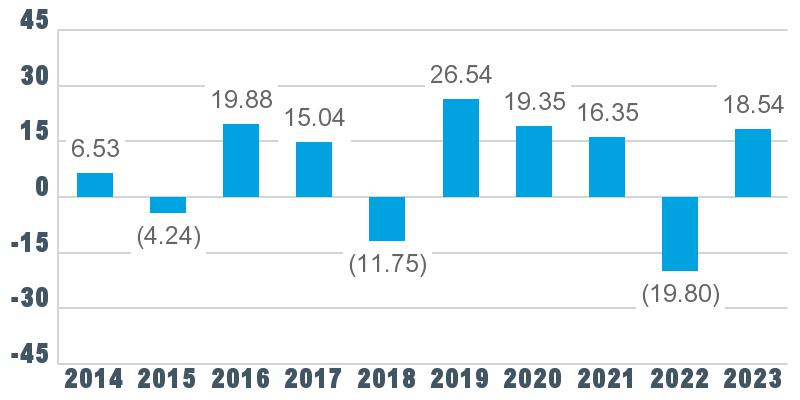
Best Quarter: 30.84% Q4 2020
Worst Quarter: (31.61%) Q1 2020
Year-to-date performance (before taxes) as of 9/30/24: 10.03%
| Average Annual Total Returns as of 12/31/23 | | ||||||||||||||||||
| | | | 1 Year | | | 5 Years | | | 10 Years | | |||||||||
| Before taxes | | | | | 18.54% | | | | | | 10.81% | | | | | | 7.57% | | |
| After taxes on distributions | | | | | 18.02% | | | | | | 10.38% | | | | | | 7.13% | | |
| After taxes on distributions and sale of shares | | | | | 11.16% | | | | | | 8.49% | | | | | | 5.99% | | |
| Comparative Indices (reflects no deduction for expenses or taxes) | | | | | | | | | | | | | | | | | | | |
| S&P 500® Index | | | | | 26.29% | | | | | | 15.69% | | | | | | 12.03% | | |
| Dow Jones U.S. Small-Cap Total Stock Market Index | | | | | 18.43% | | | | | | 10.75% | | | | | | 7.52% | | |
The after-tax figures reflect the highest individual federal income tax rates in effect during the period and do not reflect the impact of state and local taxes. Your actual after-tax returns depend on your individual tax situation. In addition, after-tax returns are not relevant if you hold your fund shares through a tax-deferred arrangement, such as a 401(k) plan, an individual retirement account (IRA) or other tax-advantaged account.
The bar chart below shows how the fund’s investment results have varied from year to year, and the following table shows how the fund’s average annual total returns for various periods compared to that of one or more indices. The S&P 500® Index serves as the fund’s regulatory index and provides a broad measure of market performance. The fund generally invests in securities that are included in the Dow Jones U.S. Dividend 100 Index. The fund does not seek to track the regulatory index. This information provides some indication of the risks of investing in the fund. All figures assume distributions were reinvested. Keep in mind that future performance (both before and after taxes) may differ from past performance. For current performance information, please see
www.schwabassetmanagement.com/prospectus.
www.schwabassetmanagement.com/prospectus.
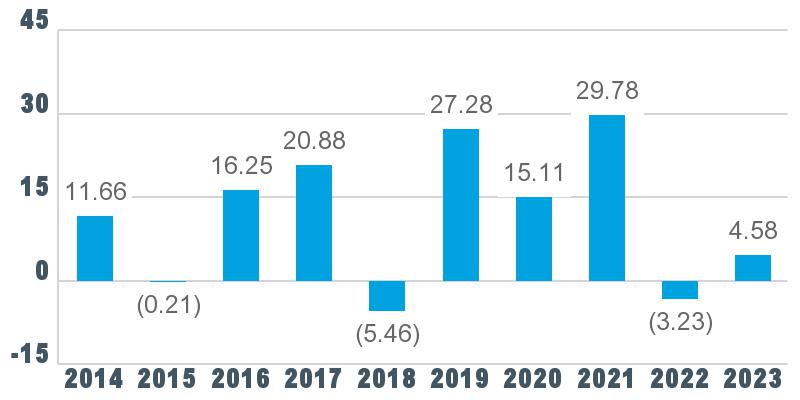
Best Quarter: 17.11% Q4 2020
Worst Quarter: (21.55%) Q1 2020
Year-to-date performance (before taxes) as of 9/30/24: 14.13%
| Average Annual Total Returns as of 12/31/23 | | ||||||||||||||||||
| | | | 1 Year | | | 5 Years | | | 10 Years | | |||||||||
| Before taxes | | | | | 4.58% | | | | | | 13.99% | | | | | | 11.03% | | |
| After taxes on distributions | | | | | 3.67% | | | | | | 13.06% | | | | | | 10.20% | | |
| After taxes on distributions and sale of shares | | | | | 3.28% | | | | | | 11.08% | | | | | | 8.92% | | |
| Comparative Indices (reflects no deduction for expenses or taxes) | | | | | | | | | | | | | | | | | | | |
| S&P 500® Index | | | | | 26.29% | | | | | | 15.69% | | | | | | 12.03% | | |
| Dow Jones U.S. Dividend 100 Index | | | | | 4.64% | | | | | | 14.08% | | | | | | 11.14% | | |
The after-tax figures reflect the highest individual federal income tax rates in effect during the period and do not reflect the impact of state and local taxes. Your actual after-tax returns depend on your individual tax situation. In addition, after-tax returns are not
relevant if you hold your fund shares through a tax-deferred arrangement, such as a 401(k) plan, an individual retirement account (IRA) or other tax-advantaged account.