Performance Management
Aug. 31, 2024
The bar chart below shows how the fund’s investment results have varied from year to year, and the following table shows how the fund’s average annual total returns for various periods compared to that of one or more indices. The Bloomberg US Aggregate Bond Index serves as the fund’s regulatory index and provides a broad measure of market performance. The fund generally invests in securities that are included in the Bloomberg US Government/Credit 1-5 Year Index. The fund does not seek to track the regulatory index. This information provides some indication of the risks of investing in the fund. All figures assume distributions were
reinvested. Keep in mind that future performance (both before and after taxes) may differ from past performance. For current performance information, please see
www.schwabassetmanagement.com/prospectus.
www.schwabassetmanagement.com/prospectus.
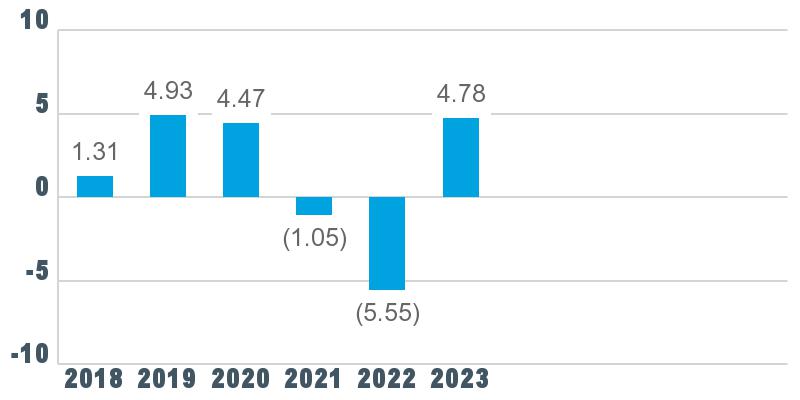
Best Quarter: 3.42% Q4 2023
Worst Quarter: (3.42%) Q1 2022
Year-to-date performance (before taxes) as of 9/30/24: 4.49%
| Average Annual Total Returns as of 12/31/23 | | ||||||||||||||||||
| | | | 1 Year | | | 5 Years | | | Since Inception (2/23/17) | | |||||||||
| Before taxes | | | | | 4.78% | | | | | | 1.43% | | | | | | 1.34% | | |
| After taxes on distributions | | | | | 3.43% | | | | | | 0.62% | | | | | | 0.53% | | |
| After taxes on distributions and sale of shares | | | | | 2.81% | | | | | | 0.76% | | | | | | 0.68% | | |
| Comparative Indices (reflect no deduction for fees, expenses, or taxes) | | | | | | | | | | | | | | | | | | | |
| Bloomberg US Aggregate Bond Index | | | | | 5.53% | | | | | | 1.10% | | | | | | 1.25% | | |
| Bloomberg US Government/Credit 1-5 Year Index | | | | | 4.89% | | | | | | 1.54% | | | | | | 1.45% | | |
The after-tax figures reflect the highest individual federal income tax rates in effect during the period and do not reflect the impact of state and local taxes. Your actual after-tax returns depend on your individual tax situation. In addition, after-tax returns are not relevant if you hold your fund shares through a tax-deferred arrangement, such as a 401(k) plan, an individual retirement account (IRA) or other tax-advantaged account. In some cases, the return after taxes on distributions and sale of shares may exceed the fund’s other returns due to an assumed benefit from any losses on a sale of shares at the end of the measurement period.
The bar chart below shows how the fund’s investment results have varied from year to year, and the following table shows how the fund’s average annual total returns for various periods compared to that of one or more indices. The Bloomberg US Aggregate Bond Index serves as the fund’s regulatory index and provides a broad measure of market performance. The fund generally invests in securities that are included in the Bloomberg US Treasury Inflation-Linked Bond Index (Series-L). The fund does not seek to track the regulatory index. This information provides some indication of the risks of investing in the fund. All figures assume distributions were reinvested. Keep in mind that future performance (both before and after taxes) may differ from past performance. For current performance information, please see
www.schwabassetmanagement.com/prospectus.
www.schwabassetmanagement.com/prospectus.
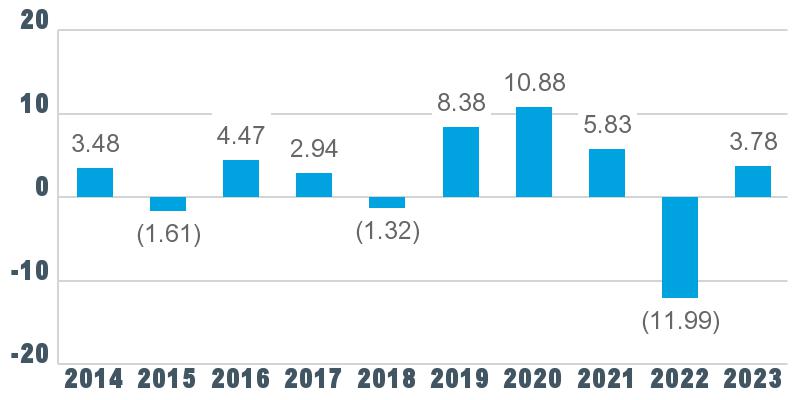
Best Quarter: 4.45% Q4 2023
Worst Quarter: (6.05%) Q2 2022
Year-to-date performance (before taxes) as of 9/30/24: 5.03%
| Average Annual Total Returns as of 12/31/23 | | ||||||||||||||||||
| | | | 1 Year | | | 5 Years | | | 10 Years | | |||||||||
| Before taxes | | | | | 3.78% | | | | | | 3.04% | | | | | | 2.30% | | |
| After taxes on distributions | | | | | 2.47% | | | | | | 1.53% | | | | | | 1.12% | | |
| After taxes on distributions and sale of shares | | | | | 2.22% | | | | | | 1.73% | | | | | | 1.27% | | |
| Comparative Indices (reflect no deduction for fees, expenses, or taxes) | | | | | | | | | | | | | | | | | | | |
| Bloomberg US Aggregate Bond Index | | | | | 5.53% | | | | | | 1.10% | | | | | | 1.81% | | |
| Bloomberg US Treasury Inflation-Linked Bond Index (Series-L) | | | | | 3.90% | | | | | | 3.15% | | | | | | 2.42% | | |
The after-tax figures reflect the highest individual federal income tax rates in effect during the period and do not reflect the impact of state and local taxes. Your actual after-tax returns depend on your individual tax situation. In addition, after-tax returns are not relevant if you hold your fund shares through a tax-deferred arrangement, such as a 401(k) plan, an individual retirement account (IRA) or other tax-advantaged account. In some cases, the return
after taxes on distributions and sale of shares may exceed the fund’s other returns due to an assumed benefit from any losses on a sale of shares at the end of the measurement period.
The bar chart below shows how the fund’s investment results have varied from year to year, and the following table shows how the fund’s average annual total returns for various periods compared to that of an index. This information provides some indication of the risks of investing in the fund. All figures assume distributions were reinvested. Keep in mind that future performance (both before and after taxes) may differ from past performance. For current performance information, please see
www.schwabassetmanagement.com/prospectus.
www.schwabassetmanagement.com/prospectus.
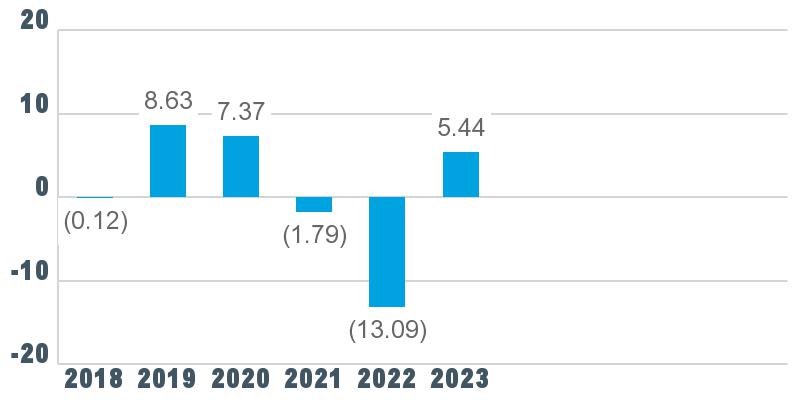
Best Quarter: 6.59% Q4 2023
Worst Quarter: (5.85%) Q1 2022
Year-to-date performance (before taxes) as of 9/30/24: 4.60%
| Average Annual Total Returns as of 12/31/23 | | ||||||||||||||||||
| | | | 1 Year | | | 5 Years | | | Since Inception (2/23/17) | | |||||||||
| Before taxes | | | | | 5.44% | | | | | | 0.97% | | | | | | 1.10% | | |
| After taxes on distributions | | | | | 4.04% | | | | | | (0.10%) | | | | | | 0.01% | | |
| After taxes on distributions and sale of shares | | | | | 3.19% | | | | | | 0.31% | | | | | | 0.39% | | |
| Comparative Index (reflects no deduction for fees, expenses, or taxes) | | | | | | | | | | | | | | | | | | | |
| Bloomberg US Aggregate Bond Index | | | | | 5.53% | | | | | | 1.10% | | | | | | 1.25% | | |
The after-tax figures reflect the highest individual federal income tax rates in effect during the period and do not reflect the impact of state and local taxes. Your actual after-tax returns depend on your individual tax situation. In addition, after-tax returns are not relevant if you hold your fund shares through a tax-deferred arrangement, such as a 401(k) plan, an individual retirement account (IRA) or other tax-advantaged account. In some cases, the return after taxes on distributions and sale of shares may exceed the fund’s other returns due to an assumed benefit from any losses on a sale of shares at the end of the measurement period.
The bar chart below shows how the fund’s investment results have varied from year to year, and the following table shows how the fund’s average annual total returns for various periods compared to that of one or more indices. The Bloomberg Municipal Bond Index serves as the fund’s regulatory index and provides a broad measure of market performance. The Bloomberg Municipal 3-15 Year Blend Index is the fund’s additional index and is more representative of the fund’s investment universe than the regulatory index. This information provides some indication of the risks of investing in the fund. All figures assume distributions were reinvested. Keep in mind that future performance (both before and after taxes) may differ from past performance. For current performance information, please see
www.schwabassetmanagement.com/prospectus.
www.schwabassetmanagement.com/prospectus.
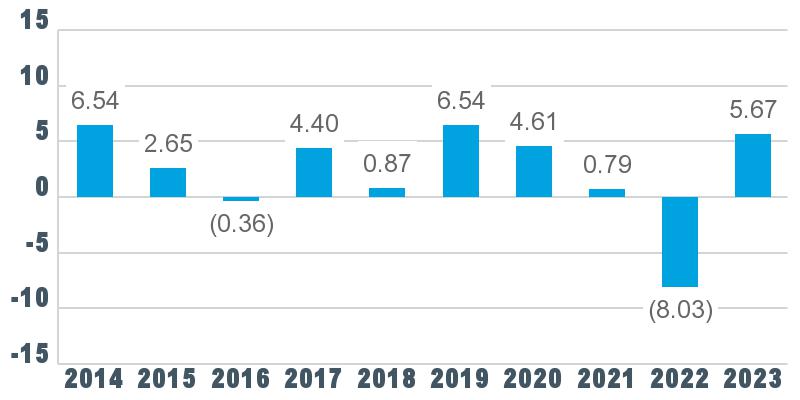
Best Quarter: 6.21% Q4 2023
Worst Quarter: (5.88%) Q1 2022
Year-to-date performance (before taxes) as of 9/30/24: 2.85%
| Average Annual Total Returns as of 12/31/23 | | ||||||||||||||||||
| | | | 1 Year | | | 5 Years | | | 10 Years | | |||||||||
| Before taxes | | | | | 5.67% | | | | | | 1.77% | | | | | | 2.28% | | |
| After taxes on distributions | | | | | 5.67% | | | | | | 1.71% | | | | | | 2.17% | | |
| After taxes on distributions and sale of shares | | | | | 4.66% | | | | | | 1.89% | | | | | | 2.27% | | |
| Comparative Indices (reflect no deduction for fees, expenses, or taxes) | | | | | | | | | | | | | | | | | | | |
| Bloomberg Municipal Bond Index | | | | | 6.40% | | | | | | 2.25% | | | | | | 3.03% | | |
| Bloomberg Municipal 3-15 Year Blend Index | | | | | 5.45% | | | | | | 2.28% | | | | | | 2.77% | | |
The after-tax figures reflect the highest individual federal income tax rates in effect during the period and do not reflect the impact of state and local taxes. Your actual after-tax returns depend on your individual tax situation. In addition, after-tax returns are not relevant if you hold your fund shares through a tax-deferred arrangement, such as a 401(k) plan, an individual retirement account (IRA) or other tax-advantaged account. In some cases, the return after taxes on distributions and sale of shares may exceed the fund’s other returns due to an assumed benefit from any losses on a sale of shares at the end of the measurement period.
The bar chart below shows how the fund’s investment results have varied from year to year, and the following table shows how the fund’s average annual total returns for various periods compared to that of one or more indices. The Bloomberg Municipal Bond Index serves as the fund’s regulatory index and provides a broad measure of market performance. The Bloomberg California Municipal 3-15 Year Blend Index and the S&P California AMT-Free Municipal Bond Index are the fund’s additional indexes and are more representative of the fund’s investment universe than the regulatory index. This information provides some indication of the risks of investing in the fund. All figures assume distributions were reinvested. Keep in mind that future performance (both before and after taxes) may differ from past performance. For current performance information, please see
www.schwabassetmanagement.com/prospectus.
www.schwabassetmanagement.com/prospectus.
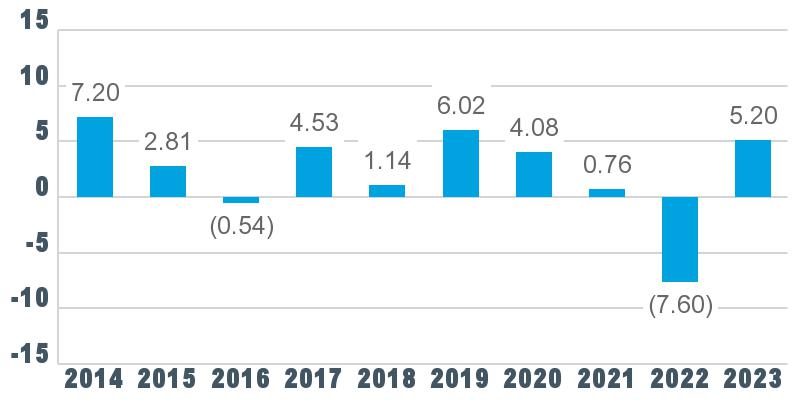
Best Quarter: 5.55% Q4 2023
Worst Quarter: (5.55%) Q1 2022
Year-to-date performance (before taxes) as of 9/30/24: 2.71%
| Average Annual Total Returns as of 12/31/23 | | ||||||||||||||||||
| | | | 1 Year | | | 5 Years | | | 10 Years | | |||||||||
| Before taxes | | | | | 5.20% | | | | | | 1.57% | | | | | | 2.28% | | |
| After taxes on distributions | | | | | 5.20% | | | | | | 1.48% | | | | | | 2.14% | | |
| After taxes on distributions and sale of shares | | | | | 4.21% | | | | | | 1.69% | | | | | | 2.25% | | |
| Comparative Indices (reflect no deduction for fees, expenses, or taxes) | | | | | | | | | | | | | | | | | | | |
| Bloomberg Municipal Bond Index | | | | | 6.40% | | | | 2.25% | | | 3.03% | | ||||||
| Bloomberg California Municipal 3-15 Year Blend Index(1) | | | | | 5.34% | | | | | | | ||||||||
| S&P California AMT-Free Municipal Bond Index | | | | | 5.64% | | | | | | 2.10% | | | | | | 3.00% | | |
(1)
The Bloomberg California Municipal 3-15 Year Blend Index was established effective January 1, 2020.
(2)
Information not available to the fund.
The after-tax figures reflect the highest individual federal income tax rates in effect during the period and do not reflect the impact of state and local taxes. Your actual after-tax returns depend on your individual tax situation. In addition, after-tax returns are not relevant if you hold your fund shares through a tax-deferred arrangement, such as a 401(k) plan, an individual retirement account (IRA) or other tax-advantaged account. In some cases, the return after taxes on distributions and sale of shares may exceed the fund’s other returns due to an assumed benefit from any losses on a sale of shares at the end of the measurement period.
The bar chart below shows how the fund’s investment results have varied from year to year, and the following table shows how the fund’s average annual total returns for various periods compared to that of one or more indices. This information provides some indication of the risks of investing in the fund. All figures assume distributions were reinvested. Keep in mind that future performance (both before and after taxes) may differ from past performance. For current performance information, please see
www.schwabassetmanagement.com/prospectus. The fund is the successor to the investment performance of the Wasmer Schroeder High Yield Municipal Fund (Predecessor Fund) as a result of the reorganization of the Predecessor Fund into the fund on August 10, 2020. Accordingly, the performance information shown below prior to August 10, 2020 is that of the Predecessor Fund. The fund has an investment objective, strategies and policies that are substantially similar to those of the Predecessor Fund.
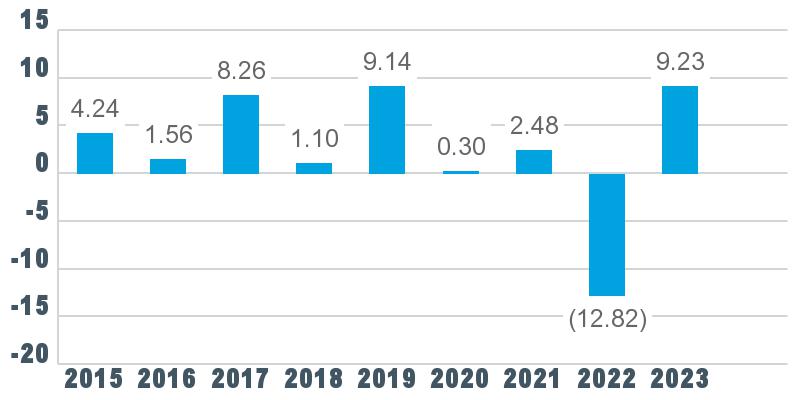
Best Quarter: 8.28% Q4 2023
Worst Quarter: (7.28%) Q1 2020
Year-to-date performance (before taxes) as of 9/30/2024: 3.36%
| Average Annual Total Returns as of 12/31/23 | | ||||||||||||||||||
| | | | 1 Year | | | 5 Years | | | Since Inception (3/31/14)(1) | | |||||||||
| Before taxes | | | | | 9.23% | | | | | | 1.33% | | | | | | 3.43% | | |
| After taxes on distributions | | | | | 9.23% | | | | | | 1.25% | | | | | | 3.24% | | |
| After taxes on distributions and sale of shares | | | | | 8.23% | | | | | | 1.90% | | | | | | 3.50% | | |
| Comparative Indices (reflect no deduction for fees, expenses, or taxes) | | | | | | | | | | | | | | | | | | | |
| Bloomberg Municipal Bond Index | | | | | 6.40% | | | | | | 2.25% | | | | | | 2.77% | | |
(1)
Inception of the Predecessor Fund.
The after-tax figures reflect the highest individual federal income tax rates in effect during the period and do not reflect the impact of state and local taxes. Your actual after-tax returns depend on your individual tax situation. In addition, after-tax returns are not relevant if you hold your fund shares through a tax-deferred arrangement, such as a 401(k) plan, an individual retirement account (IRA) or other tax-advantaged account. In some cases, the return after taxes on distributions and sale of shares may exceed the fund’s other returns due to an assumed benefit from any losses on a sale of shares at the end of the measurement period.