Putnam Retirement Advantage 2065 Fund seeks capital appreciation and current income consistent with a decreasing emphasis on capital appreciation and an increasing emphasis on current income as it approaches its target date.
The following tables describe the fees and expenses you may pay if you buy, hold and sell shares of the fund. You may pay other fees, such as brokerage commissions and other fees to financial intermediaries, which are not reflected in the tables and examples below. You may qualify for sales charge discounts if you and your family invest, or agree to invest in the future, at least $50,000 in Putnam funds. More information about these and other discounts is available from your financial professional and in How do I buy fund shares? beginning on page 102 of the fund’s prospectus, in Appendix A to the fund’s prospectus, and in How to buy shares beginning on page II-1 of the fund’s statement of additional information (“SAI”).
Shareholder Fees - Putnam Retirement Advantage 2065 Fund |
Class A 2065 |
Class C 2065 |
Class R 2065 |
Class R3 2065 |
Class R4 2065 |
Class R5 2065 |
Class R6 2065 |
Class Y 2065 |
||
|---|---|---|---|---|---|---|---|---|---|---|
| Maximum Sales Charge Imposed on Purchases (as a percentage of Offering Price) | 5.75% | none | none | none | none | none | none | none | ||
| Maximum Deferred Sales Charge (as a percentage) | 1.00% | [1] | 1.00% | [2] | none | none | none | none | none | none |
| [1] | Applies only to certain redemptions of shares bought with no initial sales charge. |
| [2] | This charge is eliminated after one year. |
Annual Fund Operating Expenses - Putnam Retirement Advantage 2065 Fund |
Class A 2065 |
Class C 2065 |
Class R 2065 |
Class R3 2065 |
Class R4 2065 |
Class R5 2065 |
Class R6 2065 |
Class Y 2065 |
|
|---|---|---|---|---|---|---|---|---|---|
| Management Fees (as a percentage of Assets) | 0.45% | 0.45% | 0.45% | 0.45% | 0.45% | 0.45% | 0.45% | 0.45% | |
| Distribution and Service (12b-1) Fees | 0.25% | 1.00% | 0.50% | 0.25% | none | none | none | none | |
| Other Expenses (as a percentage of Assets): | 10.96% | 10.96% | 11.11% | 11.11% | 11.11% | 10.96% | 10.86% | 10.96% | |
| Acquired Fund Fees and Expenses | 0.61% | 0.61% | 0.61% | 0.61% | 0.61% | 0.61% | 0.61% | 0.61% | |
| Expenses (as a percentage of Assets) | 12.27% | 13.02% | 12.67% | 12.42% | 12.17% | 12.02% | 11.92% | 12.02% | |
| Fee Waiver or Reimbursement | [1] | (11.47%) | (11.47%) | (11.47%) | (11.47%) | (11.47%) | (11.47%) | (11.47%) | (11.47%) |
| Net Expenses (as a percentage of Assets) | 0.80% | 1.55% | 1.20% | 0.95% | 0.70% | 0.55% | 0.45% | 0.55% | |
| [1] | Reflects the Investment Manager’s (as defined below) contractual obligation to limit certain fund expenses through at least December 30, 2027. This obligation may be modified or discontinued only with approval of the Board of Trustees. |
The following hypothetical example is intended to help you compare the cost of investing in the fund with the cost of investing in other funds. It assumes that you invest $10,000 in the fund for the time periods indicated and then, except as indicated, redeem all your shares at the end of those periods. It assumes a 5% return on your investment each year and that the fund’s operating expenses remain the same. The example takes into account the expense reimbursement described above for the 1- and 3-year periods. Your actual costs may be higher or lower.
Expense Example - Putnam Retirement Advantage 2065 Fund - USD ($) |
Expense Example, with Redemption, 1 Year |
Expense Example, with Redemption, 3 Years |
Expense Example, with Redemption, 5 Years |
Expense Example, with Redemption, 10 Years |
Expense Example, No Redemption, 1 Year |
Expense Example, No Redemption, 3 Years |
Expense Example, No Redemption, 5 Years |
Expense Example, No Redemption, 10 Years |
|---|---|---|---|---|---|---|---|---|
| Class A 2065 | 652 | 816 | 3,246 | 7,934 | ||||
| Class C 2065 | 258 | 490 | 3,146 | 8,045 | 158 | 490 | 3,146 | 8,045 |
| Class R 2065 | 122 | 381 | 3,002 | 7,985 | ||||
| Class R3 2065 | 97 | 303 | 2,897 | 7,875 | ||||
| Class R4 2065 | 72 | 224 | 2,791 | 7,762 | ||||
| Class R5 2065 | 56 | 176 | 2,727 | 7,692 | ||||
| Class R6 2065 | 46 | 144 | 2,684 | 7,645 | ||||
| Class Y 2065 | 56 | 176 | 2,727 | 7,692 |
The fund pays transaction-related costs, such as commissions, when it buys and sells securities (or “turns over” its portfolio). A higher turnover rate may indicate higher transaction costs and may result in higher taxes when the fund’s shares are held in a taxable account. These costs, which are not reflected in annual fund operating
expenses or the above example, affect fund performance. The fund’s turnover rate in the most recent fiscal year was 33%.
Investments
The fund’s asset allocation strategy may be attractive to investors who plan to retire or otherwise intend to begin making periodic withdrawals of their investments in or about 2065 (the target date). The fund is designed to provide diversification among different asset classes by investing its assets in other Putnam mutual funds, referred to as underlying funds.
The fund’s target allocations among asset classes and underlying funds will increasingly emphasize capital preservation and income over time and will change gradually based on the number of remaining years until the fund’s target date, as shown in the predetermined “glide path” in the chart under “What are the funds’ and each underlying fund’s main investment strategies and related risks?”. Franklin Advisers, Inc. (“Franklin Advisers” or the “Investment Manager”) adjusts these allocations at the end of each calendar quarter based on the glide path.
The following table presents your fund’s approximate allocations to each asset class and underlying fund as of December 31, 2024 and its projected approximate allocations to these asset classes and underlying funds as of December 31, 2025. By comparing the percentage allocations of your fund in the table, you can see how its allocations are expected to change during the one-year period beginning on December 31, 2024.
The table also shows the approximate allocations of other Putnam Retirement Advantage Funds, which are designed for investors with different target retirement dates. Over a five-year period, each fund’s allocations will gradually change to resemble the allocations of the fund with the next earliest target date. The table illustrates how a fund’s allocations are expected to change over time to increasingly emphasize capital preservation and income.
| Underlying Fund* | Year | 2065 (your fund) | 2060 | 2055 | 2050 | 2045 | 2040 | 2035 | 2030 | 2025 | Maturity Fund |
| Putnam Dynamic Asset Allocation Equity Fund | 2024 | 78.0% | 62.8% | 39.0% | 15.2% | 0.0% | 0.0% | 0.0% | 0.0% | 0.0% | 0.0% |
| 2025 | 78.0% | 59.9% | 35.2% | 12.2% | 0.0% | 0.0% | 0.0% | 0.0% | 0.0% | 0.0% | |
| Putnam Dynamic Asset Allocation Growth Fund | 2024 | 21.5% | 36.7% | 60.5% | 83.8% | 92.7% | 51.8% | 0.0% | 0.0% | 0.0% | 0.0% |
| 2025 | 21.5% | 39.6% | 64.3% | 86.6% | 89.5% | 44.8% | 0.0% | 0.0% | 0.0% | 0.0% | |
| Putnam Dynamic Asset Allocation Balanced Fund | 2024 | 0.0% | 0.0% | 0.0% | 0.0% | 4.8% | 44.8% | 92.9% | 30.1% | 2.5% | 0.0% |
| 2025 | 0.0% | 0.0% | 0.0% | 0.0% | 7.8% | 51.7% | 87.1% | 19.7% | 0.6% | 0.0% | |
| Putnam Dynamic Asset Allocation Conservative Fund | 2024 | 0.0% | 0.0% | 0.0% | 0.0% | 0.0% | 0.0% | 1.1% | 47.9% | 9.8% | 0.0% |
| 2025 | 0.0% | 0.0% | 0.0% | 0.0% | 0.0% | 0.0% | 4.0% | 56.0% | 2.5% | 0.0% | |
| Putnam Short Term Investment Fund | 2024 | 0.5% | 0.5% | 0.5% | 1.0% | 2.5% | 3.4% | 4.5% | 5.8% | 6.0% | 6.0% |
| 2025 | 0.5% | 0.5% | 0.5% | 1.2% | 2.7% | 3.5% | 4.7% | 6.0% | 6.0% | 6.0% | |
| Putnam Multi-Asset Income Fund | 2024 | 0.0% | 0.0% | 0.0% | 0.0% | 0.0% | 0.0% | 1.5% | 16.2% | 81.7% | 94.0% |
| 2025 | 0.0% | 0.0% | 0.0% | 0.0% | 0.0% | 0.0% | 4.2% | 18.3% | 90.9% | 94.0% | |
| Equity** | 2024 | 95.2% | 92.2% | 87.4% | 82.2% | 77.0% | 68.3% | 56.5% | 36.8% | 26.5% | 25.4% |
| 2025 | 95.2% | 91.6% | 86.6% | 81.5% | 76.3% | 66.9% | 54.6% | 33.6% | 25.7% | 25.4% | |
| Fixed Income** | 2024 | 4.8% | 7.8% | 12.6% | 17.8% | 23.0% | 31.7% | 43.5% | 63.2% | 73.5% | 74.6% |
| 2025 | 4.8% | 8.4% | 13.4% | 18.5% | 23.7% | 33.1% | 45.4% | 66.4% | 74.3% | 74.6% |
| * | Due to rounding, allocations shown in the table above may not total 100%. In addition, because of rounding in the calculation of allocations among underlying funds and market fluctuations, actual allocations might be more or less than these percentages. |
| ** | Equity and fixed income allocations are hypothetical estimates based on each Putnam Dynamic Asset Allocation Fund’s and Putnam Multi-Asset Income Fund’s current strategic allocation to equity and fixed income investments as set forth under “What are the funds’ and each underlying fund’s main investment strategies and related risks?”, and an assumption that Putnam Short Term Investment Fund is equivalent to a fixed income investment. The managers of the underlying funds may adjust those funds’ allocations among asset classes from time to time consistent with their investment goals, and, consequently, actual allocations will vary. |
The fund’s target allocations may differ from the allocations shown in the table. We may change the glide path, the fund’s target allocations, and the underlying funds in which it invests at any time, although we expect these changes to be infrequent and generally in response to longer-term structural changes (i.e., in the average retirement age or life expectancy) that lead the fund’s portfolio managers to determine that a change is advisable. We assume investors will begin gradual withdrawals from the
fund at or around the target date. Near the end of the target date year, the fund’s target allocations will correspond to those of Putnam Retirement Advantage Maturity Fund (Maturity Fund), a fund that seeks as high a rate of current income as the Investment Manager believes is consistent with preservation of capital, and the fund will be merged into Maturity Fund. More information about Maturity Fund is available in this prospectus beginning on page 74, and more information about the underlying funds (which are not offered by this prospectus) is included under “What are the funds’ and each underlying fund’s main investment strategies and related risks?”.
It is important to understand that you can lose money by investing in the fund. Losses may occur near, at or after the target date. There is no guarantee that the fund will provide adequate income at and through an investor’s retirement.
The fund’s allocation of assets among asset classes and the underlying funds may hurt performance.
The fund invests in underlying funds and indirectly bears expenses related to the underlying funds. However, the Investment Manager has contractually agreed to waive fees, reimburse expenses of, or reimburse the fund through at least December 30, 2027 in an amount equal to the fund’s acquired fund fees and expenses (i.e., the fees and expenses incurred by the fund as a result of its investments in the underlying funds). The Investment Manager also has contractually agreed to waive fees and/or reimburse expenses of each class of shares of the fund through at least December 30, 2027 in an amount sufficient to result in total annual fund operating expenses for class A, C, R, R3, R4, R5, R6 and Y shares of the fund (exclusive of certain fees and expenses, including distribution fees (12b-1 fees)) that equal 0.55%, 0.55%, 0.70%, 0.70%, 0.70%, 0.55%, 0.45%, and 0.55%, respectively, of the fund’s average net assets. Although the Investment Manager serves as the investment adviser of the underlying funds, an underlying fund may change its investment program or policies without the fund’s approval, which could require the fund to reduce or eliminate its allocation to the underlying fund at an unfavorable time.
The fund also bears the following risks associated with the underlying funds:
Certain accounts or affiliates of the Investment Manager, including other funds advised by the Investment Manager or third parties, may from time to time own (beneficially or of record) or control a substantial amount of the fund’s shares, including through seed capital arrangements. Such shareholders may at times be considered to control the fund. Dispositions of a large number of shares by these shareholders may adversely affect the fund’s liquidity and net assets. These redemptions may also force the fund to sell securities, which may increase the fund’s brokerage costs.
There is no guarantee that the investment techniques, analyses, or judgments that we apply in making investment decisions for the underlying funds will produce the intended outcome or that the investments we select for the underlying funds will perform as well as other securities that were not selected for the underlying funds. We, or the underlying funds’ other service providers, may experience disruptions or
operating errors that could negatively impact the underlying funds. If the quantitative models or data that are used in managing an underlying fund prove to be incorrect or incomplete, investment decisions made in reliance on the models or data may not produce the desired results and the fund may realize losses.
An underlying fund’s allocation of assets among asset classes may hurt performance. The value of investments in the underlying funds’ portfolios may fall or fail to rise over extended periods of time for a variety of reasons, including general economic, political or financial market conditions, investor sentiment and market perceptions, government actions, geopolitical events or changes, outbreaks of infectious illnesses or other widespread public health issues, and factors related to a specific issuer, asset class, geography, industry or sector. These and other factors may lead to increased volatility and reduced liquidity in the underlying funds’ portfolio holdings, may negatively impact an underlying fund’s performance, and may exacerbate other risks to which an underlying fund is subject. Growth stocks may be more susceptible to earnings disappointments, and value stocks may fail to rebound. These risks are generally greater for small and midsize companies.
Fixed income investments are subject to interest rate risk, which is the risk that the value of the underlying funds’ fixed income investments is likely to fall if interest rates rise. Fixed income investments also are subject to credit risk, which is the risk that the issuers of the underlying funds’ fixed income investments may default on payment of interest or principal. Fixed income investments may be more susceptible to downgrades or defaults during economic downturns or other periods of economic stress. Interest rate risk is generally greater for longer-term bonds, and credit risk is generally greater for below-investment-grade bonds (sometimes referred to as “junk bonds”), which can be more sensitive to changes in markets, credit conditions, and interest rates and may be considered speculative. Default risk is generally higher for non-qualified mortgages. Mortgage-backed investments, unlike traditional debt investments, are also subject to prepayment risk, which means that they may increase in value less than other bonds when interest rates decline and decline in value more than other bonds when interest rates rise. The underlying funds may have to invest the proceeds from prepaid investments, including mortgage- and asset-backed investments, in other investments with less attractive terms and yields.
The value of international investments traded in foreign currencies may be adversely impacted by fluctuations in exchange rates. International investments, particularly investments in emerging markets, may carry risks associated with potentially less stable economies or governments (such as the risk of seizure by a foreign government, the imposition of currency or other restrictions, or high levels of inflation), and may be or become illiquid.
Putnam Dynamic Asset Allocation Equity Fund and Putnam Short Term Investment Fund may use, and each other underlying fund typically uses to a significant extent, derivatives, such as futures, options, swap contracts, and, for each underlying fund other than Putnam Short Term Investment Fund, certain foreign currency transactions and warrants, for both hedging and investment purposes (although, in
the case of Putnam Short Term Investment Fund, they do not represent a primary focus of the fund). Underlying funds that use derivatives to increase investment exposure may be riskier than underlying funds that do not employ investment leverage. The value of derivatives may move in unexpected ways due to unanticipated market movements, the use of leverage, imperfect correlation between the derivative instrument and the reference asset, or other factors, especially in unusual market conditions, and volatility in the value of derivatives could adversely impact the underlying fund’s returns, obligations and exposures. Derivatives are also subject to other risks, including liquidity risk (e.g., liquidity demands arising from the requirement to make payments to a derivative counterparty), operational risk (e.g., settlement issues or system failures), and legal risk (e.g., insufficient legal documentation or contract enforceability issues). Derivatives also involve the risk that an underlying fund may be unable to terminate or sell derivative positions when it wants to and that the other party to the instrument may fail to meet its obligations. The risk of a party failing to meet its obligations may increase if the underlying fund has significant investment exposure to that counterparty.
The fund may not achieve its goal, and it is not intended to be a complete investment program. An investment in the fund is not insured or guaranteed by the Federal Deposit Insurance Corporation or any other government agency.
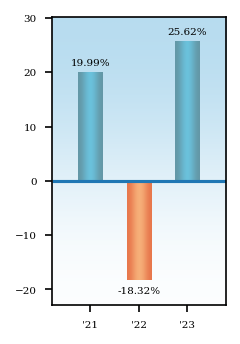
The performance information below gives some indication of the risks associated with an investment in the fund by showing the fund’s performance year to year and over time. The bar chart does not reflect the impact of sales charges. If it did, performance would be lower. Please remember that past performance is not necessarily an indication of future results. Monthly performance figures for the fund are available at www.franklintempleton.com.
Average Annual Total Returns - Putnam Retirement Advantage 2065 Fund |
1 Year |
Since Inception |
Inception Date |
||
|---|---|---|---|---|---|
| Class A 2065 | 18.40% | 5.32% | Dec. 30, 2020 | ||
| Class A 2065 | After Taxes on Distributions | 16.72% | 3.68% | Dec. 30, 2020 | ||
| Class A 2065 | After Taxes on Distributions and Sales | 11.77% | 3.70% | Dec. 30, 2020 | ||
| Class C 2065 | 23.71% | 6.61% | Dec. 30, 2020 | ||
| Class R 2065 | 25.11% | 6.99% | Dec. 30, 2020 | ||
| Class R3 2065 | 25.50% | 7.26% | Dec. 30, 2020 | ||
| Class R4 2065 | 25.60% | 7.51% | Dec. 30, 2020 | ||
| Class R5 2065 | 25.93% | 7.67% | Dec. 30, 2020 | ||
| Class R6 2065 | 26.06% | 7.78% | Dec. 30, 2020 | ||
| Class Y 2065 | 25.93% | 7.68% | Dec. 30, 2020 | ||
| Russell 3000 Index (no deduction for fees, expenses or taxes) | 25.96% | [1] | 8.80% | [1] | Dec. 30, 2020 |
| Bloomberg U.S. Aggregate Index (no deduction for fees, expenses or taxes) | 5.53% | [1] | (3.26%) | [1] | Dec. 30, 2020 |
| S&P Target Date To 2065† Index (no deduction for fees, expenses or taxes) | 20.84% | [1] | 6.52% | [1] | Dec. 30, 2020 |
| [1] | The table above compares the fund’s returns to the performance of three indexes: (i) Russell 3000 Index, a broad measure of market performance; (ii) Bloomberg U.S. Aggregate Index, also a broad measure of market performance; and (iii) S&P Target Date to 2065† Index, an additional index that the Investment Manager believes more closely reflects the fund’s principal investment objective and strategies. |
| After-tax returns reflect the historical highest individual federal marginal income tax rates and do not reflect state and local taxes. Actual after-tax returns depend on an investor’s tax situation and may differ from those shown. After-tax returns are shown for class A shares only and will vary for other classes. These after-tax returns do not apply if you hold your fund shares through a 401(k) plan, an IRA, or another tax-advantaged arrangement. |
Putnam Retirement Advantage 2060 Fund seeks capital appreciation and current income consistent with a decreasing emphasis on capital appreciation and an increasing emphasis on current income as it approaches its target date.
The following tables describe the fees and expenses you may pay if you buy, hold and sell shares of the fund. You may pay other fees, such as brokerage commissions and other fees to financial intermediaries, which are not reflected in the tables and examples below. You may qualify for sales charge discounts if you and your family invest, or agree to invest in the future, at least $50,000 in Putnam funds. More information about these and other discounts is available from your financial professional and in How do I buy fund shares? beginning on page 102 of the fund’s prospectus, in Appendix A to the fund’s prospectus, and in How to buy shares beginning on page II-1 of the fund’s statement of additional information (“SAI”).
Shareholder Fees - Putnam Retirement Advantage 2060 Fund |
Class A 2060 |
Class C 2060 |
Class R 2060 |
Class R3 2060 |
Class R4 2060 |
Class R5 2060 |
Class R6 2060 |
Class Y 2060 |
||
|---|---|---|---|---|---|---|---|---|---|---|
| Maximum Sales Charge Imposed on Purchases (as a percentage of Offering Price) | 5.75% | none | none | none | none | none | none | none | ||
| Maximum Deferred Sales Charge (as a percentage) | 1.00% | [1] | 1.00% | [2] | none | none | none | none | none | none |
| [1] | Applies only to certain redemptions of shares bought with no initial sales charge. |
| [2] | This charge is eliminated after one year. |
Annual Fund Operating Expenses - Putnam Retirement Advantage 2060 Fund |
Class A 2060 |
Class C 2060 |
Class R 2060 |
Class R3 2060 |
Class R4 2060 |
Class R5 2060 |
Class R6 2060 |
Class Y 2060 |
|
|---|---|---|---|---|---|---|---|---|---|
| Management Fees (as a percentage of Assets) | 0.44% | 0.44% | 0.44% | 0.44% | 0.44% | 0.44% | 0.44% | 0.44% | |
| Distribution and Service (12b-1) Fees | 0.25% | 1.00% | 0.50% | 0.25% | none | none | none | none | |
| Other Expenses (as a percentage of Assets): | 2.53% | 2.53% | 2.68% | 2.68% | 2.68% | 2.53% | 2.43% | 2.53% | |
| Acquired Fund Fees and Expenses | 0.61% | 0.61% | 0.61% | 0.61% | 0.61% | 0.61% | 0.61% | 0.61% | |
| Expenses (as a percentage of Assets) | 3.83% | 4.58% | 4.23% | 3.98% | 3.73% | 3.58% | 3.48% | 3.58% | |
| Fee Waiver or Reimbursement | [1] | (3.03%) | (3.03%) | (3.03%) | (3.03%) | (3.03%) | (3.03%) | (3.03%) | (3.03%) |
| Net Expenses (as a percentage of Assets) | 0.80% | 1.55% | 1.20% | 0.95% | 0.70% | 0.55% | 0.45% | 0.55% | |
| [1] | Reflects the Investment Manager’s (as defined below) contractual obligation to limit certain fund expenses through at least December 30, 2027. This obligation may be modified or discontinued only with approval of the Board of Trustees. |
The following hypothetical example is intended to help you compare the cost of investing in the fund with the cost of investing in other funds. It assumes that you invest $10,000 in the fund for the time periods indicated and then, except as indicated, redeem all your shares at the end of those periods. It assumes a 5% return on your investment each year and that the fund’s operating expenses remain the same. The example takes into account the expense reimbursement described above for the 1- and 3-year periods. Your actual costs may be higher or lower.
Expense Example - Putnam Retirement Advantage 2060 Fund - USD ($) |
Expense Example, with Redemption, 1 Year |
Expense Example, with Redemption, 3 Years |
Expense Example, with Redemption, 5 Years |
Expense Example, with Redemption, 10 Years |
Expense Example, No Redemption, 1 Year |
Expense Example, No Redemption, 3 Years |
Expense Example, No Redemption, 5 Years |
Expense Example, No Redemption, 10 Years |
|---|---|---|---|---|---|---|---|---|
| Class A 2060 | 652 | 816 | 1,642 | 3,794 | ||||
| Class C 2060 | 258 | 490 | 1,508 | 3,928 | 158 | 490 | 1,508 | 3,928 |
| Class R 2060 | 122 | 381 | 1,334 | 3,783 | ||||
| Class R3 2060 | 97 | 303 | 1,209 | 3,555 | ||||
| Class R4 2060 | 72 | 224 | 1,081 | 3,321 | ||||
| Class R5 2060 | 56 | 176 | 1,004 | 3,178 | ||||
| Class R6 2060 | 46 | 144 | 952 | 3,081 | ||||
| Class Y 2060 | 56 | 176 | 1,004 | 3,178 |
The fund pays transaction-related costs, such as commissions, when it buys and sells securities (or “turns over” its portfolio). A higher turnover rate may indicate higher transaction costs and may result in higher taxes when the fund’s shares are held in a taxable account. These costs, which are not reflected in annual fund operating
expenses or the above example, affect fund performance. The fund’s turnover rate in the most recent fiscal year was 19%.
Investments
The fund’s asset allocation strategy may be attractive to investors who plan to retire or otherwise intend to begin making periodic withdrawals of their investments in or about 2060 (the target date). The fund is designed to provide diversification among different asset classes by investing its assets in other Putnam mutual funds, referred to as underlying funds.
The fund’s target allocations among asset classes and underlying funds will increasingly emphasize capital preservation and income over time and will change gradually based on the number of remaining years until the fund’s target date, as shown in the predetermined “glide path” in the chart under “What are the funds’ and each underlying fund’s main investment strategies and related risks?”. Franklin Advisers, Inc. (“Franklin Advisers” or the “Investment Manager”) adjusts these allocations at the end of each calendar quarter based on the glide path.
The following table presents your fund’s approximate allocations to each asset class and underlying fund as of December 31, 2024 and its projected approximate allocations to these asset classes and underlying funds as of December 31, 2025. By comparing the percentage allocations of your fund in the table, you can see how its allocations are expected to change during the one-year period beginning on December 31, 2024.
The table also shows the approximate allocations of other Putnam Retirement Advantage Funds, which are designed for investors with different target retirement dates. Over a five-year period, each fund’s allocations will gradually change to resemble the allocations of the fund with the next earliest target date. The table illustrates how a fund’s allocations are expected to change over time to increasingly emphasize capital preservation and income.
| Underlying Fund* | Year | 2065 | 2060 (your fund) | 2055 | 2050 | 2045 | 2040 | 2035 | 2030 | 2025 | Maturity Fund |
| Putnam Dynamic Asset Allocation Equity Fund | 2024 | 78.0% | 62.8% | 39.0% | 15.2% | 0.0% | 0.0% | 0.0% | 0.0% | 0.0% | 0.0% |
| 2025 | 78.0% | 59.9% | 35.2% | 12.2% | 0.0% | 0.0% | 0.0% | 0.0% | 0.0% | 0.0% | |
| Putnam Dynamic Asset Allocation Growth Fund | 2024 | 21.5% | 36.7% | 60.5% | 83.8% | 92.7% | 51.8% | 0.0% | 0.0% | 0.0% | 0.0% |
| 2025 | 21.5% | 39.6% | 64.3% | 86.6% | 89.5% | 44.8% | 0.0% | 0.0% | 0.0% | 0.0% | |
| Putnam Dynamic Asset Allocation Balanced Fund | 2024 | 0.0% | 0.0% | 0.0% | 0.0% | 4.8% | 44.8% | 92.9% | 30.1% | 2.5% | 0.0% |
| 2025 | 0.0% | 0.0% | 0.0% | 0.0% | 7.8% | 51.7% | 87.1% | 19.7% | 0.6% | 0.0% | |
| Putnam Dynamic Asset Allocation Conservative Fund | 2024 | 0.0% | 0.0% | 0.0% | 0.0% | 0.0% | 0.0% | 1.1% | 47.9% | 9.8% | 0.0% |
| 2025 | 0.0% | 0.0% | 0.0% | 0.0% | 0.0% | 0.0% | 4.0% | 56.0% | 2.5% | 0.0% | |
| Putnam Short Term Investment Fund | 2024 | 0.5% | 0.5% | 0.5% | 1.0% | 2.5% | 3.4% | 4.5% | 5.8% | 6.0% | 6.0% |
| 2025 | 0.5% | 0.5% | 0.5% | 1.2% | 2.7% | 3.5% | 4.7% | 6.0% | 6.0% | 6.0% | |
| Putnam Multi-Asset Income Fund | 2024 | 0.0% | 0.0% | 0.0% | 0.0% | 0.0% | 0.0% | 1.5% | 16.2% | 81.7% | 94.0% |
| 2025 | 0.0% | 0.0% | 0.0% | 0.0% | 0.0% | 0.0% | 4.2% | 18.3% | 90.9% | 94.0% | |
| Equity** | 2024 | 95.2% | 92.2% | 87.4% | 82.2% | 77.0% | 68.3% | 56.5% | 36.8% | 26.5% | 25.4% |
| 2025 | 95.2% | 91.6% | 86.6% | 81.5% | 76.3% | 66.9% | 54.6% | 33.6% | 25.7% | 25.4% | |
| Fixed Income** | 2024 | 4.8% | 7.8% | 12.6% | 17.8% | 23.0% | 31.7% | 43.5% | 63.2% | 73.5% | 74.6% |
| 2025 | 4.8% | 8.4% | 13.4% | 18.5% | 23.7% | 33.1% | 45.4% | 66.4% | 74.3% | 74.6% |
| * | Due to rounding, allocations shown in the table above may not total 100%. In addition, because of rounding in the calculation of allocations among underlying funds and market fluctuations, actual allocations might be more or less than these percentages. |
| ** | Equity and fixed income allocations are hypothetical estimates based on each Putnam Dynamic Asset Allocation Fund’s and Putnam Multi-Asset Income Fund’s current strategic allocation to equity and fixed income investments as set forth under “What are the funds’ and each underlying fund’s main investment strategies and related risks?”, and an assumption that Putnam Short Term Investment Fund is equivalent to a fixed income investment. The managers of the underlying funds may adjust those funds’ allocations among asset classes from time to time consistent with their investment goals, and, consequently, actual allocations will vary. |
The fund’s target allocations may differ from the allocations shown in the table. We may change the glide path, the fund’s target allocations, and the underlying funds in which it invests at any time, although we expect these changes to be infrequent and generally in response to longer-term structural changes (i.e., in the average retirement age or life expectancy) that lead the fund’s portfolio managers to determine that a change is advisable. We assume investors will begin gradual withdrawals from the
fund at or around the target date. Near the end of the target date year, the fund’s target allocations will correspond to those of Putnam Retirement Advantage Maturity Fund (Maturity Fund), a fund that seeks as high a rate of current income as the Investment Manager believes is consistent with preservation of capital, and the fund will be merged into Maturity Fund. More information about Maturity Fund is available in this prospectus beginning on page 74, and more information about the underlying funds (which are not offered by this prospectus) is included under “What are the funds’ and each underlying fund’s main investment strategies and related risks?”.
It is important to understand that you can lose money by investing in the fund. Losses may occur near, at or after the target date. There is no guarantee that the fund will provide adequate income at and through an investor’s retirement.
The fund’s allocation of assets among asset classes and the underlying funds may hurt performance.
The fund invests in underlying funds and indirectly bears expenses related to the underlying funds. However, the Investment Manager has contractually agreed to waive fees, reimburse expenses of, or reimburse the fund through at least December 30, 2027 in an amount equal to the fund’s acquired fund fees and expenses (i.e., the fees and expenses incurred by the fund as a result of its investments in the underlying funds). The Investment Manager also has contractually agreed to waive fees and/or reimburse expenses of each class of shares of the fund through at least December 30, 2027 in an amount sufficient to result in total annual fund operating expenses for class A, C, R, R3, R4, R5, R6 and Y shares of the fund (exclusive of certain fees and expenses, including distribution fees (12b-1 fees)) that equal 0.55%, 0.55%, 0.70%, 0.70%, 0.70%, 0.55%, 0.45%, and 0.55%, respectively, of the fund’s average net assets. Although the Investment Manager serves as the investment adviser of the underlying funds, an underlying fund may change its investment program or policies without the fund’s approval, which could require the fund to reduce or eliminate its allocation to the underlying fund at an unfavorable time.
The fund also bears the following risks associated with the underlying funds:
Certain accounts or affiliates of the Investment Manager, including other funds advised by the Investment Manager or third parties, may from time to time own (beneficially or of record) or control a substantial amount of the fund’s shares, including through seed capital arrangements. Such shareholders may at times be considered to control the fund. Dispositions of a large number of shares by these shareholders may adversely affect the fund’s liquidity and net assets. These redemptions may also force the fund to sell securities, which may increase the fund’s brokerage costs.
There is no guarantee that the investment techniques, analyses, or judgments that we apply in making investment decisions for the underlying funds will produce the intended outcome or that the investments we select for the underlying funds will perform as well as other securities that were not selected for the underlying funds. We, or the underlying funds’ other service providers, may experience disruptions or
operating errors that could negatively impact the underlying funds. If the quantitative models or data that are used in managing an underlying fund prove to be incorrect or incomplete, investment decisions made in reliance on the models or data may not produce the desired results and the fund may realize losses.
An underlying fund’s allocation of assets among asset classes may hurt performance. The value of investments in the underlying funds’ portfolios may fall or fail to rise over extended periods of time for a variety of reasons, including general economic, political or financial market conditions, investor sentiment and market perceptions, government actions, geopolitical events or changes, outbreaks of infectious illnesses or other widespread public health issues, and factors related to a specific issuer, asset class, geography, industry or sector. These and other factors may lead to increased volatility and reduced liquidity in the underlying funds’ portfolio holdings, may negatively impact an underlying fund’s performance, and may exacerbate other risks to which an underlying fund is subject. Growth stocks may be more susceptible to earnings disappointments, and value stocks may fail to rebound. These risks are generally greater for small and midsize companies.
Fixed income investments are subject to interest rate risk, which is the risk that the value of the underlying funds’ fixed income investments is likely to fall if interest rates rise. Fixed income investments also are subject to credit risk, which is the risk that the issuers of the underlying funds’ fixed income investments may default on payment of interest or principal. Fixed income investments may be more susceptible to downgrades or defaults during economic downturns or other periods of economic stress. Interest rate risk is generally greater for longer-term bonds, and credit risk is generally greater for below-investment-grade bonds (sometimes referred to as “junk bonds”), which can be more sensitive to changes in markets, credit conditions, and interest rates and may be considered speculative. Default risk is generally higher for non-qualified mortgages. Mortgage-backed investments, unlike traditional debt investments, are also subject to prepayment risk, which means that they may increase in value less than other bonds when interest rates decline and decline in value more than other bonds when interest rates rise. The underlying funds may have to invest the proceeds from prepaid investments, including mortgage- and asset-backed investments, in other investments with less attractive terms and yields.
The value of international investments traded in foreign currencies may be adversely impacted by fluctuations in exchange rates. International investments, particularly investments in emerging markets, may carry risks associated with potentially less stable economies or governments (such as the risk of seizure by a foreign government, the imposition of currency or other restrictions, or high levels of inflation), and may be or become illiquid.
Putnam Dynamic Asset Allocation Equity Fund and Putnam Short Term Investment Fund may use, and each other underlying fund typically uses to a significant extent, derivatives, such as futures, options, swap contracts, and, for each underlying fund other than Putnam Short Term Investment Fund, certain foreign currency transactions and warrants, for both hedging and investment purposes (although, in
the case of Putnam Short Term Investment Fund, they do not represent a primary focus of the fund). Underlying funds that use derivatives to increase investment exposure may be riskier than underlying funds that do not employ investment leverage. The value of derivatives may move in unexpected ways due to unanticipated market movements, the use of leverage, imperfect correlation between the derivative instrument and the reference asset, or other factors, especially in unusual market conditions, and volatility in the value of derivatives could adversely impact the underlying fund’s returns, obligations and exposures. Derivatives are also subject to other risks, including liquidity risk (e.g., liquidity demands arising from the requirement to make payments to a derivative counterparty), operational risk (e.g., settlement issues or system failures), and legal risk (e.g., insufficient legal documentation or contract enforceability issues). Derivatives also involve the risk that an underlying fund may be unable to terminate or sell derivative positions when it wants to and that the other party to the instrument may fail to meet its obligations. The risk of a party failing to meet its obligations may increase if the underlying fund has significant investment exposure to that counterparty.
The fund may not achieve its goal, and it is not intended to be a complete investment program. An investment in the fund is not insured or guaranteed by the Federal Deposit Insurance Corporation or any other government agency.
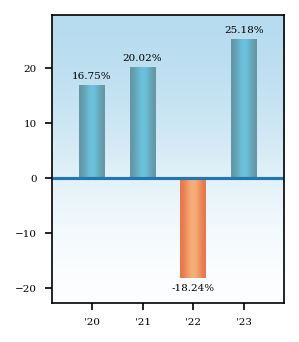
The performance information below gives some indication of the risks associated with an investment in the fund by showing the fund’s performance year to year and over time. The bar chart does not reflect the impact of sales charges. If it did, performance would be lower. Please remember that past performance is not necessarily an indication of future results. Monthly performance figures for the fund are available at www.franklintempleton.com.
Average Annual Total Returns - Putnam Retirement Advantage 2060 Fund |
1 Year |
Since Inception |
Inception Date |
||
|---|---|---|---|---|---|
| Class A 2060 | 17.98% | [1] | 7.82% | [1] | Dec. 31, 2019 |
| Class A 2060 | After Taxes on Distributions | 15.60% | [1] | 5.03% | [1] | Dec. 31, 2019 |
| Class A 2060 | After Taxes on Distributions and Sales | 11.96% | [1] | 5.31% | [1] | Dec. 31, 2019 |
| Class C 2060 | 23.18% | [1] | 8.61% | [1] | Dec. 31, 2019 |
| Class R 2060 | 24.67% | [1] | 8.97% | [1] | Dec. 31, 2019 |
| Class R3 2060 | 25.00% | [1] | 9.26% | [1] | Dec. 31, 2019 |
| Class R4 2060 | 25.31% | [1] | 9.50% | [1] | Dec. 31, 2019 |
| Class R5 2060 | 25.44% | [1] | 9.65% | [1] | Dec. 31, 2019 |
| Class R6 2060 | 25.56% | 9.77% | Dec. 31, 2019 | ||
| Class Y 2060 | 25.45% | [1] | 9.66% | [1] | Dec. 31, 2019 |
| Russell 3000 Index (no deduction for fees, expenses or taxes) | 25.96% | [2] | 8.80% | [2] | Dec. 31, 2019 |
| Bloomberg U.S. Aggregate Index (no deduction for fees, expenses or taxes) | 5.53% | [2] | (3.26%) | [2] | Dec. 31, 2019 |
| S&P Target Date To 2060 Index (no deduction for fees, expenses or taxes) | 20.44% | [2] | 7.92% | [2] | Dec. 31, 2019 |
| [1] | Performance for classes A, C, R, R3, R4, R5, and Y shares prior to their inception (9/1/20) is derived from the historical performance of class R6 shares, adjusted for the higher operating expenses and, for class A and C shares, higher sales charges (in the case of after sales-charge returns) applicable to such classes. |
| [2] | The table above compares the fund’s returns to the performance of three indexes: (i) Russell 3000 Index, a broad measure of market performance; (ii) Bloomberg U.S. Aggregate Index, also a broad measure of market performance; and (iii) S&P Target Date To 2060 Index, an additional index that the Investment Manager believes more closely reflect the fund’s principal investment objective and strategies. |
| After-tax returns reflect the historical highest individual federal marginal income tax rates and do not reflect state and local taxes. Actual after-tax returns depend on an investor’s tax situation and may differ from those shown. After-tax returns are shown for class A shares only and will vary for other classes. These after-tax returns do not apply if you hold your fund shares through a 401(k) plan, an IRA, or another tax-advantaged arrangement. |
Putnam Retirement Advantage 2055 Fund seeks capital appreciation and current income consistent with a decreasing emphasis on capital appreciation and an increasing emphasis on current income as it approaches its target date.
The following tables describe the fees and expenses you may pay if you buy, hold and sell shares of the fund. You may pay other fees, such as brokerage commissions and other fees to financial intermediaries, which are not reflected in the tables and examples below. You may qualify for sales charge discounts if you and your family invest, or agree to invest in the future, at least $50,000 in Putnam funds. More information about these and other discounts is available from your financial professional and in How do I buy fund shares? beginning on page 102 of the fund’s prospectus, in Appendix A to the fund’s prospectus, and in How to buy shares beginning on page II-1 of the fund’s statement of additional information (“SAI”).
Shareholder Fees - Putnam Retirement Advantage 2055 Fund |
Class A 2055 |
Class C 2055 |
Class R 2055 |
Class R3 2055 |
Class R4 2055 |
Class R5 2055 |
Class R6 2055 |
Class Y 2055 |
||
|---|---|---|---|---|---|---|---|---|---|---|
| Maximum Sales Charge Imposed on Purchases (as a percentage of Offering Price) | 5.75% | none | none | none | none | none | none | none | ||
| Maximum Deferred Sales Charge (as a percentage) | 1.00% | [1] | 1.00% | [2] | none | none | none | none | none | none |
| [1] | Applies only to certain redemptions of shares bought with no initial sales charge. |
| [2] | This charge is eliminated after one year. |
Annual Fund Operating Expenses - Putnam Retirement Advantage 2055 Fund |
Class A 2055 |
Class C 2055 |
Class R 2055 |
Class R3 2055 |
Class R4 2055 |
Class R5 2055 |
Class R6 2055 |
Class Y 2055 |
|
|---|---|---|---|---|---|---|---|---|---|
| Management Fees (as a percentage of Assets) | 0.43% | 0.43% | 0.43% | 0.43% | 0.43% | 0.43% | 0.43% | 0.43% | |
| Distribution and Service (12b-1) Fees | 0.25% | 1.00% | 0.50% | 0.25% | none | none | none | none | |
| Other Expenses (as a percentage of Assets): | 1.80% | 1.80% | 1.95% | 1.95% | 1.95% | 1.80% | 1.70% | 1.80% | |
| Acquired Fund Fees and Expenses | 0.62% | 0.62% | 0.62% | 0.62% | 0.62% | 0.62% | 0.62% | 0.62% | |
| Expenses (as a percentage of Assets) | 3.10% | 3.85% | 3.50% | 3.25% | 3.00% | 2.85% | 2.75% | 2.85% | |
| Fee Waiver or Reimbursement | [1] | (2.30%) | (2.30%) | (2.30%) | (2.30%) | (2.30%) | (2.30%) | (2.30%) | (2.30%) |
| Net Expenses (as a percentage of Assets) | 0.80% | 1.55% | 1.20% | 0.95% | 0.70% | 0.55% | 0.45% | 0.55% | |
| [1] | Reflects the Investment Manager’s (as defined below) contractual obligation to limit certain fund expenses through at least December 30, 2027. This obligation may be modified or discontinued only with approval of the Board of Trustees. |
The following hypothetical example is intended to help you compare the cost of investing in the fund with the cost of investing in other funds. It assumes that you invest $10,000 in the fund for the time periods indicated and then, except as indicated, redeem all your shares at the end of those periods. It assumes a 5% return on your investment each year and that the fund’s operating expenses remain the same. The example takes into account the expense reimbursement described above for the 1- and 3-year periods. Your actual costs may be higher or lower.
Expense Example - Putnam Retirement Advantage 2055 Fund - USD ($) |
Expense Example, with Redemption, 1 Year |
Expense Example, with Redemption, 3 Years |
Expense Example, with Redemption, 5 Years |
Expense Example, with Redemption, 10 Years |
Expense Example, No Redemption, 1 Year |
Expense Example, No Redemption, 3 Years |
Expense Example, No Redemption, 5 Years |
Expense Example, No Redemption, 10 Years |
|---|---|---|---|---|---|---|---|---|
| Class A 2055 | 652 | 816 | 1,490 | 3,289 | ||||
| Class C 2055 | 258 | 490 | 1,352 | 3,424 | 158 | 490 | 1,352 | 3,424 |
| Class R 2055 | 122 | 381 | 1,176 | 3,269 | ||||
| Class R3 2055 | 97 | 303 | 1,048 | 3,028 | ||||
| Class R4 2055 | 72 | 224 | 918 | 2,780 | ||||
| Class R5 2055 | 56 | 176 | 840 | 2,628 | ||||
| Class R6 2055 | 46 | 144 | 787 | 2,525 | ||||
| Class Y 2055 | 56 | 176 | 840 | 2,628 |
The fund pays transaction-related costs, such as commissions, when it buys and sells securities (or “turns over” its portfolio). A higher turnover rate may indicate higher transaction costs and may result in higher taxes when the fund’s shares are held in a taxable account. These costs, which are not reflected in annual fund operating
expenses or the above example, affect fund performance. The fund’s turnover rate in the most recent fiscal year was 21%.
Investments
The fund’s asset allocation strategy may be attractive to investors who plan to retire or otherwise intend to begin making periodic withdrawals of their investments in or about 2055 (the target date). The fund is designed to provide diversification among different asset classes by investing its assets in other Putnam mutual funds, referred to as underlying funds.
The fund’s target allocations among asset classes and underlying funds will increasingly emphasize capital preservation and income over time and will change gradually based on the number of remaining years until the fund’s target date, as shown in the predetermined “glide path” in the chart under “What are the funds’ and each underlying fund’s main investment strategies and related risks?”. Franklin Advisers, Inc (“Franklin Advisers” or the “Investment Manager”) adjusts these allocations at the end of each calendar quarter based on the glide path.
The following table presents your fund’s approximate allocations to each asset class and underlying fund as of December 31, 2024 and its projected approximate allocations to these asset classes and underlying funds as of December 31, 2025. By comparing the percentage allocations of your fund in the table, you can see how its allocations are expected to change during the one-year period beginning on December 31, 2024.
The table also shows the approximate allocations of other Putnam Retirement Advantage Funds, which are designed for investors with different target retirement dates. Over a five-year period, each fund’s allocations will gradually change to resemble the allocations of the fund with the next earliest target date. The table illustrates how a fund’s allocations are expected to change over time to increasingly emphasize capital preservation and income.
| Underlying Fund* | Year | 2065 | 2060 | 2055 (your fund) | 2050 | 2045 | 2040 | 2035 | 2030 | 2025 | Maturity Fund |
| Putnam Dynamic Asset Allocation Equity Fund | 2024 | 78.0% | 62.8% | 39.0% | 15.2% | 0.0% | 0.0% | 0.0% | 0.0% | 0.0% | 0.0% |
| 2025 | 78.0% | 59.9% | 35.2% | 12.2% | 0.0% | 0.0% | 0.0% | 0.0% | 0.0% | 0.0% | |
| Putnam Dynamic Asset Allocation Growth Fund | 2024 | 21.5% | 36.7% | 60.5% | 83.8% | 92.7% | 51.8% | 0.0% | 0.0% | 0.0% | 0.0% |
| 2025 | 21.5% | 39.6% | 64.3% | 86.6% | 89.5% | 44.8% | 0.0% | 0.0% | 0.0% | 0.0% | |
| Putnam Dynamic Asset Allocation Balanced Fund | 2024 | 0.0% | 0.0% | 0.0% | 0.0% | 4.8% | 44.8% | 92.9% | 30.1% | 2.5% | 0.0% |
| 2025 | 0.0% | 0.0% | 0.0% | 0.0% | 7.8% | 51.7% | 87.1% | 19.7% | 0.6% | 0.0% | |
| Putnam Dynamic Asset Allocation Conservative Fund | 2024 | 0.0% | 0.0% | 0.0% | 0.0% | 0.0% | 0.0% | 1.1% | 47.9% | 9.8% | 0.0% |
| 2025 | 0.0% | 0.0% | 0.0% | 0.0% | 0.0% | 0.0% | 4.0% | 56.0% | 2.5% | 0.0% | |
| Putnam Short Term Investment Fund | 2024 | 0.5% | 0.5% | 0.5% | 1.0% | 2.5% | 3.4% | 4.5% | 5.8% | 6.0% | 6.0% |
| 2025 | 0.5% | 0.5% | 0.5% | 1.2% | 2.7% | 3.5% | 4.7% | 6.0% | 6.0% | 6.0% | |
| Putnam Multi-Asset Income Fund | 2024 | 0.0% | 0.0% | 0.0% | 0.0% | 0.0% | 0.0% | 1.5% | 16.2% | 81.7% | 94.0% |
| 2025 | 0.0% | 0.0% | 0.0% | 0.0% | 0.0% | 0.0% | 4.2% | 18.3% | 90.9% | 94.0% | |
| Equity** | 2024 | 95.2% | 92.2% | 87.4% | 82.2% | 77.0% | 68.3% | 56.5% | 36.8% | 26.5% | 25.4% |
| 2025 | 95.2% | 91.6% | 86.6% | 81.5% | 76.3% | 66.9% | 54.6% | 33.6% | 25.7% | 25.4% | |
| Fixed Income** | 2024 | 4.8% | 7.8% | 12.6% | 17.8% | 23.0% | 31.7% | 43.5% | 63.2% | 73.5% | 74.6% |
| 2025 | 4.8% | 8.4% | 13.4% | 18.5% | 23.7% | 33.1% | 45.4% | 66.4% | 74.3% | 74.6% |
| * | Due to rounding, allocations shown in the table above may not total 100%. In addition, because of rounding in the calculation of allocations among underlying funds and market fluctuations, actual allocations might be more or less than these percentages. |
| ** | Equity and fixed income allocations are hypothetical estimates based on each Putnam Dynamic Asset Allocation Fund’s and Putnam Multi-Asset Income Fund’s current strategic allocation to equity and fixed income investments as set forth under “What are the funds’ and each underlying fund’s main investment strategies and related risks?”, and an assumption that Putnam Short Term Investment Fund is equivalent to a fixed income investment. The managers of the underlying funds may adjust those funds’ allocations among asset classes from time to time consistent with their investment goals, and, consequently, actual allocations will vary. |
The fund’s target allocations may differ from the allocations shown in the table. We may change the glide path, the fund’s target allocations, and the underlying funds in which it invests at any time, although we expect these changes to be infrequent and generally in response to longer-term structural changes (i.e., in the average retirement age or life expectancy) that lead the fund’s portfolio managers to determine that a change is advisable. We assume investors will begin gradual withdrawals from the
fund at or around the target date. Near the end of the target date year, the fund’s target allocations will correspond to those of Putnam Retirement Advantage Maturity Fund (Maturity Fund), a fund that seeks as high a rate of current income as the Investment Manager believes is consistent with preservation of capital, and the fund will be merged into Maturity Fund. More information about Maturity Fund is available in this prospectus beginning on page 74, and more information about the underlying funds (which are not offered by this prospectus) is included under “What are the funds’ and each underlying fund’s main investment strategies and related risks?”.
It is important to understand that you can lose money by investing in the fund. Losses may occur near, at or after the target date. There is no guarantee that the fund will provide adequate income at and through an investor’s retirement.
The fund’s allocation of assets among asset classes and the underlying funds may hurt performance.
The fund invests in underlying funds and indirectly bears expenses related to the underlying funds. However, the Investment Manager has contractually agreed to waive fees, reimburse expenses of, or reimburse the fund through at least December 30, 2027 in an amount equal to the fund’s acquired fund fees and expenses (i.e., the fees and expenses incurred by the fund as a result of its investments in the underlying funds). The Investment Manager also has contractually agreed to waive fees and/or reimburse expenses of each class of shares of the fund through at least December 30, 2027 in an amount sufficient to result in total annual fund operating expenses for class A, C, R, R3, R4, R5, R6 and Y shares of the fund (exclusive of certain fees and expenses, including distribution fees (12b-1 fees)) that equal 0.55%, 0.55%, 0.70%, 0.70%, 0.70%, 0.55%, 0.45%, and 0.55%, respectively, of the fund’s average net assets. Although the Investment Manager serves as the investment adviser of the underlying funds, an underlying fund may change its investment program or policies without the fund’s approval, which could require the fund to reduce or eliminate its allocation to the underlying fund at an unfavorable time.
The fund also bears the following risks associated with the underlying funds:
Certain accounts or affiliates of the Investment Manager, including other funds advised by the Investment Manager or third parties, may from time to time own (beneficially or of record) or control a substantial amount of the fund’s shares, including through seed capital arrangements. Such shareholders may at times be considered to control the fund. Dispositions of a large number of shares by these shareholders may adversely affect the fund’s liquidity and net assets. These redemptions may also force the fund to sell securities, which may increase the fund’s brokerage costs.
There is no guarantee that the investment techniques, analyses, or judgments that we apply in making investment decisions for the underlying funds will produce the intended outcome or that the investments we select for the underlying funds will perform as well as other securities that were not selected for the underlying funds. We, or the underlying funds’ other service providers, may experience disruptions or
operating errors that could negatively impact the underlying funds. If the quantitative models or data that are used in managing an underlying fund prove to be incorrect or incomplete, investment decisions made in reliance on the models or data may not produce the desired results and the fund may realize losses.
An underlying fund’s allocation of assets among asset classes may hurt performance. The value of investments in the underlying funds’ portfolios may fall or fail to rise over extended periods of time for a variety of reasons, including general economic, political or financial market conditions, investor sentiment and market perceptions, government actions, geopolitical events or changes, outbreaks of infectious illnesses or other widespread public health issues, and factors related to a specific issuer, asset class, geography, industry or sector. These and other factors may lead to increased volatility and reduced liquidity in the underlying funds’ portfolio holdings, may negatively impact an underlying fund’s performance, and may exacerbate other risks to which an underlying fund is subject. Growth stocks may be more susceptible to earnings disappointments, and value stocks may fail to rebound. These risks are generally greater for small and midsize companies.
Fixed income investments are subject to interest rate risk, which is the risk that the value of the underlying funds’ fixed income investments is likely to fall if interest rates rise. Fixed income investments also are subject to credit risk, which is the risk that the issuers of the underlying funds’ fixed income investments may default on payment of interest or principal. Fixed income investments may be more susceptible to downgrades or defaults during economic downturns or other periods of economic stress. Interest rate risk is generally greater for longer-term bonds, and credit risk is generally greater for below-investment-grade bonds (sometimes referred to as “junk bonds”), which can be more sensitive to changes in markets, credit conditions, and interest rates and may be considered speculative. Default risk is generally higher for non-qualified mortgages. Mortgage-backed investments, unlike traditional debt investments, are also subject to prepayment risk, which means that they may increase in value less than other bonds when interest rates decline and decline in value more than other bonds when interest rates rise. The underlying funds may have to invest the proceeds from prepaid investments, including mortgage- and asset-backed investments, in other investments with less attractive terms and yields.
The value of international investments traded in foreign currencies may be adversely impacted by fluctuations in exchange rates. International investments, particularly investments in emerging markets, may carry risks associated with potentially less stable economies or governments (such as the risk of seizure by a foreign government, the imposition of currency or other restrictions, or high levels of inflation), and may be or become illiquid.
Putnam Dynamic Asset Allocation Equity Fund and Putnam Short Term Investment Fund may use, and each other underlying fund typically uses to a significant extent, derivatives, such as futures, options, swap contracts, and, for each underlying fund other than Putnam Short Term Investment Fund, certain foreign currency transactions and warrants, for both hedging and investment purposes (although, in
the case of Putnam Short Term Investment Fund, they do not represent a primary focus of the fund). Underlying funds that use derivatives to increase investment exposure may be riskier than underlying funds that do not employ investment leverage. The value of derivatives may move in unexpected ways due to unanticipated market movements, the use of leverage, imperfect correlation between the derivative instrument and the reference asset, or other factors, especially in unusual market conditions, and volatility in the value of derivatives could adversely impact the underlying fund’s returns, obligations and exposures. Derivatives are also subject to other risks, including liquidity risk (e.g., liquidity demands arising from the requirement to make payments to a derivative counterparty), operational risk (e.g., settlement issues or system failures), and legal risk (e.g., insufficient legal documentation or contract enforceability issues). Derivatives also involve the risk that an underlying fund may be unable to terminate or sell derivative positions when it wants to and that the other party to the instrument may fail to meet its obligations. The risk of a party failing to meet its obligations may increase if the underlying fund has significant investment exposure to that counterparty.
The fund may not achieve its goal, and it is not intended to be a complete investment program. An investment in the fund is not insured or guaranteed by the Federal Deposit Insurance Corporation or any other government agency.
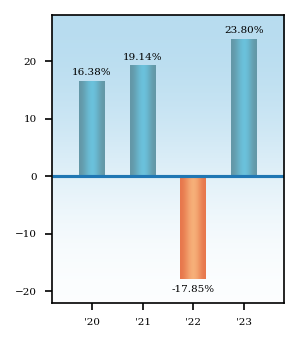
The performance information below gives some indication of the risks associated with an investment in the fund by showing the fund’s performance year to year and over time. The bar chart does not reflect the impact of sales charges. If it did, performance would be lower. Please remember that past performance is not necessarily an indication of future results. Monthly performance figures for the fund are available at www.franklintempleton.com.
Average Annual Total Returns - Putnam Retirement Advantage 2055 Fund |
1 Year |
Since Inception |
Inception Date |
||
|---|---|---|---|---|---|
| Class A 2055 | 16.68% | [1] | 7.37% | [1] | Dec. 31, 2019 |
| Class A 2055 | After Taxes on Distributions | 15.21% | [1] | 5.03% | [1] | Dec. 31, 2019 |
| Class A 2055 | After Taxes on Distributions and Sales | 10.48% | [1] | 5.19% | [1] | Dec. 31, 2019 |
| Class C 2055 | 21.89% | [1] | 8.19% | [1] | Dec. 31, 2019 |
| Class R 2055 | 23.36% | [1] | 8.53% | [1] | Dec. 31, 2019 |
| Class R3 2055 | 23.74% | [1] | 8.82% | [1] | Dec. 31, 2019 |
| Class R4 2055 | 24.00% | [1] | 9.07% | [1] | Dec. 31, 2019 |
| Class R5 2055 | 24.19% | [1] | 9.22% | [1] | Dec. 31, 2019 |
| Class R6 2055 | 24.29% | 9.34% | Dec. 31, 2019 | ||
| Class Y 2055 | 24.19% | [1] | 9.22% | [1] | Dec. 31, 2019 |
| Russell 3000 Index (no deduction for fees, expenses or taxes) | 25.96% | [2] | 8.80% | [2] | Dec. 31, 2019 |
| Bloomberg U.S. Aggregate Index (no deduction for fees, expenses or taxes) | 5.53% | [2] | (3.26%) | [2] | Dec. 31, 2019 |
| S&P Target Date To 2055 Index (no deduction for fees, expenses or taxes) | 20.21% | [2] | 7.69% | [2] | Dec. 31, 2019 |
| [1] | Performance for classes A, C, R, R3, R4, R5, and Y shares prior to their inception (9/1/20) is derived from the historical performance of class R6 shares, adjusted for the higher operating expenses and, for class A and C shares, higher sales charges (in the case of after sales-charge returns) applicable to such classes. |
| [2] | The table above compares the fund’s returns to the performance of three indexes: (i) Russell 3000 Index, a broad measure of market performance; (ii) Bloomberg U.S. Aggregate Index, also a broad measure of market performance; and (iii) S&P Target Date To 2055 Index, an additional index that the Investment Manager believes more closely reflect the fund’s principal investment objective and strategies. |
| After-tax returns reflect the historical highest individual federal marginal income tax rates and do not reflect state and local taxes. Actual after-tax returns depend on an investor’s tax situation and may differ from those shown. After-tax returns are shown for class A shares only and will vary for other classes. These after-tax returns do not apply if you hold your fund shares through a 401(k) plan, an IRA, or another tax-advantaged arrangement. |
Putnam Retirement Advantage 2050 Fund seeks capital appreciation and current income consistent with a decreasing emphasis on capital appreciation and an increasing emphasis on current income as it approaches its target date.
The following tables describe the fees and expenses you may pay if you buy, hold and sell shares of the fund. You may pay other fees, such as brokerage commissions and other fees to financial intermediaries, which are not reflected in the tables and examples below. You may qualify for sales charge discounts if you and your family invest, or agree to invest in the future, at least $50,000 in Putnam funds. More information about these and other discounts is available from your financial professional and in How do I buy fund shares? beginning on page 102 of the fund’s prospectus, in Appendix A to the fund’s prospectus, and in How to buy shares beginning on page II-1 of the fund’s statement of additional information (“SAI”).
Shareholder Fees - Putnam Retirement Advantage 2050 Fund |
Class A 2050 |
Class C 2050 |
Class R 2050 |
Class R3 2050 |
Class R4 2050 |
Class R5 2050 |
Class R6 2050 |
Class Y 2050 |
||
|---|---|---|---|---|---|---|---|---|---|---|
| Maximum Sales Charge Imposed on Purchases (as a percentage of Offering Price) | 5.75% | none | none | none | none | none | none | none | ||
| Maximum Deferred Sales Charge (as a percentage) | 1.00% | [1] | 1.00% | [2] | none | none | none | none | none | none |
| [1] | Applies only to certain redemptions of shares bought with no initial sales charge. |
| [2] | This charge is eliminated after one year. |
Annual Fund Operating Expenses - Putnam Retirement Advantage 2050 Fund |
Class A 2050 |
Class C 2050 |
Class R 2050 |
Class R3 2050 |
Class R4 2050 |
Class R5 2050 |
Class R6 2050 |
Class Y 2050 |
|
|---|---|---|---|---|---|---|---|---|---|
| Management Fees (as a percentage of Assets) | 0.42% | 0.42% | 0.42% | 0.42% | 0.42% | 0.42% | 0.42% | 0.42% | |
| Distribution and Service (12b-1) Fees | 0.25% | 1.00% | 0.50% | 0.25% | none | none | none | none | |
| Other Expenses (as a percentage of Assets): | 1.33% | 1.33% | 1.48% | 1.48% | 1.48% | 1.33% | 1.23% | 1.33% | |
| Acquired Fund Fees and Expenses | 0.63% | 0.63% | 0.63% | 0.63% | 0.63% | 0.63% | 0.63% | 0.63% | |
| Expenses (as a percentage of Assets) | 2.63% | 3.38% | 3.03% | 2.78% | 2.53% | 2.38% | 2.28% | 2.38% | |
| Fee Waiver or Reimbursement | [1] | (1.83%) | (1.83%) | (1.83%) | (1.83%) | (1.83%) | (1.83%) | (1.83%) | (1.83%) |
| Net Expenses (as a percentage of Assets) | 0.80% | 1.55% | 1.20% | 0.95% | 0.70% | 0.55% | 0.45% | 0.55% | |
| [1] | Reflects the Investment Manager’s (as defined below) contractual obligation to limit certain fund expenses through at least December 30, 2027. This obligation may be modified or discontinued only with approval of the Board of Trustees. |
The following hypothetical example is intended to help you compare the cost of investing in the fund with the cost of investing in other funds. It assumes that you invest $10,000 in the fund for the time periods indicated and then, except as indicated, redeem all your shares at the end of those periods. It assumes a 5% return on your investment each year and that the fund’s operating expenses remain the same. The example takes into account the expense reimbursement described above for the 1- and 3-year periods. Your actual costs may be higher or lower.
Expense Example - Putnam Retirement Advantage 2050 Fund - USD ($) |
Expense Example, with Redemption, 1 Year |
Expense Example, with Redemption, 3 Years |
Expense Example, with Redemption, 5 Years |
Expense Example, with Redemption, 10 Years |
Expense Example, No Redemption, 1 Year |
Expense Example, No Redemption, 3 Years |
Expense Example, No Redemption, 5 Years |
Expense Example, No Redemption, 10 Years |
|---|---|---|---|---|---|---|---|---|
| Class A 2050 | 652 | 816 | 1,390 | 2,949 | ||||
| Class C 2050 | 258 | 490 | 1,250 | 3,084 | 158 | 490 | 1,250 | 3,084 |
| Class R 2050 | 122 | 381 | 1,072 | 2,923 | ||||
| Class R3 2050 | 97 | 303 | 943 | 2,672 | ||||
| Class R4 2050 | 72 | 224 | 812 | 2,415 | ||||
| Class R5 2050 | 56 | 176 | 733 | 2,258 | ||||
| Class R6 2050 | 46 | 144 | 680 | 2,151 | ||||
| Class Y 2050 | 56 | 176 | 733 | 2,258 |
The fund pays transaction-related costs, such as commissions, when it buys and sells securities (or “turns over” its portfolio). A higher turnover rate may indicate higher transaction costs and may result in higher taxes when the fund’s shares are held in a taxable account. These costs, which are not reflected in annual fund operating
expenses or the above example, affect fund performance. The fund’s turnover rate in the most recent fiscal year was 21%.
Investments
The fund’s asset allocation strategy may be attractive to investors who plan to retire or otherwise intend to begin making periodic withdrawals of their investments in or about 2050 (the target date). The fund is designed to provide diversification among different asset classes by investing its assets in other Putnam mutual funds, referred to as underlying funds.
The fund’s target allocations among asset classes and underlying funds will increasingly emphasize capital preservation and income over time and will change gradually based on the number of remaining years until the fund’s target date, as shown in the predetermined “glide path” in the chart under “What are the funds’ and each underlying fund’s main investment strategies and related risks?”. Franklin Advisers, Inc. (“Franklin Advisers” or the “Investment Manager”) adjusts these allocations at the end of each calendar quarter based on the glide path.
The following table presents your fund’s approximate allocations to each asset class and underlying fund as of December 31, 2024 and its projected approximate allocations to these asset classes and underlying funds as of December 31, 2025. By comparing the percentage allocations of your fund in the table, you can see how its allocations are expected to change during the one-year period beginning on December 31, 2024.
The table also shows the approximate allocations of other Putnam Retirement Advantage Funds, which are designed for investors with different target retirement dates. Over a five-year period, each fund’s allocations will gradually change to resemble the allocations of the fund with the next earliest target date. The table illustrates how a fund’s allocations are expected to change over time to increasingly emphasize capital preservation and income.
| Underlying Fund* | Year | 2065 | 2060 | 2055 | 2050 (your fund) | 2045 | 2040 | 2035 | 2030 | 2025 | Maturity Fund |
| Putnam Dynamic Asset Allocation Equity Fund | 2024 | 78.0% | 62.8% | 39.0% | 15.2% | 0.0% | 0.0% | 0.0% | 0.0% | 0.0% | 0.0% |
| 2025 | 78.0% | 59.9% | 35.2% | 12.2% | 0.0% | 0.0% | 0.0% | 0.0% | 0.0% | 0.0% | |
| Putnam Dynamic Asset Allocation Growth Fund | 2024 | 21.5% | 36.7% | 60.5% | 83.8% | 92.7% | 51.8% | 0.0% | 0.0% | 0.0% | 0.0% |
| 2025 | 21.5% | 39.6% | 64.3% | 86.6% | 89.5% | 44.8% | 0.0% | 0.0% | 0.0% | 0.0% | |
| Putnam Dynamic Asset Allocation Balanced Fund | 2024 | 0.0% | 0.0% | 0.0% | 0.0% | 4.8% | 44.8% | 92.9% | 30.1% | 2.5% | 0.0% |
| 2025 | 0.0% | 0.0% | 0.0% | 0.0% | 7.8% | 51.7% | 87.1% | 19.7% | 0.6% | 0.0% | |
| Putnam Dynamic Asset Allocation Conservative Fund | 2024 | 0.0% | 0.0% | 0.0% | 0.0% | 0.0% | 0.0% | 1.1% | 47.9% | 9.8% | 0.0% |
| 2025 | 0.0% | 0.0% | 0.0% | 0.0% | 0.0% | 0.0% | 4.0% | 56.0% | 2.5% | 0.0% | |
| Putnam Short Term Investment Fund | 2024 | 0.5% | 0.5% | 0.5% | 1.0% | 2.5% | 3.4% | 4.5% | 5.8% | 6.0% | 6.0% |
| 2025 | 0.5% | 0.5% | 0.5% | 1.2% | 2.7% | 3.5% | 4.7% | 6.0% | 6.0% | 6.0% | |
| Putnam Multi-Asset Income Fund | 2024 | 0.0% | 0.0% | 0.0% | 0.0% | 0.0% | 0.0% | 1.5% | 16.2% | 81.7% | 94.0% |
| 2025 | 0.0% | 0.0% | 0.0% | 0.0% | 0.0% | 0.0% | 4.2% | 18.3% | 90.9% | 94.0% | |
| Equity** | 2024 | 95.2% | 92.2% | 87.4% | 82.2% | 77.0% | 68.3% | 56.5% | 36.8% | 26.5% | 25.4% |
| 2025 | 95.2% | 91.6% | 86.6% | 81.5% | 76.3% | 66.9% | 54.6% | 33.6% | 25.7% | 25.4% | |
| Fixed Income** | 2024 | 4.8% | 7.8% | 12.6% | 17.8% | 23.0% | 31.7% | 43.5% | 63.2% | 73.5% | 74.6% |
| 2025 | 4.8% | 8.4% | 13.4% | 18.5% | 23.7% | 33.1% | 45.4% | 66.4% | 74.3% | 74.6% |
| * | Due to rounding, allocations shown in the table above may not total 100%. In addition, because of rounding in the calculation of allocations among underlying funds and market fluctuations, actual allocations might be more or less than these percentages. |
| ** | Equity and fixed income allocations are hypothetical estimates based on each Putnam Dynamic Asset Allocation Fund’s and Putnam Multi-Asset Income Fund’s current strategic allocation to equity and fixed income investments as set forth under “What are the funds’ and each underlying fund’s main investment strategies and related risks?”, and an assumption that Putnam Short Term Investment Fund is equivalent to a fixed income investment. The managers of the underlying funds may adjust those funds’ allocations among asset classes from time to time consistent with their investment goals, and, consequently, actual allocations will vary. |
The fund’s target allocations may differ from the allocations shown in the table. We may change the glide path, the fund’s target allocations, and the underlying funds in which it invests at any time, although we expect these changes to be infrequent and generally in response to longer-term structural changes (i.e., in the average retirement age or life expectancy) that lead the fund’s portfolio managers to determine that a change is advisable. We assume investors will begin gradual withdrawals from the
fund at or around the target date. Near the end of the target date year, the fund’s target allocations will correspond to those of Putnam Retirement Advantage Maturity Fund (Maturity Fund), a fund that seeks as high a rate of current income as the Investment Manager believes is consistent with preservation of capital, and the fund will be merged into Maturity Fund. More information about Maturity Fund is available in this prospectus beginning on page 74, and more information about the underlying funds (which are not offered by this prospectus) is included under “What are the funds’ and each underlying fund’s main investment strategies and related risks?”.
It is important to understand that you can lose money by investing in the fund. Losses may occur near, at or after the target date. There is no guarantee that the fund will provide adequate income at and through an investor’s retirement.
The fund’s allocation of assets among asset classes and the underlying funds may hurt performance.
The fund invests in underlying funds and indirectly bears expenses related to the underlying funds. However, the Investment Manager has contractually agreed to waive fees, reimburse expenses of, or reimburse the fund through at least December 30, 2027 in an amount equal to the fund’s acquired fund fees and expenses (i.e., the fees and expenses incurred by the fund as a result of its investments in the underlying funds). The Investment Manager also has contractually agreed to waive fees and/or reimburse expenses of each class of shares of the fund through at least December 30, 2027 in an amount sufficient to result in total annual fund operating expenses for class A, C, R, R3, R4, R5, R6 and Y shares of the fund (exclusive of certain fees and expenses, including distribution fees (12b-1 fees)) that equal 0.55%, 0.55%, 0.70%, 0.70%, 0.70%, 0.55%, 0.45%, and 0.55%, respectively, of the fund’s average net assets. Although the Investment Manager serves as the investment adviser of the underlying funds, an underlying fund may change its investment program or policies without the fund’s approval, which could require the fund to reduce or eliminate its allocation to the underlying fund at an unfavorable time.
The fund also bears the following risks associated with the underlying funds:
Certain accounts or affiliates of the Investment Manager, including other funds advised by the Investment Manager or third parties, may from time to time own (beneficially or of record) or control a substantial amount of the fund’s shares, including through seed capital arrangements. Such shareholders may at times be considered to control the fund. Dispositions of a large number of shares by these shareholders may adversely affect the fund’s liquidity and net assets. These redemptions may also force the fund to sell securities, which may increase the fund’s brokerage costs.
There is no guarantee that the investment techniques, analyses, or judgments that we apply in making investment decisions for the underlying funds will produce the intended outcome or that the investments we select for the underlying funds will perform as well as other securities that were not selected for the underlying funds. We, or the underlying funds’ other service providers, may experience disruptions or
operating errors that could negatively impact the underlying funds. If the quantitative models or data that are used in managing an underlying fund prove to be incorrect or incomplete, investment decisions made in reliance on the models or data may not produce the desired results and the fund may realize losses.
An underlying fund’s allocation of assets among asset classes may hurt performance. The value of investments in the underlying funds’ portfolios may fall or fail to rise over extended periods of time for a variety of reasons, including general economic, political or financial market conditions, investor sentiment and market perceptions, government actions, geopolitical events or changes, outbreaks of infectious illnesses or other widespread public health issues, and factors related to a specific issuer, asset class, geography, industry or sector. These and other factors may lead to increased volatility and reduced liquidity in the underlying funds’ portfolio holdings, may negatively impact an underlying fund’s performance, and may exacerbate other risks to which an underlying fund is subject. Growth stocks may be more susceptible to earnings disappointments, and value stocks may fail to rebound. These risks are generally greater for small and midsize companies.
Fixed income investments are subject to interest rate risk, which is the risk that the value of the underlying funds’ fixed income investments is likely to fall if interest rates rise. Fixed income investments also are subject to credit risk, which is the risk that the issuers of the underlying funds’ fixed income investments may default on payment of interest or principal. Fixed income investments may be more susceptible to downgrades or defaults during economic downturns or other periods of economic stress. Interest rate risk is generally greater for longer-term bonds, and credit risk is generally greater for below-investment-grade bonds (sometimes referred to as “junk bonds”), which can be more sensitive to changes in markets, credit conditions, and interest rates and may be considered speculative. Default risk is generally higher for non-qualified mortgages. Mortgage-backed investments, unlike traditional debt investments, are also subject to prepayment risk, which means that they may increase in value less than other bonds when interest rates decline and decline in value more than other bonds when interest rates rise. The underlying funds may have to invest the proceeds from prepaid investments, including mortgage- and asset-backed investments, in other investments with less attractive terms and yields.
The value of international investments traded in foreign currencies may be adversely impacted by fluctuations in exchange rates. International investments, particularly investments in emerging markets, may carry risks associated with potentially less stable economies or governments (such as the risk of seizure by a foreign government, the imposition of currency or other restrictions, or high levels of inflation), and may be or become illiquid.
Putnam Dynamic Asset Allocation Equity Fund and Putnam Short Term Investment Fund may use, and each other underlying fund typically uses to a significant extent, derivatives, such as futures, options, swap contracts, and, for each underlying fund other than Putnam Short Term Investment Fund, certain foreign currency transactions and warrants, for both hedging and investment purposes (although, in
the case of Putnam Short Term Investment Fund, they do not represent a primary focus of the fund). Underlying funds that use derivatives to increase investment exposure may be riskier than underlying funds that do not employ investment leverage. The value of derivatives may move in unexpected ways due to unanticipated market movements, the use of leverage, imperfect correlation between the derivative instrument and the reference asset, or other factors, especially in unusual market conditions, and volatility in the value of derivatives could adversely impact the underlying fund’s returns, obligations and exposures. Derivatives are also subject to other risks, including liquidity risk (e.g., liquidity demands arising from the requirement to make payments to a derivative counterparty), operational risk (e.g., settlement issues or system failures), and legal risk (e.g., insufficient legal documentation or contract enforceability issues). Derivatives also involve the risk that an underlying fund may be unable to terminate or sell derivative positions when it wants to and that the other party to the instrument may fail to meet its obligations. The risk of a party failing to meet its obligations may increase if the underlying fund has significant investment exposure to that counterparty.
The fund may not achieve its goal, and it is not intended to be a complete investment program. An investment in the fund is not insured or guaranteed by the Federal Deposit Insurance Corporation or any other government agency.
The performance information below gives some indication of the risks associated with an investment in the fund by showing the fund’s performance year to year and over time. The bar chart does not reflect the impact of sales charges. If it did, performance would be lower. Please remember that past performance is not necessarily an indication of future results. Monthly performance figures for the fund are available at www.franklintempleton.com.
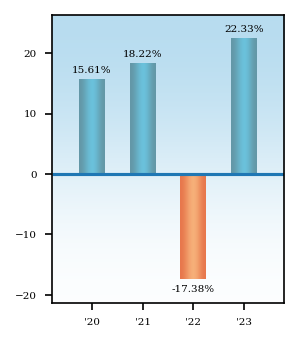
Average Annual Total Returns - Putnam Retirement Advantage 2050 Fund |
1 Year |
Since Inception |
Inception Date |
||
|---|---|---|---|---|---|
| Class A 2050 | 15.30% | [1] | 6.82% | [1] | Dec. 31, 2019 |
| Class A 2050 | After Taxes on Distributions | 13.66% | [1] | 4.18% | [1] | Dec. 31, 2019 |
| Class A 2050 | After Taxes on Distributions and Sales | 9.72% | [1] | 4.58% | [1] | Dec. 31, 2019 |
| Class C 2050 | 20.35% | [1] | 7.62% | [1] | Dec. 31, 2019 |
| Class R 2050 | 21.84% | [1] | 7.98% | [1] | Dec. 31, 2019 |
| Class R3 2050 | 22.11% | [1] | 8.25% | [1] | Dec. 31, 2019 |
| Class R4 2050 | 22.44% | [1] | 8.50% | [1] | Dec. 31, 2019 |
| Class R5 2050 | 22.56% | [1] | 8.65% | [1] | Dec. 31, 2019 |
| Class R6 2050 | 22.78% | 8.79% | Dec. 31, 2019 | ||
| Class Y 2050 | 22.54% | [1] | 8.65% | [1] | Dec. 31, 2019 |
| Russell 3000 Index (no deduction for fees, expenses or taxes) | 25.96% | [2] | 8.80% | [2] | Dec. 31, 2019 |
| Bloomberg U.S. Aggregate Index (no deduction for fees, expenses or taxes) | 5.53% | [2] | (3.26%) | [2] | Dec. 31, 2019 |
| S&P Target Date To 2050 Index (no deduction for fees, expenses or taxes) | 20.21% | [2] | 7.69% | [2] | Dec. 31, 2019 |
| [1] | Performance for classes A, C, R, R3, R4, R5, and Y shares prior to their inception (9/1/20) is derived from the historical performance of class R6 shares, adjusted for the higher operating expenses and, for class A and C shares, higher sales charges (in the case of after sales-charge returns) applicable to such classes. |
| [2] | The table above compares the fund’s returns to the performance of three indexes: (i) Russell 3000 Index, a broad measure of market performance; (ii) Bloomberg U.S. Aggregate Index, also a broad measure of market performance; and (iii) S&P Target Date To 2050 Index, an additional index that the Investment Manager believes more closely reflect the fund’s principal investment objective and strategies. |
| After-tax returns reflect the historical highest individual federal marginal income tax rates and do not reflect state and local taxes. Actual after-tax returns depend on an investor’s tax situation and may differ from those shown. After-tax returns are shown for class A shares only and will vary for other classes. These after-tax returns do not apply if you hold your fund shares through a 401(k) plan, an IRA, or another tax-advantaged arrangement. |
Putnam Retirement Advantage 2045 Fund seeks capital appreciation and current income consistent with a decreasing emphasis on capital appreciation and an increasing emphasis on current income as it approaches its target date.
The following tables describe the fees and expenses you may pay if you buy, hold and sell shares of the fund. You may pay other fees, such as brokerage commissions and other fees to financial intermediaries, which are not reflected in the tables and examples below. You may qualify for sales charge discounts if you and your family invest, or agree to invest in the future, at least $50,000 in Putnam funds. More information about these and other discounts is available from your financial professional and in How do I buy fund shares? beginning on page 102 of the fund’s prospectus, in Appendix A to the fund’s prospectus, and in How to buy shares beginning on page II-1 of the fund’s statement of additional information (“SAI”).
Shareholder Fees - Putnam Retirement Advantage 2045 Fund |
Class A 2045 |
Class C 2045 |
Class R 2045 |
Class R3 2045 |
Class R4 2045 |
Class R5 2045 |
Class R6 2045 |
Class Y 2045 |
||
|---|---|---|---|---|---|---|---|---|---|---|
| Maximum Sales Charge Imposed on Purchases (as a percentage of Offering Price) | 5.75% | none | none | none | none | none | none | none | ||
| Maximum Deferred Sales Charge (as a percentage) | 1.00% | [1] | 1.00% | [2] | none | none | none | none | none | none |
| [1] | Applies only to certain redemptions of shares bought with no initial sales charge. |
| [2] | This charge is eliminated after one year. |
Annual Fund Operating Expenses - Putnam Retirement Advantage 2045 Fund |
Class A 2045 |
Class C 2045 |
Class R 2045 |
Class R3 2045 |
Class R4 2045 |
Class R5 2045 |
Class R6 2045 |
Class Y 2045 |
|
|---|---|---|---|---|---|---|---|---|---|
| Management Fees (as a percentage of Assets) | 0.41% | 0.41% | 0.41% | 0.41% | 0.41% | 0.41% | 0.41% | 0.41% | |
| Distribution and Service (12b-1) Fees | 0.25% | 1.00% | 0.50% | 0.25% | none | none | none | none | |
| Other Expenses (as a percentage of Assets): | 1.03% | 1.03% | 1.18% | 1.18% | 1.18% | 1.03% | 0.93% | 1.03% | |
| Acquired Fund Fees and Expenses | 0.62% | 0.62% | 0.62% | 0.62% | 0.62% | 0.62% | 0.62% | 0.62% | |
| Expenses (as a percentage of Assets) | 2.31% | 3.06% | 2.71% | 2.46% | 2.21% | 2.06% | 1.96% | 2.06% | |
| Fee Waiver or Reimbursement | [1] | (1.51%) | (1.51%) | (1.51%) | (1.51%) | (1.51%) | (1.51%) | (1.51%) | (1.51%) |
| Net Expenses (as a percentage of Assets) | 0.80% | 1.55% | 1.20% | 0.95% | 0.70% | 0.55% | 0.45% | 0.55% | |
| [1] | Reflects the Investment Manager’s (as defined below) contractual obligation to limit certain fund expenses through at least December 30, 2027. This obligation may be modified or discontinued only with approval of the Board of Trustees. |
The following hypothetical example is intended to help you compare the cost of investing in the fund with the cost of investing in other funds. It assumes that you invest $10,000 in the fund for the time periods indicated and then, except as indicated, redeem all your shares at the end of those periods. It assumes a 5% return on your investment each year and that the fund’s operating expenses remain the same. The example takes into account the expense reimbursement described above for the 1- and 3-year periods. Your actual costs may be higher or lower.
Expense Example - Putnam Retirement Advantage 2045 Fund - USD ($) |
Expense Example, with Redemption, 1 Year |
Expense Example, with Redemption, 3 Years |
Expense Example, with Redemption, 5 Years |
Expense Example, with Redemption, 10 Years |
Expense Example, No Redemption, 1 Year |
Expense Example, No Redemption, 3 Years |
Expense Example, No Redemption, 5 Years |
Expense Example, No Redemption, 10 Years |
|---|---|---|---|---|---|---|---|---|
| Class A 2045 | 652 | 816 | 1,322 | 2,711 | ||||
| Class C 2045 | 258 | 490 | 1,180 | 2,846 | 158 | 490 | 1,180 | 2,846 |
| Class R 2045 | 122 | 381 | 1,001 | 2,680 | ||||
| Class R3 2045 | 97 | 303 | 871 | 2,423 | ||||
| Class R4 2045 | 72 | 224 | 739 | 2,160 | ||||
| Class R5 2045 | 56 | 176 | 660 | 1,998 | ||||
| Class R6 2045 | 46 | 144 | 606 | 1,889 | ||||
| Class Y 2045 | 56 | 176 | 660 | 1,998 |
The fund pays transaction-related costs, such as commissions, when it buys and sells securities (or “turns over” its portfolio). A higher turnover rate may indicate higher transaction costs and may result in higher taxes when the fund’s shares are held in a taxable account. These costs, which are not reflected in annual fund operating
expenses or the above example, affect fund performance. The fund’s turnover rate in the most recent fiscal year was 22%.
Investments
The fund’s asset allocation strategy may be attractive to investors who plan to retire or otherwise intend to begin making periodic withdrawals of their investments in or about 2045 (the target date). The fund is designed to provide diversification among different asset classes by investing its assets in other Putnam mutual funds, referred to as underlying funds.
The fund’s target allocations among asset classes and underlying funds will increasingly emphasize capital preservation and income over time and will change gradually based on the number of remaining years until the fund’s target date, as shown in the predetermined “glide path” in the chart under “What are the funds’ and each underlying fund’s main investment strategies and related risks?”. Franklin Advisers, Inc. (“Franklin Advisers” or the “Investment Manager”) adjusts these allocations at the end of each calendar quarter based on the glide path.
The following table presents your fund’s approximate allocations to each asset class and underlying fund as of December 31, 2024 and its projected approximate allocations to these asset classes and underlying funds as of December 31, 2025. By comparing the percentage allocations of your fund in the table, you can see how its allocations are expected to change during the one-year period beginning on December 31, 2024.
The table also shows the approximate allocations of other Putnam Retirement Advantage Funds, which are designed for investors with different target retirement dates. Over a five-year period, each fund’s allocations will gradually change to resemble the allocations of the fund with the next earliest target date. The table illustrates how a fund’s allocations are expected to change over time to increasingly emphasize capital preservation and income.
| Underlying Fund* | Year | 2065 | 2060 | 2055 | 2050 | 2045 (your fund) | 2040 | 2035 | 2030 | 2025 | Maturity Fund |
| Putnam Dynamic Asset Allocation Equity Fund | 2024 | 78.0% | 62.8% | 39.0% | 15.2% | 0.0% | 0.0% | 0.0% | 0.0% | 0.0% | 0.0% |
| 2025 | 78.0% | 59.9% | 35.2% | 12.2% | 0.0% | 0.0% | 0.0% | 0.0% | 0.0% | 0.0% | |
| Putnam Dynamic Asset Allocation Growth Fund | 2024 | 21.5% | 36.7% | 60.5% | 83.8% | 92.7% | 51.8% | 0.0% | 0.0% | 0.0% | 0.0% |
| 2025 | 21.5% | 39.6% | 64.3% | 86.6% | 89.5% | 44.8% | 0.0% | 0.0% | 0.0% | 0.0% | |
| Putnam Dynamic Asset Allocation Balanced Fund | 2024 | 0.0% | 0.0% | 0.0% | 0.0% | 4.8% | 44.8% | 92.9% | 30.1% | 2.5% | 0.0% |
| 2025 | 0.0% | 0.0% | 0.0% | 0.0% | 7.8% | 51.7% | 87.1% | 19.7% | 0.6% | 0.0% | |
| Putnam Dynamic Asset Allocation Conservative Fund | 2024 | 0.0% | 0.0% | 0.0% | 0.0% | 0.0% | 0.0% | 1.1% | 47.9% | 9.8% | 0.0% |
| 2025 | 0.0% | 0.0% | 0.0% | 0.0% | 0.0% | 0.0% | 4.0% | 56.0% | 2.5% | 0.0% | |
| Putnam Short Term Investment Fund | 2024 | 0.5% | 0.5% | 0.5% | 1.0% | 2.5% | 3.4% | 4.5% | 5.8% | 6.0% | 6.0% |
| 2025 | 0.5% | 0.5% | 0.5% | 1.2% | 2.7% | 3.5% | 4.7% | 6.0% | 6.0% | 6.0% | |
| Putnam Multi-Asset Income Fund | 2024 | 0.0% | 0.0% | 0.0% | 0.0% | 0.0% | 0.0% | 1.5% | 16.2% | 81.7% | 94.0% |
| 2025 | 0.0% | 0.0% | 0.0% | 0.0% | 0.0% | 0.0% | 4.2% | 18.3% | 90.9% | 94.0% | |
| Equity** | 2024 | 95.2% | 92.2% | 87.4% | 82.2% | 77.0% | 68.3% | 56.5% | 36.8% | 26.5% | 25.4% |
| 2025 | 95.2% | 91.6% | 86.6% | 81.5% | 76.3% | 66.9% | 54.6% | 33.6% | 25.7% | 25.4% | |
| Fixed Income** | 2024 | 4.8% | 7.8% | 12.6% | 17.8% | 23.0% | 31.7% | 43.5% | 63.2% | 73.5% | 74.6% |
| 2025 | 4.8% | 8.4% | 13.4% | 18.5% | 23.7% | 33.1% | 45.4% | 66.4% | 74.3% | 74.6% |
| * | Due to rounding, allocations shown in the table above may not total 100%. In addition, because of rounding in the calculation of allocations among underlying funds and market fluctuations, actual allocations might be more or less than these percentages. |
| ** | Equity and fixed income allocations are hypothetical estimates based on each Putnam Dynamic Asset Allocation Fund’s and Putnam Multi-Asset Income Fund’s current strategic allocation to equity and fixed income investments as set forth under “What are the funds’ and each underlying fund’s main investment strategies and related risks?”, and an assumption that Putnam Short Term Investment Fund is equivalent to a fixed income investment. The managers of the underlying funds may adjust those funds’ allocations among asset classes from time to time consistent with their investment goals, and, consequently, actual allocations will vary. |
The fund’s target allocations may differ from the allocations shown in the table. We may change the glide path, the fund’s target allocations, and the underlying funds in which it invests at any time, although we expect these changes to be infrequent and generally in response to longer-term structural changes (i.e., in the average retirement age or life expectancy) that lead the fund’s portfolio managers to determine that a change is advisable. We assume investors will begin gradual withdrawals from the
fund at or around the target date. Near the end of the target date year, the fund’s target allocations will correspond to those of Putnam Retirement Advantage Maturity Fund (Maturity Fund), a fund that seeks as high a rate of current income as the Investment Manager believes is consistent with preservation of capital, and the fund will be merged into Maturity Fund. More information about Maturity Fund is available in this prospectus beginning on page 74, and more information about the underlying funds (which are not offered by this prospectus) is included under “What are the funds’ and each underlying fund’s main investment strategies and related risks?”.
It is important to understand that you can lose money by investing in the fund. Losses may occur near, at or after the target date. There is no guarantee that the fund will provide adequate income at and through an investor’s retirement.
The fund’s allocation of assets among asset classes and the underlying funds may hurt performance.
The fund invests in underlying funds and indirectly bears expenses related to the underlying funds. However, the Investment Manager has contractually agreed to waive fees, reimburse expenses of, or reimburse the fund through at least December 30, 2027 in an amount equal to the fund’s acquired fund fees and expenses (i.e., the fees and expenses incurred by the fund as a result of its investments in the underlying funds). The Investment Manager also has contractually agreed to waive fees and/or reimburse expenses of each class of shares of the fund through at least December 30, 2027 in an amount sufficient to result in total annual fund operating expenses for class A, C, R, R3, R4, R5, R6 and Y shares of the fund (exclusive of certain fees and expenses, including distribution fees (12b-1 fees)) that equal 0.55%, 0.55%, 0.70%, 0.70%, 0.70%, 0.55%, 0.45%, and 0.55%, respectively, of the fund’s average net assets. Although the Investment Manager serves as the investment adviser of the underlying funds, an underlying fund may change its investment program or policies without the fund’s approval, which could require the fund to reduce or eliminate its allocation to the underlying fund at an unfavorable time.
The fund also bears the following risks associated with the underlying funds:
Certain accounts or affiliates of the Investment Manager, including other funds advised by the Investment Manager or third parties, may from time to time own (beneficially or of record) or control a substantial amount of the fund’s shares, including through seed capital arrangements. Such shareholders may at times be considered to control the fund. Dispositions of a large number of shares by these shareholders may adversely affect the fund’s liquidity and net assets. These redemptions may also force the fund to sell securities, which may increase the fund’s brokerage costs.
There is no guarantee that the investment techniques, analyses, or judgments that we apply in making investment decisions for the underlying funds will produce the intended outcome or that the investments we select for the underlying funds will perform as well as other securities that were not selected for the underlying funds. We, or the underlying funds’ other service providers, may experience disruptions or
operating errors that could negatively impact the underlying funds. If the quantitative models or data that are used in managing an underlying fund prove to be incorrect or incomplete, investment decisions made in reliance on the models or data may not produce the desired results and the fund may realize losses.
An underlying fund’s allocation of assets among asset classes may hurt performance. The value of investments in the underlying funds’ portfolios may fall or fail to rise over extended periods of time for a variety of reasons, including general economic, political or financial market conditions, investor sentiment and market perceptions, government actions, geopolitical events or changes, outbreaks of infectious illnesses or other widespread public health issues, and factors related to a specific issuer, asset class, geography, industry or sector. These and other factors may lead to increased volatility and reduced liquidity in the underlying funds’ portfolio holdings, may negatively impact an underlying fund’s performance, and may exacerbate other risks to which an underlying fund is subject. Growth stocks may be more susceptible to earnings disappointments, and value stocks may fail to rebound. These risks are generally greater for small and midsize companies.
Fixed income investments are subject to interest rate risk, which is the risk that the value of the underlying funds’ fixed income investments is likely to fall if interest rates rise. Fixed income investments also are subject to credit risk, which is the risk that the issuers of the underlying funds’ fixed income investments may default on payment of interest or principal. Fixed income investments may be more susceptible to downgrades or defaults during economic downturns or other periods of economic stress. Interest rate risk is generally greater for longer-term bonds, and credit risk is generally greater for below-investment-grade bonds (sometimes referred to as “junk bonds”), which can be more sensitive to changes in markets, credit conditions, and interest rates and may be considered speculative. Default risk is generally higher for non-qualified mortgages. Mortgage-backed investments, unlike traditional debt investments, are also subject to prepayment risk, which means that they may increase in value less than other bonds when interest rates decline and decline in value more than other bonds when interest rates rise. The underlying funds may have to invest the proceeds from prepaid investments, including mortgage- and asset-backed investments, in other investments with less attractive terms and yields.
The value of international investments traded in foreign currencies may be adversely impacted by fluctuations in exchange rates. International investments, particularly investments in emerging markets, may carry risks associated with potentially less stable economies or governments (such as the risk of seizure by a foreign government, the imposition of currency or other restrictions, or high levels of inflation), and may be or become illiquid.
Putnam Dynamic Asset Allocation Equity Fund and Putnam Short Term Investment Fund may use, and each other underlying fund typically uses to a significant extent, derivatives, such as futures, options, swap contracts, and, for each underlying fund other than Putnam Short Term Investment Fund, certain foreign currency transactions and warrants, for both hedging and investment purposes (although, in
the case of Putnam Short Term Investment Fund, they do not represent a primary focus of the fund). Underlying funds that use derivatives to increase investment exposure may be riskier than underlying funds that do not employ investment leverage. The value of derivatives may move in unexpected ways due to unanticipated market movements, the use of leverage, imperfect correlation between the derivative instrument and the reference asset, or other factors, especially in unusual market conditions, and volatility in the value of derivatives could adversely impact the underlying fund’s returns, obligations and exposures. Derivatives are also subject to other risks, including liquidity risk (e.g., liquidity demands arising from the requirement to make payments to a derivative counterparty), operational risk (e.g., settlement issues or system failures), and legal risk (e.g., insufficient legal documentation or contract enforceability issues). Derivatives also involve the risk that an underlying fund may be unable to terminate or sell derivative positions when it wants to and that the other party to the instrument may fail to meet its obligations. The risk of a party failing to meet its obligations may increase if the underlying fund has significant investment exposure to that counterparty.
The fund may not achieve its goal, and it is not intended to be a complete investment program. An investment in the fund is not insured or guaranteed by the Federal Deposit Insurance Corporation or any other government agency.
The performance information below gives some indication of the risks associated with an investment in the fund by showing the fund’s performance year to year and over time. The bar chart does not reflect the impact of sales charges. If it did, performance would be lower. Please remember that past performance is not necessarily an indication of future results. Monthly performance figures for the fund are available at www.franklintempleton.com.
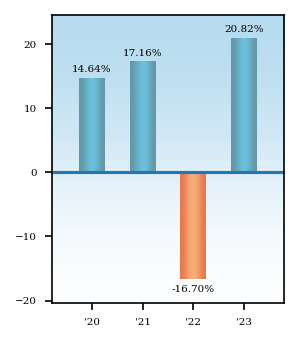
Average Annual Total Returns - Putnam Retirement Advantage 2045 Fund |
1 Year |
Since Inception |
Inception Date |
||
|---|---|---|---|---|---|
| Class A 2045 | 13.87% | [1] | 6.24% | [1] | Dec. 31, 2019 |
| Class A 2045 | After Taxes on Distributions | 12.93% | [1] | 4.02% | [1] | Dec. 31, 2019 |
| Class A 2045 | After Taxes on Distributions and Sales | 8.42% | [1] | 4.28% | [1] | Dec. 31, 2019 |
| Class C 2045 | 18.97% | [1] | 7.02% | [1] | Dec. 31, 2019 |
| Class R 2045 | 20.40% | [1] | 7.39% | [1] | Dec. 31, 2019 |
| Class R3 2045 | 20.78% | [1] | 7.68% | [1] | Dec. 31, 2019 |
| Class R4 2045 | 21.07% | [1] | 7.92% | [1] | Dec. 31, 2019 |
| Class R5 2045 | 21.22% | [1] | 8.08% | [1] | Dec. 31, 2019 |
| Class R6 2045 | 21.33% | 8.19% | Dec. 31, 2019 | ||
| Class Y 2045 | 21.14% | [1] | 8.06% | [1] | Dec. 31, 2019 |
| Russell 3000 Index (no deduction for fees, expenses or taxes) | 25.96% | [2] | 8.80% | [2] | Dec. 31, 2019 |
| Bloomberg U.S. Aggregate Index (no deduction for fees, expenses or taxes) | 5.53% | [2] | (3.26%) | [2] | Dec. 31, 2019 |
| S&P Target Date To 2045 Index (no deduction for fees, expenses or taxes) | 19.57% | [2] | 7.33% | [2] | Dec. 31, 2019 |
| [1] | Performance for classes A, C, R, R3, R4, R5, and Y shares prior to their inception (9/1/20) is derived from the historical performance of class R6 shares, adjusted for the higher operating expenses and, for class A and C shares, higher sales charges (in the case of after sales-charge returns) applicable to such classes. |
| [2] | The table above compares the fund’s returns to the performance of three indexes: (i) Russell 3000 Index, a broad measure of market performance; (ii) Bloomberg U.S. Aggregate Index, also a broad measure of market performance; and (iii) S&P Target Date To 2045 Index, an additional index that the Investment Manager believes more closely reflect the fund’s principal investment objective and strategies. |
| After-tax returns reflect the historical highest individual federal marginal income tax rates and do not reflect state and local taxes. Actual after-tax returns depend on an investor’s tax situation and may differ from those shown. After-tax returns are shown for class A shares only and will vary for other classes. These after-tax returns do not apply if you hold your fund shares through a 401(k) plan, an IRA, or another tax-advantaged arrangement. |
Putnam Retirement Advantage 2040 Fund seeks capital appreciation and current income consistent with a decreasing emphasis on capital appreciation and an increasing emphasis on current income as it approaches its target date.
The following tables describe the fees and expenses you may pay if you buy, hold and sell shares of the fund. You may pay other fees, such as brokerage commissions and other fees to financial intermediaries, which are not reflected in the tables and examples below. You may qualify for sales charge discounts if you and your family invest, or agree to invest in the future, at least $50,000 in Putnam funds. More information about these and other discounts is available from your financial professional and in How do I buy fund shares? beginning on page 102 of the fund’s prospectus, in Appendix A to the fund’s prospectus, and in How to buy shares beginning on page II-1 of the fund’s statement of additional information (“SAI”).
Shareholder Fees - Putnam Retirement Advantage 2040 Fund |
Class A 2040 |
Class C 2040 |
Class R 2040 |
Class R3 2040 |
Class R4 2040 |
Class R5 2040 |
Class R6 2040 |
Class Y 2040 |
||
|---|---|---|---|---|---|---|---|---|---|---|
| Maximum Sales Charge Imposed on Purchases (as a percentage of Offering Price) | 5.75% | none | none | none | none | none | none | none | ||
| Maximum Deferred Sales Charge (as a percentage) | 1.00% | [1] | 1.00% | [2] | none | none | none | none | none | none |
| [1] | Applies only to certain redemptions of shares bought with no initial sales charge. |
| [2] | This charge is eliminated after one year. |
Annual Fund Operating Expenses - Putnam Retirement Advantage 2040 Fund |
Class A 2040 |
Class C 2040 |
Class R 2040 |
Class R3 2040 |
Class R4 2040 |
Class R5 2040 |
Class R6 2040 |
Class Y 2040 |
|
|---|---|---|---|---|---|---|---|---|---|
| Management Fees (as a percentage of Assets) | 0.40% | 0.40% | 0.40% | 0.40% | 0.40% | 0.40% | 0.40% | 0.40% | |
| Distribution and Service (12b-1) Fees | 0.25% | 1.00% | 0.50% | 0.25% | none | none | none | none | |
| Other Expenses (as a percentage of Assets): | 0.95% | 0.95% | 1.10% | 1.10% | 1.10% | 0.95% | 0.85% | 0.95% | |
| Acquired Fund Fees and Expenses | 0.59% | 0.59% | 0.59% | 0.59% | 0.59% | 0.59% | 0.59% | 0.59% | |
| Expenses (as a percentage of Assets) | 2.19% | 2.94% | 2.59% | 2.34% | 2.09% | 1.94% | 1.84% | 1.94% | |
| Fee Waiver or Reimbursement | [1] | (1.39%) | (1.39%) | (1.39%) | (1.39%) | (1.39%) | (1.39%) | (1.39%) | (1.39%) |
| Net Expenses (as a percentage of Assets) | 0.80% | 1.55% | 1.20% | 0.95% | 0.70% | 0.55% | 0.45% | 0.55% | |
| [1] | Reflects the Investment Manager’s (as defined below) contractual obligation to limit certain fund expenses through at least December 30, 2027. This obligation may be modified or discontinued only with approval of the Board of Trustees. |
The following hypothetical example is intended to help you compare the cost of investing in the fund with the cost of investing in other funds. It assumes that you invest $10,000 in the fund for the time periods indicated and then, except as indicated, redeem all your shares at the end of those periods. It assumes a 5% return on your investment each year and that the fund’s operating expenses remain the same. The example takes into account the expense reimbursement described above for the 1- and 3-year periods. Your actual costs may be higher or lower.
Expense Example - Putnam Retirement Advantage 2040 Fund - USD ($) |
Expense Example, with Redemption, 1 Year |
Expense Example, with Redemption, 3 Years |
Expense Example, with Redemption, 5 Years |
Expense Example, with Redemption, 10 Years |
Expense Example, No Redemption, 1 Year |
Expense Example, No Redemption, 3 Years |
Expense Example, No Redemption, 5 Years |
Expense Example, No Redemption, 10 Years |
|---|---|---|---|---|---|---|---|---|
| Class A 2040 | 652 | 816 | 1,296 | 2,620 | ||||
| Class C 2040 | 258 | 490 | 1,154 | 2,755 | 158 | 490 | 1,154 | 2,755 |
| Class R 2040 | 122 | 381 | 974 | 2,587 | ||||
| Class R3 2040 | 97 | 303 | 844 | 2,328 | ||||
| Class R4 2040 | 72 | 224 | 712 | 2,062 | ||||
| Class R5 2040 | 56 | 176 | 632 | 1,899 | ||||
| Class R6 2040 | 46 | 144 | 578 | 1,789 | ||||
| Class Y 2040 | 56 | 176 | 632 | 1,899 |
The fund pays transaction-related costs, such as commissions, when it buys and sells securities (or “turns over” its portfolio). A higher turnover rate may indicate higher transaction costs and may result in higher taxes when the fund’s shares are held in a taxable account. These costs, which are not reflected in annual fund operating
expenses or the above example, affect fund performance. The fund’s turnover rate in the most recent fiscal year was 29%.
Investments
The fund’s asset allocation strategy may be attractive to investors who plan to retire or otherwise intend to begin making periodic withdrawals of their investments in or about 2040 (the target date). The fund is designed to provide diversification among different asset classes by investing its assets in other Putnam mutual funds, referred to as underlying funds.
The fund’s target allocations among asset classes and underlying funds will increasingly emphasize capital preservation and income over time and will change gradually based on the number of remaining years until the fund’s target date, as shown in the predetermined “glide path” in the chart under “What are the funds’ and each underlying fund’s main investment strategies and related risks?”. Franklin Advisers, Inc. (“Franklin Advisers” or the “Investment Manager”) adjusts these allocations at the end of each calendar quarter based on the glide path.
The following table presents your fund’s approximate allocations to each asset class and underlying fund as of December 31, 2024 and its projected approximate allocations to these asset classes and underlying funds as of December 31, 2025. By comparing the percentage allocations of your fund in the table, you can see how its allocations are expected to change during the one-year period beginning on December 31, 2024.
The table also shows the approximate allocations of other Putnam Retirement Advantage Funds, which are designed for investors with different target retirement dates. Over a five-year period, each fund’s allocations will gradually change to resemble the allocations of the fund with the next earliest target date. The table illustrates how a fund’s allocations are expected to change over time to increasingly emphasize capital preservation and income.
| Underlying Fund* | Year | 2065 | 2060 | 2055 | 2050 | 2045 | 2040 (your fund) | 2035 | 2030 | 2025 | Maturity Fund |
| Putnam Dynamic Asset Allocation Equity Fund | 2024 | 78.0% | 62.8% | 39.0% | 15.2% | 0.0% | 0.0% | 0.0% | 0.0% | 0.0% | 0.0% |
| 2025 | 78.0% | 59.9% | 35.2% | 12.2% | 0.0% | 0.0% | 0.0% | 0.0% | 0.0% | 0.0% | |
| Putnam Dynamic Asset Allocation Growth Fund | 2024 | 21.5% | 36.7% | 60.5% | 83.8% | 92.7% | 51.8% | 0.0% | 0.0% | 0.0% | 0.0% |
| 2025 | 21.5% | 39.6% | 64.3% | 86.6% | 89.5% | 44.8% | 0.0% | 0.0% | 0.0% | 0.0% | |
| Putnam Dynamic Asset Allocation Balanced Fund | 2024 | 0.0% | 0.0% | 0.0% | 0.0% | 4.8% | 44.8% | 92.9% | 30.1% | 2.5% | 0.0% |
| 2025 | 0.0% | 0.0% | 0.0% | 0.0% | 7.8% | 51.7% | 87.1% | 19.7% | 0.6% | 0.0% | |
| Putnam Dynamic Asset Allocation Conservative Fund | 2024 | 0.0% | 0.0% | 0.0% | 0.0% | 0.0% | 0.0% | 1.1% | 47.9% | 9.8% | 0.0% |
| 2025 | 0.0% | 0.0% | 0.0% | 0.0% | 0.0% | 0.0% | 4.0% | 56.0% | 2.5% | 0.0% | |
| Putnam Short Term Investment Fund | 2024 | 0.5% | 0.5% | 0.5% | 1.0% | 2.5% | 3.4% | 4.5% | 5.8% | 6.0% | 6.0% |
| 2025 | 0.5% | 0.5% | 0.5% | 1.2% | 2.7% | 3.5% | 4.7% | 6.0% | 6.0% | 6.0% | |
| Putnam Multi-Asset Income Fund | 2024 | 0.0% | 0.0% | 0.0% | 0.0% | 0.0% | 0.0% | 1.5% | 16.2% | 81.7% | 94.0% |
| 2025 | 0.0% | 0.0% | 0.0% | 0.0% | 0.0% | 0.0% | 4.2% | 18.3% | 90.9% | 94.0% | |
| Equity** | 2024 | 95.2% | 92.2% | 87.4% | 82.2% | 77.0% | 68.3% | 56.5% | 36.8% | 26.5% | 25.4% |
| 2025 | 95.2% | 91.6% | 86.6% | 81.5% | 76.3% | 66.9% | 54.6% | 33.6% | 25.7% | 25.4% | |
| Fixed Income** | 2024 | 4.8% | 7.8% | 12.6% | 17.8% | 23.0% | 31.7% | 43.5% | 63.2% | 73.5% | 74.6% |
| 2025 | 4.8% | 8.4% | 13.4% | 18.5% | 23.7% | 33.1% | 45.4% | 66.4% | 74.3% | 74.6% |
| * | Due to rounding, allocations shown in the table above may not total 100%. In addition, because of rounding in the calculation of allocations among underlying funds and market fluctuations, actual allocations might be more or less than these percentages. |
| ** | Equity and fixed income allocations are hypothetical estimates based on each Putnam Dynamic Asset Allocation Fund’s and Putnam Multi-Asset Income Fund’s current strategic allocation to equity and fixed income investments as set forth under “What are the funds’ and each underlying fund’s main investment strategies and related risks?”, and an assumption that Putnam Short Term Investment Fund is equivalent to a fixed income investment. The managers of the underlying funds may adjust those funds’ allocations among asset classes from time to time consistent with their investment goals, and, consequently, actual allocations will vary. |
The fund’s target allocations may differ from the allocations shown in the table. We may change the glide path, the fund’s target allocations, and the underlying funds in which it invests at any time, although we expect these changes to be infrequent and generally in response to longer-term structural changes (i.e., in the average retirement age or life expectancy) that lead the fund’s portfolio managers to determine that a change is advisable. We assume investors will begin gradual withdrawals from the
fund at or around the target date. Near the end of the target date year, the fund’s target allocations will correspond to those of Putnam Retirement Advantage Maturity Fund (Maturity Fund), a fund that seeks as high a rate of current income as the Investment Manager believes is consistent with preservation of capital, and the fund will be merged into Maturity Fund. More information about Maturity Fund is available in this prospectus beginning on page 74, and more information about the underlying funds (which are not offered by this prospectus) is included under “What are the funds’ and each underlying fund’s main investment strategies and related risks?”.
It is important to understand that you can lose money by investing in the fund. Losses may occur near, at or after the target date. There is no guarantee that the fund will provide adequate income at and through an investor’s retirement.
The fund’s allocation of assets among asset classes and the underlying funds may hurt performance.
The fund invests in underlying funds and indirectly bears expenses related to the underlying funds. However, the Investment Manager has contractually agreed to waive fees, reimburse expenses of, or reimburse the fund through at least December 30, 2027 in an amount equal to the fund’s acquired fund fees and expenses (i.e., the fees and expenses incurred by the fund as a result of its investments in the underlying funds). The Investment Manager also has contractually agreed to waive fees and/or reimburse expenses of each class of shares of the fund through at least December 30, 2027 in an amount sufficient to result in total annual fund operating expenses for class A, C, R, R3, R4, R5, R6 and Y shares of the fund (exclusive of certain fees and expenses, including distribution fees (12b-1 fees)) that equal 0.55%, 0.55%, 0.70%, 0.70%, 0.70%, 0.55%, 0.45%, and 0.55%, respectively, of the fund’s average net assets. Although the Investment Manager serves as the investment adviser of the underlying funds, an underlying fund may change its investment program or policies without the fund’s approval, which could require the fund to reduce or eliminate its allocation to the underlying fund at an unfavorable time.
The fund also bears the following risks associated with the underlying funds:
Certain accounts or affiliates of the Investment Manager, including other funds advised by the Investment Manager or third parties, may from time to time own (beneficially or of record) or control a substantial amount of the fund’s shares, including through seed capital arrangements. Such shareholders may at times be considered to control the fund. Dispositions of a large number of shares by these shareholders may adversely affect the fund’s liquidity and net assets. These redemptions may also force the fund to sell securities, which may increase the fund’s brokerage costs.
There is no guarantee that the investment techniques, analyses, or judgments that we apply in making investment decisions for the underlying funds will produce the intended outcome or that the investments we select for the underlying funds will perform as well as other securities that were not selected for the underlying funds. We, or the underlying funds’ other service providers, may experience disruptions or
operating errors that could negatively impact the underlying funds. If the quantitative models or data that are used in managing an underlying fund prove to be incorrect or incomplete, investment decisions made in reliance on the models or data may not produce the desired results and the fund may realize losses.
An underlying fund’s allocation of assets among asset classes may hurt performance. The value of investments in the underlying funds’ portfolios may fall or fail to rise over extended periods of time for a variety of reasons, including general economic, political or financial market conditions, investor sentiment and market perceptions, government actions, geopolitical events or changes, outbreaks of infectious illnesses or other widespread public health issues, and factors related to a specific issuer, asset class, geography, industry or sector. These and other factors may lead to increased volatility and reduced liquidity in the underlying funds’ portfolio holdings, may negatively impact an underlying fund’s performance, and may exacerbate other risks to which an underlying fund is subject. Growth stocks may be more susceptible to earnings disappointments, and value stocks may fail to rebound. These risks are generally greater for small and midsize companies.
Fixed income investments are subject to interest rate risk, which is the risk that the value of the underlying funds’ fixed income investments is likely to fall if interest rates rise. Fixed income investments also are subject to credit risk, which is the risk that the issuers of the underlying funds’ fixed income investments may default on payment of interest or principal. Fixed income investments may be more susceptible to downgrades or defaults during economic downturns or other periods of economic stress. Interest rate risk is generally greater for longer-term bonds, and credit risk is generally greater for below-investment-grade bonds (sometimes referred to as “junk bonds”), which can be more sensitive to changes in markets, credit conditions, and interest rates and may be considered speculative. Default risk is generally higher for non-qualified mortgages. Mortgage-backed investments, unlike traditional debt investments, are also subject to prepayment risk, which means that they may increase in value less than other bonds when interest rates decline and decline in value more than other bonds when interest rates rise. The underlying funds may have to invest the proceeds from prepaid investments, including mortgage- and asset-backed investments, in other investments with less attractive terms and yields.
The value of international investments traded in foreign currencies may be adversely impacted by fluctuations in exchange rates. International investments, particularly investments in emerging markets, may carry risks associated with potentially less stable economies or governments (such as the risk of seizure by a foreign government, the imposition of currency or other restrictions, or high levels of inflation), and may be or become illiquid.
Putnam Dynamic Asset Allocation Equity Fund and Putnam Short Term Investment Fund may use, and each other underlying fund typically uses to a significant extent, derivatives, such as futures, options, swap contracts, and, for each underlying fund other than Putnam Short Term Investment Fund, certain foreign currency transactions and warrants, for both hedging and investment purposes (although, in
the case of Putnam Short Term Investment Fund, they do not represent a primary focus of the fund). Underlying funds that use derivatives to increase investment exposure may be riskier than underlying funds that do not employ investment leverage. The value of derivatives may move in unexpected ways due to unanticipated market movements, the use of leverage, imperfect correlation between the derivative instrument and the reference asset, or other factors, especially in unusual market conditions, and volatility in the value of derivatives could adversely impact the underlying fund’s returns, obligations and exposures. Derivatives are also subject to other risks, including liquidity risk (e.g., liquidity demands arising from the requirement to make payments to a derivative counterparty), operational risk (e.g., settlement issues or system failures), and legal risk (e.g., insufficient legal documentation or contract enforceability issues). Derivatives also involve the risk that an underlying fund may be unable to terminate or sell derivative positions when it wants to and that the other party to the instrument may fail to meet its obligations. The risk of a party failing to meet its obligations may increase if the underlying fund has significant investment exposure to that counterparty.
The fund may not achieve its goal, and it is not intended to be a complete investment program. An investment in the fund is not insured or guaranteed by the Federal Deposit Insurance Corporation or any other government agency.
The performance information below gives some indication of the risks associated with an investment in the fund by showing the fund’s performance year to year and over time. The bar chart does not reflect the impact of sales charges. If it did, performance would be lower. Please remember that past performance is not necessarily an indication of future results. Monthly performance figures for the fund are available at www.franklintempleton.com.
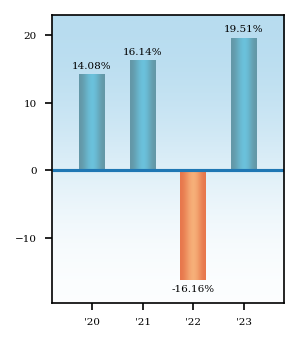
Average Annual Total Returns - Putnam Retirement Advantage 2040 Fund |
1 Year |
Since Inception |
Inception Date |
||
|---|---|---|---|---|---|
| Class A 2040 | 12.63% | [1] | 5.76% | [1] | Dec. 31, 2019 |
| Class A 2040 | After Taxes on Distributions | 11.48% | [1] | 3.47% | [1] | Dec. 31, 2019 |
| Class A 2040 | After Taxes on Distributions and Sales | 7.81% | [1] | 3.89% | [1] | Dec. 31, 2019 |
| Class C 2040 | 17.61% | [1] | 6.55% | [1] | Dec. 31, 2019 |
| Class R 2040 | 19.07% | [1] | 6.90% | [1] | Dec. 31, 2019 |
| Class R3 2040 | 19.46% | [1] | 7.19% | [1] | Dec. 31, 2019 |
| Class R4 2040 | 19.78% | [1] | 7.44% | [1] | Dec. 31, 2019 |
| Class R5 2040 | 19.89% | [1] | 7.59% | [1] | Dec. 31, 2019 |
| Class R6 2040 | 20.00% | 7.70% | Dec. 31, 2019 | ||
| Class Y 2040 | 19.81% | [1] | 7.57% | [1] | Dec. 31, 2019 |
| Russell 3000 Index (no deduction for fees, expenses or taxes) | 25.96% | [2] | 8.80% | [2] | Dec. 31, 2019 |
| Bloomberg U.S. Aggregate Index (no deduction for fees, expenses or taxes) | 5.53% | [2] | (3.26%) | [2] | Dec. 31, 2019 |
| S&P Target Date To 2040 Index (no deduction for fees, expenses or taxes) | 18.16% | [2] | 6.83% | [2] | Dec. 31, 2019 |
| [1] | Performance for classes A, C, R, R3, R4, R5, and Y shares prior to their inception (9/1/20) is derived from the historical performance of class R6 shares, adjusted for the higher operating expenses and, for class A and C shares, higher sales charges (in the case of after sales-charge returns) applicable to such classes. |
| [2] | The table above compares the fund’s returns to the performance of three indexes: (i) Russell 3000 Index, a broad measure of market performance; (ii) Bloomberg U.S. Aggregate Index, also a broad measure of market performance; and (iii) S&P Target Date To 2040 Index, an additional index that the Investment Manager believes more closely reflect the fund’s principal investment objective and strategies. |
| After-tax returns reflect the historical highest individual federal marginal income tax rates and do not reflect state and local taxes. Actual after-tax returns depend on an investor’s tax situation and may differ from those shown. After-tax returns are shown for class A shares only and will vary for other classes. These after-tax returns do not apply if you hold your fund shares through a 401(k) plan, an IRA, or another tax-advantaged arrangement. |
Putnam Retirement Advantage 2035 Fund seeks capital appreciation and current income consistent with a decreasing emphasis on capital appreciation and an increasing emphasis on current income as it approaches its target date.
The following tables describe the fees and expenses you may pay if you buy, hold and sell shares of the fund. You may pay other fees, such as brokerage commissions and other fees to financial intermediaries, which are not reflected in the tables and examples below. You may qualify for sales charge discounts if you and your family invest, or agree to invest in the future, at least $50,000 in Putnam funds. More information about these and other discounts is available from your financial professional and in How do I buy fund shares? beginning on page 102 of the fund’s prospectus, in Appendix A to the fund’s prospectus, and in How to buy shares beginning on page II-1 of the fund’s statement of additional information (“SAI”).
Shareholder Fees - Putnam Retirement Advantage 2035 Fund |
Class A 2035 |
Class C 2035 |
Class R 2035 |
Class R3 2035 |
Class R4 2035 |
Class R5 2035 |
Class R6 2035 |
Class Y 2035 |
||
|---|---|---|---|---|---|---|---|---|---|---|
| Maximum Sales Charge Imposed on Purchases (as a percentage of Offering Price) | 5.75% | none | none | none | none | none | none | none | ||
| Maximum Deferred Sales Charge (as a percentage) | 1.00% | [1] | 1.00% | [2] | none | none | none | none | none | none |
| [1] | Applies only to certain redemptions of shares bought with no initial sales charge. |
| [2] | This charge is eliminated after one year. |
Annual Fund Operating Expenses - Putnam Retirement Advantage 2035 Fund |
Class A 2035 |
Class C 2035 |
Class R 2035 |
Class R3 2035 |
Class R4 2035 |
Class R5 2035 |
Class R6 2035 |
Class Y 2035 |
|
|---|---|---|---|---|---|---|---|---|---|
| Management Fees (as a percentage of Assets) | 0.39% | 0.39% | 0.39% | 0.39% | 0.39% | 0.39% | 0.39% | 0.39% | |
| Distribution and Service (12b-1) Fees | 0.25% | 1.00% | 0.50% | 0.25% | none | none | none | none | |
| Other Expenses (as a percentage of Assets): | 0.80% | 0.80% | 0.95% | 0.95% | 0.95% | 0.80% | 0.70% | 0.80% | |
| Acquired Fund Fees and Expenses | 0.54% | 0.54% | 0.54% | 0.54% | 0.54% | 0.54% | 0.54% | 0.54% | |
| Expenses (as a percentage of Assets) | 1.98% | 2.73% | 2.38% | 2.13% | 1.88% | 1.73% | 1.63% | 1.73% | |
| Fee Waiver or Reimbursement | [1] | (1.18%) | (1.18%) | (1.18%) | (1.18%) | (1.18%) | (1.18%) | (1.18%) | (1.18%) |
| Net Expenses (as a percentage of Assets) | 0.80% | 1.55% | 1.20% | 0.95% | 0.70% | 0.55% | 0.45% | 0.55% | |
| [1] | Reflects the Investment Manager’s (as defined below) contractual obligation to limit certain fund expenses through at least December 30, 2027. This obligation may be modified or discontinued only with approval of the Board of Trustees. |
The following hypothetical example is intended to help you compare the cost of investing in the fund with the cost of investing in other funds. It assumes that you invest $10,000 in the fund for the time periods indicated and then, except as indicated, redeem all your shares at the end of those periods. It assumes a 5% return on your investment each year and that the fund’s operating expenses remain the same. The example takes into account the expense reimbursement described above for the 1- and 3-year periods. Your actual costs may be higher or lower.
Expense Example - Putnam Retirement Advantage 2035 Fund - USD ($) |
Expense Example, with Redemption, 1 Year |
Expense Example, with Redemption, 3 Years |
Expense Example, with Redemption, 5 Years |
Expense Example, with Redemption, 10 Years |
Expense Example, No Redemption, 1 Year |
Expense Example, No Redemption, 3 Years |
Expense Example, No Redemption, 5 Years |
Expense Example, No Redemption, 10 Years |
|---|---|---|---|---|---|---|---|---|
| Class A 2035 | 652 | 816 | 1,251 | 2,459 | ||||
| Class C 2035 | 258 | 490 | 1,108 | 2,594 | 158 | 490 | 1,108 | 2,594 |
| Class R 2035 | 122 | 381 | 927 | 2,424 | ||||
| Class R3 2035 | 97 | 303 | 796 | 2,160 | ||||
| Class R4 2035 | 72 | 224 | 664 | 1,890 | ||||
| Class R5 2035 | 56 | 176 | 584 | 1,724 | ||||
| Class R6 2035 | 46 | 144 | 530 | 1,612 | ||||
| Class Y 2035 | 56 | 176 | 584 | 1,724 |
The fund pays transaction-related costs, such as commissions, when it buys and sells securities (or “turns over” its portfolio). A higher turnover rate may indicate higher transaction costs and may result in higher taxes when the fund’s shares are held in a taxable account. These costs, which are not reflected in annual fund operating
expenses or the above example, affect fund performance. The fund’s turnover rate in the most recent fiscal year was 34%.
Investments
The fund’s asset allocation strategy may be attractive to investors who plan to retire or otherwise intend to begin making periodic withdrawals of their investments in or about 2035 (the target date). The fund is designed to provide diversification among different asset classes by investing its assets in other Putnam mutual funds, referred to as underlying funds.
The fund’s target allocations among asset classes and underlying funds will increasingly emphasize capital preservation and income over time and will change gradually based on the number of remaining years until the fund’s target date, as shown in the predetermined “glide path” in the chart under “What are the funds’ and each underlying fund’s main investment strategies and related risks?”. Franklin Advisers, Inc. (“Franklin Advisers” or the “Investment Manager”) adjusts these allocations at the end of each calendar quarter based on the glide path.
The following table presents your fund’s approximate allocations to each asset class and underlying fund as of December 31, 2024 and its projected approximate allocations to these asset classes and underlying funds as of December 31, 2025. By comparing the percentage allocations of your fund in the table, you can see how its allocations are expected to change during the one-year period beginning on December 31, 2024.
The table also shows the approximate allocations of other Putnam Retirement Advantage Funds, which are designed for investors with different target retirement dates. Over a five-year period, each fund’s allocations will gradually change to resemble the allocations of the fund with the next earliest target date. The table illustrates how a fund’s allocations are expected to change over time to increasingly emphasize capital preservation and income.
| Underlying Fund* | Year | 2065 | 2060 | 2055 | 2050 | 2045 | 2040 | 2035 (your fund) | 2030 | 2025 | Maturity Fund |
| Putnam Dynamic Asset Allocation Equity Fund | 2024 | 78.0% | 62.8% | 39.0% | 15.2% | 0.0% | 0.0% | 0.0% | 0.0% | 0.0% | 0.0% |
| 2025 | 78.0% | 59.9% | 35.2% | 12.2% | 0.0% | 0.0% | 0.0% | 0.0% | 0.0% | 0.0% | |
| Putnam Dynamic Asset Allocation Growth Fund | 2024 | 21.5% | 36.7% | 60.5% | 83.8% | 92.7% | 51.8% | 0.0% | 0.0% | 0.0% | 0.0% |
| 2025 | 21.5% | 39.6% | 64.3% | 86.6% | 89.5% | 44.8% | 0.0% | 0.0% | 0.0% | 0.0% | |
| Putnam Dynamic Asset Allocation Balanced Fund | 2024 | 0.0% | 0.0% | 0.0% | 0.0% | 4.8% | 44.8% | 92.9% | 30.1% | 2.5% | 0.0% |
| 2025 | 0.0% | 0.0% | 0.0% | 0.0% | 7.8% | 51.7% | 87.1% | 19.7% | 0.6% | 0.0% | |
| Putnam Dynamic Asset Allocation Conservative Fund | 2024 | 0.0% | 0.0% | 0.0% | 0.0% | 0.0% | 0.0% | 1.1% | 47.9% | 9.8% | 0.0% |
| 2025 | 0.0% | 0.0% | 0.0% | 0.0% | 0.0% | 0.0% | 4.0% | 56.0% | 2.5% | 0.0% | |
| Putnam Short Term Investment Fund | 2024 | 0.5% | 0.5% | 0.5% | 1.0% | 2.5% | 3.4% | 4.5% | 5.8% | 6.0% | 6.0% |
| 2025 | 0.5% | 0.5% | 0.5% | 1.2% | 2.7% | 3.5% | 4.7% | 6.0% | 6.0% | 6.0% | |
| Putnam Multi-Asset Income Fund | 2024 | 0.0% | 0.0% | 0.0% | 0.0% | 0.0% | 0.0% | 1.5% | 16.2% | 81.7% | 94.0% |
| 2025 | 0.0% | 0.0% | 0.0% | 0.0% | 0.0% | 0.0% | 4.2% | 18.3% | 90.9% | 94.0% | |
| Equity** | 2024 | 95.2% | 92.2% | 87.4% | 82.2% | 77.0% | 68.3% | 56.5% | 36.8% | 26.5% | 25.4% |
| 2025 | 95.2% | 91.6% | 86.6% | 81.5% | 76.3% | 66.9% | 54.6% | 33.6% | 25.7% | 25.4% | |
| Fixed Income** | 2024 | 4.8% | 7.8% | 12.6% | 17.8% | 23.0% | 31.7% | 43.5% | 63.2% | 73.5% | 74.6% |
| 2025 | 4.8% | 8.4% | 13.4% | 18.5% | 23.7% | 33.1% | 45.4% | 66.4% | 74.3% | 74.6% |
| * | Due to rounding, allocations shown in the table above may not total 100%. In addition, because of rounding in the calculation of allocations among underlying funds and market fluctuations, actual allocations might be more or less than these percentages. |
| ** | Equity and fixed income allocations are hypothetical estimates based on each Putnam Dynamic Asset Allocation Fund’s and Putnam Multi-Asset Income Fund’s current strategic allocation to equity and fixed income investments as set forth under “What are the funds’ and each underlying fund’s main investment strategies and related risks?”, and an assumption that Putnam Short Term Investment Fund is equivalent to a fixed income investment. The managers of the underlying funds may adjust those funds’ allocations among asset classes from time to time consistent with their investment goals, and, consequently, actual allocations will vary. |
The fund’s target allocations may differ from the allocations shown in the table. We may change the glide path, the fund’s target allocations, and the underlying funds in which it invests at any time, although we expect these changes to be infrequent and generally in response to longer-term structural changes (i.e., in the average retirement age or life expectancy) that lead the fund’s portfolio managers to determine that a change is advisable. We assume investors will begin gradual withdrawals from the
fund at or around the target date. Near the end of the target date year, the fund’s target allocations will correspond to those of Putnam Retirement Advantage Maturity Fund (Maturity Fund), a fund that seeks as high a rate of current income as the Investment Manager believes is consistent with preservation of capital, and the fund will be merged into Maturity Fund. More information about Maturity Fund is available in this prospectus beginning on page 74, and more information about the underlying funds (which are not offered by this prospectus) is included under “What are the funds’ and each underlying fund’s main investment strategies and related risks?”.
It is important to understand that you can lose money by investing in the fund. Losses may occur near, at or after the target date. There is no guarantee that the fund will provide adequate income at and through an investor’s retirement.
The fund’s allocation of assets among asset classes and the underlying funds may hurt performance.
The fund invests in underlying funds and indirectly bears expenses related to the underlying funds. However, the Investment Manager has contractually agreed to waive fees, reimburse expenses of, or reimburse the fund through at least December 30, 2027 in an amount equal to the fund’s acquired fund fees and expenses (i.e., the fees and expenses incurred by the fund as a result of its investments in the underlying funds). The Investment Manager also has contractually agreed to waive fees and/or reimburse expenses of each class of shares of the fund through at least December 30, 2027 in an amount sufficient to result in total annual fund operating expenses for class A, C, R, R3, R4, R5, R6 and Y shares of the fund (exclusive of certain fees and expenses, including distribution fees (12b-1 fees)) that equal 0.55%, 0.55%, 0.70%, 0.70%, 0.70%, 0.55%, 0.45%, and 0.55%, respectively, of the fund’s average net assets. Although the Investment Manager serves as the investment adviser of the underlying funds, an underlying fund may change its investment program or policies without the fund’s approval, which could require the fund to reduce or eliminate its allocation to the underlying fund at an unfavorable time.
The fund also bears the following risks associated with the underlying funds:
Certain accounts or affiliates of the Investment Manager, including other funds advised by the Investment Manager or third parties, may from time to time own (beneficially or of record) or control a substantial amount of the fund’s shares, including through seed capital arrangements. Such shareholders may at times be considered to control the fund. Dispositions of a large number of shares by these shareholders may adversely affect the fund’s liquidity and net assets. These redemptions may also force the fund to sell securities, which may increase the fund’s brokerage costs.
There is no guarantee that the investment techniques, analyses, or judgments that we apply in making investment decisions for the underlying funds will produce the intended outcome or that the investments we select for the underlying funds will perform as well as other securities that were not selected for the underlying funds. We, or the underlying funds’ other service providers, may experience disruptions or
operating errors that could negatively impact the underlying funds. If the quantitative models or data that are used in managing an underlying fund prove to be incorrect or incomplete, investment decisions made in reliance on the models or data may not produce the desired results and the fund may realize losses.
An underlying fund’s allocation of assets among asset classes may hurt performance. The value of investments in the underlying funds’ portfolios may fall or fail to rise over extended periods of time for a variety of reasons, including general economic, political or financial market conditions, investor sentiment and market perceptions, government actions, geopolitical events or changes, outbreaks of infectious illnesses or other widespread public health issues, and factors related to a specific issuer, asset class, geography, industry or sector. These and other factors may lead to increased volatility and reduced liquidity in the underlying funds’ portfolio holdings, may negatively impact an underlying fund’s performance, and may exacerbate other risks to which an underlying fund is subject. Growth stocks may be more susceptible to earnings disappointments, and value stocks may fail to rebound. These risks are generally greater for small and midsize companies.
Fixed income investments are subject to interest rate risk, which is the risk that the value of the underlying funds’ fixed income investments is likely to fall if interest rates rise. Fixed income investments also are subject to credit risk, which is the risk that the issuers of the underlying funds’ fixed income investments may default on payment of interest or principal. Fixed income investments may be more susceptible to downgrades or defaults during economic downturns or other periods of economic stress. Interest rate risk is generally greater for longer-term bonds, and credit risk is generally greater for below-investment-grade bonds (sometimes referred to as “junk bonds”), which can be more sensitive to changes in markets, credit conditions, and interest rates and may be considered speculative. Default risk is generally higher for non-qualified mortgages. Mortgage-backed investments, unlike traditional debt investments, are also subject to prepayment risk, which means that they may increase in value less than other bonds when interest rates decline and decline in value more than other bonds when interest rates rise. The underlying funds may have to invest the proceeds from prepaid investments, including mortgage- and asset-backed investments, in other investments with less attractive terms and yields.
The value of international investments traded in foreign currencies may be adversely impacted by fluctuations in exchange rates. International investments, particularly investments in emerging markets, may carry risks associated with potentially less stable economies or governments (such as the risk of seizure by a foreign government, the imposition of currency or other restrictions, or high levels of inflation), and may be or become illiquid.
Putnam Dynamic Asset Allocation Equity Fund and Putnam Short Term Investment Fund may use, and each other underlying fund typically uses to a significant extent, derivatives, such as futures, options, swap contracts, and, for each underlying fund other than Putnam Short Term Investment Fund, certain foreign currency transactions and warrants, for both hedging and investment purposes (although, in
the case of Putnam Short Term Investment Fund, they do not represent a primary focus of the fund). Underlying funds that use derivatives to increase investment exposure may be riskier than underlying funds that do not employ investment leverage. The value of derivatives may move in unexpected ways due to unanticipated market movements, the use of leverage, imperfect correlation between the derivative instrument and the reference asset, or other factors, especially in unusual market conditions, and volatility in the value of derivatives could adversely impact the underlying fund’s returns, obligations and exposures. Derivatives are also subject to other risks, including liquidity risk (e.g., liquidity demands arising from the requirement to make payments to a derivative counterparty), operational risk (e.g., settlement issues or system failures), and legal risk (e.g., insufficient legal documentation or contract enforceability issues). Derivatives also involve the risk that an underlying fund may be unable to terminate or sell derivative positions when it wants to and that the other party to the instrument may fail to meet its obligations. The risk of a party failing to meet its obligations may increase if the underlying fund has significant investment exposure to that counterparty.
The fund may not achieve its goal, and it is not intended to be a complete investment program. An investment in the fund is not insured or guaranteed by the Federal Deposit Insurance Corporation or any other government agency.
The performance information below gives some indication of the risks associated with an investment in the fund by showing the fund’s performance year to year and over time. The bar chart does not reflect the impact of sales charges. If it did, performance would be lower. Please remember that past performance is not necessarily an indication of future results. Monthly performance figures for the fund are available at www.franklintempleton.com.
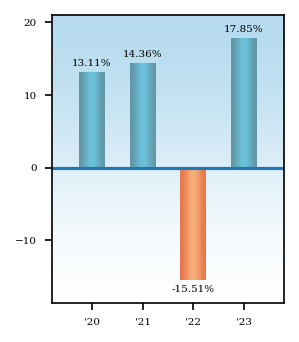
Average Annual Total Returns - Putnam Retirement Advantage 2035 Fund |
1 Year |
Since Inception |
Inception Date |
||
|---|---|---|---|---|---|
| Class A 2035 | 11.07% | [1] | 4.97% | [1] | Dec. 31, 2019 |
| Class A 2035 | After Taxes on Distributions | 9.55% | [1] | 2.79% | [1] | Dec. 31, 2019 |
| Class A 2035 | After Taxes on Distributions and Sales | 6.94% | [1] | 3.24% | [1] | Dec. 31, 2019 |
| Class C 2035 | 15.94% | [1] | 5.74% | [1] | Dec. 31, 2019 |
| Class R 2035 | 17.28% | [1] | 6.10% | [1] | Dec. 31, 2019 |
| Class R3 2035 | 17.52% | [1] | 6.37% | [1] | Dec. 31, 2019 |
| Class R4 2035 | 17.84% | [1] | 6.61% | [1] | Dec. 31, 2019 |
| Class R5 2035 | 18.08% | [1] | 6.76% | [1] | Dec. 31, 2019 |
| Class R6 2035 | 18.20% | 6.88% | Dec. 31, 2019 | ||
| Class Y 2035 | 18.08% | [1] | 6.77% | [1] | Dec. 31, 2019 |
| Russell 3000 Index (no deduction for fees, expenses or taxes) | 25.96% | [2] | 8.80% | [2] | Dec. 31, 2019 |
| Bloomberg U.S. Aggregate Index (no deduction for fees, expenses or taxes) | 5.53% | [2] | (3.26%) | [2] | Dec. 31, 2019 |
| S&P Target Date To 2035 Index (no deduction for fees, expenses or taxes) | 16.48% | [2] | 6.26% | [2] | Dec. 31, 2019 |
| [1] | Performance for classes A, C, R, R3, R4, R5, and Y shares prior to their inception (9/1/20) is derived from the historical performance of class R6 shares, adjusted for the higher operating expenses and, for class A and C shares, higher sales charges (in the case of after sales-charge returns) applicable to such classes. |
| [2] | The table above compares the fund’s returns to the performance of three indexes: (i) Russell 3000 Index, a broad measure of market performance; (ii) Bloomberg U.S. Aggregate Index, also a broad measure of market performance; and (iii) S&P Target Date To 2035 Index, an additional index that the Investment Manager believes more closely reflect the fund’s principal investment objective and strategies. |
| After-tax returns reflect the historical highest individual federal marginal income tax rates and do not reflect state and local taxes. Actual after-tax returns depend on an investor’s tax situation and may differ from those shown. After-tax returns are shown for class A shares only and will vary for other classes. These after-tax returns do not apply if you hold your fund shares through a 401(k) plan, an IRA, or another tax-advantaged arrangement. |
Putnam Retirement Advantage 2030 Fund seeks capital appreciation and current income consistent with a decreasing emphasis on capital appreciation and an increasing emphasis on current income as it approaches its target date.
The following tables describe the fees and expenses you may pay if you buy, hold and sell shares of the fund. You may pay other fees, such as brokerage commissions and other fees to financial intermediaries, which are not reflected in the tables and examples below. You may qualify for sales charge discounts if you and your family invest, or agree to invest in the future, at least $50,000 in Putnam funds. More information about these and other discounts is available from your financial professional and in How do I buy fund shares? beginning on page 102 of the fund’s prospectus, in Appendix A to the fund’s prospectus, and in How to buy shares beginning on page II-1 of the fund’s statement of additional information (“SAI”).
Shareholder Fees - Putnam Retirement Advantage 2030 Fund |
Class A 2030 |
Class C 2030 |
Class R 2030 |
Class R3 2030 |
Class R4 2030 |
Class R5 2030 |
Class R6 2030 |
Class Y 2030 |
||
|---|---|---|---|---|---|---|---|---|---|---|
| Maximum Sales Charge Imposed on Purchases (as a percentage of Offering Price) | 5.75% | none | none | none | none | none | none | none | ||
| Maximum Deferred Sales Charge (as a percentage) | 1.00% | [1] | 1.00% | [2] | none | none | none | none | none | none |
| [1] | Applies only to certain redemptions of shares bought with no initial sales charge. |
| [2] | This charge is eliminated after one year. |
Annual Fund Operating Expenses - Putnam Retirement Advantage 2030 Fund |
Class A 2030 |
Class C 2030 |
Class R 2030 |
Class R3 2030 |
Class R4 2030 |
Class R5 2030 |
Class R6 2030 |
Class Y 2030 |
|
|---|---|---|---|---|---|---|---|---|---|
| Management Fees (as a percentage of Assets) | 0.38% | 0.38% | 0.38% | 0.38% | 0.38% | 0.38% | 0.38% | 0.38% | |
| Distribution and Service (12b-1) Fees | 0.25% | 1.00% | 0.50% | 0.25% | none | none | none | none | |
| Other Expenses (as a percentage of Assets): | 0.82% | 0.82% | 0.97% | 0.97% | 0.97% | 0.82% | 0.72% | 0.82% | |
| Acquired Fund Fees and Expenses | 0.54% | 0.54% | 0.54% | 0.54% | 0.54% | 0.54% | 0.54% | 0.54% | |
| Expenses (as a percentage of Assets) | 1.99% | 2.74% | 2.39% | 2.14% | 1.89% | 1.74% | 1.64% | 1.74% | |
| Fee Waiver or Reimbursement | [1] | (1.19%) | (1.19%) | (1.19%) | (1.19%) | (1.19%) | (1.19%) | (1.19%) | (1.19%) |
| Net Expenses (as a percentage of Assets) | 0.80% | 1.55% | 1.20% | 0.95% | 0.70% | 0.55% | 0.45% | 0.55% | |
| [1] | Reflects the Investment Manager’s (as defined below) contractual obligation to limit certain fund expenses through at least December 30, 2027. This obligation may be modified or discontinued only with approval of the Board of Trustees. |
The following hypothetical example is intended to help you compare the cost of investing in the fund with the cost of investing in other funds. It assumes that you invest $10,000 in the fund for the time periods indicated and then, except as indicated, redeem all your shares at the end of those periods. It assumes a 5% return on your investment each year and that the fund’s operating expenses remain the same. The example takes into account the expense reimbursement described above for the 1- and 3-year periods. Your actual costs may be higher or lower.
Expense Example - Putnam Retirement Advantage 2030 Fund - USD ($) |
Expense Example, with Redemption, 1 Year |
Expense Example, with Redemption, 3 Years |
Expense Example, with Redemption, 5 Years |
Expense Example, with Redemption, 10 Years |
Expense Example, No Redemption, 1 Year |
Expense Example, No Redemption, 3 Years |
Expense Example, No Redemption, 5 Years |
Expense Example, No Redemption, 10 Years |
|---|---|---|---|---|---|---|---|---|
| Class A 2030 | 652 | 816 | 1,253 | 2,467 | ||||
| Class C 2030 | 258 | 490 | 1,110 | 2,602 | 158 | 490 | 1,110 | 2,602 |
| Class R 2030 | 122 | 381 | 930 | 2,431 | ||||
| Class R3 2030 | 97 | 303 | 799 | 2,168 | ||||
| Class R4 2030 | 72 | 224 | 666 | 1,898 | ||||
| Class R5 2030 | 56 | 176 | 586 | 1,733 | ||||
| Class R6 2030 | 46 | 144 | 532 | 1,621 | ||||
| Class Y 2030 | 56 | 176 | 586 | 1,733 |
The fund pays transaction-related costs, such as commissions, when it buys and sells securities (or “turns over” its portfolio). A higher turnover rate may indicate higher transaction costs and may result in higher taxes when the fund’s shares are held in a taxable account. These costs, which are not reflected in annual fund operating
expenses or the above example, affect fund performance. The fund’s turnover rate in the most recent fiscal year was 33%.
Investments
The fund’s asset allocation strategy may be attractive to investors who plan to retire or otherwise intend to begin making periodic withdrawals of their investments in or about 2030 (the target date). The fund is designed to provide diversification among different asset classes by investing its assets in other Putnam mutual funds, referred to as underlying funds.
The fund’s target allocations among asset classes and underlying funds will increasingly emphasize capital preservation and income over time and will change gradually based on the number of remaining years until the fund’s target date, as shown in the predetermined “glide path” in the chart under “What are the funds’ and each underlying fund’s main investment strategies and related risks?”. Franklin Advisers, Inc. (“Franklin Advisers” or the “Investment Manager”) adjusts these allocations at the end of each calendar quarter based on the glide path.
The following table presents your fund’s approximate allocations to each asset class and underlying fund as of December 31, 2024 and its projected approximate allocations to these asset classes and underlying funds as of December 31, 2025. By comparing the percentage allocations of your fund in the table, you can see how its allocations are expected to change during the one-year period beginning on December 31, 2024.
The table also shows the approximate allocations of other Putnam Retirement Advantage Funds, which are designed for investors with different target retirement dates. Over a five-year period, each fund’s allocations will gradually change to resemble the allocations of the fund with the next earliest target date. The table illustrates how a fund’s allocations are expected to change over time to increasingly emphasize capital preservation and income.
| Underlying Fund* | Year | 2065 | 2060 | 2055 | 2050 | 2045 | 2040 | 2035 | 2030 (your fund) | 2025 | Maturity Fund |
| Putnam Dynamic Asset Allocation Equity Fund | 2024 | 78.0% | 62.8% | 39.0% | 15.2% | 0.0% | 0.0% | 0.0% | 0.0% | 0.0% | 0.0% |
| 2025 | 78.0% | 59.9% | 35.2% | 12.2% | 0.0% | 0.0% | 0.0% | 0.0% | 0.0% | 0.0% | |
| Putnam Dynamic Asset Allocation Growth Fund | 2024 | 21.5% | 36.7% | 60.5% | 83.8% | 92.7% | 51.8% | 0.0% | 0.0% | 0.0% | 0.0% |
| 2025 | 21.5% | 39.6% | 64.3% | 86.6% | 89.5% | 44.8% | 0.0% | 0.0% | 0.0% | 0.0% | |
| Putnam Dynamic Asset Allocation Balanced Fund | 2024 | 0.0% | 0.0% | 0.0% | 0.0% | 4.8% | 44.8% | 92.9% | 30.1% | 2.5% | 0.0% |
| 2025 | 0.0% | 0.0% | 0.0% | 0.0% | 7.8% | 51.7% | 87.1% | 19.7% | 0.6% | 0.0% | |
| Putnam Dynamic Asset Allocation Conservative Fund | 2024 | 0.0% | 0.0% | 0.0% | 0.0% | 0.0% | 0.0% | 1.1% | 47.9% | 9.8% | 0.0% |
| 2025 | 0.0% | 0.0% | 0.0% | 0.0% | 0.0% | 0.0% | 4.0% | 56.0% | 2.5% | 0.0% | |
| Putnam Short Term Investment Fund | 2024 | 0.5% | 0.5% | 0.5% | 1.0% | 2.5% | 3.4% | 4.5% | 5.8% | 6.0% | 6.0% |
| 2025 | 0.5% | 0.5% | 0.5% | 1.2% | 2.7% | 3.5% | 4.7% | 6.0% | 6.0% | 6.0% | |
| Putnam Multi-Asset Income Fund | 2024 | 0.0% | 0.0% | 0.0% | 0.0% | 0.0% | 0.0% | 1.5% | 16.2% | 81.7% | 94.0% |
| 2025 | 0.0% | 0.0% | 0.0% | 0.0% | 0.0% | 0.0% | 4.2% | 18.3% | 90.9% | 94.0% | |
| Equity** | 2024 | 95.2% | 92.2% | 87.4% | 82.2% | 77.0% | 68.3% | 56.5% | 36.8% | 26.5% | 25.4% |
| 2025 | 95.2% | 91.6% | 86.6% | 81.5% | 76.3% | 66.9% | 54.6% | 33.6% | 25.7% | 25.4% | |
| Fixed Income** | 2024 | 4.8% | 7.8% | 12.6% | 17.8% | 23.0% | 31.7% | 43.5% | 63.2% | 73.5% | 74.6% |
| 2025 | 4.8% | 8.4% | 13.4% | 18.5% | 23.7% | 33.1% | 45.4% | 66.4% | 74.3% | 74.6% |
| * | Due to rounding, allocations shown in the table above may not total 100%. In addition, because of rounding in the calculation of allocations among underlying funds and market fluctuations, actual allocations might be more or less than these percentages. |
| ** | Equity and fixed income allocations are hypothetical estimates based on each Putnam Dynamic Asset Allocation Fund’s and Putnam Multi-Asset Income Fund’s current strategic allocation to equity and fixed income investments as set forth under “What are the funds’ and each underlying fund’s main investment strategies and related risks?”, and an assumption that Putnam Short Term Investment Fund is equivalent to a fixed income investment. The managers of the underlying funds may adjust those funds’ allocations among asset classes from time to time consistent with their investment goals, and, consequently, actual allocations will vary. |
The fund’s target allocations may differ from the allocations shown in the table. We may change the glide path, the fund’s target allocations, and the underlying funds in which it invests at any time, although we expect these changes to be infrequent and generally in response to longer-term structural changes (i.e., in the average retirement age or life expectancy) that lead the fund’s portfolio managers to determine that a change is advisable. We assume investors will begin gradual withdrawals from the
fund at or around the target date. Near the end of the target date year, the fund’s target allocations will correspond to those of Putnam Retirement Advantage Maturity Fund (Maturity Fund), a fund that seeks as high a rate of current income as the Investment Manager believes is consistent with preservation of capital, and the fund will be merged into Maturity Fund. More information about Maturity Fund is available in this prospectus beginning on page 74, and more information about the underlying funds (which are not offered by this prospectus) is included under “What are the funds’ and each underlying fund’s main investment strategies and related risks?”.
It is important to understand that you can lose money by investing in the fund. Losses may occur near, at or after the target date. There is no guarantee that the fund will provide adequate income at and through an investor’s retirement.
The fund’s allocation of assets among asset classes and the underlying funds may hurt performance.
The fund invests in underlying funds and indirectly bears expenses related to the underlying funds. However, the Investment Manager has contractually agreed to waive fees, reimburse expenses of, or reimburse the fund through at least December 30, 2027 in an amount equal to the fund’s acquired fund fees and expenses (i.e., the fees and expenses incurred by the fund as a result of its investments in the underlying funds). The Investment Manager also has contractually agreed to waive fees and/or reimburse expenses of each class of shares of the fund through at least December 30, 2027 in an amount sufficient to result in total annual fund operating expenses for class A, C, R, R3, R4, R5, R6 and Y shares of the fund (exclusive of certain fees and expenses, including distribution fees (12b-1 fees)) that equal 0.55%, 0.55%, 0.70%, 0.70%, 0.70%, 0.55%, 0.45%, and 0.55%, respectively, of the fund’s average net assets. Although the Investment Manager serves as the investment adviser of the underlying funds, an underlying fund may change its investment program or policies without the fund’s approval, which could require the fund to reduce or eliminate its allocation to the underlying fund at an unfavorable time.
The fund also bears the following risks associated with the underlying funds:
Certain accounts or affiliates of the Investment Manager, including other funds advised by the Investment Manager or third parties, may from time to time own (beneficially or of record) or control a substantial amount of the fund’s shares, including through seed capital arrangements. Such shareholders may at times be considered to control the fund. Dispositions of a large number of shares by these shareholders may adversely affect the fund’s liquidity and net assets. These redemptions may also force the fund to sell securities, which may increase the fund’s brokerage costs.
There is no guarantee that the investment techniques, analyses, or judgments that we apply in making investment decisions for the underlying funds will produce the intended outcome or that the investments we select for the underlying funds will perform as well as other securities that were not selected for the underlying funds. We, or the underlying funds’ other service providers, may experience disruptions or
operating errors that could negatively impact the underlying funds. If the quantitative models or data that are used in managing an underlying fund prove to be incorrect or incomplete, investment decisions made in reliance on the models or data may not produce the desired results and the fund may realize losses.
An underlying fund’s allocation of assets among asset classes may hurt performance. The value of investments in the underlying funds’ portfolios may fall or fail to rise over extended periods of time for a variety of reasons, including general economic, political or financial market conditions, investor sentiment and market perceptions, government actions, geopolitical events or changes, outbreaks of infectious illnesses or other widespread public health issues, and factors related to a specific issuer, asset class, geography, industry or sector. These and other factors may lead to increased volatility and reduced liquidity in the underlying funds’ portfolio holdings, may negatively impact an underlying fund’s performance, and may exacerbate other risks to which an underlying fund is subject. Growth stocks may be more susceptible to earnings disappointments, and value stocks may fail to rebound. These risks are generally greater for small and midsize companies.
Fixed income investments are subject to interest rate risk, which is the risk that the value of the underlying funds’ fixed income investments is likely to fall if interest rates rise. Fixed income investments also are subject to credit risk, which is the risk that the issuers of the underlying funds’ fixed income investments may default on payment of interest or principal. Fixed income investments may be more susceptible to downgrades or defaults during economic downturns or other periods of economic stress. Interest rate risk is generally greater for longer-term bonds, and credit risk is generally greater for below-investment-grade bonds (sometimes referred to as “junk bonds”), which can be more sensitive to changes in markets, credit conditions, and interest rates and may be considered speculative. Default risk is generally higher for non-qualified mortgages. Mortgage-backed investments, unlike traditional debt investments, are also subject to prepayment risk, which means that they may increase in value less than other bonds when interest rates decline and decline in value more than other bonds when interest rates rise. The underlying funds may have to invest the proceeds from prepaid investments, including mortgage- and asset-backed investments, in other investments with less attractive terms and yields.
The value of international investments traded in foreign currencies may be adversely impacted by fluctuations in exchange rates. International investments, particularly investments in emerging markets, may carry risks associated with potentially less stable economies or governments (such as the risk of seizure by a foreign government, the imposition of currency or other restrictions, or high levels of inflation), and may be or become illiquid.
Putnam Dynamic Asset Allocation Equity Fund and Putnam Short Term Investment Fund may use, and each other underlying fund typically uses to a significant extent, derivatives, such as futures, options, swap contracts, and, for each underlying fund other than Putnam Short Term Investment Fund, certain foreign currency transactions and warrants, for both hedging and investment purposes (although, in
the case of Putnam Short Term Investment Fund, they do not represent a primary focus of the fund). Underlying funds that use derivatives to increase investment exposure may be riskier than underlying funds that do not employ investment leverage. The value of derivatives may move in unexpected ways due to unanticipated market movements, the use of leverage, imperfect correlation between the derivative instrument and the reference asset, or other factors, especially in unusual market conditions, and volatility in the value of derivatives could adversely impact the underlying fund’s returns, obligations and exposures. Derivatives are also subject to other risks, including liquidity risk (e.g., liquidity demands arising from the requirement to make payments to a derivative counterparty), operational risk (e.g., settlement issues or system failures), and legal risk (e.g., insufficient legal documentation or contract enforceability issues). Derivatives also involve the risk that an underlying fund may be unable to terminate or sell derivative positions when it wants to and that the other party to the instrument may fail to meet its obligations. The risk of a party failing to meet its obligations may increase if the underlying fund has significant investment exposure to that counterparty.
The fund may not achieve its goal, and it is not intended to be a complete investment program. An investment in the fund is not insured or guaranteed by the Federal Deposit Insurance Corporation or any other government agency.
The performance information below gives some indication of the risks associated with an investment in the fund by showing the fund’s performance year to year and over time. The bar chart does not reflect the impact of sales charges. If it did, performance would be lower. Please remember that past performance is not necessarily an indication of future results. Monthly performance figures for the fund are available at www.franklintempleton.com.
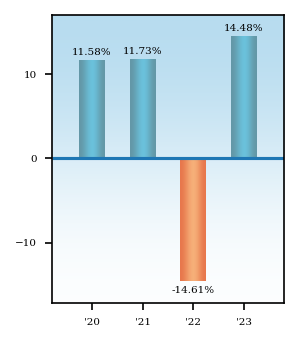
Average Annual Total Returns - Putnam Retirement Advantage 2030 Fund |
1 Year |
Since Inception |
Inception Date |
||
|---|---|---|---|---|---|
| Class A 2030 | 7.90% | [1] | 3.52% | [1] | Dec. 31, 2019 |
| Class A 2030 | After Taxes on Distributions | 6.85% | [1] | 1.71% | [1] | Dec. 31, 2019 |
| Class A 2030 | After Taxes on Distributions and Sales | 4.93% | [1] | 2.23% | [1] | Dec. 31, 2019 |
| Class C 2030 | 12.62% | [1] | 4.30% | [1] | Dec. 31, 2019 |
| Class R 2030 | 14.02% | [1] | 4.64% | [1] | Dec. 31, 2019 |
| Class R3 2030 | 14.28% | [1] | 4.91% | [1] | Dec. 31, 2019 |
| Class R4 2030 | 14.51% | [1] | 5.15% | [1] | Dec. 31, 2019 |
| Class R5 2030 | 14.70% | [1] | 5.30% | [1] | Dec. 31, 2019 |
| Class R6 2030 | 14.82% | 5.41% | Dec. 31, 2019 | ||
| Class Y 2030 | 14.71% | [1] | 5.30% | [1] | Dec. 31, 2019 |
| Russell 3000 Index (no deduction for fees, expenses or taxes) | 25.96% | [2] | 8.80% | [2] | Dec. 31, 2019 |
| Bloomberg U.S. Aggregate Index (no deduction for fees, expenses or taxes) | 5.53% | [2] | (3.26%) | [2] | Dec. 31, 2019 |
| S&P Target Date To 2030 Index (no deduction for fees, expenses or taxes) | 14.44% | [2] | 5.39% | [2] | Dec. 31, 2019 |
| [1] | Performance for classes A, C, R, R3, R4, R5, and Y shares prior to their inception (9/1/20) is derived from the historical performance of class R6 shares, adjusted for the higher operating expenses and, for class A and C shares, higher sales charges (in the case of after sales-charge returns) applicable to such classes. |
| [2] | The table above compares the fund’s returns to the performance of three indexes: (i) Russell 3000 Index, a broad measure of market performance; (ii) Bloomberg U.S. Aggregate Index, also a broad measure of market performance; and (iii) S&P Target Date To 2030 Index, an additional index that the Investment Manager believes more closely reflect the fund’s principal investment objective and strategies. |
| After-tax returns reflect the historical highest individual federal marginal income tax rates and do not reflect state and local taxes. Actual after-tax returns depend on an investor’s tax situation and may differ from those shown. After-tax returns are shown for class A shares only and will vary for other classes. These after-tax returns do not apply if you hold your fund shares through a 401(k) plan, an IRA, or another tax-advantaged arrangement. |
Putnam Retirement Advantage 2025 Fund seeks capital appreciation and current income consistent with a decreasing emphasis on capital appreciation and an increasing emphasis on current income as it approaches its target date.
The following tables describe the fees and expenses you may pay if you buy, hold and sell shares of the fund. You may pay other fees, such as brokerage commissions and other fees to financial intermediaries, which are not reflected in the tables and examples below. You may qualify for sales charge discounts if you and your family invest, or agree to invest in the future, at least $50,000 in Putnam funds. More information about these and other discounts is available from your financial professional and in How do I buy fund shares? beginning on page 102 of the fund’s prospectus, in Appendix A to the fund’s prospectus, and in How to buy shares beginning on page II-1 of the fund’s statement of additional information (“SAI”).
Shareholder Fees - Putnam Retirement Advantage 2025 Fund |
Class A 2025 |
Class C 2025 |
Class R 2025 |
Class R3 2025 |
Class R4 2025 |
Class R5 2025 |
Class R6 2025 |
Class Y 2025 |
||
|---|---|---|---|---|---|---|---|---|---|---|
| Maximum Sales Charge Imposed on Purchases (as a percentage of Offering Price) | 5.75% | none | none | none | none | none | none | none | ||
| Maximum Deferred Sales Charge (as a percentage) | 1.00% | [1] | 1.00% | [2] | none | none | none | none | none | none |
| [1] | Applies only to certain redemptions of shares bought with no initial sales charge. |
| [2] | This charge is eliminated after one year. |
Annual Fund Operating Expenses - Putnam Retirement Advantage 2025 Fund |
Class A 2025 |
Class C 2025 |
Class R 2025 |
Class R3 2025 |
Class R4 2025 |
Class R5 2025 |
Class R6 2025 |
Class Y 2025 |
|
|---|---|---|---|---|---|---|---|---|---|
| Management Fees (as a percentage of Assets) | 0.37% | 0.37% | 0.37% | 0.37% | 0.37% | 0.37% | 0.37% | 0.37% | |
| Distribution and Service (12b-1) Fees | 0.25% | 1.00% | 0.50% | 0.25% | none | none | none | none | |
| Other Expenses (as a percentage of Assets): | 0.89% | 0.89% | 1.04% | 1.04% | 1.04% | 0.89% | 0.79% | 0.89% | |
| Acquired Fund Fees and Expenses | 0.41% | 0.41% | 0.41% | 0.41% | 0.41% | 0.41% | 0.41% | 0.41% | |
| Expenses (as a percentage of Assets) | 1.92% | 2.67% | 2.32% | 2.07% | 1.82% | 1.67% | 1.57% | 1.67% | |
| Fee Waiver or Reimbursement | [1] | (1.12%) | (1.12%) | (1.12%) | (1.12%) | (1.12%) | (1.12%) | (1.12%) | (1.12%) |
| Net Expenses (as a percentage of Assets) | 0.80% | 1.55% | 1.20% | 0.95% | 0.70% | 0.55% | 0.45% | 0.55% | |
| [1] | Reflects the Investment manager’s (as defined below) contractual obligation to limit certain fund expenses through at least December 30, 2027. This obligation may be modified or discontinued only with approval of the Board of Trustees. |
The following hypothetical example is intended to help you compare the cost of investing in the fund with the cost of investing in other funds. It assumes that you invest $10,000 in the fund for the time periods indicated and then, except as indicated, redeem all your shares at the end of those periods. It assumes a 5% return on your investment each year and that the fund’s operating expenses remain the same. The example takes into account the expense reimbursement described above for the 1- and 3-year periods. Your actual costs may be higher or lower.
Expense Example - Putnam Retirement Advantage 2025 Fund - USD ($) |
Expense Example, with Redemption, 1 Year |
Expense Example, with Redemption, 3 Years |
Expense Example, with Redemption, 5 Years |
Expense Example, with Redemption, 10 Years |
Expense Example, No Redemption, 1 Year |
Expense Example, No Redemption, 3 Years |
Expense Example, No Redemption, 5 Years |
Expense Example, No Redemption, 10 Years |
|---|---|---|---|---|---|---|---|---|
| Class A 2025 | 652 | 816 | 1,238 | 2,413 | ||||
| Class C 2025 | 258 | 490 | 1,095 | 2,548 | 158 | 490 | 1,095 | 2,548 |
| Class R 2025 | 122 | 381 | 914 | 2,376 | ||||
| Class R3 2025 | 97 | 303 | 783 | 2,112 | ||||
| Class R4 2025 | 72 | 224 | 650 | 1,840 | ||||
| Class R5 2025 | 56 | 176 | 570 | 1,674 | ||||
| Class R6 2025 | 46 | 144 | 516 | 1,561 | ||||
| Class Y 2025 | 56 | 176 | 570 | 1,674 |
The fund pays transaction-related costs, such as commissions, when it buys and sells securities (or “turns over” its portfolio). A higher turnover rate may indicate higher transaction costs and may result in higher taxes when the fund’s shares are held in a taxable account. These costs, which are not reflected in annual fund operating
expenses or the above example, affect fund performance. The fund’s turnover rate in the most recent fiscal year was 58%.
Investments
The fund’s asset allocation strategy may be attractive to investors who plan to retire or otherwise intend to begin making periodic withdrawals of their investments in or about 2025 (the target date). The fund is designed to provide diversification among different asset classes by investing its assets in other Putnam mutual funds, referred to as underlying funds.
The fund’s target allocations among asset classes and underlying funds will increasingly emphasize capital preservation and income over time and will change gradually based on the number of remaining years until the fund’s target date, as shown in the predetermined “glide path” in the chart under “What are the funds’ and each underlying fund’s main investment strategies and related risks?”. Franklin Advisers, Inc. (“Franklin Advisers” or the “Investment Manager”) adjusts these allocations at the end of each calendar quarter based on the glide path.
The following table presents your fund’s approximate allocations to each asset class and underlying fund as of December 31, 2024 and its projected approximate allocations to these asset classes and underlying funds as of December 31, 2025. By comparing the percentage allocations of your fund in the table, you can see how its allocations are expected to change during the one-year period beginning on December 31, 2024.
The table also shows the approximate allocations of other Putnam Retirement Advantage Funds, which are designed for investors with different target retirement dates. Over a five-year period, each fund’s allocations will gradually change to resemble the allocations of the fund with the next earliest target date. The table illustrates how a fund’s allocations are expected to change over time to increasingly emphasize capital preservation and income.
| Underlying Fund* | Year | 2065 | 2060 | 2055 | 2050 | 2045 | 2040 | 2035 | 2030 | 2025 (your fund) | Maturity Fund |
| Putnam Dynamic Asset Allocation Equity Fund | 2024 | 78.0% | 62.8% | 39.0% | 15.2% | 0.0% | 0.0% | 0.0% | 0.0% | 0.0% | 0.0% |
| 2025 | 78.0% | 59.9% | 35.2% | 12.2% | 0.0% | 0.0% | 0.0% | 0.0% | 0.0% | 0.0% | |
| Putnam Dynamic Asset Allocation Growth Fund | 2024 | 21.5% | 36.7% | 60.5% | 83.8% | 92.7% | 51.8% | 0.0% | 0.0% | 0.0% | 0.0% |
| 2025 | 21.5% | 39.6% | 64.3% | 86.6% | 89.5% | 44.8% | 0.0% | 0.0% | 0.0% | 0.0% | |
| Putnam Dynamic Asset Allocation Balanced Fund | 2024 | 0.0% | 0.0% | 0.0% | 0.0% | 4.8% | 44.8% | 92.9% | 30.1% | 2.5% | 0.0% |
| 2025 | 0.0% | 0.0% | 0.0% | 0.0% | 7.8% | 51.7% | 87.1% | 19.7% | 0.6% | 0.0% | |
| Putnam Dynamic Asset Allocation Conservative Fund | 2024 | 0.0% | 0.0% | 0.0% | 0.0% | 0.0% | 0.0% | 1.1% | 47.9% | 9.8% | 0.0% |
| 2025 | 0.0% | 0.0% | 0.0% | 0.0% | 0.0% | 0.0% | 4.0% | 56.0% | 2.5% | 0.0% | |
| Putnam Short Term Investment Fund | 2024 | 0.5% | 0.5% | 0.5% | 1.0% | 2.5% | 3.4% | 4.5% | 5.8% | 6.0% | 6.0% |
| 2025 | 0.5% | 0.5% | 0.5% | 1.2% | 2.7% | 3.5% | 4.7% | 6.0% | 6.0% | 6.0% | |
| Putnam Multi-Asset Income Fund | 2024 | 0.0% | 0.0% | 0.0% | 0.0% | 0.0% | 0.0% | 1.5% | 16.2% | 81.7% | 94.0% |
| 2025 | 0.0% | 0.0% | 0.0% | 0.0% | 0.0% | 0.0% | 4.2% | 18.3% | 90.9% | 94.0% | |
| Equity** | 2024 | 95.2% | 92.2% | 87.4% | 82.2% | 77.0% | 68.3% | 56.5% | 36.8% | 26.5% | 25.4% |
| 2025 | 95.2% | 91.6% | 86.6% | 81.5% | 76.3% | 66.9% | 54.6% | 33.6% | 25.7% | 25.4% | |
| Fixed Income** | 2024 | 4.8% | 7.8% | 12.6% | 17.8% | 23.0% | 31.7% | 43.5% | 63.2% | 73.5% | 74.6% |
| 2025 | 4.8% | 8.4% | 13.4% | 18.5% | 23.7% | 33.1% | 45.4% | 66.4% | 74.3% | 74.6% |
| * | Due to rounding, allocations shown in the table above may not total 100%. In addition, because of rounding in the calculation of allocations among underlying funds and market fluctuations, actual allocations might be more or less than these percentages. |
| ** | Equity and fixed income allocations are hypothetical estimates based on each Putnam Dynamic Asset Allocation Fund’s and Putnam Multi-Asset Income Fund’s current strategic allocation to equity and fixed income investments as set forth under “What are the funds’ and each underlying fund’s main investment strategies and related risks?”, and an assumption that Putnam Short Term Investment Fund is equivalent to a fixed income investment. The managers of the underlying funds may adjust those funds’ allocations among asset classes from time to time consistent with their investment goals, and, consequently, actual allocations will vary. |
The fund’s target allocations may differ from the allocations shown in the table. We may change the glide path, the fund’s target allocations, and the underlying funds in which it invests at any time, although we expect these changes to be infrequent and generally in response to longer-term structural changes (i.e., in the average retirement age or life expectancy) that lead the fund’s portfolio managers to determine that a change is advisable. We assume investors will begin gradual withdrawals from the
fund at or around the target date. Near the end of the target date year, the fund’s target allocations will correspond to those of Putnam Retirement Advantage Maturity Fund (Maturity Fund), a fund that seeks as high a rate of current income as the Investment Manager believes is consistent with preservation of capital, and the fund will be merged into Maturity Fund. More information about Maturity Fund is available in this prospectus beginning on page 74, and more information about the underlying funds (which are not offered by this prospectus) is included under “What are the funds’ and each underlying fund’s main investment strategies and related risks?”.
It is important to understand that you can lose money by investing in the fund. Losses may occur near, at or after the target date. There is no guarantee that the fund will provide adequate income at and through an investor’s retirement.
The fund’s allocation of assets among asset classes and the underlying funds may hurt performance.
The fund invests in underlying funds and indirectly bears expenses related to the underlying funds. However, the Investment Manager has contractually agreed to waive fees, reimburse expenses of, or reimburse the fund through at least December 30, 2027 in an amount equal to the fund’s acquired fund fees and expenses (i.e., the fees and expenses incurred by the fund as a result of its investments in the underlying funds). The Investment Manager also has contractually agreed to waive fees and/or reimburse expenses of each class of shares of the fund through at least December 30, 2027 in an amount sufficient to result in total annual fund operating expenses for class A, C, R, R3, R4, R5, R6 and Y shares of the fund (exclusive of certain fees and expenses, including distribution fees (12b-1 fees)) that equal 0.55%, 0.55%, 0.70%, 0.70%, 0.70%, 0.55%, 0.45%, and 0.55%, respectively, of the fund’s average net assets. Although the Investment Manager serves as the investment adviser of the underlying funds, an underlying fund may change its investment program or policies without the fund’s approval, which could require the fund to reduce or eliminate its allocation to the underlying fund at an unfavorable time.
The fund also bears the following risks associated with the underlying funds:
Certain accounts or affiliates of the Investment Manager, including other funds advised by the Investment Manager or third parties, may from time to time own (beneficially or of record) or control a substantial amount of the fund’s shares, including through seed capital arrangements. Such shareholders may at times be considered to control the fund. Dispositions of a large number of shares by these shareholders may adversely affect the fund’s liquidity and net assets. These redemptions may also force the fund to sell securities, which may increase the fund’s brokerage costs.
There is no guarantee that the investment techniques, analyses, or judgments that we apply in making investment decisions for the underlying funds will produce the intended outcome or that the investments we select for the underlying funds will perform as well as other securities that were not selected for the underlying funds. We, or the underlying funds’ other service providers, may experience disruptions or
operating errors that could negatively impact the underlying funds. If the quantitative models or data that are used in managing an underlying fund prove to be incorrect or incomplete, investment decisions made in reliance on the models or data may not produce the desired results and the fund may realize losses.
An underlying fund’s allocation of assets among asset classes may hurt performance. The value of investments in the underlying funds’ portfolios may fall or fail to rise over extended periods of time for a variety of reasons, including general economic, political or financial market conditions, investor sentiment and market perceptions, government actions, geopolitical events or changes, outbreaks of infectious illnesses or other widespread public health issues, and factors related to a specific issuer, asset class, geography, industry or sector. These and other factors may lead to increased volatility and reduced liquidity in the underlying funds’ portfolio holdings, may negatively impact an underlying fund’s performance, and may exacerbate other risks to which an underlying fund is subject. Growth stocks may be more susceptible to earnings disappointments, and value stocks may fail to rebound. These risks are generally greater for small and midsize companies.
Fixed income investments are subject to interest rate risk, which is the risk that the value of the underlying funds’ fixed income investments is likely to fall if interest rates rise. Fixed income investments also are subject to credit risk, which is the risk that the issuers of the underlying funds’ fixed income investments may default on payment of interest or principal. Fixed income investments may be more susceptible to downgrades or defaults during economic downturns or other periods of economic stress. Interest rate risk is generally greater for longer-term bonds, and credit risk is generally greater for below-investment-grade bonds (sometimes referred to as “junk bonds”), which can be more sensitive to changes in markets, credit conditions, and interest rates and may be considered speculative. Default risk is generally higher for non-qualified mortgages. Mortgage-backed investments, unlike traditional debt investments, are also subject to prepayment risk, which means that they may increase in value less than other bonds when interest rates decline and decline in value more than other bonds when interest rates rise. The underlying funds may have to invest the proceeds from prepaid investments, including mortgage- and asset-backed investments, in other investments with less attractive terms and yields.
The value of international investments traded in foreign currencies may be adversely impacted by fluctuations in exchange rates. International investments, particularly investments in emerging markets, may carry risks associated with potentially less stable economies or governments (such as the risk of seizure by a foreign government, the imposition of currency or other restrictions, or high levels of inflation), and may be or become illiquid.
Putnam Dynamic Asset Allocation Equity Fund and Putnam Short Term Investment Fund may use, and each other underlying fund typically uses to a significant extent, derivatives, such as futures, options, swap contracts, and, for each underlying fund other than Putnam Short Term Investment Fund, certain foreign currency transactions and warrants, for both hedging and investment purposes (although, in
the case of Putnam Short Term Investment Fund, they do not represent a primary focus of the fund). Underlying funds that use derivatives to increase investment exposure may be riskier than underlying funds that do not employ investment leverage. The value of derivatives may move in unexpected ways due to unanticipated market movements, the use of leverage, imperfect correlation between the derivative instrument and the reference asset, or other factors, especially in unusual market conditions, and volatility in the value of derivatives could adversely impact the underlying fund’s returns, obligations and exposures. Derivatives are also subject to other risks, including liquidity risk (e.g., liquidity demands arising from the requirement to make payments to a derivative counterparty), operational risk (e.g., settlement issues or system failures), and legal risk (e.g., insufficient legal documentation or contract enforceability issues). Derivatives also involve the risk that an underlying fund may be unable to terminate or sell derivative positions when it wants to and that the other party to the instrument may fail to meet its obligations. The risk of a party failing to meet its obligations may increase if the underlying fund has significant investment exposure to that counterparty.
The fund may not achieve its goal, and it is not intended to be a complete investment program. An investment in the fund is not insured or guaranteed by the Federal Deposit Insurance Corporation or any other government agency.
The performance information below gives some indication of the risks associated with an investment in the fund by showing the fund’s performance year to year and over time. The bar chart does not reflect the impact of sales charges. If it did, performance would be lower. Please remember that past performance is not necessarily an indication of future results. Monthly performance figures for the fund are available at www.franklintempleton.com.
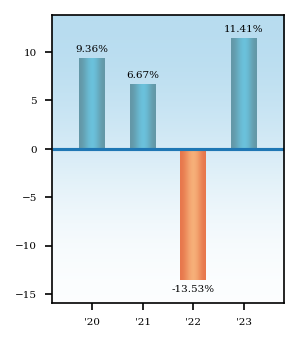
Average Annual Total Returns - Putnam Retirement Advantage 2025 Fund |
1 Year |
Since Inception |
Inception Date |
||
|---|---|---|---|---|---|
| Class A 2025 | 5.01% | [1] | 1.45% | [1] | Dec. 31, 2019 |
| Class A 2025 | After Taxes on Distributions | 3.81% | [1] | 0.24% | [1] | Dec. 31, 2019 |
| Class A 2025 | After Taxes on Distributions and Sales | 3.06% | [1] | 0.72% | [1] | Dec. 31, 2019 |
| Class C 2025 | 9.60% | [1] | 2.21% | [1] | Dec. 31, 2019 |
| Class R 2025 | 10.98% | [1] | 2.55% | [1] | Dec. 31, 2019 |
| Class R3 2025 | 11.25% | [1] | 2.80% | [1] | Dec. 31, 2019 |
| Class R4 2025 | 11.52% | [1] | 3.04% | [1] | Dec. 31, 2019 |
| Class R5 2025 | 11.65% | [1] | 3.19% | [1] | Dec. 31, 2019 |
| Class R6 2025 | 11.76% | 3.30% | Dec. 31, 2019 | ||
| Class Y 2025 | 11.70% | [1] | 3.20% | [1] | Dec. 31, 2019 |
| Russell 3000 Index (no deduction for fees, expenses or taxes) | 25.96% | [2] | 8.80% | [2] | Dec. 31, 2019 |
| Bloomberg U.S. Aggregate Index (no deduction for fees, expenses or taxes) | 5.53% | [2] | (3.26%) | [2] | Dec. 31, 2019 |
| S&P Target Date To 2025 Index (no deduction for fees, expenses or taxes) | 12.44% | [2] | 4.47% | [2] | Dec. 31, 2019 |
| [1] | Performance for classes A, C, R, R3, R4, R5, and Y shares prior to their inception (9/1/20) is derived from the historical performance of class R6 shares, adjusted for the higher operating expenses and, for class A and C shares, higher sales charges (in the case of after sales-charge returns) applicable to such classes. |
| [2] | The table above compares the fund’s returns to the performance of three indexes: (i) Russell 3000 Index, a broad measure of market performance; (ii) Bloomberg U.S. Aggregate Index, also a broad measure of market performance; and (iii) S&P Target Date To 2025 Index, an additional index that the Investment Manager believes more closely reflect the fund’s principal investment objective and strategies. |
| After-tax returns reflect the historical highest individual federal marginal income tax rates and do not reflect state and local taxes. Actual after-tax returns depend on an investor’s tax situation and may differ from those shown. After-tax returns are shown for class A shares only and will vary for other classes. These after-tax returns do not apply if you hold your fund shares through a 401(k) plan, an IRA, or another tax-advantaged arrangement. |
Putnam Retirement Advantage Maturity Fund seeks as high a rate of current income as Franklin Advisers, Inc. (“Franklin Advisers” or the “Investment Manager”) believes is consistent with preservation of capital.
The following tables describe the fees and expenses you may pay if you buy, hold and sell shares of the fund. You may pay other fees, such as brokerage commissions and other fees to financial intermediaries, which are not reflected in the tables and examples below. You may qualify for sales charge discounts if you and your family invest, or agree to invest in the future, at least $100,000 in class A shares of Putnam funds. More information about these and other discounts is available from your financial professional and in How do I buy fund shares? beginning on page 102 of the fund’s prospectus, in Appendix A to the fund’s prospectus, and in How to buy shares beginning on page II-1 of the fund’s statement of additional information (“SAI”).
Shareholder Fees - Putnam Retirement Advantage Maturity Fund |
Class A Maturity |
Class C Maturity |
Class R Maturity |
Class R3 Maturity |
Class R4 Maturity |
Class R5 Maturity |
Class R6 Maturity |
Class Y Maturity |
||
|---|---|---|---|---|---|---|---|---|---|---|
| Maximum Sales Charge Imposed on Purchases (as a percentage of Offering Price) | 4.00% | none | none | none | none | none | none | none | ||
| Maximum Deferred Sales Charge (as a percentage) | 1.00% | [1] | 1.00% | [2] | none | none | none | none | none | none |
| [1] | Applies only to certain redemptions of shares bought with no initial sales charge. |
| [2] | This charge is eliminated after one year. |
Annual Fund Operating Expenses - Putnam Retirement Advantage Maturity Fund |
Class A Maturity |
Class C Maturity |
Class R Maturity |
Class R3 Maturity |
Class R4 Maturity |
Class R5 Maturity |
Class R6 Maturity |
Class Y Maturity |
|
|---|---|---|---|---|---|---|---|---|---|
| Management Fees (as a percentage of Assets) | 0.36% | 0.36% | 0.36% | 0.36% | 0.36% | 0.36% | 0.36% | 0.36% | |
| Distribution and Service (12b-1) Fees | 0.25% | 1.00% | 0.50% | 0.25% | none | none | none | none | |
| Other Expenses (as a percentage of Assets): | 0.90% | 0.90% | 1.05% | 1.05% | 1.05% | 0.90% | 0.80% | 0.90% | |
| Acquired Fund Fees and Expenses | 0.39% | 0.39% | 0.39% | 0.39% | 0.39% | 0.39% | 0.39% | 0.39% | |
| Expenses (as a percentage of Assets) | 1.90% | 2.65% | 2.30% | 2.05% | 1.80% | 1.65% | 1.55% | 1.65% | |
| Fee Waiver or Reimbursement | [1] | (1.10%) | (1.10%) | (1.10%) | (1.10%) | (1.10%) | (1.10%) | (1.10%) | (1.10%) |
| Net Expenses (as a percentage of Assets) | 0.80% | 1.55% | 1.20% | 0.95% | 0.70% | 0.55% | 0.45% | 0.55% | |
| [1] | Reflects the Investment Manager’s contractual obligation to limit certain fund expenses through at least December 30, 2027. This obligation may be modified or discontinued only with approval of the Board of Trustees. |
The following hypothetical example is intended to help you compare the cost of investing in the fund with the cost of investing in other funds. It assumes that you invest $10,000 in the fund for the time periods indicated and then, except as indicated, redeem all your shares at the end of those periods. It assumes a 5% return on your investment each year and that the fund’s operating expenses remain the same. The example takes into account the expense reimbursement described above for the 1- and 3-year periods. Your actual costs may be higher or lower.
Expense Example - Putnam Retirement Advantage Maturity Fund - USD ($) |
Expense Example, with Redemption, 1 Year |
Expense Example, with Redemption, 3 Years |
Expense Example, with Redemption, 5 Years |
Expense Example, with Redemption, 10 Years |
Expense Example, No Redemption, 1 Year |
Expense Example, No Redemption, 3 Years |
Expense Example, No Redemption, 5 Years |
Expense Example, No Redemption, 10 Years |
|---|---|---|---|---|---|---|---|---|
| Class A Maturity | 478 | 645 | 1,071 | 2,256 | ||||
| Class C Maturity | 258 | 490 | 1,090 | 2,532 | 158 | 490 | 1,090 | 2,532 |
| Class R Maturity | 122 | 381 | 909 | 2,361 | ||||
| Class R3 Maturity | 97 | 303 | 778 | 2,096 | ||||
| Class R4 Maturity | 72 | 224 | 646 | 1,823 | ||||
| Class R5 Maturity | 56 | 176 | 565 | 1,657 | ||||
| Class R6 Maturity | 46 | 144 | 511 | 1,544 | ||||
| Class Y Maturity | 56 | 176 | 565 | 1,657 |
The fund pays transaction-related costs, such as commissions, when it buys and sells securities (or “turns over” its portfolio). A higher turnover rate may indicate higher transaction costs and may result in higher taxes when the fund’s shares are held in a taxable account. These costs, which are not reflected in annual fund operating
expenses or the above example, affect fund performance. The fund’s turnover rate in the most recent fiscal year was 32%.
Investments
The fund employs an asset allocation strategy designed for investors who are already in retirement or who plan to retire (or otherwise begin withdrawing the invested funds) in the near future. The fund is designed to provide diversification among different asset classes. The fund invests most of its assets in Putnam Multi-Asset Income Fund, another Putnam mutual fund, which invests mainly in fixed-income investments and, to a lesser extent, in equity securities. The fund invests the rest of its assets in Putnam Short Term Investment Fund, a Putnam mutual fund that invests mainly in short duration, investment-grade money market and other fixed income securities.
The following table presents your fund’s approximate allocations to each asset class (through its investments in underlying funds) as of December 30, 2023, which are not expected to change over time.
| Asset class | |
| Equity* | 25.0% |
| Fixed Income* | 75.0% |
| * | Equity and fixed income allocations are hypothetical estimates based on Putnam Multi-Asset Income Fund’s current strategic allocation to equity and fixed income investments as set forth under “What are the funds’ and each underlying fund’s main investment strategies and related risks?”, and an assumption that Putnam Short Term Investment Fund is equivalent to a fixed income investment. The managers of Putnam Multi-Asset Income Fund may adjust the fund’s allocations among asset classes from time to time consistent with its investment goals, and, consequently, actual allocations will vary. |
The fund’s target allocations may differ from the allocations shown in the table. We may change the fund’s target allocations, and the underlying fund(s) in which it invests, at any time, although we expect these changes to be infrequent and generally in response to longer-term structural changes (i.e., in the average retirement age or life expectancy) that lead the fund’s portfolio managers to determine that a change is advisable. We assume investors will make gradual withdrawals from the fund. The managers of Multi-Asset Income Fund will rebalance that fund’s investments towards its target allocations on a quarterly basis. More information about Multi-Asset Income Fund and Putnam Short Term Investment Fund is included under “What are the funds’ and each underlying fund’s main investment strategies and related risks?”.
It is important to understand that you can lose money by investing in the fund. There is no guarantee that the fund will provide adequate income at and through an investor’s retirement.
The fund’s allocation of assets among asset classes (through the fund’s investment in its underlying funds, Putnam Multi-Asset Income Fund and Putnam Short Term Investment Fund) may hurt performance.
The fund invests in underlying funds and indirectly bears expenses related to the underlying funds. However, the Investment Manager has contractually agreed to waive fees, reimburse expenses of, or reimburse the fund through at least December 30, 2027 in an amount equal to the fund’s acquired fund fees and expenses (i.e., the fees and expenses incurred by the fund as a result of its investments in the underlying funds). The Investment Manager also has contractually agreed to waive fees and/or reimburse expenses of each class of shares of the fund through at least December 30, 2027 in an amount sufficient to result in total annual fund operating expenses for class A, C, R, R3, R4, R5, R6 and Y shares of the fund (exclusive of certain fees and expenses, including distribution fees (12b-1 fees)) that equal 0.55%, 0.55%, 0.70%, 0.70%, 0.70%, 0.55%, 0.45%, and 0.55%, respectively, of the fund’s average net assets. Although the Investment Manager serves as the investment adviser of the underlying funds, an underlying fund may change its investment program or policies without the fund’s approval, which could require the fund to reduce or eliminate its allocation to the underlying fund at an unfavorable time.
The fund also bears the following risks associated with the underlying funds:
Certain accounts or affiliates of the Investment Manager, including other funds advised by the Investment Manager or third parties, may from time to time own (beneficially or of record) or control a substantial amount of the fund’s shares, including through seed capital arrangements. Such shareholders may at times be considered to control the fund. Dispositions of a large number of shares by these shareholders may adversely affect the fund’s liquidity and net assets. These redemptions may also force the fund to sell securities, which may increase the fund’s brokerage costs.
There is no guarantee that the investment techniques, analyses, or judgments that we apply in making investment decisions for the underlying funds will produce the intended outcome or that the investments we select for the underlying funds will perform as well as other securities that were not selected for the underlying funds. We, or the underlying funds’ other service providers, may experience disruptions or operating errors that could negatively impact the underlying funds. If the quantitative models or data that are used in managing an underlying fund prove to be incorrect or incomplete, investment decisions made in reliance on the models or data may not produce the desired results and the fund may realize losses.
Putnam Multi-Asset Income Fund’s allocation of assets among asset classes may hurt performance. The value of investments in the underlying funds’ portfolios may fall or fail to rise over extended periods of time for a variety of reasons, including general economic, political or financial market conditions, investor sentiment and market perceptions, government actions, geopolitical events or changes, outbreaks of infectious illnesses or other widespread public health issues, and factors related to a specific issuer, asset class, geography, industry or sector. These and other factors may lead to increased volatility and reduced liquidity in the underlying funds’ portfolio
holdings, may negatively impact an underlying fund’s performance, and may exacerbate other risks to which an underlying fund is subject. Growth stocks may be more susceptible to earnings disappointments, and value stocks may fail to rebound. These risks are generally greater for small and midsize companies. In addition, small and midsize companies, at times, may not perform as well as stocks of larger companies or the stock market in general, and may be out of favor with investors for varying periods of time.
Fixed income investments are subject to interest rate risk, which is the risk that the value of the underlying funds’ fixed income investments is likely to fall if interest rates rise. Fixed income investments also are subject to credit risk, which is the risk that the issuers of the underlying funds’ fixed income investments may default on payment of interest or principal. Fixed income investments may be more susceptible to downgrades or defaults during economic downturns or other periods of economic stress. Interest rate risk is generally greater for longer-term bonds, and credit risk is generally greater for below-investment-grade bonds (sometimes referred to as “junk bonds”), which can be more sensitive to changes in markets, credit conditions, and interest rates and may be considered speculative. Default risk is generally higher for non-qualified mortgages. Mortgage-backed investments, unlike traditional debt investments, are also subject to prepayment risk, which means that they may increase in value less than other bonds when interest rates decline and decline in value more than other bonds when interest rates rise. The underlying fund may have to invest the proceeds from prepaid investments, including mortgage- and asset-backed investments, in other investments with less attractive terms and yields.
The value of international investments traded in foreign currencies may be adversely impacted by fluctuations in exchange rates. International investments, particularly investments in emerging markets, may carry risks associated with potentially less stable economies or governments (such as the risk of seizure by a foreign government, the imposition of currency or other restrictions, or high levels of inflation), and may be or become illiquid.
Putnam Multi-Asset Income Fund typically uses to a significant extent, and Putnam Short Term Investment Fund may use, derivatives, such as futures, options, swap contracts, and, for Putnam Multi-Asset Income Fund only, certain foreign currency transactions and warrants, for both hedging and investment purposes (although, in the case of Putnam Short Term Investment Fund, they do not represent a primary focus of the fund). Investing in Putnam Multi-Asset Income Fund will be riskier to the extent the fund uses derivatives to increase investment exposure (which may be considered leverage and magnify or otherwise increase investment losses to the fund). The value of derivatives may move in unexpected ways due to unanticipated market movements, the use of leverage, imperfect correlation between the derivative instrument and the reference asset, or other factors, especially in unusual market conditions, and volatility in the value of derivatives could adversely impact the underlying fund’s returns, obligations and exposures. Derivatives are also subject to other risks, including liquidity risk (e.g., liquidity demands arising from the requirement to make payments to a derivative counterparty), operational risk
(e.g., settlement issues or system failures), and legal risk (e.g., insufficient legal documentation or contract enforceability issues). Derivatives also involve the risk that an underlying fund may be unable to terminate or sell derivative positions when it wants to and that the other party to the instrument may fail to meet its obligations. The risk of a party failing to meet its obligations may increase if the underlying fund has significant investment exposure to that counterparty.
Putnam Multi-Asset Income Fund expects to engage in frequent trading. Funds with high turnover may be more likely to realize capital gains that must be distributed to shareholders as taxable income and may incur higher transaction costs than funds with relatively lower turnover, which may detract from performance.
The fund may not achieve its goal, and it is not intended to be a complete investment program. An investment in the fund is not insured or guaranteed by the Federal Deposit Insurance Corporation or any other government agency.
Investor profile
The fund is designed for investors in or near retirement or otherwise seeking an investment for use with a periodic withdrawal program. Investors are encouraged to seek the assistance of a financial professional in developing a periodic withdrawal program that is appropriate to their personal investment goals and financial circumstances. The fund also serves as the fund into which each of the Putnam Retirement Advantage Funds will be merged near the end of the target year of the Putnam Retirement Advantage Fund. The fund makes no representations regarding its suitability for any particular investor or periodic withdrawal program. Investors should understand that pursuing higher returns may involve higher volatility and that a fund’s performance results may not be sustainable.
The performance information below gives some indication of the risks associated with an investment in the fund by showing the fund’s performance year to year and over time. The bar chart does not reflect the impact of sales charges. If it did, performance would be lower. Please remember that past performance is not necessarily an indication of future results. Monthly performance figures for the fund are available at www.franklintempleton.com.
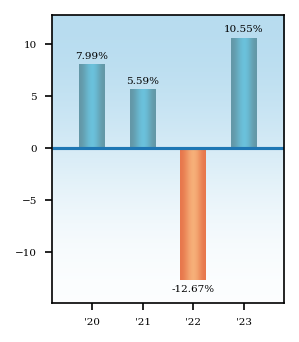
Average Annual Total Returns - Putnam Retirement Advantage Maturity Fund |
1 Year |
Since Inception |
Inception Date |
||
|---|---|---|---|---|---|
| Class A Maturity | 6.13% | [1] | 1.39% | [1] | Dec. 31, 2019 |
| Class A Maturity | After Taxes on Distributions | 5.09% | [1] | 0.51% | [1] | Dec. 31, 2019 |
| Class A Maturity | After Taxes on Distributions and Sales | 3.70% | [1] | 0.75% | [1] | Dec. 31, 2019 |
| Class C Maturity | 8.78% | [1] | 1.68% | [1] | Dec. 31, 2019 |
| Class R Maturity | 10.04% | [1] | 2.01% | [1] | Dec. 31, 2019 |
| Class R3 Maturity | 10.34% | [1] | 2.26% | [1] | Dec. 31, 2019 |
| Class R4 Maturity | 10.68% | [1] | 2.50% | [1] | Dec. 31, 2019 |
| Class R5 Maturity | 10.89% | [1] | 2.67% | [1] | Dec. 31, 2019 |
| Class R6 Maturity | 11.01% | 2.79% | Dec. 31, 2019 | ||
| Class Y Maturity | 10.89% | [1] | 2.67% | [1] | Dec. 31, 2019 |
| Bloomberg U.S. Aggregate Index (no deduction for fees, expenses or taxes) | 5.53% | [2] | (3.26%) | [2] | Dec. 31, 2019 |
| Russell 3000 Index (no deduction for fees, expenses or taxes) | 25.96% | [2] | 8.80% | [2] | Dec. 31, 2019 |
| S&P Target Date To Retirement Income Index | 10.55% | [2] | 3.10% | [2] | Dec. 31, 2019 |
| [1] | Performance for classes A, C, R, R3, R4, R5, and Y shares prior to their inception (9/1/20) is derived from the historical performance of class R6 shares, adjusted for the higher operating expenses and, for class A and C shares, higher sales charges (in the case of after sales-charge returns) applicable to such classes. |
| [2] | The table above compares the fund’s returns to the performance of three indexes: (i) Russell 3000 Index, a broad measure of market performance; (ii) Bloomberg U.S. Aggregate Index, also a broad measure of market performance; and (iii) S&P Target Date To Retirement Income Index, an additional index that the Investment Manager believes more closely reflect the fund’s principal investment objective and strategies. |
| After-tax returns reflect the historical highest individual federal marginal income tax rates and do not reflect state and local taxes. Actual after-tax returns depend on an investor’s tax situation and may differ from those shown. After-tax returns are shown for class A shares only and will vary for other classes. These after-tax returns do not apply if you hold your fund shares through a 401(k) plan, an IRA, or another tax-advantaged arrangement. |