Shareholder Report
|
12 Months Ended |
|
Oct. 31, 2024
USD ($)
Holding
|
|---|
| Shareholder Report [Line Items] |
|
| Document Type |
N-CSR
|
| Amendment Flag |
false
|
| Registrant Name |
Advisors' Inner Circle Fund
|
| Entity Central Index Key |
0000878719
|
| Entity Investment Company Type |
N-1A
|
| Document Period End Date |
Oct. 31, 2024
|
| C000174813 |
|
| Shareholder Report [Line Items] |
|
| Fund Name |
Acadian Emerging Markets Portfolio
|
| Class Name |
I Class Shares
|
| Trading Symbol |
AEMZX
|
| Annual or Semi-Annual Statement [Text Block] |
This annual shareholder report contains important information about I Class Shares of the Acadian Emerging Markets Portfolio (the "Fund") for the period from November 1, 2023 to October 31, 2024.
|
| Shareholder Report Annual or Semi-Annual |
annual shareholder report
|
| Additional Information [Text Block] |
You can find additional information about the Fund at https://www.acadian-asset.com/emfund. You can also request this information by contacting us at 1-866-AAM-6161 (1-866-226-6161).
|
| Additional Information Phone Number |
1-866-AAM-6161 (1-866-226-6161)
|
| Additional Information Website |
https://www.acadian-asset.com/emfund
|
| Expenses [Text Block] |
What were the Fund costs for the last year?(based on a hypothetical $10,000 investment) Fund Name | Costs of a $10,000 investment | Costs paid as a percentage of a $10,000 investment |
|---|
Acadian Emerging Markets Portfolio, I Class Shares | $128 | 1.12% |
|
| Expenses Paid, Amount |
$ 128
|
| Expense Ratio, Percent |
1.12%
|
| Factors Affecting Performance [Text Block] |
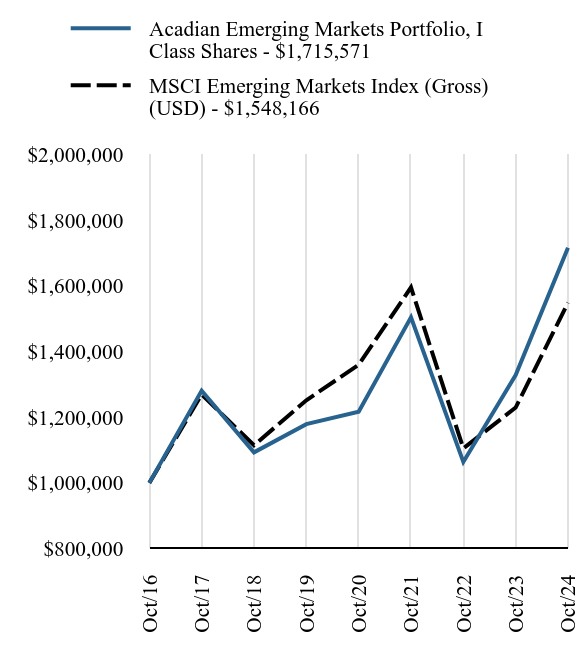
How did the Fund perform in the last year?Portfolio Performance Review For the twelve months ended October 31, 2024, the Acadian Emerging Markets Portfolio I Class returned 29.2% (on a NAV basis), versus 26.0% for the MSCI Emerging Markets Index, a widely followed emerging markets benchmark. Portfolio Structure The portfolio was invested in a broad range of emerging companies and markets over the period. The investment process considered both bottom-up company attractiveness and top-down country and industry ratings, combined with benchmark-relative risk controls, to determine individual stock positions. Significant country overweight positions during the period were Taiwan, China, and Hungary. The portfolio was generally underweighted relative to the benchmark in South Korea, India, and South Africa. At the sector level, the portfolio was focused on Energy, Information Technology, and Communication Services, while Consumer Staples, Financials, and Materials were the greatest underweights. |
| Performance Past Does Not Indicate Future [Text] |
Past performance is not indicative of future performance.
|
| Line Graph [Table Text Block] |
| Acadian Emerging Markets Portfolio, I Class Shares - $1715571 | MSCI Emerging Markets Index (Gross) (USD) - $1548166 |
|---|
Oct/16 | $1000000 | $1000000 | Oct/17 | $1280132 | $1269080 | Oct/18 | $1092890 | $1114412 | Oct/19 | $1178827 | $1251404 | Oct/20 | $1216571 | $1359275 | Oct/21 | $1503785 | $1594903 | Oct/22 | $1063753 | $1104824 | Oct/23 | $1328354 | $1229223 | Oct/24 | $1715571 | $1548166 |
|
| Average Annual Return [Table Text Block] |
Fund/Index Name | 1 Year | 5 Years | Annualized
Since
Inception |
|---|
Acadian Emerging Markets Portfolio, I Class Shares | 29.15% | 7.79% | 6.97% | MSCI Emerging Markets Index (Gross) (USD) | 25.95% | 4.35% | 5.61% |
|
| No Deduction of Taxes [Text Block] |
The table and graph presented above do not reflect the deduction of taxes a shareholder would pay on Fund distributions or the redemption of Fund shares.
|
| AssetsNet |
$ 961,602,849
|
| Holdings Count | Holding |
659
|
| Advisory Fees Paid, Amount |
$ 6,299,239
|
| InvestmentCompanyPortfolioTurnover |
60.00%
|
| Additional Fund Statistics [Text Block] |
Key Fund Statistics as of October 31, 2024 | Total Net Assets | Number of Holdings | Total Advisory Fees Paid | Portfolio Turnover Rate |
|---|
| $961,602,849 | 659 | $6,299,239 | 60% |
|
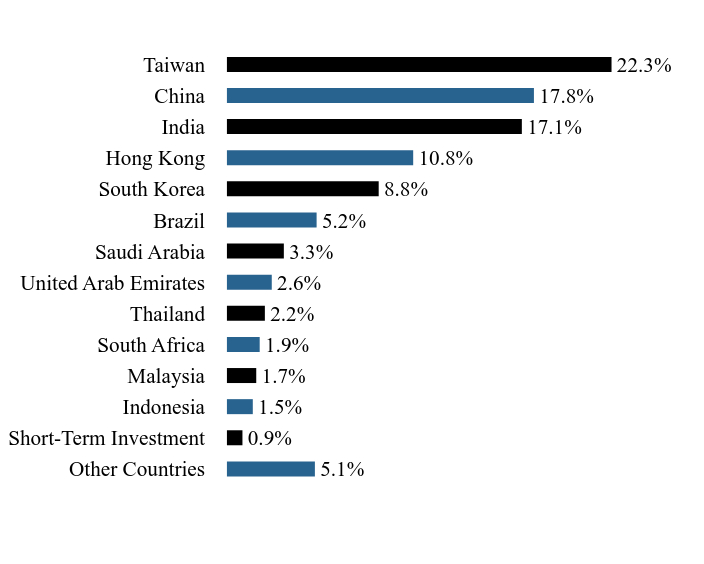
| Holdings [Text Block] |
Country WeightingsFootnote Reference*Value | Value |
|---|
Other Countries | 5.1% | Short-Term Investment | 0.9% | Indonesia | 1.5% | Malaysia | 1.7% | South Africa | 1.9% | Thailand | 2.2% | United Arab Emirates | 2.6% | Saudi Arabia | 3.3% | Brazil | 5.2% | South Korea | 8.8% | Hong Kong | 10.8% | India | 17.1% | China | 17.8% | Taiwan | 22.3% |
| Footnote | Description | Footnote* | Percentages are calculated based on total net assets. |
|
| Largest Holdings [Text Block] |
Holding Name | | | Percentage of
Total Net AssetsFootnote Reference(A) |
|---|
Taiwan Semiconductor Manufacturing | | | 9.7% | Tencent Holdings | | | 4.4% | China Construction Bank, Cl H | | | 2.9% | Alibaba Group Holding | | | 2.7% | Meituan, Cl B | | | 2.0% | HCL Technologies | | | 1.9% | MediaTek | | | 1.7% | Hon Hai Precision Industry | | | 1.6% | OTP Bank Nyrt | | | 1.2% | Kuaishou Technology, Cl B | | | 1.2% |
| Footnote | Description | Footnote(A) | Short-Term Investments are not shown in the top ten chart. |
|
| Material Fund Change [Text Block] |
There were no material changes during the reporting period. |
| Updated Prospectus Phone Number |
1-866-AAM-6161 (1-866-226-6161)
|
| Updated Prospectus Web Address |
https://www.acadian-asset.com/emfund
|
| C000015706 |
|
| Shareholder Report [Line Items] |
|
| Fund Name |
Acadian Emerging Markets Portfolio
|
| Class Name |
Investor Class Shares
|
| Trading Symbol |
AEMGX
|
| Annual or Semi-Annual Statement [Text Block] |
This annual shareholder report contains important information about Investor Class Shares of the Acadian Emerging Markets Portfolio (the "Fund") for the period from November 1, 2023 to October 31, 2024.
|
| Shareholder Report Annual or Semi-Annual |
annual shareholder report
|
| Additional Information [Text Block] |
You can find additional information about the Fund at https://www.acadian-asset.com/emfund. You can also request this information by contacting us at 1-866-AAM-6161 (1-866-226-6161).
|
| Additional Information Phone Number |
1-866-AAM-6161 (1-866-226-6161)
|
| Additional Information Website |
https://www.acadian-asset.com/emfund
|
| Expenses [Text Block] |
What were the Fund costs for the last year?(based on a hypothetical $10,000 investment) Fund Name | Costs of a $10,000 investment | Costs paid as a percentage of a $10,000 investment |
|---|
Acadian Emerging Markets Portfolio, Investor Class Shares | $153 | 1.34% |
|
| Expenses Paid, Amount |
$ 153
|
| Expense Ratio, Percent |
1.34%
|
| Factors Affecting Performance [Text Block] |
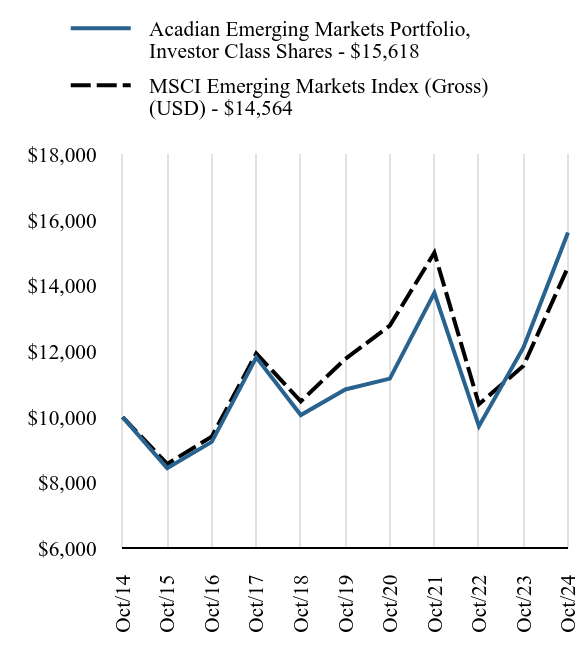
How did the Fund perform in the last year?Portfolio Performance Review For the twelve months ended October 31, 2024, the Acadian Emerging Markets Portfolio Investor Class returned 28.9% (on a NAV basis), versus 26.0% for the MSCI Emerging Markets Index, a widely followed emerging markets benchmark. Portfolio Structure The portfolio was invested in a broad range of emerging companies and markets over the period. The investment process considered both bottom-up company attractiveness and top-down country and industry ratings, combined with benchmark-relative risk controls, to determine individual stock positions. Significant country overweight positions during the period were Taiwan, China, and Hungary. The portfolio was generally underweighted relative to the benchmark in South Korea, India, and South Africa. At the sector level, the portfolio was focused on Energy, Information Technology, and Communication Services, while Consumer Staples, Financials, and Materials were the greatest underweights. |
| Performance Past Does Not Indicate Future [Text] |
Past performance is not indicative of future performance.
|
| Line Graph [Table Text Block] |
| Acadian Emerging Markets Portfolio, Investor Class Shares - $15618 | MSCI Emerging Markets Index (Gross) (USD) - $14564 |
|---|
Oct/14 | $10000 | $10000 | Oct/15 | $8449 | $8578 | Oct/16 | $9246 | $9407 | Oct/17 | $11821 | $11938 | Oct/18 | $10065 | $10483 | Oct/19 | $10842 | $11772 | Oct/20 | $11172 | $12787 | Oct/21 | $13781 | $15003 | Oct/22 | $9725 | $10393 | Oct/23 | $12120 | $11563 | Oct/24 | $15618 | $14564 |
|
| Average Annual Return [Table Text Block] |
Fund/Index Name | 1 Year | 5 Years | 10 Years |
|---|
Acadian Emerging Markets Portfolio, Investor Class Shares | 28.86% | 7.57% | 4.56% | MSCI Emerging Markets Index (Gross) (USD) | 25.95% | 4.35% | 3.83% |
|
| No Deduction of Taxes [Text Block] |
The table and graph presented above do not reflect the deduction of taxes a shareholder would pay on Fund distributions or the redemption of Fund shares.
|
| AssetsNet |
$ 961,602,849
|
| Holdings Count | Holding |
659
|
| Advisory Fees Paid, Amount |
$ 6,299,239
|
| InvestmentCompanyPortfolioTurnover |
60.00%
|
| Additional Fund Statistics [Text Block] |
Key Fund Statistics as of October 31, 2024 | Total Net Assets | Number of Holdings | Total Advisory Fees Paid | Portfolio Turnover Rate |
|---|
| $961,602,849 | 659 | $6,299,239 | 60% |
|
| Holdings [Text Block] |
Country WeightingsFootnote Reference*Value | Value |
|---|
Other Countries | 5.1% | Short-Term Investment | 0.9% | Indonesia | 1.5% | Malaysia | 1.7% | South Africa | 1.9% | Thailand | 2.2% | United Arab Emirates | 2.6% | Saudi Arabia | 3.3% | Brazil | 5.2% | South Korea | 8.8% | Hong Kong | 10.8% | India | 17.1% | China | 17.8% | Taiwan | 22.3% |
| Footnote | Description | Footnote* | Percentages are calculated based on total net assets. |
|
| Largest Holdings [Text Block] |
Holding Name | | | Percentage of
Total Net AssetsFootnote Reference(A) |
|---|
Taiwan Semiconductor Manufacturing | | | 9.7% | Tencent Holdings | | | 4.4% | China Construction Bank, Cl H | | | 2.9% | Alibaba Group Holding | | | 2.7% | Meituan, Cl B | | | 2.0% | HCL Technologies | | | 1.9% | MediaTek | | | 1.7% | Hon Hai Precision Industry | | | 1.6% | OTP Bank Nyrt | | | 1.2% | Kuaishou Technology, Cl B | | | 1.2% |
| Footnote | Description | Footnote(A) | Short-Term Investments are not shown in the top ten chart. |
|
| Material Fund Change [Text Block] |
There were no material changes during the reporting period. |
| Updated Prospectus Phone Number |
1-866-AAM-6161 (1-866-226-6161)
|
| Updated Prospectus Web Address |
https://www.acadian-asset.com/emfund
|
| C000174812 |
|
| Shareholder Report [Line Items] |
|
| Fund Name |
Acadian Emerging Markets Portfolio
|
| Class Name |
Y Class Shares
|
| Trading Symbol |
AEMVX
|
| Annual or Semi-Annual Statement [Text Block] |
This annual shareholder report contains important information about Y Class Shares of the Acadian Emerging Markets Portfolio (the "Fund") for the period from November 1, 2023 to October 31, 2024.
|
| Shareholder Report Annual or Semi-Annual |
annual shareholder report
|
| Additional Information [Text Block] |
You can find additional information about the Fund at https://www.acadian-asset.com/emfund. You can also request this information by contacting us at 1-866-AAM-6161 (1-866-226-6161).
|
| Additional Information Phone Number |
1-866-AAM-6161 (1-866-226-6161)
|
| Additional Information Website |
https://www.acadian-asset.com/emfund
|
| Expenses [Text Block] |
What were the Fund costs for the last year?(based on a hypothetical $10,000 investment) Fund Name | Costs of a $10,000 investment | Costs paid as a percentage of a $10,000 investment |
|---|
Acadian Emerging Markets Portfolio, Y Class Shares | $140 | 1.22% |
|
| Expenses Paid, Amount |
$ 140
|
| Expense Ratio, Percent |
1.22%
|
| Factors Affecting Performance [Text Block] |
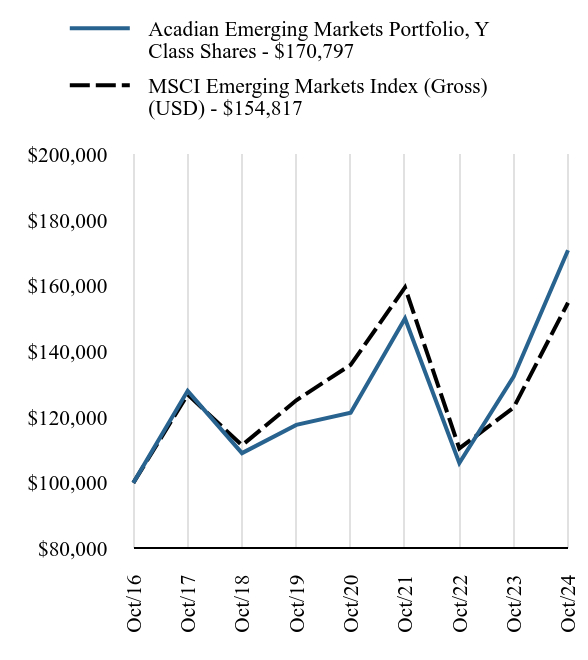
How did the Fund perform in the last year?Portfolio Performance Review For the twelve months ended October 31, 2024, the Acadian Emerging Markets Portfolio Y Class returned 29.1% (on a NAV basis), versus 26.0% for the MSCI Emerging Markets Index, a widely followed emerging markets benchmark. Portfolio Structure The portfolio was invested in a broad range of emerging companies and markets over the period. The investment process considered both bottom-up company attractiveness and top-down country and industry ratings, combined with benchmark-relative risk controls, to determine individual stock positions. Significant country overweight positions during the period were Taiwan, China, and Hungary. The portfolio was generally underweighted relative to the benchmark in South Korea, India, and South Africa. At the sector level, the portfolio was focused on Energy, Information Technology, and Communication Services, while Consumer Staples, Financials, and Materials were the greatest underweights. |
| Performance Past Does Not Indicate Future [Text] |
Past performance is not indicative of future performance.
|
| Line Graph [Table Text Block] |
| Acadian Emerging Markets Portfolio, Y Class Shares - $170797 | MSCI Emerging Markets Index (Gross) (USD) - $154817 |
|---|
Oct/16 | $100000 | $100000 | Oct/17 | $128013 | $126908 | Oct/18 | $109053 | $111441 | Oct/19 | $117659 | $125140 | Oct/20 | $121370 | $135928 | Oct/21 | $150019 | $159490 | Oct/22 | $106046 | $110482 | Oct/23 | $132349 | $122922 | Oct/24 | $170797 | $154817 |
|
| Average Annual Return [Table Text Block] |
Fund/Index Name | 1 Year | 5 Years | Annualized
Since
Inception |
|---|
Acadian Emerging Markets Portfolio, Y Class Shares | 29.05% | 7.74% | 6.92% | MSCI Emerging Markets Index (Gross) (USD) | 25.95% | 4.35% | 5.61% |
|
| No Deduction of Taxes [Text Block] |
The table and graph presented above do not reflect the deduction of taxes a shareholder would pay on Fund distributions or the redemption of Fund shares.
|
| AssetsNet |
$ 961,602,849
|
| Holdings Count | Holding |
659
|
| Advisory Fees Paid, Amount |
$ 6,299,239
|
| InvestmentCompanyPortfolioTurnover |
60.00%
|
| Additional Fund Statistics [Text Block] |
Key Fund Statistics as of October 31, 2024 | Total Net Assets | Number of Holdings | Total Advisory Fees Paid | Portfolio Turnover Rate |
|---|
| $961,602,849 | 659 | $6,299,239 | 60% |
|
| Holdings [Text Block] |
Country WeightingsFootnote Reference*Value | Value |
|---|
Other Countries | 5.1% | Short-Term Investment | 0.9% | Indonesia | 1.5% | Malaysia | 1.7% | South Africa | 1.9% | Thailand | 2.2% | United Arab Emirates | 2.6% | Saudi Arabia | 3.3% | Brazil | 5.2% | South Korea | 8.8% | Hong Kong | 10.8% | India | 17.1% | China | 17.8% | Taiwan | 22.3% |
| Footnote | Description | Footnote* | Percentages are calculated based on total net assets. |
|
| Largest Holdings [Text Block] |
Holding Name | | | Percentage of
Total Net AssetsFootnote Reference(A) |
|---|
Taiwan Semiconductor Manufacturing | | | 9.7% | Tencent Holdings | | | 4.4% | China Construction Bank, Cl H | | | 2.9% | Alibaba Group Holding | | | 2.7% | Meituan, Cl B | | | 2.0% | HCL Technologies | | | 1.9% | MediaTek | | | 1.7% | Hon Hai Precision Industry | | | 1.6% | OTP Bank Nyrt | | | 1.2% | Kuaishou Technology, Cl B | | | 1.2% |
| Footnote | Description | Footnote(A) | Short-Term Investments are not shown in the top ten chart. |
|
| Material Fund Change [Text Block] |
There were no material changes during the reporting period. |
| Updated Prospectus Phone Number |
1-866-AAM-6161 (1-866-226-6161)
|
| Updated Prospectus Web Address |
https://www.acadian-asset.com/emfund
|