Shareholder Report
Oct. 31, 2024
USD ($)
Holding
What were the Fund costs for the last year?
(Based on a hypothetical $10,000 investment)
| Class Name | Costs of a $10,000 investment | Costs paid as a percentage of a $10,000 investment |
| Class A | $133 | 1.17% |
How did the Fund perform last year and what affected the Fund performance?
- For the fiscal year ended October 31, 2024, the Fund’s Class A shares at NAV returned 27.66%. For the same period, the Fund’s broad-based benchmark, the Standard & Poor’s 500 Total Return Index, returned 38.02%. The performance benchmark, the Russell Mid Cap Value Total Return Index, returned 34.03% over the period.
- The Fund’s security selection in both the information technology and financial sectors was the largest contributor to relative results versus the performance benchmark during the period.
- Security selection in the energy and industrials sectors detracted from security selection results for the fiscal year ended October 31, 2024.
- The Fund’s overweight exposure to the energy and consumer staples sectors also detracted from benchmark relative results.
Fund Performance
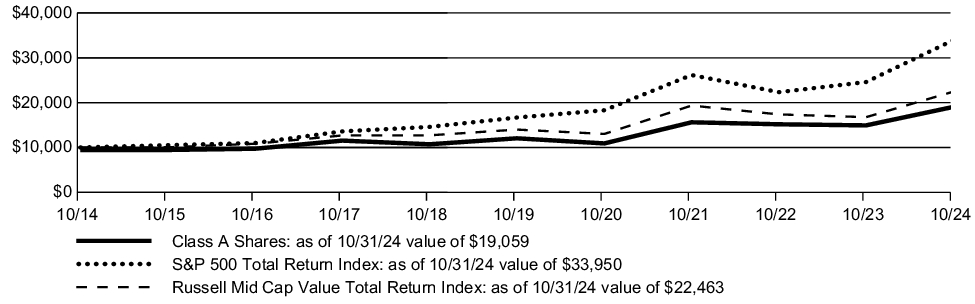
The line graph below shows the change in value of a $10,000 investment made in Class A shares of the Fund at public offering price during the periods shown, compared to that of the S&P 500 Total Return Index and the Russell Mid Cap Value Total Return Index.
GROWTH OF $10,000
| AVERAGE ANNUAL TOTAL RETURN | 1 Year | 5 Years | 10 Years |
| Class A (with sales charge) | 20.32% | 8.31% | 6.66% |
| Class A (without sales charge) | 27.66% | 9.61% | 7.30% |
| S&P 500 Total Return Index | 38.02% | 15.27% | 13.00% |
| Russell Mid Cap Value Total Return Index | 34.03% | 9.93% | 8.43% |
The graph and table do not reflect the deduction of taxes that a shareholder would pay on fund distributions or redemption of fund shares.
KEY FUND STATISTICS
(as of October 31, 2024)
(as of October 31, 2024)
| Fund net assets | $731,284,737 |
| Total number of portfolio holdings | 66^^ |
| Total advisory fee paid | $5,414,675 |
| Portfolio turnover rate | 33% |
| ^^ |
Excluding short-term investments and all derivative contracts except for options purchased. |
SECTOR DISTRIBUTION
(as of October 31, 2024 )*
(as of October 31, 2024 )*
| Financials | 25.0% |
| Industrials | 14.3% |
| Consumer Discretionary | 9.8% |
| Real Estate | 7.6% |
| Energy | 7.3% |
| Utilities | 7.2% |
| Basic Materials | 7.0% |
| Information Technology | 6.9% |
| Consumer Staples | 6.9% |
| Health Care | 5.1% |
| Communication Services | 2.9% |
| * |
As a percentage of total investments excluding short-term investments and all derivative contracts except for options purchased. |
Material Fund Changes
Amundi Asset Management US, Inc. (the “Adviser”), the Fund’s investment adviser, is currently an indirect, wholly-owned subsidiary of Amundi. On July 9, 2024, Amundi announced that it had entered into a definitive agreement with Victory Capital Holdings, Inc. (“Victory Capital”) to combine the Adviser with Victory Capital, and for Amundi to become a strategic shareholder of Victory Capital (the “Transaction”). Victory Capital is headquartered in San Antonio, Texas. The closing of the Transaction is subject to certain regulatory approvals and other conditions. There is no assurance that the Transaction will close.
The closing of the Transaction would cause the Fund’s current investment advisory agreement with the Adviser to terminate. Under the terms of the Transaction, the Fund’s Board of Trustees will be asked to approve a reorganization of the Fund into a corresponding, newly established Victory Fund advised by Victory Capital Management Inc., an affiliate of Victory Capital. The proposed reorganization of the Fund would be sought in connection with the closing of the Transaction. If approved by the Board, the proposal to reorganize the Fund will be submitted to the shareholders of the Fund for their approval. There is no assurance that the Board or the shareholders of the Fund will approve the proposal to reorganize the Fund.
For more complete information, you may review the Fund's next prospectus, which we expect to be available by March 3, 2025 at https://www.amundi.com/usinvestors/Products/Mutual-Funds or upon request at 1-800-225-6292.
For more complete information, you may review the Fund's next prospectus, which we expect to be available by March 3, 2025 at https://www.amundi.com/usinvestors/Products/Mutual-Funds or upon request at 1-800-225-6292.
What were the Fund costs for the last year?
(Based on a hypothetical $10,000 investment)
| Class Name | Costs of a $10,000 investment | Costs paid as a percentage of a $10,000 investment |
| Class C | $227 | 2.00% |
How did the Fund perform last year and what affected the Fund performance?
- For the fiscal year ended October 31, 2024, the Fund’s Class C shares at NAV returned 26.53%. For the same period, the Fund’s broad-based benchmark, the Standard & Poor’s 500 Total Return Index, returned 38.02%. The performance benchmark, the Russell Mid Cap Value Total Return Index, returned 34.03% over the period.
- The Fund’s security selection in both the information technology and financial sectors was the largest contributor to relative results versus the performance benchmark during the period.
- Security selection in the energy and industrials sectors detracted from security selection results for the fiscal year ended October 31, 2024.
- The Fund’s overweight exposure to the energy and consumer staples sectors also detracted from benchmark relative results.
Fund Performance
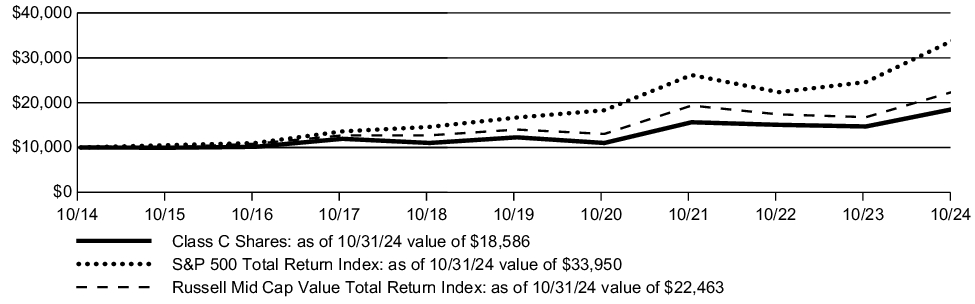
The line graph below shows the change in value of a $10,000 investment made in Class C shares of the Fund during the periods shown, compared to that of the S&P 500 Total Return Index and the Russell Mid Cap Value Total Return Index.
GROWTH OF $10,000
| AVERAGE ANNUAL TOTAL RETURN | 1 Year | 5 Years | 10 Years |
| Class C (with contingent deferred sales charge) | 25.53% | 8.67% | 6.39% |
| Class C (without contingent deferred sales charge) | 26.53% | 8.67% | 6.39% |
| S&P 500 Total Return Index | 38.02% | 15.27% | 13.00% |
| Russell Mid Cap Value Total Return Index | 34.03% | 9.93% | 8.43% |
The graph and table do not reflect the deduction of taxes that a shareholder would pay on fund distributions or redemption of fund shares.
KEY FUND STATISTICS
(as of October 31, 2024)
(as of October 31, 2024)
| Fund net assets | $731,284,737 |
| Total number of portfolio holdings | 66^^ |
| Total advisory fee paid | $5,414,675 |
| Portfolio turnover rate | 33% |
| ^^ |
Excluding short-term investments and all derivative contracts except for options purchased. |
SECTOR DISTRIBUTION
(as of October 31, 2024 )*
(as of October 31, 2024 )*
| Financials | 25.0% |
| Industrials | 14.3% |
| Consumer Discretionary | 9.8% |
| Real Estate | 7.6% |
| Energy | 7.3% |
| Utilities | 7.2% |
| Basic Materials | 7.0% |
| Information Technology | 6.9% |
| Consumer Staples | 6.9% |
| Health Care | 5.1% |
| Communication Services | 2.9% |
| * |
As a percentage of total investments excluding short-term investments and all derivative contracts except for options purchased. |
Material Fund Changes
Amundi Asset Management US, Inc. (the “Adviser”), the Fund’s investment adviser, is currently an indirect, wholly-owned subsidiary of Amundi. On July 9, 2024, Amundi announced that it had entered into a definitive agreement with Victory Capital Holdings, Inc. (“Victory Capital”) to combine the Adviser with Victory Capital, and for Amundi to become a strategic shareholder of Victory Capital (the “Transaction”). Victory Capital is headquartered in San Antonio, Texas. The closing of the Transaction is subject to certain regulatory approvals and other conditions. There is no assurance that the Transaction will close.
The closing of the Transaction would cause the Fund’s current investment advisory agreement with the Adviser to terminate. Under the terms of the Transaction, the Fund’s Board of Trustees will be asked to approve a reorganization of the Fund into a corresponding, newly established Victory Fund advised by Victory Capital Management Inc., an affiliate of Victory Capital. The proposed reorganization of the Fund would be sought in connection with the closing of the Transaction. If approved by the Board, the proposal to reorganize the Fund will be submitted to the shareholders of the Fund for their approval. There is no assurance that the Board or the shareholders of the Fund will approve the proposal to reorganize the Fund.
For more complete information, you may review the Fund's next prospectus, which we expect to be available by March 3, 2025 at https://www.amundi.com/usinvestors/Products/Mutual-Funds or upon request at 1-800-225-6292.
For more complete information, you may review the Fund's next prospectus, which we expect to be available by March 3, 2025 at https://www.amundi.com/usinvestors/Products/Mutual-Funds or upon request at 1-800-225-6292.
What were the Fund costs for the last year?
(Based on a hypothetical $10,000 investment)
| Class Name | Costs of a $10,000 investment | Costs paid as a percentage of a $10,000 investment |
| Class K | $100 | 0.88% |
How did the Fund perform last year and what affected the Fund performance?
- For the fiscal year ended October 31, 2024, the Fund’s Class K shares at NAV returned 28.02%. For the same period, the Fund’s broad-based benchmark, the Standard & Poor’s 500 Total Return Index, returned 38.02%. The performance benchmark, the Russell Mid Cap Value Total Return Index, returned 34.03% over the period.
- The Fund’s security selection in both the information technology and financial sectors was the largest contributor to relative results versus the performance benchmark during the period.
- Security selection in the energy and industrials sectors detracted from security selection results for the fiscal year ended October 31, 2024.
- The Fund’s overweight exposure to the energy and consumer staples sectors also detracted from benchmark relative results.
Fund Performance
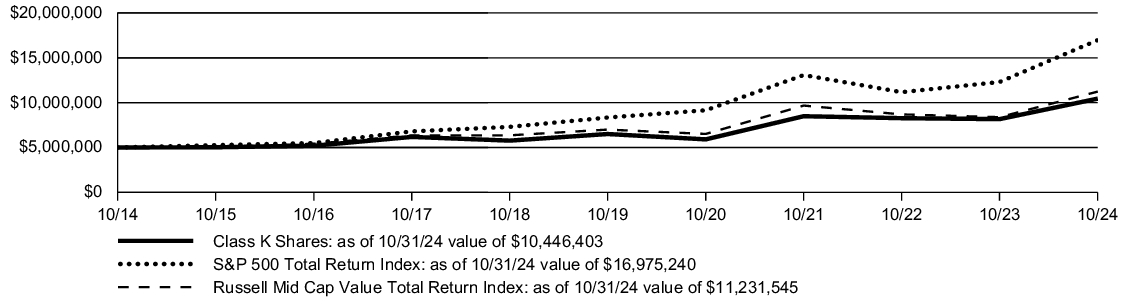
The line graph below shows the change in value of a $5 million investment made in Class K shares of the Fund during the periods shown, compared to that of the S&P 500 Total Return Index and the Russell Mid Cap Value Total Return Index.
GROWTH OF $5 million
| AVERAGE ANNUAL TOTAL RETURN | 1 Year | 5 Years | 10 Years |
| Class K | 28.02% | 9.95% | 7.65% |
| S&P 500 Total Return Index | 38.02% | 15.27% | 13.00% |
| Russell Mid Cap Value Total Return Index | 34.03% | 9.93% | 8.43% |
The graph and table do not reflect the deduction of taxes that a shareholder would pay on fund distributions or redemption of fund shares.
KEY FUND STATISTICS
(as of October 31, 2024)
(as of October 31, 2024)
| Fund net assets | $731,284,737 |
| Total number of portfolio holdings | 66^^ |
| Total advisory fee paid | $5,414,675 |
| Portfolio turnover rate | 33% |
| ^^ |
Excluding short-term investments and all derivative contracts except for options purchased. |
SECTOR DISTRIBUTION
(as of October 31, 2024 )*
(as of October 31, 2024 )*
| Financials | 25.0% |
| Industrials | 14.3% |
| Consumer Discretionary | 9.8% |
| Real Estate | 7.6% |
| Energy | 7.3% |
| Utilities | 7.2% |
| Basic Materials | 7.0% |
| Information Technology | 6.9% |
| Consumer Staples | 6.9% |
| Health Care | 5.1% |
| Communication Services | 2.9% |
| * |
As a percentage of total investments excluding short-term investments and all derivative contracts except for options purchased. |
Material Fund Changes
Amundi Asset Management US, Inc. (the “Adviser”), the Fund’s investment adviser, is currently an indirect, wholly-owned subsidiary of Amundi. On July 9, 2024, Amundi announced that it had entered into a definitive agreement with Victory Capital Holdings, Inc. (“Victory Capital”) to combine the Adviser with Victory Capital, and for Amundi to become a strategic shareholder of Victory Capital (the “Transaction”). Victory Capital is headquartered in San Antonio, Texas. The closing of the Transaction is subject to certain regulatory approvals and other conditions. There is no assurance that the Transaction will close.
The closing of the Transaction would cause the Fund’s current investment advisory agreement with the Adviser to terminate. Under the terms of the Transaction, the Fund’s Board of Trustees will be asked to approve a reorganization of the Fund into a corresponding, newly established Victory Fund advised by Victory Capital Management Inc., an affiliate of Victory Capital. The proposed reorganization of the Fund would be sought in connection with the closing of the Transaction. If approved by the Board, the proposal to reorganize the Fund will be submitted to the shareholders of the Fund for their approval. There is no assurance that the Board or the shareholders of the Fund will approve the proposal to reorganize the Fund.
For more complete information, you may review the Fund's next prospectus, which we expect to be available by March 3, 2025 at https://www.amundi.com/usinvestors/Products/Mutual-Funds or upon request at 1-800-225-6292.
For more complete information, you may review the Fund's next prospectus, which we expect to be available by March 3, 2025 at https://www.amundi.com/usinvestors/Products/Mutual-Funds or upon request at 1-800-225-6292.
What were the Fund costs for the last year?
(Based on a hypothetical $10,000 investment)
| Class Name | Costs of a $10,000 investment | Costs paid as a percentage of a $10,000 investment |
| Class R | $183 | 1.61% |
How did the Fund perform last year and what affected the Fund performance?
- For the fiscal year ended October 31, 2024, the Fund’s Class R shares at NAV returned 27.07%. For the same period, the Fund’s broad-based benchmark, the Standard & Poor’s 500 Total Return Index, returned 38.02%. The performance benchmark, the Russell Mid Cap Value Total Return Index, returned 34.03% over the period.
- The Fund’s security selection in both the information technology and financial sectors was the largest contributor to relative results versus the performance benchmark during the period.
- Security selection in the energy and industrials sectors detracted from security selection results for the fiscal year ended October 31, 2024.
- The Fund’s overweight exposure to the energy and consumer staples sectors also detracted from benchmark relative results.
Fund Performance
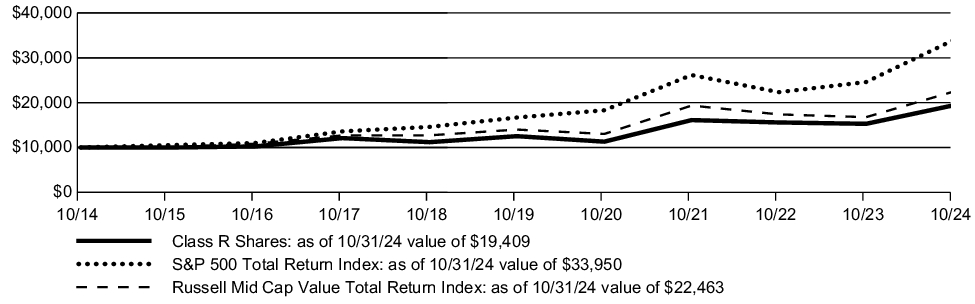
The line graph below shows the change in value of a $10,000 investment made in Class R shares of the Fund during the periods shown, compared to that of the S&P 500 Total Return Index and the Russell Mid Cap Value Total Return Index.
GROWTH OF $10,000
| AVERAGE ANNUAL TOTAL RETURN | 1 Year | 5 Years | 10 Years |
| Class R | 27.07% | 9.16% | 6.86% |
| S&P 500 Total Return Index | 38.02% | 15.27% | 13.00% |
| Russell Mid Cap Value Total Return Index | 34.03% | 9.93% | 8.43% |
The graph and table do not reflect the deduction of taxes that a shareholder would pay on fund distributions or redemption of fund shares.
KEY FUND STATISTICS
(as of October 31, 2024)
(as of October 31, 2024)
| Fund net assets | $731,284,737 |
| Total number of portfolio holdings | 66^^ |
| Total advisory fee paid | $5,414,675 |
| Portfolio turnover rate | 33% |
| ^^ |
Excluding short-term investments and all derivative contracts except for options purchased. |
SECTOR DISTRIBUTION
(as of October 31, 2024 )*
(as of October 31, 2024 )*
| Financials | 25.0% |
| Industrials | 14.3% |
| Consumer Discretionary | 9.8% |
| Real Estate | 7.6% |
| Energy | 7.3% |
| Utilities | 7.2% |
| Basic Materials | 7.0% |
| Information Technology | 6.9% |
| Consumer Staples | 6.9% |
| Health Care | 5.1% |
| Communication Services | 2.9% |
| * |
As a percentage of total investments excluding short-term investments and all derivative contracts except for options purchased. |
Material Fund Changes
Amundi Asset Management US, Inc. (the “Adviser”), the Fund’s investment adviser, is currently an indirect, wholly-owned subsidiary of Amundi. On July 9, 2024, Amundi announced that it had entered into a definitive agreement with Victory Capital Holdings, Inc. (“Victory Capital”) to combine the Adviser with Victory Capital, and for Amundi to become a strategic shareholder of Victory Capital (the “Transaction”). Victory Capital is headquartered in San Antonio, Texas. The closing of the Transaction is subject to certain regulatory approvals and other conditions. There is no assurance that the Transaction will close.
The closing of the Transaction would cause the Fund’s current investment advisory agreement with the Adviser to terminate. Under the terms of the Transaction, the Fund’s Board of Trustees will be asked to approve a reorganization of the Fund into a corresponding, newly established Victory Fund advised by Victory Capital Management Inc., an affiliate of Victory Capital. The proposed reorganization of the Fund would be sought in connection with the closing of the Transaction. If approved by the Board, the proposal to reorganize the Fund will be submitted to the shareholders of the Fund for their approval. There is no assurance that the Board or the shareholders of the Fund will approve the proposal to reorganize the Fund.
For more complete information, you may review the Fund's next prospectus, which we expect to be available by March 3, 2025 at https://www.amundi.com/usinvestors/Products/Mutual-Funds or upon request at 1-800-225-6292.
For more complete information, you may review the Fund's next prospectus, which we expect to be available by March 3, 2025 at https://www.amundi.com/usinvestors/Products/Mutual-Funds or upon request at 1-800-225-6292.
What were the Fund costs for the last year?
(Based on a hypothetical $10,000 investment)
| Class Name | Costs of a $10,000 investment | Costs paid as a percentage of a $10,000 investment |
| Class Y | $111 | 0.97% |
How did the Fund perform last year and what affected the Fund performance?
- For the fiscal year ended October 31, 2024, the Fund’s Class Y shares at NAV returned 27.91%. For the same period, the Fund’s broad-based benchmark, the Standard & Poor’s 500 Total Return Index, returned 38.02%. The performance benchmark, the Russell Mid Cap Value Total Return Index, returned 34.03% over the period.
- The Fund’s security selection in both the information technology and financial sectors was the largest contributor to relative results versus the performance benchmark during the period.
- Security selection in the energy and industrials sectors detracted from security selection results for the fiscal year ended October 31, 2024.
- The Fund’s overweight exposure to the energy and consumer staples sectors also detracted from benchmark relative results.
Fund Performance
The line graph below shows the change in value of a $5 million investment made in Class Y shares of the Fund during the periods shown, compared to that of the S&P 500 Total Return Index and the Russell Mid Cap Value Total Return Index.
GROWTH OF $5 million
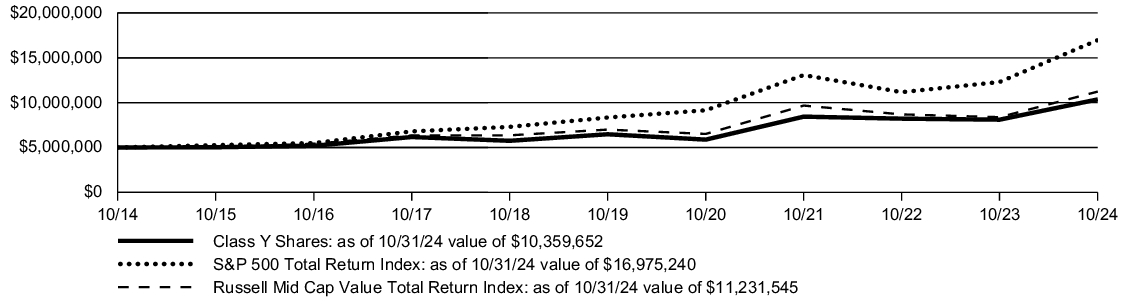
| AVERAGE ANNUAL TOTAL RETURN | 1 Year | 5 Years | 10 Years |
| Class Y | 27.91% | 9.86% | 7.56% |
| S&P 500 Total Return Index | 38.02% | 15.27% | 13.00% |
| Russell Mid Cap Value Total Return Index | 34.03% | 9.93% | 8.43% |
The graph and table do not reflect the deduction of taxes that a shareholder would pay on fund distributions or redemption of fund shares.
KEY FUND STATISTICS
(as of October 31, 2024)
(as of October 31, 2024)
| Fund net assets | $731,284,737 |
| Total number of portfolio holdings | 66^^ |
| Total advisory fee paid | $5,414,675 |
| Portfolio turnover rate | 33% |
| ^^ |
Excluding short-term investments and all derivative contracts except for options purchased. |
SECTOR DISTRIBUTION
(as of October 31, 2024 )*
(as of October 31, 2024 )*
| Financials | 25.0% |
| Industrials | 14.3% |
| Consumer Discretionary | 9.8% |
| Real Estate | 7.6% |
| Energy | 7.3% |
| Utilities | 7.2% |
| Basic Materials | 7.0% |
| Information Technology | 6.9% |
| Consumer Staples | 6.9% |
| Health Care | 5.1% |
| Communication Services | 2.9% |
| * |
As a percentage of total investments excluding short-term investments and all derivative contracts except for options purchased. |
Material Fund Changes
Amundi Asset Management US, Inc. (the “Adviser”), the Fund’s investment adviser, is currently an indirect, wholly-owned subsidiary of Amundi. On July 9, 2024, Amundi announced that it had entered into a definitive agreement with Victory Capital Holdings, Inc. (“Victory Capital”) to combine the Adviser with Victory Capital, and for Amundi to become a strategic shareholder of Victory Capital (the “Transaction”). Victory Capital is headquartered in San Antonio, Texas. The closing of the Transaction is subject to certain regulatory approvals and other conditions. There is no assurance that the Transaction will close.
The closing of the Transaction would cause the Fund’s current investment advisory agreement with the Adviser to terminate. Under the terms of the Transaction, the Fund’s Board of Trustees will be asked to approve a reorganization of the Fund into a corresponding, newly established Victory Fund advised by Victory Capital Management Inc., an affiliate of Victory Capital. The proposed reorganization of the Fund would be sought in connection with the closing of the Transaction. If approved by the Board, the proposal to reorganize the Fund will be submitted to the shareholders of the Fund for their approval. There is no assurance that the Board or the shareholders of the Fund will approve the proposal to reorganize the Fund.
For more complete information, you may review the Fund's next prospectus, which we expect to be available by March 3, 2025 at https://www.amundi.com/usinvestors/Products/Mutual-Funds or upon request at 1-800-225-6292.
For more complete information, you may review the Fund's next prospectus, which we expect to be available by March 3, 2025 at https://www.amundi.com/usinvestors/Products/Mutual-Funds or upon request at 1-800-225-6292.
| [1] | Excluding short-term investments and all derivative contracts except for options purchased. |
| [2] | Excluding short-term investments and all derivative contracts except for options purchased. |
| [3] | Excluding short-term investments and all derivative contracts except for options purchased. |
| [4] | Excluding short-term investments and all derivative contracts except for options purchased. |
| [5] | Excluding short-term investments and all derivative contracts except for options purchased. |