The fund has an investment objective of long-term capital appreciation.
The tables below illustrate the fees and expenses that you may pay if you buy, hold and sell shares of the fund. You may pay other fees, such as brokerage commissions and other fees to financial intermediaries, which are not reflected in the tables and examples below. You may qualify for sales charge discounts in Class A Shares if you and your family invest, or agree to invest in the future, at least $50,000 in Virtus Funds. More information on these and other discounts is available: (i) from your financial professional or other financial intermediary; (ii) under “Sales Charges” on page 108 of the fund’s prospectus; and (iii) with respect to purchase of shares through specific intermediaries, in Appendix A to the fund’s prospectus, entitled “Intermediary Sales Charge Discounts and Waivers.”
Shareholder Fees - Virtus Duff & Phelps Real Asset Fund |
Class A Shares |
Class C Shares |
Class I Shares |
Class R6 Shares |
|
|---|---|---|---|---|---|
| Maximum Sales Charge Imposed on Purchases (as a percentage of Offering Price) | 5.50% | none | none | none | |
| Maximum Deferred Sales Charge (as a percentage of Offering Price) | none | 1.00% | [1] | none | none |
| [1] | The deferred sales charge is imposed on Class C Shares redeemed during the first year only. |
Annual Fund Operating Expenses - Virtus Duff & Phelps Real Asset Fund |
Class A Shares |
Class C Shares |
Class I Shares |
Class R6 Shares |
|
|---|---|---|---|---|---|
| Management Fees | none | none | none | none | |
| Distribution and Shareholder Servicing (12b-1) Fees | 0.25% | 1.00% | none | none | |
| Other Expenses | 0.69% | 0.79% | 0.66% | 0.57% | |
| Acquired Fund Fees and Expenses | 0.82% | 0.82% | 0.82% | 0.82% | |
| Total Annual Fund Operating Expenses | [1] | 1.76% | 2.61% | 1.48% | 1.39% |
| Less: Fee Waiver and/or Expense Reimbursement | [2] | (0.44%) | (0.54%) | (0.41%) | (0.37%) |
| Total Annual Fund Operating Expenses After Fee Waiver and/or Expense Reimbursement | [1],[2] | 1.32% | 2.07% | 1.07% | 1.02% |
| [1] | The Total Annual Fund Operating Expenses do not correlate to the ratio of expenses to average net assets appearing in the Financial Highlights tables, which tables reflect only the operating expenses of the fund and do not include acquired fund fees and expenses. |
| [2] | The fund’s investment adviser has contractually agreed to limit the fund’s total operating expenses (excluding certain expenses, such as front-end or contingent deferred sales charges, taxes, leverage and borrowing expenses (such as commitment, amendment and renewal expenses on credit or redemption facilities), interest, brokerage commissions, expenses incurred in connection with any merger or reorganization, unusual or infrequently occurring expenses (such as litigation), acquired fund fees and expenses, and dividend expenses, if any) so that such expenses do not exceed 0.50% for Class A Shares, 1.25% for Class C Shares, 0.25% for Class I Shares and 0.20% for Class R6 Shares through January 31, 2026. Prior to January 31, 2026, only the fund’s Board may modify or terminate the expense limitation agreement. Following the contractual period, the adviser may discontinue these expense reimbursement arrangements at any time. Under certain conditions, the adviser may recapture operating expenses reimbursed and/or fees waived under these arrangements for a period of three years following the date such waiver or reimbursement occurred, provided that the recapture does not cause the fund to exceed its expense limit in effect at the time of the waiver or reimbursement, and any in effect at the time of recapture, after repayment is taken into account. |
This example is intended to help you compare the cost of investing in the fund with the cost of investing in other mutual funds. The example assumes that you invest $10,000 in the fund for the time periods indicated and then redeem all of your shares at the end of those periods or continued to hold them. The example also assumes that your investment has a 5% return each year, that the fund’s operating expenses remain the same and that the expense reimbursement agreement remains in place for the contractual period. Although your actual costs may be higher or lower, based on these assumptions your costs would be:
Expense Example - Virtus Duff & Phelps Real Asset Fund - USD ($) |
Class A Shares |
Class C Shares |
Class I Shares |
Class R6 Shares |
|---|---|---|---|---|
| 1 Year | $ 677 | $ 310 | $ 109 | $ 104 |
| 3 Years | 1,033 | 760 | 428 | 404 |
| 5 Years | 1,413 | 1,337 | 769 | 725 |
| 10 Years | $ 2,475 | $ 2,904 | $ 1,733 | $ 1,637 |
Expense Example, No Redemption - Virtus Duff & Phelps Real Asset Fund - USD ($) |
Class A Shares |
Class C Shares |
Class I Shares |
Class R6 Shares |
|---|---|---|---|---|
| 1 Year | $ 677 | $ 210 | $ 109 | $ 104 |
| 3 Years | 1,033 | 760 | 428 | 404 |
| 5 Years | 1,413 | 1,337 | 769 | 725 |
| 10 Years | $ 2,475 | $ 2,904 | $ 1,733 | $ 1,637 |
The fund pays transaction costs, such as commissions, when it buys and sells securities (or “turns over” its portfolio). A higher portfolio turnover rate may indicate higher transaction costs and may result in higher taxes when fund shares are held in a taxable account. These costs, which are not reflected in annual fund operating expenses or in the example, affect the fund’s performance. During the most recent fiscal year, the fund’s portfolio turnover rate was 14% of the average value of its portfolio.
The fund seeks to achieve its objective by investing its assets in a mix of underlying affiliated and unaffiliated mutual funds and exchange-traded funds (“ETFs”) (collectively, “underlying funds”) representing a broad universe of real assets. The fund’s subadviser expects that over the long term, a multi-strategy real asset portfolio will mitigate the impact of inflation on the fund’s assets. Real assets are securities whose underlying value is tied to a tangible asset or are linked or correlated to the rate of inflation. Under normal circumstances, the fund will invest at least 80% of its net assets in underlying funds which substantially invest directly and indirectly in real assets. Real assets are broadly defined by the fund and include: global real estate (including real estate investment trusts (“REITs”) and real estate operating companies); natural resources; commodities; global infrastructure (sectors such as utilities, telecommunications and industrials); energy midstream Master Limited Partnerships (“MLPs”), General Partners (“GPs”) and C-corporations that own midstream oil and natural gas assets; floating rate instruments (including loans) and global inflation-linked debt securities. Among the underlying funds in which the fund invests are funds that invest principally in equity securities of issuers of any capitalization, including those of foreign issuers, including emerging markets issuers, and funds that invest principally in debt instruments of any credit quality and maturity designation. Under normal circumstances, the Fund will generally invest in affiliated mutual funds where available to represent the desired asset classes, and unaffiliated mutual funds and/or ETFs to represent the desired asset classes for which affiliated mutual funds are unavailable or deemed not to be appropriate for the Fund. The affiliated mutual funds in which the fund may invest include funds subadvised by the fund’s subadviser, Duff & Phelps Investment Management Co. The Fund’s policy of investing at least 80% of its assets in underlying funds which substantially invest in real assets may be changed only upon 60 days’ written notice to shareholders.
Risk Table - Virtus Duff & Phelps Real Asset Fund |
Risk [Text Block] |
|---|---|
| Risk Lose Money [Member] | If between the time you purchase shares and the time you sell shares the value of the fund’s investments decreases, you will lose money. |
| Equity Securities Risk | > Equity Securities Risk: The value of the stocks held by the fund may be negatively affected by the financial market, industries in which the fund invests, or issuer-specific events. Focus on a particular style or in small or medium-sized companies may enhance that risk. |
| Industry/Sector Concentration Risk | > Industry/Sector Concentration Risk: A fund that focuses its investments in a particular industry or sector will be more sensitive to conditions that affect that industry or sector than a non-concentrated fund. Such a focus may cause a decrease in the fund’s value, perhaps significantly. |
| Real Estate Investment Risk | > Real Estate Investment Risk: The fund may be negatively affected by changes in real estate values or economic conditions, credit risk and interest rate fluctuations, changes in the value of the underlying real estate and defaults by lessees and/or borrowers. |
| Infrastructure-Related Risk | > Infrastructure-Related Risk: A fund that focuses its investments in infrastructure-related companies will be more sensitive to conditions affecting their business or operations such as local economic and political conditions, regulatory changes, and environmental issues. Such a focus may cause a decrease in the fund’s value, perhaps significantly. |
| Natural Resources Risk | > Natural Resources Risk: Investments in natural resources industries may be significantly affected by events relating to international political and economic developments, energy conservation, the success of exploration projects, commodity prices, taxes and other governmental regulations. |
| Credit Risk | > Credit Risk: If the issuer of a debt instrument fails to pay interest or principal in a timely manner, or negative perceptions exist in the market of the issuer’s ability to make such payments, the price of the security may decline. |
| Interest Rate Risk | > Interest Rate Risk: The values of debt instruments may rise or fall in response to changes in interest rates, and this risk may be enhanced for securities with longer maturities. |
| Foreign Investing Risk | > Foreign Investing Risk: Investing in foreign securities subjects the fund to additional risks such as increased volatility; currency fluctuations; less liquidity; less publicly available information about the foreign investment; and political, regulatory, economic, and market risk. |
| Allocation Risk | > Allocation Risk: If the fund’s exposure to equities and fixed income securities, or to other asset classes, deviates from the intended allocation, or if the fund’s allocation is not optimal for market conditions at a given time, the fund’s performance may suffer. |
| Derivatives Risk | > Derivatives Risk: Derivatives and other similar instruments (collectively referred to in this section as “derivatives”) may include, among other things, futures, options, forwards and swap agreements and may be used in order to hedge portfolio risks, create leverage or attempt to increase returns. Investments in derivatives may result in increased volatility and the fund may incur a loss greater than its principal investment. |
| Bank Loan Risk | > Bank Loan Risk: In addition to the risks typically associated with high-yield/high-risk fixed income securities, bank loans may be unsecured or not fully collateralized, may be subject to restrictions on resale, may be less liquid and may trade infrequently on the secondary market. Bank loans settle on a delayed basis; thus, sale proceeds may not be available to meet redemptions for a substantial period of time after the sale of the loan. |
| Inflation-Linked Investments Risk | > Inflation-Linked Investments Risk: Inflation-linked securities may react differently from other fixed income securities to changes in interest rates and that interest and/or principal payments on an inflation-protected security may be irregular. While inflation-protected securities are expected to be protected from long-term inflationary trends, short-term increases in inflation may lead to a decline in their value. In addition, positive adjustments to principal in inflation-protected securities generally can be expected to result in taxable income to the Underlying Fund at the time of such adjustments, even though the principal amount is not paid until maturity. |
| Master Limited Partnership (MLP) Risk | > Master Limited Partnership (MLP) Risk: Investments in MLPs may be negatively impacted by tax law changes, changes in interest rates, the failure of the MLP’s parent or sponsor to make payments as expected, regulatory developments or other factors affecting the MLP’s underlying assets, which are typically in the natural resources and energy sectors. |
| Exchange-Traded Funds (ETFs) Risk | > Exchange-Traded Funds (ETFs) Risk: The value of an ETF may be more volatile than the underlying portfolio of securities the ETF is designed to track. The costs to the fund of owning shares of an ETF may exceed the cost of investing directly in the underlying securities. |
| Fund of Funds Risk | > Fund of Funds Risk: Because the fund can invest in other funds, it bears its proportionate share of the operating expenses and management fees of, and may be adversely affected by, the underlying fund(s). The expenses associated with the fund’s investment in other funds will cost shareholders more than direct investments would have cost. |
| Affiliated Fund Risk | > Affiliated Fund Risk: The fund’s adviser may select and substitute affiliated and/or unaffiliated mutual funds which may create a conflict of interest. |
| Market Volatility Risk | > Market Volatility Risk: The value of the securities in the fund may go up or down in response to the prospects of individual companies and/or general economic conditions. Price changes may be short- or long-term. Local, regional or global events such as war or military conflict (e.g., Russia’s invasion of Ukraine), acts of terrorism, the spread of infectious illness or other public health issue, recessions, or other events could have a significant impact on the fund and its investments, including hampering the ability of the fund’s portfolio manager(s) to invest the fund’s assets as intended. |
| Currency Rate Risk | > Currency Rate Risk: Fluctuations in the exchange rates between the U.S. dollar and foreign currencies may negatively affect the value of the fund’s shares. |
| Redemption Risk | > Redemption Risk: One or more large shareholders or groups of shareholders may redeem their holdings in the fund, resulting in an adverse impact on remaining shareholders in the fund by causing the fund to take actions it would not otherwise have taken. The principal risks attributable to the Underlying Funds in which the fund invests are identified below: |
| Equity Real Estate Investment Trust (REIT) Securities Risk | > Equity Real Estate Investment Trust (REIT) Securities Risk: The fund’s value may be negatively affected by factors specific to the real estate market such as interest rates, leverage, property, and management. The fund’s value may also be negatively affected by factors specific to investing through a pooled vehicle, such as poor management, concentration risk, or other risks typically associated with investing in small or medium market capitalization companies. |
| Emerging Market Risk | > Emerging Market Risk: Emerging markets securities may be more volatile, or more greatly affected by negative conditions, than those of their counterparts in more established foreign markets. Such securities may also be subject to Sanctions Risk. |
| Sanctions Risk | > Sanctions Risk: The imposition of sanctions and other similar measures could cause a decline in the value and/or liquidity of securities issued by or tied to the sanctioned country and increase market volatility and disruption in the sanctioned country and throughout the world. Sanctions and other similar measures could limit or prevent the fund from buying and selling securities (in the sanctioned country and other markets), significantly delay or prevent the settlement of transactions, and negatively impact the fund’s liquidity and performance. |
| Commodity and Commodity-linked Instruments Risk | > Commodity and Commodity-linked Instruments Risk: Commodities and commodity-linked instruments will subject the fund’s portfolio to greater volatility than investments in traditional securities, and will depend on factors such as drought, floods, weather, livestock disease, embargoes, tariffs and other regulatory developments or supply and demand distruptions. Commodity-linked instruments may experience returns different from the commodity they attempt to track and may also be exposed to counterparty risk. |
| High-Yield/High-Risk Fixed Income Securities (Junk Bonds) Risk | > High-Yield/High-Risk Fixed Income Securities (Junk Bonds) Risk: There is a greater risk of issuer default, less liquidity, and increased price volatility related to high-yield/high-risk securities than investment grade securities, and high-yield/high-risk securities are generally considered to be speculative. |
| Income Risk | > Income Risk: Income received from the fund may vary widely over the short- and long-term and/or be less than anticipated if the proceeds from maturing securities in the fund are reinvested in lower-yielding securities. |
| Large Market Capitalization Companies Risk | > Large Market Capitalization Companies Risk: The value of investments in larger companies may not rise as much as smaller companies, or larger companies may be unable to respond quickly to competitive challenges, such as changes in technology and consumer tastes. |
| Leverage Risk | > Leverage Risk: When the fund leverages its portfolio by borrowing or by engaging in certain types of transactions or instruments, including derivatives, the fund may be less liquid, may liquidate positions at an unfavorable time, and the volatility of the fund’s value may increase. |
| Liquidity Risk | > Liquidity Risk: Certain instruments may be difficult or impossible to sell at a time and price beneficial to the fund. |
| Preferred Stocks Risk | > Preferred Stocks Risk: Preferred stocks may decline in price, fail to pay dividends when expected, or be illiquid. |
| Short Sales Risk | > Short Sales Risk: The fund may engage in short sales and may incur a loss if the price of a borrowed security increases between the date of a short sale and the date on which the fund replaces the security. |
| Small and Medium Market Capitalization Companies Risk | > Small and Medium Market Capitalization Companies Risk: The fund’s investments in small and medium market capitalization companies may increase the volatility and risk of loss to the fund, as compared with investments in larger, more established companies. |
| Unrated Fixed Income Securities Risk | > Unrated Fixed Income Securities Risk: If the subadviser is unable to accurately assess the quality of an unrated fixed income security, the fund may invest in a security with greater risk than intended, or the securities may be more difficult to sell than anticipated. |
The bar chart and table below provide some indication of the potential risks of investing in the fund. The fund’s past performance, before and after taxes, is not necessarily an indication of how the fund will perform in the future. The current subadviser commenced providing services for the fund in February 2020 and therefore the returns shown in the table for periods prior to that date reflect the performance of other investment professionals.
The bar chart shows changes in the fund’s performance from year to year over a 10-year period. The table shows how the fund’s average annual returns compare to those of a broad-based securities market index. Updated performance information is available at virtus.com or by calling 800-243-1574.
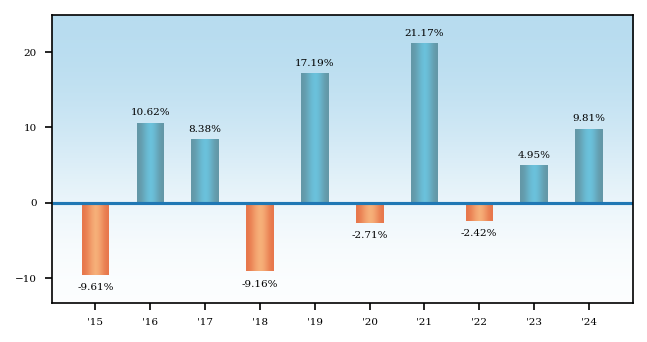
Best Quarter: | 2020, Q2: | 12.64% | Worst Quarter: | 2020, Q1: | -23.12% |
Average Annual Total Returns - Virtus Duff & Phelps Real Asset Fund |
Label |
1 Year |
5 Years |
10 Years |
Since Inception |
Inception Date |
|---|---|---|---|---|---|---|
| Class A Shares | Return Before Taxes | 3.53% | 4.36% | 3.50% | ||
| Class C Shares | Return Before Taxes | 8.75% | 4.73% | 3.29% | ||
| Class I Shares | Return Before Taxes | 9.81% | 5.80% | 4.34% | ||
| Class I Shares | After Taxes on Distributions | Return After Taxes on Distributions | 8.09% | 5.20% | 3.72% | ||
| Class I Shares | After Taxes on Distributions and Sales | Return After Taxes on Distributions and Sale of Fund Shares | 5.79% | 4.35% | 3.23% | ||
| Class R6 Shares | Return Before Taxes | 9.83% | 4.28% | Jan. 31, 2022 | ||
| MSCI All Country World Index (net) | MSCI All Country World Index (net) | 17.49% | 10.06% | 9.23% | 7.43% | Jan. 31, 2022 |
The MSCI All Country World Index (net) is a free float-adjusted market capitalization-weighted index that measures equity performance of developed and emerging markets. The MSCI All Country World Index (net) is calculated on a total return basis with net dividends reinvested. The index is unmanaged and not available for direct investment.
After-tax returns are calculated using the historical highest individual federal marginal income tax rates and do not reflect the impact of state and local taxes. After-tax returns are shown only for Class I Shares; after-tax returns for other classes will vary. Actual after-tax returns depend on the investor’s tax situation and may differ from those shown. After-tax returns are not relevant to investors who hold fund shares in tax-deferred accounts or to shares held by non-taxable entities.