The fund has investment objectives of capital appreciation and income with approximately equal emphasis.
The tables below illustrate the fees and expenses that you may pay if you buy, hold and sell shares of the fund. You may pay other fees, such as brokerage commissions and other fees to financial intermediaries, which are not reflected in the tables and examples below. You may qualify for sales charge discounts in Class A Shares if you and your family invest, or agree to invest in the future, at least $50,000 in Virtus Funds. More information on these and other discounts is available: (i) from your financial professional or other financial intermediary; (ii) under “Sales Charges” on page 108 of the fund’s prospectus; and (iii) with respect to purchase of shares through specific intermediaries, in Appendix A to the fund’s prospectus, entitled “Intermediary Sales Charge Discounts and Waivers.”
Shareholder Fees - Virtus Duff & Phelps Real Estate Securities Fund |
Class A Shares |
Class C Shares |
Class I Shares |
Class R6 Shares |
|
|---|---|---|---|---|---|
| Maximum Sales Charge Imposed on Purchases (as a percentage of Offering Price) | 5.50% | none | none | none | |
| Maximum Deferred Sales Charge (as a percentage of Offering Price) | none | 1.00% | [1] | none | none |
| [1] | The deferred sales charge is imposed on Class C Shares redeemed during the first year only. |
Annual Fund Operating Expenses - Virtus Duff & Phelps Real Estate Securities Fund |
Class A Shares |
Class C Shares |
Class I Shares |
Class R6 Shares |
|
|---|---|---|---|---|---|
| Management Fees | 0.75% | 0.75% | 0.75% | 0.75% | |
| Distribution and Shareholder Servicing (12b-1) Fees | 0.25% | 1.00% | none | none | |
| Other Expenses | 0.37% | 0.33% | 0.35% | 0.20% | |
| Total Annual Fund Operating Expenses | 1.37% | 2.08% | 1.10% | 0.95% | |
| Less: Fee Waiver and/or Expense Reimbursement | [1] | (0.13%) | (0.09%) | (0.11%) | (0.16%) |
| Total Annual Fund Operating Expenses After Fee Waiver and/or Expense Reimbursement | [1] | 1.24% | 1.99% | 0.99% | 0.79% |
| [1] | The fund’s investment adviser has contractually agreed to limit the fund’s total operating expenses (excluding certain expenses, such as front-end or contingent deferred sales charges, taxes, leverage and borrowing expenses (such as commitment, amendment and renewal expenses on credit or redemption facilities), interest, brokerage commissions, expenses incurred in connection with any merger or reorganization, unusual or infrequently occurring expenses (such as litigation), acquired fund fees and expenses, and dividend expenses, if any) so that such expenses do not exceed 1.24% for Class A Shares, 1.99% for Class C Shares, 0.99% for Class I Shares and 0.79% for Class R6 Shares through January 31, 2026. Prior to January 31, 2026, only the fund’s Board may modify or terminate the expense limitation agreement. Following the contractual period, the adviser may discontinue these expense reimbursement arrangements at any time. Under certain conditions, the adviser may recapture operating expenses reimbursed and/or fees waived under these arrangements for a period of three years following the date such waiver or reimbursement occurred, provided that the recapture does not cause the fund to exceed its expense limit in effect at the time of the waiver or reimbursement, and any in effect at the time of recapture, after repayment is taken into account. |
This example is intended to help you compare the cost of investing in the fund with the cost of investing in other mutual funds. The example assumes that you invest $10,000 in the fund for the time periods indicated and then redeem all of your shares at the end of those periods or continued to hold them. The example also assumes that your investment has a 5% return each year, that the fund’s operating expenses remain the same and that the expense reimbursement agreement remains in place for the contractual period. Although your actual costs may be higher or lower, based on these assumptions your costs would be:
Expense Example - Virtus Duff & Phelps Real Estate Securities Fund - USD ($) |
Class A Shares |
Class C Shares |
Class I Shares |
Class R6 Shares |
|---|---|---|---|---|
| 1 Year | $ 669 | $ 302 | $ 101 | $ 81 |
| 3 Years | 948 | 643 | 339 | 287 |
| 5 Years | 1,247 | 1,110 | 596 | 510 |
| 10 Years | $ 2,095 | $ 2,403 | $ 1,330 | $ 1,152 |
Expense Example, No Redemption - Virtus Duff & Phelps Real Estate Securities Fund - USD ($) |
Class A Shares |
Class C Shares |
Class I Shares |
Class R6 Shares |
|---|---|---|---|---|
| 1 Year | $ 669 | $ 202 | $ 101 | $ 81 |
| 3 Years | 948 | 643 | 339 | 287 |
| 5 Years | 1,247 | 1,110 | 596 | 510 |
| 10 Years | $ 2,095 | $ 2,403 | $ 1,330 | $ 1,152 |
The fund pays transaction costs, such as commissions, when it buys and sells securities (or “turns over” its portfolio). A higher portfolio turnover rate may indicate higher transaction costs and may result in higher taxes when fund shares are held in a taxable account. These costs, which are not reflected in annual fund operating expenses or in the example, affect the fund’s performance. During the most recent fiscal year, the fund’s portfolio turnover rate was 36% of the average value of its portfolio.
The fund offers exposure to the equity real estate investment trust (“REIT”) market utilizing a quality and relative value style with a fundamental security analysis approach designed to identify the most attractive investment candidates. The subadviser believes the value of a REIT extends beyond the value of the underlying real estate and that through fundamental research, it can uncover and exploit inefficiencies in the market.
Under normal circumstances, the fund invests at least 80% of its assets in publicly-traded REITs and companies that are principally engaged in the real estate industry. The fund concentrates its assets in the real estate industry.
Risk Table - Virtus Duff & Phelps Real Estate Securities Fund |
Risk [Text Block] |
|---|---|
| Risk Lose Money [Member] | If between the time you purchase shares and the time you sell shares the value of the fund’s investments decreases, you will lose money. |
| Equity Securities Risk | > Equity Securities Risk: The value of the stocks held by the fund may be negatively affected by the financial market, industries in which the fund invests, or issuer-specific events. Focus on a particular style or in small or medium-sized companies may enhance that risk. |
| Real Estate Investment Risk | > Real Estate Investment Risk: The fund may be negatively affected by changes in real estate values or economic conditions, credit risk and interest rate fluctuations, changes in the value of the underlying real estate and defaults by lessees and/or borrowers. |
| Industry/Sector Concentration Risk | > Industry/Sector Concentration Risk: Events negatively affecting real estate related securities may cause the value of the fund’s shares to decrease, perhaps significantly. Since the fund concentrates its assets in real estate related securities, the fund is more vulnerable to conditions that negatively affect real estate related securities as compared to a fund that does not concentrate holdings in such securities. |
| Market Volatility Risk | > Market Volatility Risk: The value of the securities in the fund may go up or down in response to the prospects of individual companies and/or general economic conditions. Price changes may be short- or long-term. Local, regional or global events such as war or military conflict (e.g., Russia’s invasion of Ukraine), acts of terrorism, the spread of infectious illness or other public health issue, recessions, or other events could have a significant impact on the fund and its investments, including hampering the ability of the fund’s portfolio manager(s) to invest the fund’s assets as intended. |
| Equity Real Estate Investment Trust (REIT) Securities Risk | > Equity Real Estate Investment Trust (REIT) Securities Risk: The fund’s value may be negatively affected by factors specific to the real estate market such as interest rates, leverage, property, and management. The fund’s value may also be negatively affected by factors specific to investing through a pooled vehicle, such as poor management, concentration risk, or other risks typically associated with investing in small or medium market capitalization companies. |
| Redemption Risk | > Redemption Risk: One or more large shareholders or groups of shareholders may redeem their holdings in the fund, resulting in an adverse impact on remaining shareholders in the fund by causing the fund to take actions it would not otherwise have taken. |
The bar chart and table below provide some indication of the potential risks of investing in the fund. The fund’s past performance, before and after taxes, is not necessarily an indication of how the fund will perform in the future.
The bar chart shows changes in the fund’s performance from year to year over a 10-year period. The table shows how the fund’s average annual returns compare to those of a broad-based securities market index and a style-specific index that reflects the market sectors in which the fund invests. Updated performance information is available at virtus.com or by calling 800-243-1574.
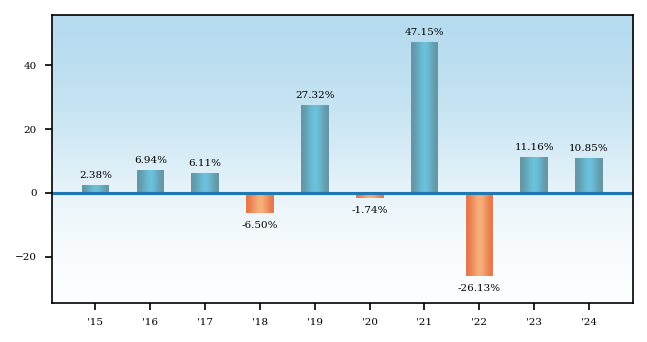
Best Quarter: | 2024, Q3: | 17.30% | Worst Quarter: | 2020, Q1: | -22.95% |
Average Annual Total Returns - Virtus Duff & Phelps Real Estate Securities Fund |
Label |
1 Year |
5 Years |
10 Years |
|---|---|---|---|---|
| Class A Shares | Return Before Taxes | 4.49% | 4.19% | 5.30% |
| Class C Shares | Return Before Taxes | 9.82% | 4.62% | 5.13% |
| Class I Shares | Return Before Taxes | 10.85% | 5.65% | 6.17% |
| Class I Shares | After Taxes on Distributions | Return After Taxes on Distributions | 8.06% | 3.14% | 2.53% |
| Class I Shares | After Taxes on Distributions and Sales | Return After Taxes on Distributions and Sale of Fund Shares | 7.30% | 3.77% | 3.84% |
| Class R6 Shares | Return Before Taxes | 11.28% | 5.98% | 6.44% |
| FT Wilshire 5000 Index | FT Wilshire 5000 Index | 23.76% | 14.10% | 12.73% |
| FTSE Nareit Equity REITs Index | FTSE Nareit Equity REITs Index | 8.73% | 4.27% | 5.73% |
The FT Wilshire 5000 Index is a broad-based free-float market capitalization-weighted index that aims to capture 100% of the U.S. investable market capitalization. The index is calculated on a total return basis with dividends reinvested. The index is unmanaged and not available for direct investment.
The FTSE NAREIT Equity REITs Index is a free-float market capitalization index measuring equity tax-qualified REITs, which meet minimum size and liquidity criteria, that are listed on the New York Stock Exchange and the NASDAQ National Market System. The FTSE NAREIT Equity REITs Index is calculated on a total return basis with dividends reinvested. The index is unmanaged and not available for direct investment.
After-tax returns are calculated using the historical highest individual federal marginal income tax rates and do not reflect the impact of state and local taxes. After-tax returns are shown only for Class I Shares; after-tax returns for other classes will vary. Actual after-tax returns depend on the investor’s tax situation and may differ from those shown. After-tax returns are not relevant to investors who hold fund shares in tax-deferred accounts or to shares held by non-taxable entities. In certain cases, the Return After Taxes on Distributions and Sale of Fund Shares for a period may be higher than other return figures for the same period. This will occur when a capital loss is realized upon the sale of fund shares and provides an assumed tax benefit that increases the return.