ANNUAL SHAREHOLDER REPORT
®
| BFIAX
for the year ended November 30, 2024What were the fund costs for the
last year
?
(based on a hypothetical $10,000 investment)Share class | Costs of a $10,000 investment | Costs paid as a percentage of a $10,000 investment |
| Class A | $ | % |
Management's discussion of fund performance
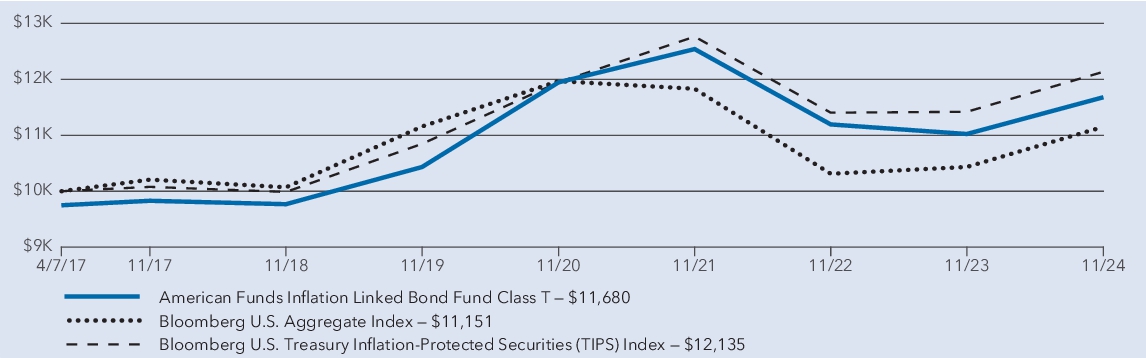
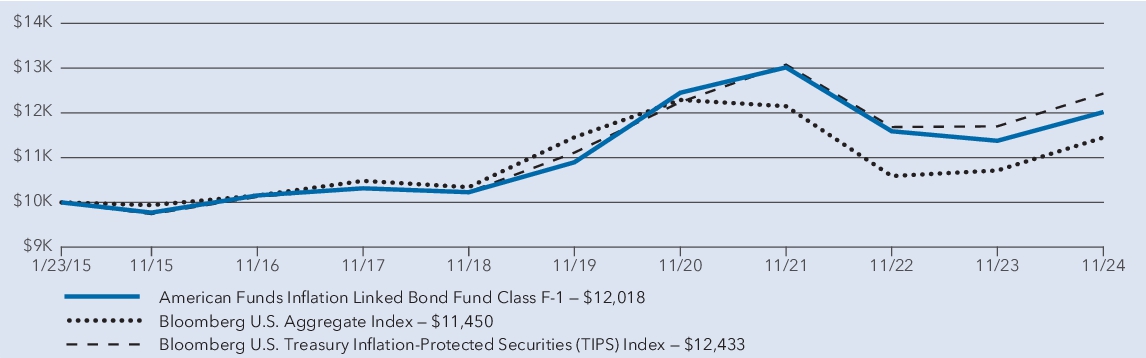
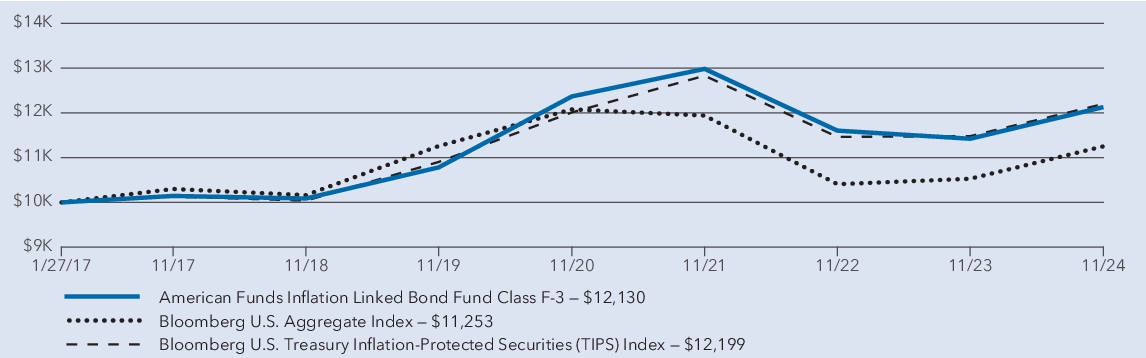
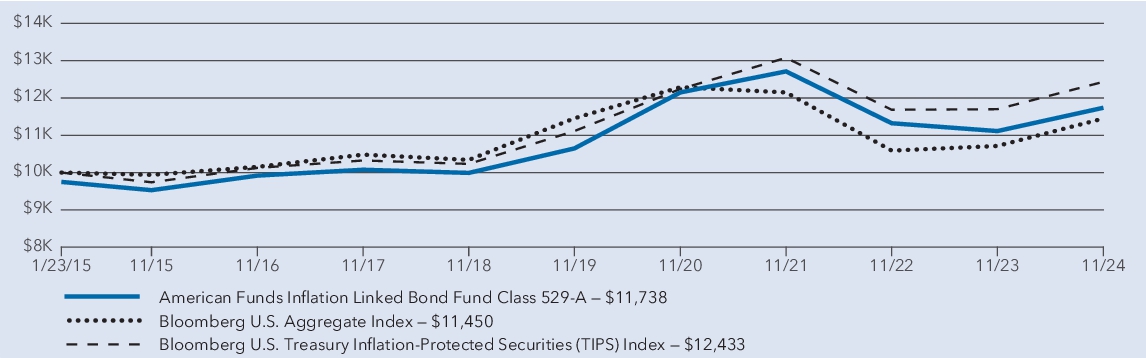
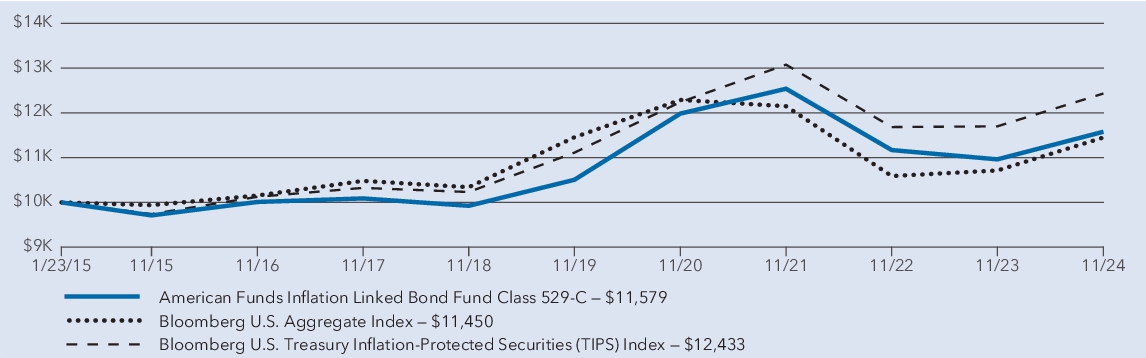
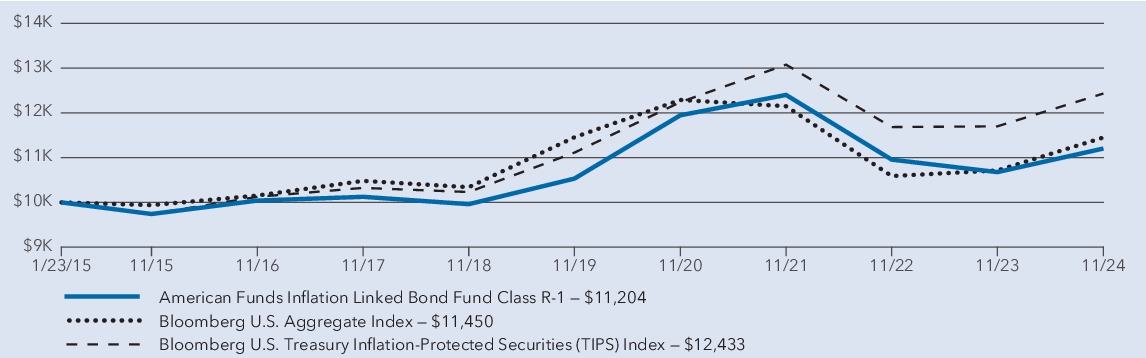
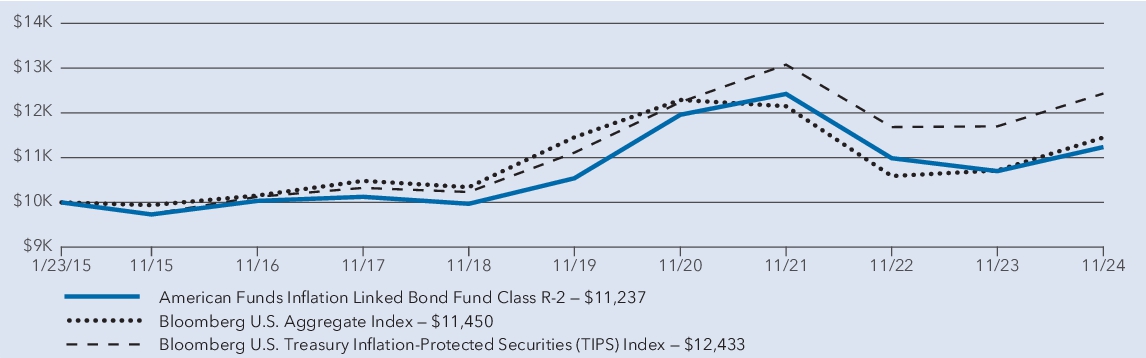
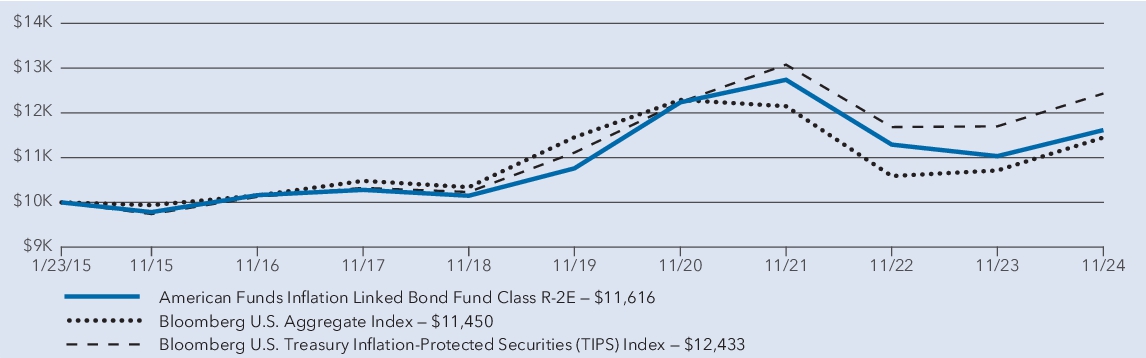
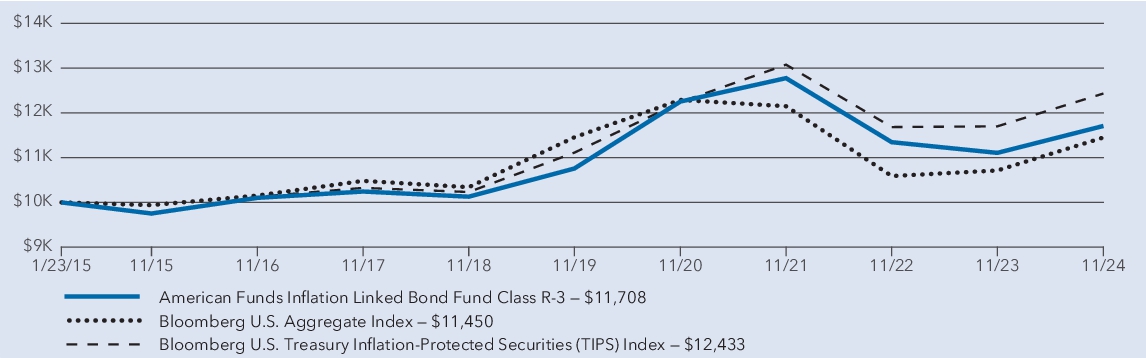
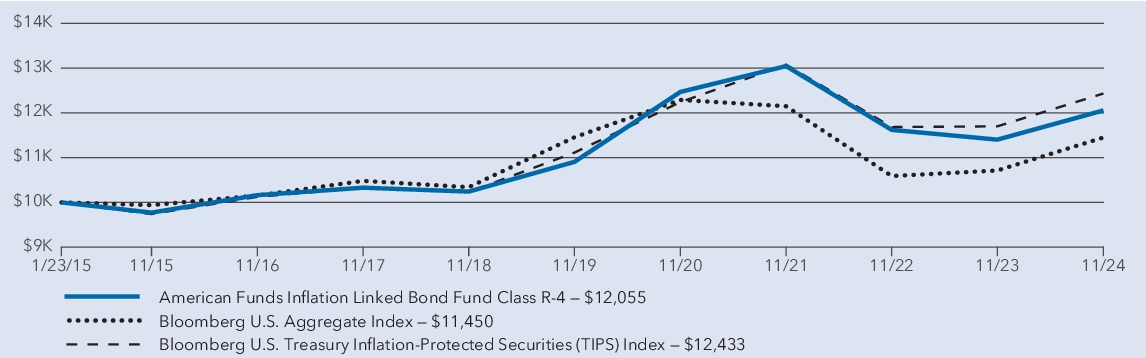
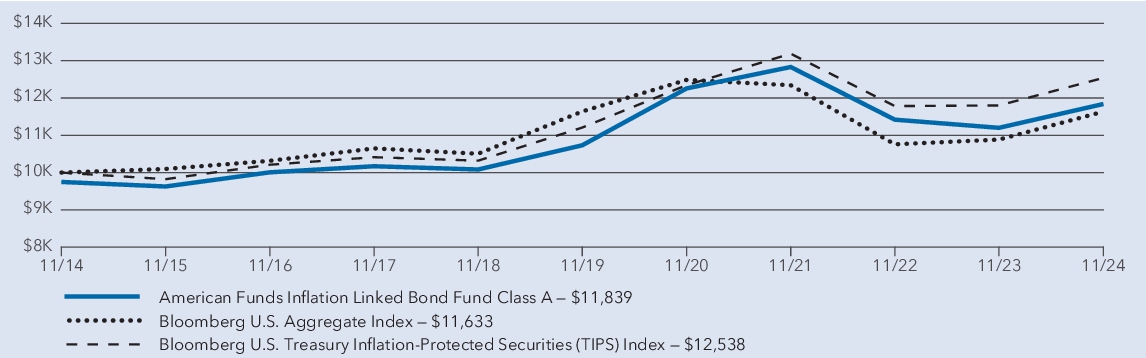
The fund’s Class A shares gained 5.71% for the year ended November 30, 2024. That result compares with a 6.26% gain for the Bloomberg U.S. Treasury Inflation-Protected Securities (TIPS) Index. For information on returns for additional periods, including the fund lifetime, please refer to .
capitalgroup.com/mutual-fund-returns-A
What factors influenced results
During the fund’s fiscal year, the U.S. bond market experienced increased volatility. Yields rose through late April, followed by a decline. This was due in part to easing inflation and expected U.S. Federal Reserve (Fed) interest rate cuts in response to softening labor market conditions. Yields rose again in mid-September in anticipation of stronger economic growth and the possibility that total U.S. debt would increase in 2025.
Interest rate positioning was the key driver of relative returns over the fund’s fiscal year, with active duration positioning making a positive contribution. Entering 2024 with an underweight to duration helped returns as rates rose due to stronger-than-expected economic data and a reassessment of the Fed’s monetary policy path. As economic data showed signs of softening, the fund’s managers moved to a longer duration position, allowing the portfolio to benefit from falling rates. From a sector positioning perspective, modest positive contributions came from small out-of-benchmark exposures to securitized credit, municipal bonds and emerging markets debt.
Conversely, the fund’s hedging of credit risk had a negative impact in an environment in which credit outpaced most fixed income sectors, including both nominal and inflation-linked Treasuries. Positioning for a steeper yield curve also detracted from the fund’s results.
*
Even though the spot yield curve steepened during the period, the steepening was smaller than what the market had priced in.*
Yield curve positioning is a strategy where a manager adjusts a bond portfolio to seek to profit from an expected change in the yield curve, which is a line that plots the yields or interest rates of bonds that have equal credit quality but different maturity dates.How a hypothetical $10,000 investment has grown
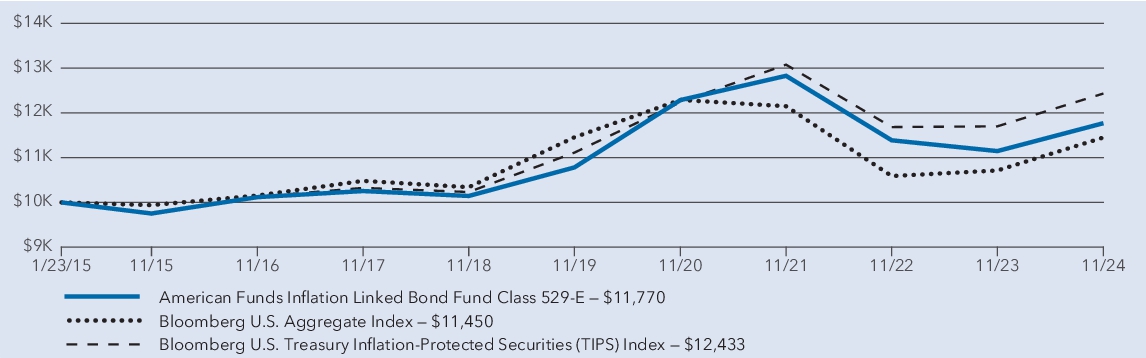
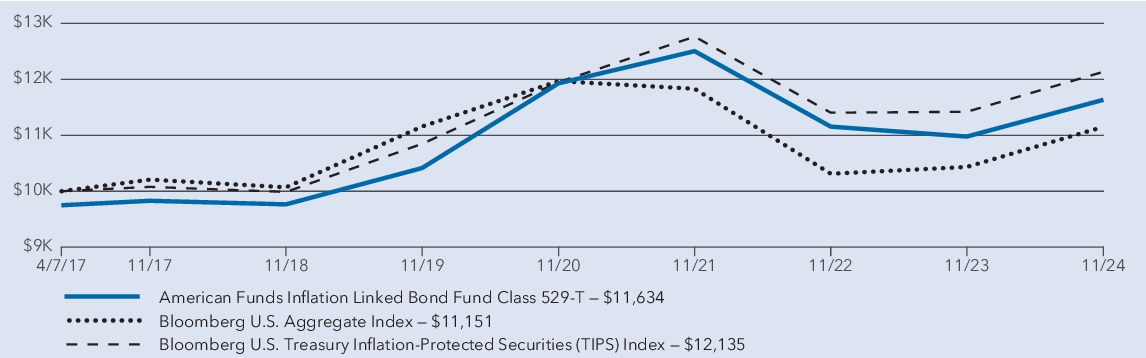
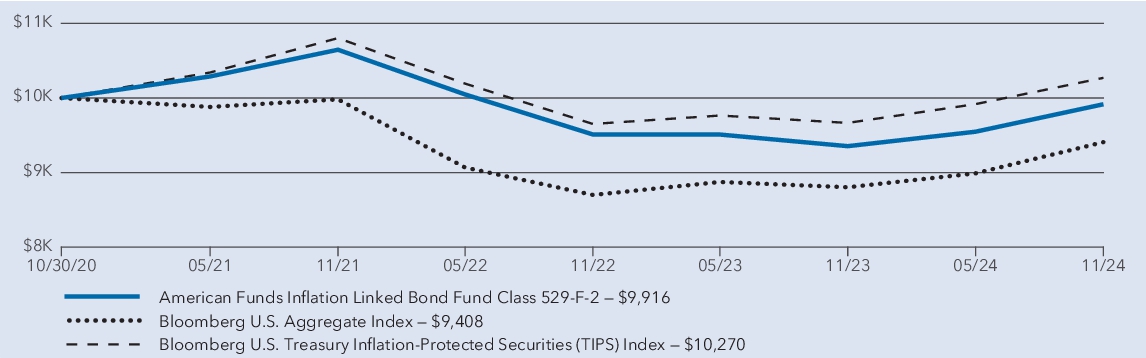
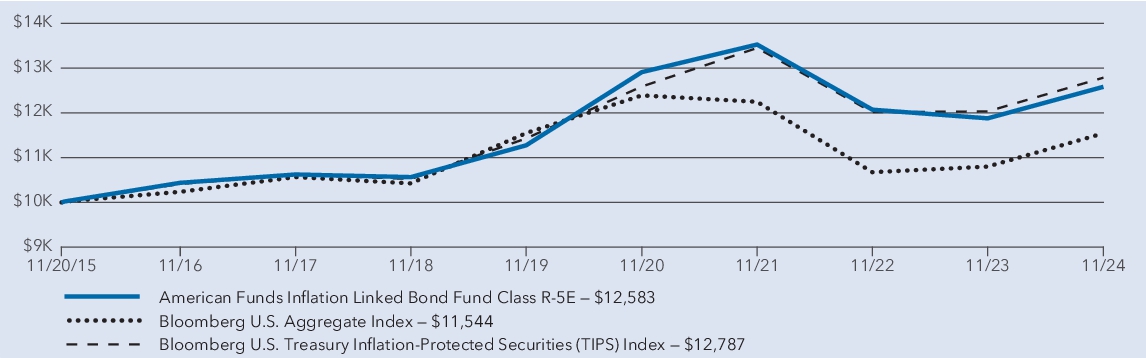
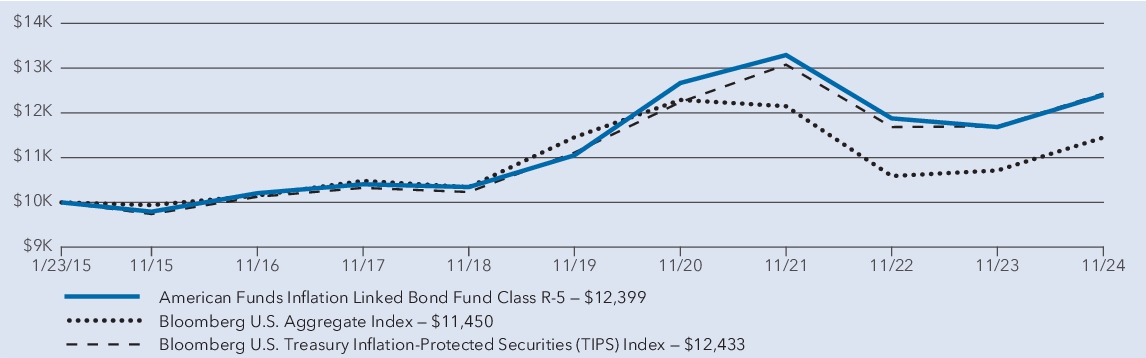
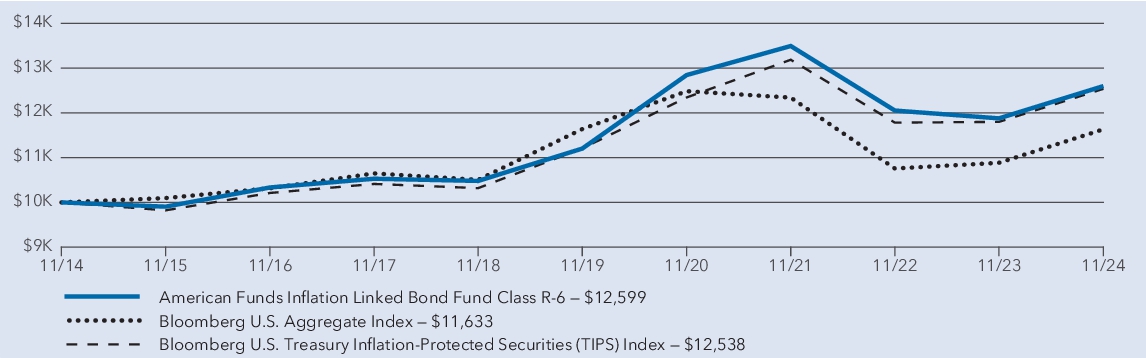
Figures reflect deduction of the maximum sales charge and assume reinvestment of dividends and capital gains.
Average annual total returns
1 year | 5 years | 10 years | |
* | % | % | % |
* | % | % | % |
† | % | ( ) % | % |
† | % | % | % |
*
Investment results assume all distributions are reinvested and reflect applicable fees and expenses. When applicable, results reflect fee waivers and/or expense reimbursements, without which they would have been lower.†
Results assume all distributions are reinvested. Any market index shown is unmanaged, and therefore, has no expenses. Investors cannot invest directly in an index. Source(s): Bloomberg Index Services Ltd.Key fund statistics
| Fund net assets (in millions) | $ |
| Total number of portfolio holdings | |
| Total advisory fees paid (in millions) | $ |
| Portfolio turnover rate | % |
Portfolio holdings by asset type
(percent of net assets)
*Includes derivatives.
Availability of additional information

Scan the QR code to view additional information about the fund, including its prospectus, financial information, holdings and information on proxy voting. Or refer to the web address included at the beginning of this report.
Important information
To reduce fund expenses, only one copy of most shareholder documents will be mailed to shareholders with multiple accounts at the same address (householding). If you would prefer that your documents not be householded, please contact Capital Group at
(800) 421-4225
, or contact your financial intermediary. Your instructions will typically be effective within 30 days of receipt by Capital Group or your financial intermediary.Lit. No. MFAAARX-060-0125 © 2025 Capital Group. All rights reserved.