This table describes the fees and expenses that you may pay if you buy, hold, and sell shares of the Fund. You may pay other fees, such as brokerage commissions and other fees to financial intermediaries, which are not reflected in the tables and examples below. You may qualify for sales charge discounts if you and certain members of your family invest, or agree to invest in the future, at least $50,000 in the Lord Abbett Family of Funds. More information about these and other discounts is available from your financial intermediary and in “Sales Charge Reductions and Waivers” on page 231 of the prospectus, Appendix A to the prospectus, titled “Intermediary-Specific Sales Charge Reductions and Waivers,” and “Purchases, Redemptions, Pricing, and Payments to Dealers” on page 9-1 of Part II of the statement of additional information (“SAI”).
Shareholder Fees - Prospectus Summary - Lord Abbett International Opportunities Fund |
Class A Shares |
Class C Shares |
Class F Shares |
Class F3 Shares |
Class I Shares |
Class P Shares |
Class R2 Shares |
Class R3 Shares |
Class R4 Shares |
Class R5 Shares |
Class R6 Shares |
|||
|---|---|---|---|---|---|---|---|---|---|---|---|---|---|---|
| Maximum Sales Charge Imposed on Purchases (as a percentage of Offering Price) | [1] | 5.75% | none | none | none | none | none | none | none | none | none | none | ||
| Maximum Deferred Sales Charge (as a percentage of Offering Price) | [1] | none | [2] | 1.00% | [3] | none | none | none | none | none | none | none | none | none |
| [1] | A shareholder transacting in share classes without a front-end sales charge may be required to pay a commission to its financial intermediary. Please contact your financial intermediary for more information about whether such a commission may apply to your transaction. |
| [2] | A contingent deferred sales charge (“CDSC”) of 1.00% may be assessed on certain Class A shares purchased or acquired without a sales charge if they are redeemed before the first day of the month in which the one-year anniversary of the purchase falls. |
| [3] | A CDSC of 1.00% may be assessed on Class C shares if they are redeemed before the first anniversary of their purchase. |
Annual Fund Operating Expenses - Prospectus Summary - Lord Abbett International Opportunities Fund |
Class A Shares |
Class C Shares |
Class F Shares |
Class F3 Shares |
Class I Shares |
Class P Shares |
Class R2 Shares |
Class R3 Shares |
Class R4 Shares |
Class R5 Shares |
Class R6 Shares |
|---|---|---|---|---|---|---|---|---|---|---|---|
| Management Fees | 0.75% | 0.75% | 0.75% | 0.75% | 0.75% | 0.75% | 0.75% | 0.75% | 0.75% | 0.75% | 0.75% |
| Distribution and Service (12b-1) Fees | 0.25% | 1.00% | 0.10% | none | none | 0.45% | 0.60% | 0.50% | 0.25% | none | none |
| Other Expenses | 0.25% | 0.25% | 0.25% | 0.17% | 0.25% | 0.25% | 0.25% | 0.25% | 0.25% | 0.25% | 0.17% |
| Total Annual Fund Operating Expenses | 1.25% | 2.00% | 1.10% | 0.92% | 1.00% | 1.45% | 1.60% | 1.50% | 1.25% | 1.00% | 0.92% |
This Example is intended to help you compare the cost of investing in the Fund with the cost of investing in other mutual funds. The Example assumes that you invest $10,000 in the Fund for the time periods indicated and then redeem all of your shares at the end of those periods. The Example also assumes that your investment has a 5% return each year and that the Fund’s operating expenses remain the same. Class C shares automatically convert to Class A shares after eight years. The expense example for Class C shares for the ten-year period reflects the conversion to Class A shares. Although your actual costs may be higher or lower, based on these assumptions your costs would be:
Expense Example - Prospectus Summary - Lord Abbett International Opportunities Fund - USD ($) |
Class A Shares |
Class C Shares |
Class F Shares |
Class F3 Shares |
Class I Shares |
Class P Shares |
Class R2 Shares |
Class R3 Shares |
Class R4 Shares |
Class R5 Shares |
Class R6 Shares |
|---|---|---|---|---|---|---|---|---|---|---|---|
| 1 Year | $ 695 | $ 303 | $ 112 | $ 94 | $ 102 | $ 148 | $ 163 | $ 153 | $ 127 | $ 102 | $ 94 |
| 3 Years | 949 | 627 | 350 | 293 | 318 | 459 | 505 | 474 | 397 | 318 | 293 |
| 5 Years | 1,222 | 1,078 | 606 | 509 | 552 | 792 | 871 | 818 | 686 | 552 | 509 |
| 10 Years | $ 1,999 | $ 2,134 | $ 1,340 | $ 1,131 | $ 1,225 | $ 1,735 | $ 1,900 | $ 1,791 | $ 1,511 | $ 1,225 | $ 1,131 |
Expense Example, No Redemption - Prospectus Summary - Lord Abbett International Opportunities Fund - USD ($) |
Class A Shares |
Class C Shares |
Class F Shares |
Class F3 Shares |
Class I Shares |
Class P Shares |
Class R2 Shares |
Class R3 Shares |
Class R4 Shares |
Class R5 Shares |
Class R6 Shares |
|---|---|---|---|---|---|---|---|---|---|---|---|
| 1 Year | $ 695 | $ 203 | $ 112 | $ 94 | $ 102 | $ 148 | $ 163 | $ 153 | $ 127 | $ 102 | $ 94 |
| 3 Years | 949 | 627 | 350 | 293 | 318 | 459 | 505 | 474 | 397 | 318 | 293 |
| 5 Years | 1,222 | 1,078 | 606 | 509 | 552 | 792 | 871 | 818 | 686 | 552 | 509 |
| 10 Years | $ 1,999 | $ 2,134 | $ 1,340 | $ 1,131 | $ 1,225 | $ 1,735 | $ 1,900 | $ 1,791 | $ 1,511 | $ 1,225 | $ 1,131 |
shares are held in a taxable account. These costs, which are not reflected in the annual fund operating expenses or in the example, affect the Fund’s performance. During the most recent fiscal year, the Fund’s portfolio turnover rate was 50% of the average value of its portfolio.
The Fund invests in stocks of companies principally based outside the United States. The Fund normally intends to invest at least 65% of its net assets in equity securities of small companies. A small company is defined as a company having a market capitalization at the time of purchase of less than $5 billion. The Fund uses a “blend” strategy to gain investment exposure to both growth and value stocks, or to stocks with characteristics of both.
Equity securities in which the Fund may invest include common stocks, preferred stocks, equity interests in trusts (including real estate investment trusts and privately offered trusts), partnerships, joint ventures, limited liability companies and vehicles with similar legal structures, other instruments convertible or exercisable into the foregoing, and other investments with similar economic characteristics.
The Fund invests in foreign companies whose securities may be traded on U.S. or non-U.S. securities exchanges, may be denominated in the U.S. dollar or other currencies, and may include American Depositary Receipts (“ADRs”) and other similar depositary receipts. Although the Fund is not required to hedge its exposure to any currency, it may choose to do so. The Fund may invest up to 15% of its net assets in securities of foreign companies that are traded primarily on securities markets or exchanges located in emerging market countries. The Fund also may invest in U.S. companies.
The Fund’s portfolio management team invests in value and growth companies that it believes to be undervalued relative to their fundamentals. Value companies are those that the Fund’s portfolio management team believes to be undervalued according to certain financial measurements of intrinsic worth or business prospects and to have the potential for capital appreciation. Growth companies are those that the Fund’s portfolio management team believes exhibit faster-than-average gains in earnings and have the potential to continue profit growth at a high level.
Consistent with its investment objective and policies, the Fund may invest in derivatives. The Fund may use derivatives for risk management purposes, including to hedge against a decline in the value of certain investments and to adjust the investment characteristics of its portfolio. The Fund also may invest in derivatives for non-hedging purposes to increase its investment return or income. For example, the Fund may manage cash by investing in futures or other derivatives that provide efficient short-term investment exposure to broad equity markets. Some examples of the types of derivatives in which the Fund may invest are forward contracts, futures, options, and swap agreements.
The investment team may also consider the risks and return potential presented by environmental, social, and governance (“ESG”) factors in investment decisions. The Fund may sell a security when the Fund believes the security is less likely to benefit from the current market and economic environment, or shows signs of deteriorating fundamentals, among other reasons. The Fund may deviate from the investment strategy described above for temporary defensive purposes. The Fund may miss certain investment opportunities if defensive strategies are used and thus may not achieve its investment objective.
Risk Table - Prospectus Summary - Lord Abbett International Opportunities Fund |
Risk [Text Block] |
|---|---|
| Risk Lose Money [Member] | As with any investment in a mutual fund, investing in the Fund involves risk, including the risk that you may receive little or no return on your investment. When you redeem your shares, they may be worth more or less than what you paid for them, which means that you may lose a portion or all of the money you invested in the Fund. |
| Risk Not Insured [Member] | An investment in the Fund is not a deposit of any bank and is not insured or guaranteed by the Federal Deposit Insurance Corporation or any other government agency. |
| · Portfolio Management Risk | · Portfolio Management Risk: If the strategies used and investments selected by the Fund’s portfolio management team fail to produce the intended result, the Fund may suffer losses or underperform other funds with the same investment objective or strategies, even in a favorable market. |
| · Market Risk | · Market Risk: The market values of securities will fluctuate, sometimes sharply and unpredictably, based on overall economic conditions, governmental actions or intervention, market disruptions caused by trade disputes or other factors, political developments, and other factors. Prices of equity securities tend to rise and fall more dramatically than those of debt securities. |
| · Equity Securities Risk | · Equity Securities Risk: Equity securities, as well as equity-like securities such as convertible debt securities, may experience significant volatility. Such securities may fall sharply in response to adverse events affecting overall markets, a particular industry or sector, or an individual company’s financial condition. |
| · Industry and Sector Risk | · Industry and Sector Risk: Although the Fund does not employ an industry or sector focus, its exposure to specific industries or sectors will increase from time to time based on the portfolio management team’s perception of investment opportunities. If the Fund is overweight in a single industry or sector relative to its benchmark index, the Fund will face an increased risk that the value of its portfolio will decrease because of events disproportionately affecting that industry or sector. Furthermore, investments in particular industries or sectors may be more volatile than the broader market as a whole. |
| · Mid-Sized and Small Company Risk | · Mid-Sized and Small Company Risk: Investments in mid-sized and small companies may involve greater risks than investments in larger, more established companies. Securities of mid-sized and small companies tend to be more sensitive to changing economic, market, and industry conditions and tend to be more volatile and less liquid than equity securities of larger companies, especially over the short term. The securities of mid-sized and small companies tend to trade less frequently than those of larger, more established companies, which can adversely affect the pricing of these securities and the ability to sell these securities in the future. |
| · Foreign and Emerging Market Company Risk | · Foreign and Emerging Market Company Risk: Investments in foreign companies and in U.S. companies with economic ties to foreign markets generally involve special risks. These companies may be more vulnerable to economic, political, and social instability and subject to less government supervision, lack of transparency, inadequate regulatory and accounting standards, and foreign taxes. Foreign company securities also include ADRs, which may be less liquid than the underlying shares in their primary trading market. Foreign securities also may subject the Fund’s investments to changes in currency exchange rates. Emerging market securities generally are more volatile than other foreign securities, and are subject to greater liquidity, regulatory, and political risks. Investments in emerging markets may be considered speculative and generally are riskier than investments in more developed markets. Emerging markets are more likely to experience hyperinflation and currency devaluations. Securities of emerging market companies may have far lower trading volumes and less liquidity than securities of issuers in developed markets. In certain emerging market countries, governments participate to a significant degree in their respective economies. Action by these governments could have a significant adverse effect on market prices of securities and payment of dividends. Companies with economic ties to emerging markets may be susceptible to the same risks as companies organized in emerging markets. |
| · Foreign Currency Risk | · Foreign Currency Risk: Investments in securities that are denominated or receiving revenues in foreign currencies are subject to the risk that those currencies will decline in value relative to the U.S. dollar, or, in the case of hedged positions, that the U.S. dollar will decline in value relative to the currency being hedged. Foreign currency exchange rates may fluctuate significantly over short periods of time. |
| · Geographic Focus Risk | · Geographic Focus Risk: To the extent the Fund focuses its investments in a single country or only a few countries in a particular geographic region, economic, political, regulatory or other conditions affecting such region may have a greater impact on Fund performance. |
| · Blend Style Risk | · Blend Style Risk: Growth stocks typically trade at higher multiples of current earnings than other stocks. Growth stocks often are more sensitive to market fluctuations than other securities because their market prices are highly sensitive to future earnings expectations. At times when it appears that these expectations may not be met, prices of growth stocks typically fall. Growth stocks may be more volatile than securities of slower-growing issuers. The prices of value stocks may lag the stock market for long periods of time if the market fails to recognize the company’s intrinsic worth. Value investing also is subject to the risk that a company judged to be undervalued may actually be appropriately priced or even overpriced. A portfolio that combines growth and value styles may diversify these risks and lower its volatility, but there is no assurance this strategy will achieve that result. |
| · Derivatives Risk | · Derivatives Risk: The risks associated with derivatives may be different from and greater than the risks associated with directly investing in securities and other investments. Derivatives may increase the Fund’s volatility and reduce its returns. Derivatives may not perform as expected and the Fund may not realize the intended benefits. Whether the Fund’s use of derivatives is successful may depend on, among other things, the portfolio managers’ ability to correctly forecast market movements, company and industry valuation levels and trends, changes in foreign exchange and interest rates, and other factors. If the portfolio managers incorrectly forecast these and other factors, the Fund’s performance could suffer. In addition, given their complexity, derivatives are subject to the risk that improper or misunderstood documentation may expose the Fund to losses. |
| · Liquidity/Redemption Risk | · Liquidity/Redemption Risk: The Fund may lose money when selling securities at inopportune times to fulfill shareholder redemption requests. The risk of loss may increase depending on the size and frequency of redemption requests, whether the redemption requests occur in times of overall market turmoil or declining prices, and whether the securities the Fund intends to sell have decreased in value or are illiquid. The Fund may be less able to sell illiquid securities at its desired time or price. It may be more difficult for the Fund to value its investments in illiquid securities than more liquid securities. |
The bar chart and table below provide some indication of the risks of investing in the Fund by illustrating the variability of the Fund’s returns. Each assumes reinvestment of dividends and distributions. The Fund’s past performance, before and after taxes, is not necessarily an indication of how the Fund will perform in the future.
The bar chart shows changes in the performance of the Fund’s Class A shares from calendar year to calendar year. This chart does not reflect the sales charge applicable to Class A shares. If the sales charge were reflected, returns would be lower. Performance for the Fund’s other share classes will vary due to the different expenses each class bears. Updated performance information is available at www.lordabbett.com or by calling 888-522-2388.
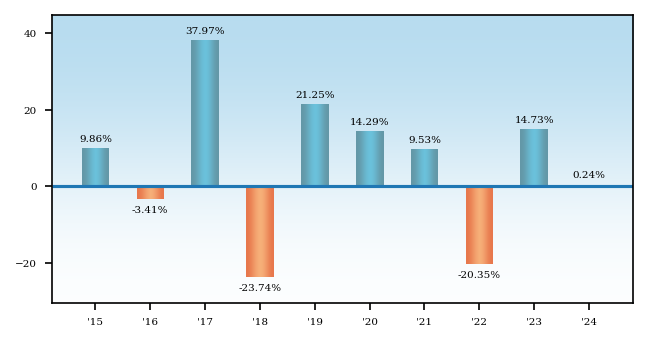
Best Quarter 2nd Q 2020 +21.27% Worst Quarter 1st Q 2020 -27.75%
The table below shows how the Fund’s average annual total returns compare to the returns of a securities market index with investment characteristics similar to those of the Fund as well as to a broad-based securities market index.1 The Fund’s average annual total returns include applicable sales charges.
The after-tax returns of Class A shares included in the table below are calculated using the historical highest individual federal marginal income tax rates and do not reflect the impact of state and local taxes. In some cases, the return after taxes on distributions and sale of Fund shares may exceed the return before taxes due to a tax benefit resulting from realized losses on a sale of Fund shares at the end of the period that is used to offset other gains. Actual after-tax returns depend on an investor’s tax situation and may differ from those shown. The after-tax returns shown are not relevant to investors who hold their Fund shares through tax-advantaged arrangements such as 401(k) plans or Individual Retirement Accounts (“IRAs”). After-tax returns for other share classes are not shown in the table and will vary from those shown for Class A shares.
1 The Fund has adopted the MSCI EAFE Net Index as its broad-based securities market index.
Average Annual Total Returns - Prospectus Summary - Lord Abbett International Opportunities Fund |
Label |
1 Year |
5 Years |
10 Years |
Since Inception |
Inception Date |
|
|---|---|---|---|---|---|---|---|
| Class A Shares | (5.54%) | 1.57% | 3.88% | ||||
| Class A Shares | After Taxes on Distributions | (5.70%) | 1.29% | 3.26% | ||||
| Class A Shares | After Taxes on Distributions and Sales | (2.72%) | 1.28% | 3.06% | ||||
| Class C Shares | [1] | (1.54%) | 2.00% | 3.71% | |||
| Class F Shares | 0.33% | 2.92% | 4.65% | ||||
| Class F3 Shares | 0.59% | 3.12% | 4.07% | Apr. 04, 2017 | |||
| Class I Shares | 0.49% | 3.04% | 4.76% | ||||
| Class P Shares | 0.04% | 2.58% | 4.29% | ||||
| Class R2 Shares | (0.07%) | 2.42% | 4.13% | ||||
| Class R3 Shares | 0.03% | 2.53% | 4.24% | ||||
| Class R4 Shares | 0.20% | 2.78% | 3.43% | Jun. 30, 2015 | |||
| Class R5 Shares | 0.43% | 3.03% | 3.68% | Jun. 30, 2015 | |||
| Class R6 Shares | 0.59% | 3.12% | 3.79% | Jun. 30, 2015 | |||
| S&P Developed Ex-U.S. SmallCap® Index | S&P Developed Ex-U.S. SmallCap® Index | 0.39% | 2.42% | 5.25% | 4.55% | Jun. 30, 2015 | |
| S&P Developed Ex-U.S. SmallCap® Index | 4.54% | Apr. 04, 2017 | |||||
| MSCI EAFE Index with Net Dividends | MSCI EAFE Index with Net Dividends | 3.82% | 4.73% | 5.20% | 4.88% | Jun. 30, 2015 | |
| MSCI EAFE Index with Net Dividends | 5.83% | Apr. 04, 2017 | |||||
| [1] | Class C shares convert to Class A shares eight years after purchase. Class C share performance does not reflect the impact of such conversion to Class A shares. |