The fund seeks to provide long-term capital growth.
This table describes the fees and expenses that you may pay if you buy, hold, and sell shares of the fund. You may also incur brokerage commissions and other charges when buying or selling shares of the fund, which are not reflected in the table or example below.
Annual Fund Operating Expenses |
T. Rowe Price Capital Appreciation Equity ETF
Capital Appreciation Equity ETF
|
|---|---|
| Management fees | 0.31% |
| Other expenses | none |
| Total annual fund operating expenses | 0.31% |
Expense Example |
T. Rowe Price Capital Appreciation Equity ETF
Capital Appreciation Equity ETF
USD ($)
|
|---|---|
| 1 Year | $ 32 |
| 3 Years | 100 |
| 5 Years | 174 |
| 10 Years | $ 393 |
Portfolio Turnover The fund pays transaction costs, such as commissions, when it buys and sells securities (or “turns over” its portfolio). A higher portfolio turnover rate may indicate higher transaction costs and may result in higher taxes when the fund’s shares are held in a taxable account. These costs, which are not reflected in annual fund operating expenses or in the example, affect the fund’s performance. During the most recent fiscal year, the fund’s portfolio turnover rate was 14.3% of the average value of its portfolio.
The fund normally invests at least 80% of its net assets (plus any borrowings for investment purposes) in equity securities. Any derivatives that provide exposure to the investment focus suggested by the fund’s name, or to one or more market risk factors associated with the investment focus suggested by the fund’s name, are counted (as applicable) toward compliance with the fund’s 80% investment policy.
The fund takes a core approach to stock selection, which does not emphasize either a growth or value style of investing. The fund may purchase the stocks of companies of any size, but typically focuses on large U.S. companies. The portfolio is typically constructed in a “bottom up” manner, an approach that focuses more on evaluations of individual stocks than on analysis of overall economic trends and market cycles.
In selecting stocks, the adviser typically seeks out companies with one or more of the following characteristics:
· experienced and capable management;
· strong risk-adjusted return potential;
· leading or improving market position or proprietary advantages; and/or
· attractive valuation relative to a company’s peers or its own historical norm.
Sector allocations are largely the result of the fund’s focus on stock selection. At times, the fund may have a significant portion of its assets invested in the same economic sector, such as the information technology and healthcare sectors.
The fund is nondiversified, which means it may invest a greater percentage of its assets in a particular issuer than is permissible for a diversified fund.
Risk Table - T. Rowe Price Capital Appreciation Equity ETF |
Risk [Text Block] |
|---|---|
| Risk Lose Money [Member] | The fund’s share price fluctuates, which means you could lose money by investing in the fund. |
| Market conditions | Market conditions: The value of the fund’s investments may decrease, sometimes rapidly or unexpectedly, due to factors affecting an issuer held by the fund, particular industries, or the overall securities markets. A variety of factors can increase the volatility of the fund’s holdings and markets generally, including economic, political, or regulatory developments, recessions, inflation, rapid interest rate changes, war, military conflict, acts of terrorism, natural disasters, and outbreaks of infectious illnesses or other widespread public health issues (such as the coronavirus pandemic) and related governmental and public responses (including sanctions). Certain events may cause instability across global markets, including reduced liquidity and disruptions in trading markets, while some events may affect certain geographic regions, countries, sectors, and industries more significantly than others. Government intervention in markets may impact interest rates, market volatility, and security pricing. These adverse developments may cause broad declines in market value due to short-term market movements or for significantly longer periods during more prolonged market downturns. |
| Large-cap stocks | Large-cap stocks: Securities issued by large-cap companies tend to be less volatile than securities issued by small- and mid-cap companies. However, large-cap companies may not be able to attain the high growth rates of successful small- and mid-cap companies, especially during strong economic periods, and may be unable to respond as quickly to competitive challenges. |
| Stock investing | Stock investing: Stocks generally fluctuate in value more than bonds and may decline significantly over short time periods. There is a chance that stock prices overall will decline because stock markets tend to move in cycles, with periods of rising and falling prices. The value of stocks held by the fund may decline due to general weakness or volatility in the stock markets in which the fund invests or because of factors that affect a particular company or industry. |
| Risk Nondiversified Status [Member] | Nondiversification: As a nondiversified fund, the fund has the ability to invest a larger percentage of its assets in the securities of a smaller number of issuers than a diversified fund. As a result, poor performance by a single issuer could adversely affect fund performance more than if the fund were invested in a larger number of issuers. The fund’s share price can be expected to fluctuate more than that of a similar fund that is more broadly diversified. |
| Sector exposure | Sector exposure: To the extent the fund invests in specific industries or sectors, it may be more susceptible to developments affecting those industries and sectors. |
| Information technology sector | Information technology sector: Information technology companies face intense competition, both domestically and internationally, which may have an adverse effect on their profit margins. Like other technology companies, information technology companies may have limited product lines, markets, financial resources, or personnel. |
| Authorized Participant | Authorized Participant: Only an Authorized Participant may engage in creation or redemption transactions directly with the fund. The fund has a limited number of intermediaries that act as Authorized Participants, and none of these Authorized Participants are or will be obligated to engage in creation or redemption transactions. To the extent that Authorized Participants exit the business or are unable to proceed with creation or redemption orders with respect to the fund and no other Authorized Participant is able to step forward to create or redeem, (i) the market price of the fund’s shares may trade at a premium or discount to its net asset value (NAV), (ii) an active trading market for the fund may not develop or be maintained, and (iii) there is no assurance that the requirements of the exchange necessary to maintain the listing of the fund will continue to be met or remain unchanged. |
| ETF shares trading | ETF shares trading: Shares of the fund are listed for trading on a national securities exchange and are bought and sold in the secondary market at market prices. The market prices of shares are expected to fluctuate in response to changes in the fund’s NAV, the value of the fund’s holdings, and supply and demand for shares. Disruptions to creations and redemptions, significant market volatility, potential lack of an active trading market for the shares (including through a trading halt), or other factors may widen bid-ask spreads and result in the shares trading significantly above (at a premium) or below (at a discount) to NAV or to the value of the fund’s holdings. If a shareholder purchases shares at a time when the market price is at a premium to the NAV or sells shares at a time when the market price is at a discount to the NAV, the shareholder may sustain losses. |
| New fund | New fund: Because the fund is new, it has a relatively small number of shareholders and assets under management. As a result, the portfolio manager may experience difficulties in fully implementing the fund’s investment program and may be less able to respond to increases in shareholder transaction activity. The fund’s limited operating history could make it more difficult to evaluate the performance of the portfolio manager and the fund’s investment strategies. In addition, there can be no assurance that the fund will ultimately grow to an economically viable size, which could lead to the fund eventually ceasing its operations. |
| Active management | Active management: The fund’s overall investment program and holdings selected by the fund’s investment adviser may underperform the broad markets, relevant indices, or other funds with similar objectives and investment strategies. |
| Cybersecurity breaches | Cybersecurity breaches: The fund could be harmed by intentional cyberattacks and other cybersecurity breaches, including unauthorized access to the fund’s assets, confidential information, or other proprietary information. In addition, a cybersecurity breach could cause one of the fund’s service providers or financial intermediaries to suffer unauthorized data access, data corruption, or loss of operational functionality. |
The following performance information provides some indication of the risks of investing in the fund. The fund’s performance information represents only past performance (before and after taxes) and is not necessarily an indication of future results.
The following bar chart illustrates how much returns can differ from year to year by showing calendar year returns and the best and worst calendar quarter returns during those years for the fund.
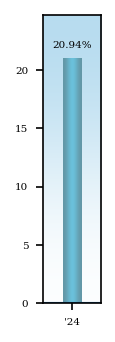
Quarter Ended | Total Return | Quarter Ended | Total Return | |||||
Best Quarter | 3/31/24 | 9.72% | Worst Quarter | 12/31/24 | 0.31% |
The following table shows the average annual total returns for the fund. The fund’s performance information included in the table is compared with a regulatory required index that represents an overall securities market (Regulatory Benchmark). In addition, the table may also include one or more indexes that more closely aligns to the fund’s investment strategy (Strategy Benchmark(s)).
In addition, the table shows hypothetical after-tax returns to demonstrate how taxes paid by a shareholder may influence returns. After-tax returns are calculated using the historical highest individual federal marginal income tax rates and do not reflect the impact of state and local taxes. Actual after-tax returns depend on an investor’s tax situation and may differ from those shown. After-tax returns shown are not relevant to investors who hold their fund shares through tax-deferred arrangements, such as a 401(k) account or an IRA.
Average Annual Total Returns - T. Rowe Price Capital Appreciation Equity ETF |
Label |
1 Year |
Since Inception |
Inception Date |
||
|---|---|---|---|---|---|---|
| Capital Appreciation Equity ETF | 20.94% | 20.63% | Jun. 15, 2023 | |||
| Capital Appreciation Equity ETF | After Taxes on Distributions | 20.82% | 20.50% | ||||
| Capital Appreciation Equity ETF | After Taxes on Distributions and Sales | 12.49% | 15.90% | ||||
| Russell 3000® Index | [1] | Russell 3000® Index | ||||
| Russell 3000® Index | Russell 3000® Index | |||||
| Russell 3000® Index | 23.81% | 21.40% | [2] | |||
| S&P 500 Index | S&P 500 Index | |||||
| S&P 500 Index | 25.02% | 22.85% | [2] | |||
| [1] | Due to new SEC Rules on shareholder reporting, the fund adopted a new broad-based securities market index, referred to as the Regulatory Benchmark. |
| [2] | Return since 6/15/23. |
Updated performance information is available through troweprice.com.