Feb. 28, 2025
The investment objective of the Diamond Hill Small Cap Fund is to provide long-term capital appreciation.
| SHAREHOLDER FEES (fees paid directly from your investment) | ||
| None | ||
ANNUAL FUND OPERATING EXPENSES (expenses that you pay each year as a percentage of the value of your investment) | |||||||||||
Investor | Class I | Class Y | |||||||||
| Management fees | 0.80 | % | 0.80 | % | 0.80 | % | |||||
| Distribution (12b-1) fees | 0.25 | % | None | None | |||||||
| Other expenses | 0.21 | % | 0.17 | % | 0.05 | % | |||||
| Total annual fund operating expenses | 1.26 | % | 0.97 | % | 0.85 | % | |||||
1 Year | 3 Years | 5 Years | 10 Years | |||||||||||
| Investor | $128 | $400 | $692 | $1,523 | ||||||||||
| Class I | 99 | 309 | 536 | 1,190 | ||||||||||
| Class Y | 87 | 271 | 471 | 1,049 | ||||||||||
The fund, under normal market conditions, invests at least 80% of its net assets in U.S. equity securities with small market capitalizations that Diamond Hill Capital Management, Inc. (the "Adviser”) believes are undervalued. Equity securities consist of common and preferred stocks. Small cap companies are defined as companies with market capitalizations at the time of purchase below $3 billion or in the range of those market capitalizations of companies included in the Russell 2000 Index at the time of purchase. The capitalization range of the Russell 2000 Index is between $3.8 million and $15.9 billion as of January 31, 2025. The size of the companies included in the Russell 2000 Index will change with market conditions.
The Adviser focuses on estimating a company’s value independent of its current stock price. To estimate a company’s value, the Adviser concentrates on the fundamental economic drivers of the business. The primary focus is on “bottom-up” analysis, which takes into consideration earnings, revenue growth, operating margins and other economic factors. The Adviser also considers the level of industry competition, regulatory factors, the threat of technological obsolescence, and a variety of other industry factors. If the Adviser’s estimate of a company’s value differs sufficiently from the current market price, the company may be an attractive investment opportunity. In constructing a portfolio of securities, the Adviser is not constrained by the sector or industry weights in the benchmark. The Adviser relies on individual stock selection and discipline in the investment process to add value. The highest portfolio security weights are assigned to companies where the Adviser has the highest level of conviction.
Once a stock is selected, the Adviser continues to monitor the company’s strategies, financial performance and competitive environment. The Adviser may sell a security as it reaches the Adviser’s estimate of the company’s value if it believes that the company’s earnings, revenue growth, operating margin or other economic factors are deteriorating or if it identifies a stock that it believes offers a better investment opportunity.
The following bar chart and table show two aspects of the fund: volatility and performance. The bar chart shows the volatility — or variability — of the fund’s annual total returns over time, and shows that fund performance can change from year to year. The table shows the fund’s average annual total returns for certain time periods compared to the returns of a broad-based securities index and a supplemental index. The bar chart and table provide some indication of the risks of investing in the fund. Of course, the fund’s past performance (before and after taxes) is not necessarily an indication of its future performance. Updated performance information is available by visiting www.diamond-hill.com or by calling 888-226-5595.
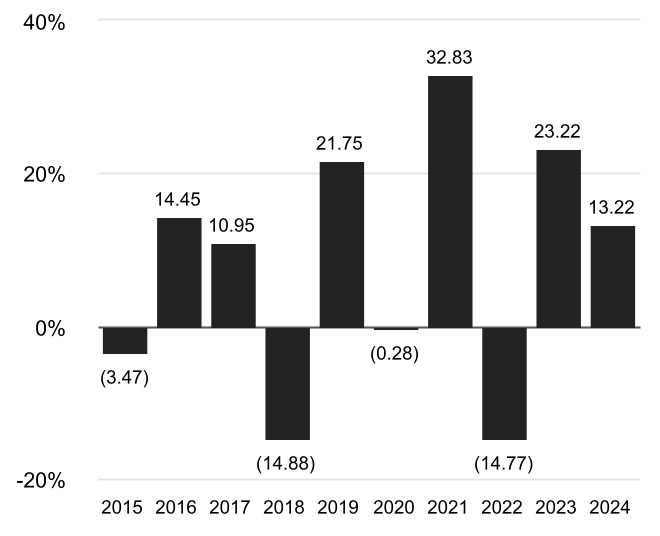
| Best Quarter: | 4Q 2020, +26.68% | ||||
| Worst Quarter: | 1Q 2020, -36.17% | ||||
| Inception Date of Class | One Year | Five Year | Ten Year | |||||||||||
Class I Before Taxes | 4/29/05 | 13.22 | % | 9.51 | % | 7.18 | % | |||||||
| After Taxes on Distributions | 8.82 | 5.75 | 4.64 | |||||||||||
| After Taxes on Distributions and Sale of Fund Shares | 9.87 | 6.99 | 5.31 | |||||||||||
Investor Before Taxes | 12/29/00 | 12.88 | 9.21 | 6.88 | ||||||||||
Class Y Before Taxes | 12/30/11 | 13.31 | 9.66 | 7.31 | ||||||||||
Russell 3000 Index | 23.81 | 13.86 | 12.55 | |||||||||||
| Russell 2000 Index | 11.54 | 7.40 | 7.82 | |||||||||||
The fund's broad-based securities market index is the Russell 3000 Index, which measures the performance of roughly 3,000 of the largest US companies based on total market capitalization.
The Russell 2000 Index represents an index of securities that reflect the market sectors in which the fund invests and is utilized by the Adviser for measuring performance. The Russell 2000 Index measures the performance of roughly 2,000 US small-cap companies.
The indexes are unmanaged, market capitalization weighted, include net reinvested dividends, do not reflect fees or expenses (which would lower the return), and are not available for direct investment.
The investment objective of the Diamond Hill Small-Mid Cap Fund is to provide long-term capital appreciation.
| SHAREHOLDER FEES (fees paid directly from your investment) | ||
| None | ||
| ANNUAL FUND OPERATING EXPENSES (expenses that you pay each year as a percentage of the value of your investment) | |||||||||||
| Investor | Class I | Class Y | |||||||||
| Management fees | 0.75 | % | 0.75 | % | 0.75 | % | |||||
| Distribution (12b-1) fees | 0.25 | % | None | None | |||||||
| Other expenses | 0.21 | % | 0.17 | % | 0.05 | % | |||||
| Total annual fund operating expenses | 1.21 | % | 0.92 | % | 0.80 | % | |||||
1 Year | 3 Years | 5 Years | 10 Years | |||||||||||
| Investor | $123 | $384 | $665 | $1,466 | ||||||||||
| Class I | 94 | 293 | 509 | 1,131 | ||||||||||
| Class Y | 82 | 255 | 444 | 990 | ||||||||||
The fund, under normal market conditions, invests at least 80% of its net assets in U.S. equity securities with small and medium market capitalizations that Diamond Hill Capital Management, Inc. (the "Adviser”) believes are undervalued. Equity securities consist of common and preferred stocks. Small and mid cap companies are defined as companies with market capitalizations at the time of purchase between $500 million and $10 billion or in the range of those market capitalizations of companies included in the Russell 2500 Index at the time of purchase. The capitalization range of the Russell 2500 Index is between $3.8 million and $51.4 billion as of January 31, 2025. The size of the companies included in the Russell 2500 Index will change with market conditions.
The Adviser focuses on estimating a company’s value independent of its current stock price. To estimate a company’s value, the Adviser concentrates on the fundamental economic drivers of the business. The primary focus is on “bottom-up” analysis, which takes into consideration earnings, revenue growth, operating margins and other economic factors. The Adviser also considers the level of industry competition, regulatory factors, the threat of technological obsolescence, and a variety of other industry factors. If the Adviser’s estimate of a company’s value differs sufficiently from the current market price, the company may be an attractive investment opportunity. In constructing a portfolio of securities, the Adviser is not constrained by the sector or industry weights in the benchmark. The Adviser relies on individual stock selection and discipline in the investment process to add value. The highest portfolio security weights are assigned to companies where the Adviser has the highest level of conviction.
Once a stock is selected, the Adviser continues to monitor the company’s strategies, financial performance and competitive environment. The Adviser may sell a security as it reaches the Adviser’s estimate of the company’s value if it believes that the company’s earnings, revenue growth, operating margin or other economic factors are deteriorating; or, if it identifies a stock that it believes offers a better investment opportunity.
The following bar chart and table show two aspects of the fund: volatility and performance. The bar chart shows the volatility — or variability — of the fund’s annual total returns over time, and shows that fund performance can change from year to year. The table shows the fund’s average annual total returns for certain time periods compared to the returns of a broad-based securities index and a supplemental index. The bar chart and table provide some indication of the risks of investing in the fund. Of course, the fund’s past performance (before and after taxes) is not necessarily an indication of its future performance. Updated performance information is available by visiting www.diamond-hill.com or by calling 1-888-226-5595.
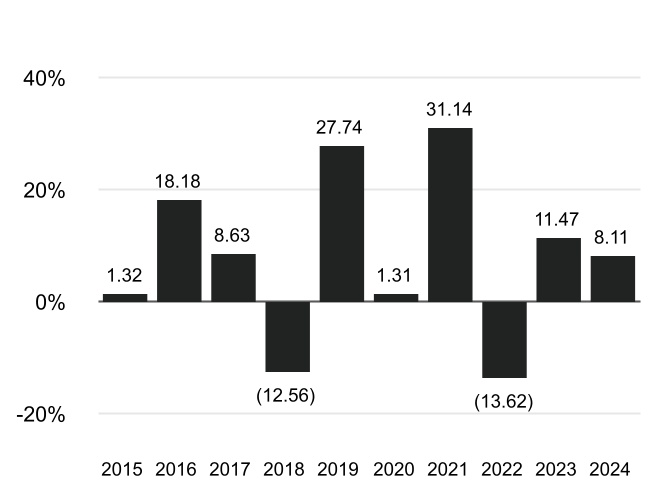
| Best Quarter: | 4Q 2020, +23.26% | ||||
| Worst Quarter: | 1Q 2020, -35.83% | ||||
Inception Date of Class | One Year | Five Year | Ten Year | |||||||||||
Class I Before Taxes | 12/30/05 | 8.11 | % | 6.70 | % | 7.23 | % | |||||||
| After Taxes on Distributions | 6.26 | 5.66 | 6.29 | |||||||||||
| After Taxes on Distributions and Sale of Fund Shares | 6.20 | 5.20 | 5.71 | |||||||||||
Investor Before Taxes | 12/30/05 | 7.78 | 6.39 | 6.91 | ||||||||||
Class Y Before Taxes | 12/30/11 | 8.23 | 6.84 | 7.35 | ||||||||||
Russell 3000 Index | 23.81 | 13.86 | 12.55 | |||||||||||
| Russell 2500 Index | 12.00 | 8.77 | 8.85 | |||||||||||
The fund's broad-based securities market index is the Russell 3000 Index, which measures the performance of roughly 3,000 of the largest US companies based on total market capitalization.
The Russell 2500 Index represents an index of securities that reflect the market sectors in which the fund invests and is utilized by the Adviser for measuring performance. The Russell 2500 Index measures the performance of roughly 2,500 US small to mid-cap companies.
The indexes are unmanaged, market capitalization weighted, include net reinvested dividends, do not reflect fees or expenses (which would lower the return), and are not available for direct investment.
SHAREHOLDER FEES (fees paid directly from your investment) | ||
| None | ||
ANNUAL FUND OPERATING EXPENSES (expenses that you pay each year as a percentage of the value of your investment) | |||||||||||
Investor | Class I | Class Y | |||||||||
| Management fees | 0.60 | % | 0.60 | % | 0.60 | % | |||||
| Distribution (12b-1) fees | 0.25 | % | None | None | |||||||
| Other expenses | 0.21 | % | 0.17 | % | 0.05 | % | |||||
| Total annual fund operating expenses | 1.06 | % | 0.77 | % | 0.65 | % | |||||
1 Year | 3 Years | 5 Years | 10 Years | ||||||||||||||
| Investor | $108 | $337 | $585 | $1,294 | |||||||||||||
| Class I | 79 | 246 | 428 | 954 | |||||||||||||
| Class Y | 66 | 208 | 362 | 810 | |||||||||||||
The fund, under normal market conditions, invests at least 80% of its net assets in U.S. equity securities with medium market capitalizations that Diamond Hill Capital Management, Inc. (the "Adviser”) believes are undervalued. Equity securities consist of common and preferred stocks. Mid cap companies are defined as companies with market capitalizations at the time of purchase between $1.5 billion and $20 billion or in the range of those market capitalizations of companies included in the Russell Midcap Index at the time of purchase. The capitalization range of the Russell Midcap Index is between $338.1 million and $187.9 billion as of January 31, 2025. The size of the companies included in the Russell Midcap Index will change with market conditions.
The Adviser focuses on estimating a company’s value independent of its current stock price. To estimate a company’s value, the Adviser concentrates on the fundamental economic drivers of the business. The primary focus is on “bottom-up” analysis, which takes into consideration earnings, revenue growth, operating margins and other economic factors. The Adviser also considers the level of industry competition, regulatory factors, the threat of technological obsolescence, and a variety of other industry factors. If the Adviser’s estimate of a company’s value differs sufficiently from the current market price, the company may be an attractive investment opportunity. In constructing a portfolio of securities, the Adviser is not constrained by the sector or industry weights in the benchmark. The Adviser relies on individual stock selection and discipline in the investment process to add value. The highest portfolio security weights are assigned to companies where the Adviser has the highest level of conviction.
Once a stock is selected, the Adviser continues to monitor the company’s strategies, financial performance and competitive environment. The Adviser may sell a security as it reaches the Adviser’s estimate of the company’s value if it believes that the company’s earnings, revenue growth, operating margin or other economic factors are deteriorating or if it identifies a stock that it believes offers a better investment opportunity.
The following bar chart and table show two aspects of the fund: volatility and performance. The bar chart shows the volatility — or variability — of the fund’s annual total returns over time, and shows that fund performance can change from year to year. The table shows the fund’s average annual total returns for certain time periods compared to the returns of a broad-based securities index and a supplemental index. The bar chart and table provide some indication of the risks of investing in the fund. Of course, the fund’s past performance (before and after taxes) is not necessarily an indication of its future performance. Updated performance information is available by visiting www.diamond-hill.com or by calling 1-888-226-5595.
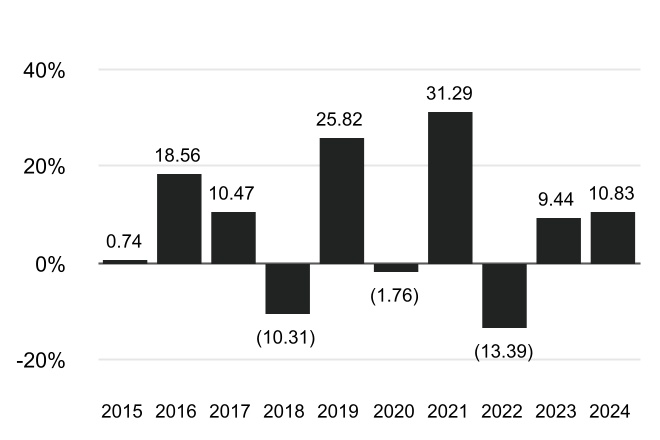
| Best Quarter: | 4Q 2020, +22.19% | ||||
| Worst Quarter: | 1Q 2020, -36.76% | ||||
| Inception Date of Class | One Year | Five Year | Ten Year | |||||||||||
Class I Before Taxes | 12/31/13 | 10.83 | % | 6.26 | % | 7.27 | % | |||||||
After Taxes on Distributions | 8.67 | 5.37 | 6.61 | |||||||||||
After Taxes on Distributions and Sale of Fund Shares | 8.06 | 4.86 | 5.82 | |||||||||||
Investor Before Taxes | 12/31/13 | 10.50 | 5.95 | 6.96 | ||||||||||
Class Y Before Taxes | 12/31/13 | 10.93 | 6.38 | 7.39 | ||||||||||
Russell 3000 Index | 23.81 | 13.86 | 12.55 | |||||||||||
| Russell Midcap Index | 15.34 | 9.92 | 9.63 | |||||||||||
The fund's broad-based securities market index is the Russell 3000 Index, which measures the performance of roughly 3,000 of the largest US companies based on total market capitalization.
The Russell Midcap Index represents an index of securities that reflect the market sectors in which the fund invests and is utilized by the Adviser for measuring performance. The Russell Midcap Index measures the performance of roughly 800 US mid-cap companies.
The indexes are unmanaged, market capitalization weighted, include net reinvested dividends, do not reflect fees or expenses (which would lower the return), and are not available for direct investment.
The investment objective of the Diamond Hill Large Cap Fund is to provide long-term capital appreciation.
SHAREHOLDER FEES (fees paid directly from your investment) | ||
| None | ||
ANNUAL FUND OPERATING EXPENSES (expenses that you pay each year as a percentage of the value of your investment) | |||||||||||
| Investor | Class I | Class Y | |||||||||
| Management fees | 0.50 | % | 0.50 | % | 0.50 | % | |||||
| Distribution (12b-1) fees | 0.25 | % | None | None | |||||||
| Other expenses | 0.21 | % | 0.17 | % | 0.05 | % | |||||
| Total annual fund operating expenses | 0.96 | % | 0.67 | % | 0.55 | % | |||||
1 Year | 3 Years | 5 Years | 10 Years | |||||||||||
| Investor | $98 | $306 | $531 | $1,178 | ||||||||||
| Class I | 68 | 214 | 373 | 835 | ||||||||||
| Class Y | 56 | 176 | 307 | 689 | ||||||||||
The fund, under normal market conditions, invests at least 80% of its net assets in U.S. equity securities with large market capitalizations ("large cap") that Diamond Hill Capital Management, Inc. (the "Adviser”) believes are undervalued. Equity securities consist of common and preferred stocks. Large cap companies are defined as companies with market capitalizations at the time of purchase of $5 billion or greater.
The Adviser focuses on estimating a company’s value independent of its current stock price. To estimate a company’s value, the Adviser concentrates on the fundamental economic drivers of the business. The primary focus is on “bottom-up” analysis, which takes into consideration earnings, revenue growth, operating margins and other economic factors. The Adviser also considers the level of industry competition, regulatory factors, the threat of technological obsolescence, and a variety of other industry factors. If the Adviser’s estimate of a company’s value differs sufficiently from the current market price, the company may be an attractive investment opportunity. In constructing a portfolio of securities, the Adviser is not constrained by the sector or industry weights in the benchmark. The Adviser relies on individual stock selection and discipline in the investment process to add value. The highest portfolio security weights are assigned to companies where the Adviser has the highest level of conviction.
Once a stock is selected, the Adviser continues to monitor the company’s strategies, financial performance and competitive environment. The Adviser may sell a security as it reaches the Adviser’s estimate of the company’s value if it believes that the company’s earnings, revenue growth, operating margin or other economic factors are deteriorating or if it identifies a stock that it believes offers a better investment opportunity.
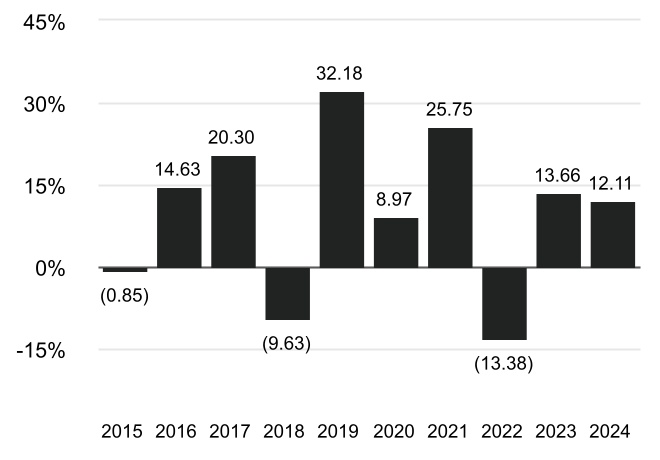
| Best Quarter: | 2Q 2020, +18.06% | ||||
| Worst Quarter: | 1Q 2020, -26.82% | ||||
Inception Date of Class | One Year | Five Year | Ten Year | |||||||||||
Class I Before Taxes | 1/31/05 | 12.11 | % | 8.63 | % | 9.46 | % | |||||||
After Taxes on Distributions | 9.58 | 7.08 | 8.04 | |||||||||||
After Taxes on Distributions and Sale of Fund Shares | 9.06 | 6.68 | 7.47 | |||||||||||
Investor Before Taxes | 6/29/01 | 11.83 | 8.31 | 9.15 | ||||||||||
Class Y Before Taxes | 12/30/11 | 12.26 | 8.75 | 9.59 | ||||||||||
Russell 3000 Index | 23.81 | 13.86 | 12.55 | |||||||||||
Russell 1000 Value Index | 14.37 | 8.68 | 8.49 | |||||||||||
| Russell 1000 Index | 24.51 | 14.28 | 12.87 | |||||||||||
The fund's broad-based securities market index is the Russell 3000 Index, which measures the performance of roughly 3,000 of the largest US companies based on total market capitalization.
The Russell 1000 Value Index represents the index of securities that is utilized by the Adviser for measuring performance. The Russell 1000 Value Index and the Russell 1000 Index represent indexes of securities that reflect the market sectors in which the fund may invest.
The Russell 1000 Value Index measures the performance of US large- cap companies with lower price/book ratios and forecasted growth values. The Russell 1000 Index measures the performance of roughly 1,000 US large-cap companies.
The indexes are unmanaged, market capitalization weighted, include net reinvested dividends, do not reflect fees or expenses (which would lower the return), and are not available for direct investment.
The investment objective of the Diamond Hill Large Cap Concentrated Fund is to provide long-term capital appreciation.
This table describes the fees and expenses that you may pay if you buy and hold shares of the fund. You may pay other fees, such as brokerage commissions and other fees to financial intermediaries, which are not reflected in the tables and examples below.
| SHAREHOLDER FEES (fees paid directly from your investment) | ||
| None | ||
| ANNUAL FUND OPERATING EXPENSES (expenses that you pay each year as a percentage of the value of your investment) | |||||||||||
| Investor | Class I | Class Y | |||||||||
| Management fees | 0.50 | % | 0.50 | % | 0.50 | % | |||||
| Distribution (12b-1) fees | 0.25 | % | None | None | |||||||
| Other expenses | 0.21 | % | 0.17 | % | 0.05 | % | |||||
| Total annual fund operating expenses | 0.96 | % | 0.67 | % | 0.55 | % | |||||
| 1 Year | 3 Years | 5 Years | 10 Years | |||||||||||
| Investor | $98 | $306 | $531 | $1,178 | ||||||||||
| Class I | 68 | 214 | 373 | 835 | ||||||||||
| Class Y | 56 | 176 | 307 | 689 | ||||||||||
The fund pays transaction costs, such as commissions, when it buys and sells securities (or “turns over” its portfolio). A higher portfolio turnover rate may indicate higher transaction costs and may result in higher taxes when fund shares are held in a taxable account. These costs, which are not reflected in annual fund operating expenses or in the Example, affect the fund’s performance. During the most recent fiscal year, the fund's portfolio turnover rate was 40% of the average value of its portfolio.
The fund, under normal market conditions, invests at least 80% of its net assets in U.S. equity securities with large market capitalizations ("large cap") that Diamond Hill Capital Management, Inc. (the “Adviser”) believes are undervalued. Equity securities consist of common and preferred stocks. Large cap companies are defined as companies with market capitalizations of $15 billion or greater at the time of purchase. The fund is non-diversified and intends to concentrate its investments in approximately 20 securities.
The Adviser focuses on estimating a company’s value independent of its current stock price. To estimate a company’s value, the Adviser concentrates on the fundamental economic drivers of the business. The primary focus is on “bottom-up” analysis, which takes into consideration earnings, revenue growth, operating margins and other economic factors. The Adviser also considers the level of industry competition, regulatory factors, the threat of technological obsolescence, and a variety of other industry factors. If the Adviser’s estimate of a company’s value differs sufficiently from the current market price, the company may be an attractive investment opportunity. In constructing a portfolio of securities, the Adviser is not constrained by the sector or industry weights in the benchmark. The Adviser relies on individual stock selection and discipline in the investment process to add value. The highest portfolio security weights are assigned to companies where the Adviser has the highest level of conviction.
Once a stock is selected, the Adviser continues to monitor the company’s strategies, financial performance and competitive environment. The Adviser may sell a security as it reaches the Adviser’s estimate of the company’s value if it believes that the company’s earnings, revenue growth, operating margin or other economic factors are deteriorating, or if it identifies a stock that it believes offers a better investment opportunity.
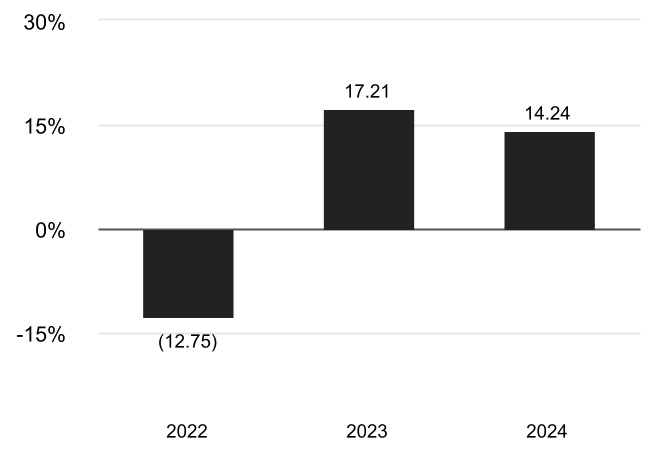
| Best Quarter: | 4Q 2023, +12.51% | ||||
| Worst Quarter: | 2Q 2022, -15.55% | ||||
Inception Date of Class | One Year | Since Inception | |||||||||
Class I Before Taxes | 2/26/21 | 14.24 | % | 9.41 | % | ||||||
After Taxes on Distributions | 12.50 | 8.68 | |||||||||
After Taxes on Distributions and Sale of Fund Shares | 9.71 | 7.32 | |||||||||
Investor Before Taxes | 2/26/21 | 13.87 | 9.07 | ||||||||
Class Y Before Taxes | 2/26/21 | 14.34 | 9.51 | ||||||||
Russell 3000 Index | 23.81 | 11.96 | |||||||||
Russell 1000 Value Index | 14.37 | 9.26 | |||||||||
| Russell 1000 Index | 24.51 | 12.65 | |||||||||
The fund's broad-based securities market index is the Russell 3000 Index, which measures the performance of roughly 3,000 of the largest US companies based on total market capitalization.
The Russell 1000 Value Index represents the index of securities that is utilized by the Adviser for measuring performance. The Russell 1000 Value Index and the Russell 1000 Index represent indexes of securities that reflect the market sectors in which the fund may invest.
The Russell 1000 Value Index measures the performance of US large- cap companies with lower price/book ratios and forecasted growth values. The Russell 1000 Index measures the performance of roughly 1,000 US large-cap companies.
The indexes are unmanaged, market capitalization weighted, include net reinvested dividends, do not reflect fees or expenses (which would lower the return), and are not available for direct investment.
SHAREHOLDER FEES (fees paid directly from your investment) | ||
| None | ||
| ANNUAL FUND OPERATING EXPENSES (expenses that you pay each year as a percentage of the value of your investment) | |||||||||||
| Investor | Class I | Class Y | |||||||||
| Management fees | 0.70 | % | 0.70 | % | 0.70 | % | |||||
| Distribution (12b-1) fees | 0.25 | % | None | None | |||||||
| Other expenses | 0.21 | % | 0.17 | % | 0.05 | % | |||||
| Total annual fund operating expenses | 1.16 | % | 0.87 | % | 0.75 | % | |||||
1 Year | 3 Years | 5 Years | 10 Years | |||||||||||
| Investor | $118 | $368 | $638 | $1,409 | ||||||||||
| Class I | 89 | 278 | 482 | 1,073 | ||||||||||
| Class Y | 77 | 240 | 417 | 930 | ||||||||||
The fund, under normal market conditions, invests its assets in U.S. equity securities of any size capitalization that Diamond Hill Capital Management, Inc. (the "Adviser”) believes are undervalued. Equity securities consist of common and preferred stocks. The fund is non-diversified and intends to concentrate its investments in a limited number of securities.
The Adviser focuses on estimating a company’s value independent of its current stock price. To estimate a company’s value, the Adviser concentrates on the fundamental economic drivers of the business. The primary focus is on “bottom-up” analysis, which takes into consideration earnings, revenue growth, operating margins and other economic factors. The Adviser also considers the level of industry competition, regulatory factors, the threat of technological obsolescence, and a variety of other industry factors. If the Adviser’s estimate of a company’s value differs sufficiently from the current market price, the company may be an attractive investment opportunity. In constructing a portfolio of securities, the Adviser is not constrained by the sector or industry weights in the benchmark. The Adviser relies on individual stock selection and discipline in the investment process to add value. The highest portfolio security weights are assigned to companies where the Adviser has the highest level of conviction.
Once a stock is selected, the Adviser continues to monitor the company’s strategies, financial performance and competitive environment. The Adviser may sell a security as it reaches the Adviser’s estimate of the company’s value if it believes that the company’s earnings, revenue growth, operating margin or other economic factors are deteriorating or if it identifies a stock that it believes offers a better investment opportunity.
The following bar chart and table show two aspects of the fund: volatility and performance. The bar chart shows the volatility — or variability — of the fund’s annual total returns over time, and shows that fund performance can change from year to year. The table shows the fund’s average annual total returns for certain time periods compared to the returns of a broad-based securities index. The bar chart and table provide some indication of the risks of investing in the fund. Of course, the fund’s past performance (before and after taxes) is not necessarily an indication of its future performance. Updated performance information is available by visiting www.diamond-hill.com or by calling 1-888-226-5595.
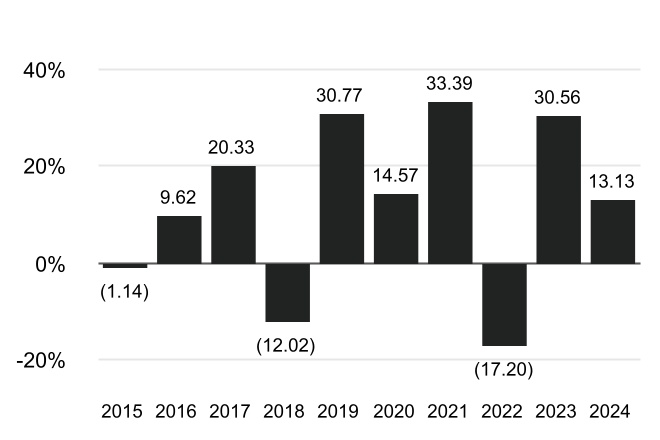
| Best Quarter: | 4Q 2020, +24.65% | ||||
| Worst Quarter: | 1Q 2020, -34.01% | ||||
| Inception Date of Class | One Year | Five Year | Ten Year | |||||||||||
Class I Before Taxes | 12/30/05 | 13.13 | % | 13.32 | % | 10.86 | % | |||||||
After Taxes on Distributions | 11.46 | 11.95 | 9.73 | |||||||||||
After Taxes on Distributions and Sale of Fund Shares | 9.04 | 10.43 | 8.66 | |||||||||||
Investor Before Taxes | 12/30/05 | 12.79 | 12.99 | 10.53 | ||||||||||
Class Y Before Taxes | 12/30/11 | 13.28 | 13.46 | 10.98 | ||||||||||
| Russell 3000 Index | 23.81 | 13.86 | 12.55 | |||||||||||
The fund's broad-based securities market index is the Russell 3000 Index which measures the performance of roughly 3,000 of the largest US companies based on total market capitalization. The Russell 3000 Index also represents an index of securities that reflect the market sectors in which the fund invests and is utilized by the Adviser for measuring performance.
The index is unmanaged, market capitalization weighted, includes net reinvested dividends, does not reflect fees or expenses (which would lower the return), and is not available for direct investment.
The investment objective of the Diamond Hill Long-Short Fund is to provide long-term capital appreciation.
SHAREHOLDER FEES (fees paid directly from your investment) | ||
| None | ||
ANNUAL FUND OPERATING EXPENSES (expenses that you pay each year as a percentage of the value of your investment) | |||||||||||
| Investor | Class I | Class Y | |||||||||
| Management fees | 0.90 | % | 0.90 | % | 0.90 | % | |||||
| Distribution (12b-1) fees | 0.25 | % | None | None | |||||||
| Other expenses | |||||||||||
| Administration fees | 0.21 | % | 0.17 | % | 0.05 | % | |||||
| Dividend expenses and fees on short sales | 0.39 | % | 0.39 | % | 0.39 | % | |||||
| Total Other expenses | 0.60 | % | 0.56 | % | 0.44 | % | |||||
| Total annual fund operating expenses | 1.75 | % | 1.46 | % | 1.34 | % | |||||
| 1 Year | 3 Years | 5 Years | 10 Years | |||||||||||
| Investor | $178 | $551 | $949 | $2,062 | ||||||||||
| Class I | 149 | 462 | 797 | 1,746 | ||||||||||
| Class Y | 136 | 425 | 734 | 1,613 | ||||||||||
The fund pays transaction costs, such as commissions, when it buys and sells securities (or “turns over” its portfolio). A higher portfolio turnover rate may indicate higher transaction costs and may result in higher taxes when fund shares are held in a taxable account. These costs, which are not reflected in annual fund operating expenses or in the Example, affect the fund’s performance. During the most recent fiscal year, the fund’s
portfolio turnover rate was 46% of the average value of its portfolio.
The fund, under normal market conditions, invests its assets in U.S. equity securities of any size capitalization that Diamond Hill Capital Management, Inc. (the "Adviser”) believes are undervalued and selling short U.S. equity securities of any size capitalization the Adviser believes are overvalued. Equity securities consist of common and preferred stocks.
The Adviser focuses on estimating a company’s value independent of its current stock price. To estimate a company’s value, the Adviser concentrates on the fundamental economic drivers of the business. The primary focus is on “bottom-up” analysis, which takes into consideration earnings, revenue growth, operating margins and other economic factors. The Adviser also considers the level of industry competition, regulatory factors, the threat of technological obsolescence, and a variety of other industry factors. If the Adviser’s estimate of a company’s value differs sufficiently from the current market price, the company may be an attractive investment opportunity. In constructing a portfolio of securities, the Adviser is not constrained by the sector or industry weights in the benchmark. The Adviser relies on individual stock selection and discipline in the investment process to add value. The highest portfolio security weights are assigned to companies where the Adviser has the highest level of conviction.
The fund also will sell securities short. Short sales are effected when it is believed that the price of a particular security will decline, and involves the sale of a security which the fund does not own in hopes of purchasing the same security at a later date at a lower price. To make delivery to the buyer, the fund must borrow the security, and the fund is obligated to return the security to the lender, which is accomplished by a later purchase of the security by the fund. The frequency of short sales will vary substantially in different periods, and it is not intended that any specified portion of the fund’s assets will as a matter of practice be invested in short sales. The fund will not make a short sale if, immediately before the transaction, the market value of all securities sold short exceeds 40% of the value of the fund’s net assets.
Once a stock is purchased or sold short, the Adviser continues to monitor the company’s strategies, financial performance and competitive environment. The Adviser may sell a security (or repurchase a security sold short) as it reaches the Adviser’s estimate of the company’s value if it believes that the company’s earnings, revenue growth, operating margin or other economic factors are deteriorating (or improving in the case of a short sale); or, if it identifies a stock that it believes offers a better investment opportunity.
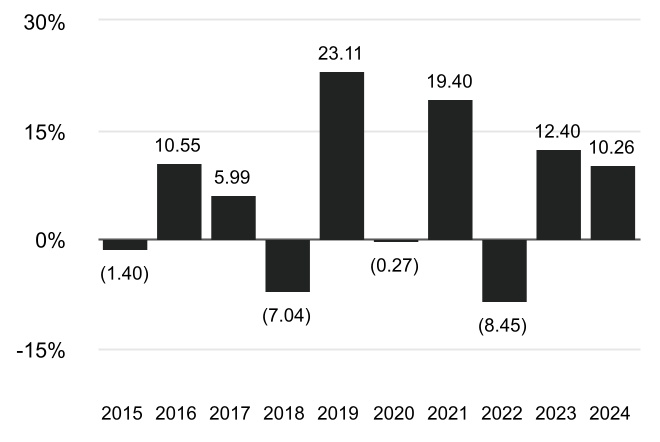
| Best Quarter: | 4Q 2020, +13.78% | ||||
| Worst Quarter: | 1Q 2020, -23.39% | ||||
| Inception Date of Class | One Year | Five Year | Ten Year | |||||||||||
Class I Before Taxes | 1/31/05 | 10.26 | % | 6.20 | % | 5.97 | % | |||||||
After Taxes on Distributions | 7.80 | 4.69 | 4.79 | |||||||||||
After Taxes on Distributions and Sale of Fund Shares | 7.55 | 4.67 | 4.59 | |||||||||||
Investor Before Taxes | 6/30/00 | 9.94 | 5.89 | 5.67 | ||||||||||
Class Y Before Taxes | 12/30/11 | 10.38 | 6.32 | 6.09 | ||||||||||
Russell 3000 Index | 23.81 | 13.86 | 12.55 | |||||||||||
| Russell 1000 Index | 24.51 | 14.28 | 12.87 | |||||||||||
| 60% Russell 1000 Index/40% Bloomberg US T-Bills 1-3 Month Index | 16.63 | 9.87 | 8.61 | |||||||||||
The fund's broad-based securities market index is the Russell 3000 Index, which measures the performance of roughly 3,000 of the largest US companies based on total market capitalization.
The Russell 1000 Index represents an index of securities that reflect the market sectors in which the fund invests. The Russell 1000 Index measures the performance of roughly 1,000 US large-cap companies.
The blended benchmark represents a 60/40 weighted blend of the Russell 1000 Index and the Bloomberg US Treasury Bills 1-3 Month Index. The Bloomberg US Treasury Bills 1-3 Month Index measures the performance of US Treasury bills with time to maturity between 1 and 3 months. The blended benchmark is utilized by the Adviser for measuring performance.
The indexes are unmanaged, market capitalization weighted, include net reinvested dividends, do not reflect fees or expenses (which would lower the return), and are not available for direct investment.
SHAREHOLDER FEES (fees paid directly from your investment) | ||
| None | ||
ANNUAL FUND OPERATING EXPENSES (expenses that you pay each year as a percentage of the value of your investment) | |||||||||||
| Investor | Class I | Class Y | |||||||||
| Management fees | 0.65 | % | 0.65 | % | 0.65 | % | |||||
| Distribution (12b-1) fees | 0.25 | % | None | None | |||||||
Administration fees | 0.21 | % | 0.17 | % | 0.05 | % | |||||
| Other expenses | 0.03 | % | 0.03 | % | 0.03 | % | |||||
| Total annual fund operating expenses | 1.14 | % | 0.85 | % | 0.73 | % | |||||
| 1 Year | 3 Years | 5 Years | 10 Years | |||||||||||
| Investor | $116 | $362 | $628 | $1,386 | ||||||||||
| Class I | 87 | 271 | 471 | 1,049 | ||||||||||
| Class Y | 75 | 233 | 406 | 906 | ||||||||||
The fund, under normal market conditions, invests its assets primarily in non-U.S. equity securities of companies of any size that Diamond Hill Capital Management, Inc. (the “Adviser”) believes are undervalued. Equity securities consist of common and preferred stocks. Under normal market conditions, the fund will invest at least 80% of its net assets in securities issued by companies (i) that are headquartered or have their principal place of business outside the U.S., (ii) whose primary trading markets are outside the U.S. or (iii) that have at least 50% of their assets in, or expect to derive at least 50% of their total revenues or profits from, goods or services produced in or sales made in countries outside the U.S. The fund intends to diversify its investments across different countries and regions, including emerging markets. Emerging market countries include those generally recognized to be an emerging market country by the international financial community; classified by the United Nations as a developing country; or classified as an emerging market country by MSCI or other index or data provider.
The Adviser focuses on estimating a company’s value independent of its current stock price. To estimate a company’s value, the Adviser concentrates on the fundamental economic drivers of the business. The primary focus is on “bottom-up” analysis, which takes into consideration earnings, revenue growth, operating margins and other economic factors. The Adviser also considers the level of industry competition, regulatory factors, the threat of technological obsolescence, and a variety of other industry factors. If the Adviser’s estimate of a company’s value differs sufficiently from the current market price, the company may be an attractive investment opportunity. In constructing a portfolio of securities, the Adviser is not constrained by the sector or industry weights in the benchmark. The Adviser relies on individual stock selection and discipline in the investment process to add value. The highest portfolio security weights are assigned to companies where the Adviser has the highest level of confidence.
Once a stock is selected, the Adviser continues to monitor the company’s strategies, financial performance and competitive environment. The Adviser may sell a security as it reaches the Adviser’s estimate of the company’s value if it believes that the company’s earnings, revenue growth, operating margin or other economic factors are deteriorating, or if it identifies a stock that it believes offers a better investment opportunity.
The following bar chart and table show two aspects of the fund: volatility and performance. The bar chart shows the volatility - or variability - of the fund’s annual total returns over time, and shows that fund performance can change from year to year.
Prior to calendar year 2019, the bar chart and table reflect the past performance of Diamond Hill International Equity Fund, LP (the “International Partnership”), a private fund managed with full investment authority by the Adviser, and provide some indication of the risks of investing in the fund by showing changes in the fund’s performance from year to year over the periods indicated and by showing how the fund’s average annual total returns for the periods indicated compared to a broad-based securities index. The fund is managed in all material respects in a manner equivalent to the management of the International Partnership. The fund’s objectives, policies, guidelines and restrictions are in all material respects equivalent to the International Partnership, and the fund was created for reasons entirely unrelated to the establishment of a performance record. The assets of the International Partnership were converted, based on their value on June 28, 2019, into assets of the fund prior to commencement of operations of the fund. The performance of the International Partnership has been restated to reflect the net expenses and maximum applicable sales charge of the fund for its initial years of investment operations. The International Partnership was not registered under the Investment Company Act of 1940, as amended (the “1940 Act”), and therefore, was not subject to certain investment restrictions imposed by the 1940 Act. If the International Partnership had been registered under the 1940 Act, its performance may have been adversely affected. Performance of the fund prior to calendar year 2019 is measured from December 30, 2016, the inception of the International Partnership, and is not the performance of the fund. The fund’s and the International Partnership’s past performance (before and after taxes) is not necessarily an indication of how the fund will perform in the future either before or after taxes. Updated performance information is available by visiting www.diamond-hill.com or by calling 1-888-226-5595.
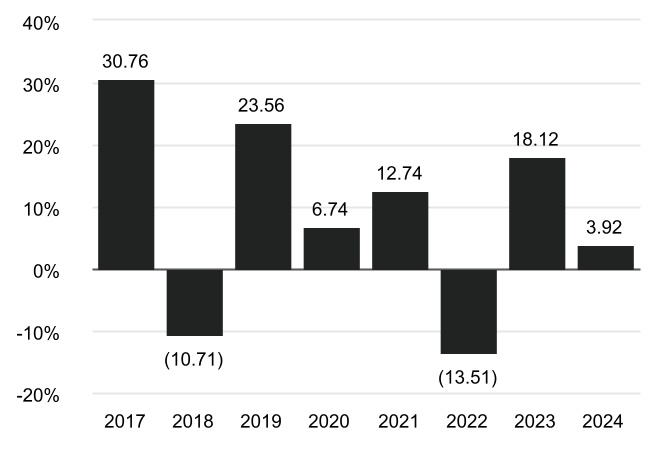
| Best Quarter: | 4Q 2020, +22.69% | ||||
| Worst Quarter: | 1Q 2020, -26.28% | ||||
After-tax returns are calculated using the highest historical individual federal marginal income tax rate and do not reflect the impact of state and local taxes. Actual after-tax returns depend on a shareholder's tax situation and may differ from those shown. After-tax returns are not relevant for shareholders who hold fund shares in tax-deferred accounts or to shares held by non-taxable entities. After-tax returns are shown for Class I shares only and will vary from the after-tax returns for the other share classes. After-tax returns prior to five years are not provided because the International Partnership’s tax treatment was different than that of a registered investment company.
| Inception Date of Class | One Year | Five Years | Since Inception (12/30/16) | |||||||||||
Class I Before Taxes | 06/28/19 | 3.92 | % | 5.02 | % | 7.94 | % | |||||||
After Taxes on Distributions | 3.55 | 4.56 | N/A | |||||||||||
After Taxes on Distributions and Sale of Fund Shares | 2.59 | 3.88 | N/A | |||||||||||
Investor Before Taxes | 06/28/19 | 3.56 | 4.72 | 7.63 | ||||||||||
Class Y Before Taxes | 06/28/19 | 4.03 | 5.14 | 8.06 | ||||||||||
| MSCI ACWI ex USA Index | 5.53 | 4.10 | 6.23 | |||||||||||
The fund's broad-based securities market index is the MSCI ACWI ex USA Index. The MSCI ACWI ex USA Index measures the performance of large- and mid-cap stocks in developed (excluding the US) and emerging markets. The MSCI ACWI ex USA Index also represents an index of non-U.S. securities that reflect the market sectors in which the fund invests and is utilized by the Adviser for measuring performance.
The index is unmanaged, market capitalization weighted, includes net reinvested dividends, does not reflect fees or expenses (which would lower return), and is not available for direct investment.
SHAREHOLDER FEES (fees paid directly from your investment) | ||
| None | ||
ANNUAL FUND OPERATING EXPENSES (expenses that you pay each year as a percentage of the value of your investment) | |||||||||||
| Investor | Class I | Class Y | |||||||||
| Management fees | 0.35 | % | 0.35 | % | 0.35 | % | |||||
| Distribution (12b-1) fees | 0.25 | % | None | None | |||||||
| Other expenses | 0.21 | % | 0.17 | % | 0.05 | % | |||||
Acquired fund fees and expenses | 0.01 | % | 0.01 | % | 0.01 | % | |||||
| Total annual fund operating expenses | 0.82 | % | 0.53 | % | 0.41 | % | |||||
| 1 Year | 3 Years | 5 Years | 10 Years | ||||||||||||||
| Investor | $84 | $262 | $455 | $1,014 | |||||||||||||
| Class I | 54 | 170 | 296 | 665 | |||||||||||||
| Class Y | 42 | 132 | 230 | 518 | |||||||||||||
Under normal market conditions, the fund invests at least 80% of its net assets at the time of purchase in securitized bond investments. Securitized bond investments are also referred to as “structured product securities” or “structured products.” Securitized bond investments include interests in pools of secured loans backed by commercial real estate, residential real estate, commercial or consumer loans, and securitizations such as agency and non-agency mortgage-backed securities ("MBS") (including commercial mortgage-backed securities ("CMBS"), residential mortgage-backed securities ("RMBS"), and collateralized mortgage obligations ("CMOs")), asset-backed securities ("ABS"), and other similar securities and related instruments.
Agency MBS are issued or guaranteed by the US government, its agencies or instrumentalities, which include mortgage pass-through securities representing interests in pools of mortgage loans issued or guaranteed by the Government National Mortgage Association ("GNMA" or “Ginnie Mae”), the Federal National Mortgage Association ("FNMA" or “Fannie Mae”), the Student Loan Marketing Association ("SLMA" or “Sallie Mae”) or the Federal Home Loan Mortgage Corporation ("FHLMC" or “Freddie Mac”). The fund may also invest in other fixed income instruments, which include bonds, debt or credit securities and other similar instruments issued by various US and non-US public or private sector entities at the discretion of the Diamond Hill Capital Management, Inc. (the “Adviser”).
Under normal circumstances, the fund will maintain an average portfolio duration of less than three, although under certain market conditions, such as periods of significant volatility in interest rates and spreads, the fund’s average duration may be longer than three. Duration is an approximate measure of a bond's price sensitivity to changes in interest rates. For instance, a duration of “three” means that a security’s or portfolio’s price would be expected to decrease by approximately 3% with a 1% increase in interest rates (assuming a parallel shift in yield curve). The fund may invest in individual fixed income securities with effective durations in excess of three, provided, however, such investments are made within the constraints above.
The fund may invest up to 15% of its assets in below investment grade securities, including those referred to as “junk bonds” (or the unrated equivalent) at the time of purchase.
When selecting securities for the fund, the Adviser performs a risk/reward analysis that includes an evaluation of credit risk, interest rate risk, prepayment risk, and the legal and technical structure of the security. The Adviser will attempt to take advantage of inefficiencies that it believes exist in the fixed income markets, such as the diversity of participants working with different objectives and repeated temporary supply-demand imbalances. The Adviser seeks to invest in securities that the Adviser expects to offer attractive prospects for income and/or capital appreciation in relation to the risk borne.
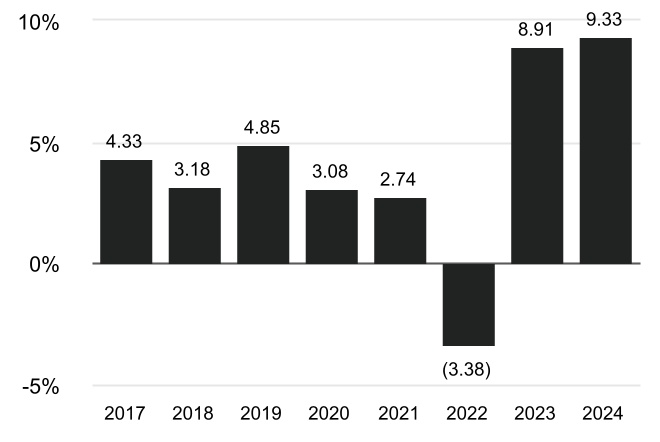
| Best Quarter: | 2Q 2020, +5.26% | ||||
| Worst Quarter: | 1Q 2020, -7.64% | ||||
| Inception Date of Class | One Year | Five Years | Since Inception | |||||||||||
Class I Before Taxes | 07/05/16 | 9.33 | % | 4.03 | % | 3.98 | % | |||||||
After Taxes on Distributions | 6.57 | 2.23 | 2.30 | |||||||||||
After Taxes on Distributions and Sale of Fund Shares | 5.46 | 2.29 | 2.31 | |||||||||||
Investor Before Taxes | 07/05/16 | 9.14 | 3.75 | 3.68 | ||||||||||
Class Y Before Taxes | 07/05/16 | 9.56 | 4.18 | 4.11 | ||||||||||
| Bloomberg US Aggregate Bond Index | 1.25 | (0.33) | 0.82 | |||||||||||
| Bloomberg US 1-3 Year Government/Credit Index | 4.36 | 1.58 | 1.63 | |||||||||||
The fund's broad-based securities market index is the Bloomberg US Aggregate Bond Index. The Bloomberg US Aggregate Bond Index measures the performance of investment grade, fixed-rate taxable bond market and includes government and corporate bonds, agency mortgage-backed, asset-backed and commercial mortgage-backed securities (agency and non-agency).
The Bloomberg US 1-3 Year Government/Credit Index represents the index utilized by the Adviser for measuring performance. The Bloomberg US 1-3 Year Government/Credit Index measures the performance of investment grade government and corporate bonds with maturities of one to three years.
The indexes are unmanaged, include net reinvested dividends, do not reflect fees or expenses (which would lower the return), and are not available for direct investment.
The investment objective of the Diamond Hill Core Bond Fund is to maximize total return consistent with the preservation of capital.
SHAREHOLDER FEES (fees paid directly from your investment) | ||
| None | ||
ANNUAL FUND OPERATING EXPENSES (expenses that you pay each year as a percentage of the value of your investment) | |||||||||||
| Investor | Class I | Class Y | |||||||||
| Management fees | 0.30 | % | 0.30 | % | 0.30 | % | |||||
| Distribution (12b-1) fees | 0.25 | % | None | None | |||||||
| Other expenses | 0.21 | % | 0.17 | % | 0.05 | % | |||||
| Total annual fund operating expenses | 0.76 | % | 0.47 | % | 0.35 | % | |||||
| 1 Year | 3 Years | 5 Years | 10 Years | ||||||||||||||
| Investor | $78 | $243 | $422 | $942 | |||||||||||||
| Class I | 48 | 151 | 263 | 591 | |||||||||||||
| Class Y | 36 | 113 | 197 | 443 | |||||||||||||
Under normal market conditions, the fund intends to provide total return by investing at least 80% of its net assets at the time of purchase (plus any amounts borrowed for investment purposes) in a diversified portfolio of investment grade, fixed income securities, including bonds, debt securities and other similar U.S. dollar-denominated instruments issued by various U.S. public- or private-sector entities, by non-U.S. corporations or U.S. affiliates of non-U.S. corporations, including those in emerging markets. The fund may invest a significant portion or all of its assets in interests in pools of mortgage-related and mortgage-backed securities at the discretion of Diamond Hill Capital Management, Inc. (the “Adviser”).
Under normal circumstances, the fund will maintain an average portfolio duration of plus or minus 20% of the duration of the Bloomberg US Aggregate Bond Index. The Bloomberg US Aggregate Bond Index is a broad-based index that represents the investment grade, US dollar-denominated fixed-rate taxable bond market. Duration of the Bloomberg US Aggregate Bond Index was 6.08 as of its last reconstitution date of January 31, 2025. Duration is an approximate measure of a bond’s price sensitivity to changes in interest rates. For instance, a duration of “three” means that a security’s or portfolio’s price would be expected to decrease by approximately 3% with a 1% increase in interest rates (assuming a parallel shift in yield curve).
When selecting securities for the fund, the Adviser performs a bottom-up, research-based approach in seeking to identify opportunities. In buying and selling securities for the fund, the Adviser performs a risk/reward analysis that includes an evaluation of credit risk, interest rate risk, prepayment risk, and the legal and technical structure of the security. The Adviser will attempt to take advantage of inefficiencies that it believes exist in the fixed-income markets, such as the diversity of participants working with different objectives and repeated temporary supply-demand imbalances. The Adviser seeks to invest in securities that the Adviser expects to offer attractive prospects for current income and/or capital appreciation in relation to the risk borne.
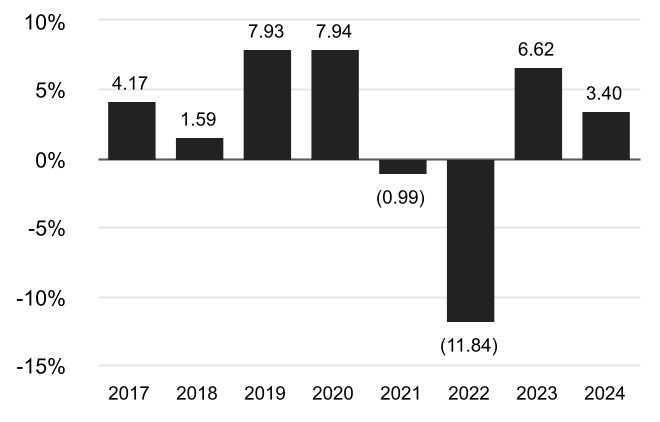
| Best Quarter: | 4Q 2023, +6.41% | ||||
| Worst Quarter: | 1Q 2022, -4.99% | ||||
| Inception Date of Class | One Year | Five Years | Since Inception | |||||||||||
Class I Before Taxes | 07/05/16 | 3.40 | % | 0.76 | % | 1.77 | % | |||||||
After Taxes on Distributions | 1.31 | (0.64) | 0.48 | |||||||||||
After Taxes on Distributions and Sale of Fund Shares | 1.99 | (0.01) | 0.80 | |||||||||||
Investor Before Taxes | 07/05/16 | 3.17 | 0.48 | 1.48 | ||||||||||
Class Y Before Taxes | 07/05/16 | 3.53 | 0.86 | 1.88 | ||||||||||
| Bloomberg US Aggregate Bond Index | 1.25 | (0.33) | 0.82 | |||||||||||
The fund's broad-based securities market index is the Bloomberg US Aggregate Bond Index.The Bloomberg US Aggregate Bond Index measures the performance of investment grade, fixed-rate taxable bond market and includes government and corporate bonds, agency mortgage-backed, asset-backed and commercial mortgage-backed securities (agency and non-agency). The Bloomberg US Aggregate Bond Index also represents the index utilized by the Adviser for measuring performance.
The index is unmanaged, includes net reinvested dividends, does not reflect fees or expenses (which would lower the return), and is not available for direct investment.
The investment objective of the Diamond Hill Core Plus Bond Fund is to maximize total return consistent with the preservation of capital.
SHAREHOLDER FEES (fees paid directly from your investment) | ||
| None | ||
ANNUAL FUND OPERATING EXPENSES (expenses that you pay each year as a percentage of the value of your investment) | |||||||||||
| Investor | Class I | Class Y | |||||||||
| Management fees | 0.40 | % | 0.40 | % | 0.40 | % | |||||
| Distribution (12b-1) fees | 0.25 | % | None | None | |||||||
| Other expenses | 0.21 | % | 0.17 | % | 0.05 | % | |||||
| Total annual fund operating expenses | 0.86 | % | 0.57 | % | 0.45 | % | |||||
| 1 Year | 3 Years | ||||||||||
| Investor | $88 | $274 | |||||||||
| Class I | 58 | 183 | |||||||||
| Class Y | 46 | 144 | |||||||||
Under normal market conditions, the fund intends to provide total return by investing at least 80% of its net assets at the time of purchase (plus any amounts borrowed for investment purposes) in a diversified portfolio of fixed income securities, including bonds, debt securities, bank loans and other similar U.S. dollar-denominated instruments issued by various U.S. public- or private-sector entities, or by non-U.S. corporations or U.S. affiliates of non-U.S. corporations, including those in emerging markets. The fund may invest a significant portion or all of its assets in securitized bond investments also referred to as "structured product securities" or "structured products." Securitized bond investments include interests in pools of secured loans backed by commercial real estate, residential real estate, commercial or consumer loans, and securitizations such as collateralized debt obligations, collateralized loan obligations ("CLOs"), agency and non-agency mortgage-backed securities ("MBS") (including commercial mortgage-backed securities ("CMBS"), residential mortgage-backed securities ("RMBS"), and collateralized mortgage obligations ("CMOs")), asset-backed securities ("ABS"), and other similar securities and related instruments at the discretion of Diamond Hill Capital Management, Inc. (the “Adviser”). The fund may invest up to 35% of its net assets in below-investment grade securities, including those referred to as "junk bonds" (or the unrated equivalent) at the time of purchase.
Under normal circumstances, the fund will maintain an average portfolio duration of plus or minus 20% of the duration of the Bloomberg US Aggregate Bond Index. The Bloomberg US Aggregate Bond Index is a broad-based index that represents the investment grade, US dollar-denominated fixed-rate taxable bond market. Duration of the Bloomberg US Aggregate Bond Index was 6.08 years as of its last reconstitution date of January 31, 2025. Duration is an approximate measure of a bond’s price sensitivity to changes in interest rates. For instance, a duration of “three” means that a security’s or portfolio’s price would be expected to decrease by approximately 3% with a 1% increase in interest rates (assuming a parallel shift in the yield curve).
When selecting securities for investment, the Adviser employs a bottom-up, research-based approach in seeking to identify opportunities. In buying and selling securities for the fund, the Adviser performs a risk/reward analysis that includes an evaluation of credit risk, interest rate risk, prepayment risk, and the legal and technical structure of the security. The Adviser will attempt to take advantage of inefficiencies that it believes exist in the fixed-income markets, such as the diversity of participants working with different objectives and repeated temporary supply-demand imbalances. The Adviser seeks to invest in securities that the Adviser expects to offer attractive prospects for current income and/or capital appreciation in relation to the risk borne
No performance information is presented for the fund at this time, as the fund has been in operation for less than a full calendar year. In the future, performance information will be presented in this section of the prospectus. This information will give some indication of the risks of investing in the fund by comparing the fund's investment returns with a broad measure of market performance. Updated performance information is available by visiting www.diamond-hill.com or by calling 1-888-226-5595.
The fund's broad-based securities market index is the Bloomberg US Aggregate Bond Index. The Bloomberg US Aggregate Bond Index measures the performance of investment grade, fixed-rate taxable bond market and includes government and corporate bonds, agency mortgage-backed, asset-backed and commercial mortgage-backed securities (agency and non-agency). The Bloomberg US Aggregate Bond Index also represents the index utilized by the Adviser for measuring performance.
The index is unmanaged, includes net reinvested dividends, does not reflect fees or expenses (which would lower the return), and is not available for direct investment.