|
Deutsche Bank |
||
|
Pillar 3 Report as of December 31, 2024 |
||
Exhibit 99.2

|
Deutsche Bank |
||
|
Pillar 3 Report as of December 31, 2024 |
||
Exhibit 99.2
|
Deutsche Bank |
||
|
Pillar 3 Report as of December 31, 2024 |
||
Contents
|
Deutsche Bank |
||
|
Pillar 3 Report as of December 31, 2024 |
||
|
Deutsche Bank |
||
|
Pillar 3 Report as of December 31, 2024 |
||
|
Deutsche Bank |
||
|
Pillar 3 Report as of December 31, 2024 |
||
|
Deutsche Bank |
||
|
Pillar 3 Report as of December 31, 2024 |
||
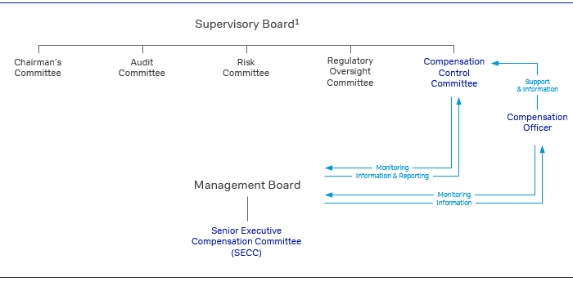
Regulatory framework
Basis of Presentation
Article 431 (1), (2) CRR, 433 CRR and 433a CRR
This Pillar 3 Report provides disclosures for the consolidated Deutsche Bank Group (the Group or the bank) as required by the global regulatory framework for capital and liquidity, which was established by the Basel Committee on Banking Supervision, also known as Basel 3.
In the European Union (EU), the Basel 3 framework is implemented by the amended versions of Regulation (EU) 575/2013 on prudential requirements for credit institutions (Capital Requirements Regulation or CRR) and the Directive (EU) 2013/36 on access to the activity of credit institutions and the prudential supervision of credit institutions and investment firms (Capital Requirements Directive or CRD). As a single rulebook, the CRR is directly applicable to credit institutions in the European Union and provides the grounds for the determination of regulatory capital requirements, regulatory own funds, leverage and liquidity as well as other relevant requirements. In addition, the CRD was implemented into German law by means of further amendments to the German Banking Act (Kreditwesengesetz or KWG) and the German Solvency Regulation (SolvV) and accompanying regulations. Jointly, these laws and regulations represent the regulatory framework applicable in Germany.
The disclosure requirements are provided in Part Eight of the CRR and in Section 26a of the KWG. Further disclosure guidance has been provided by the European Banking Authority (EBA) in its “Final draft implementing technical standards on public disclosures by institutions of the information referred to in Titles II and III of Part Eight of Regulation (EU) No 575/2013” (EBA ITS). The Group adheres to the frequency of disclosure requirements as per Article 433 and 433a of the CRR and as provided within these EBA Guidelines and includes comparative periods in accordance with the requirements of EBA ITS. For those disclosures required only on an annual basis, the comparative period is the prior year. For those disclosures only required on a semi-annual basis, the comparative period is the prior half-year. Disclosures required on a quarterly basis generally include comparative information for prior quarter.
The information provided in this Pillar 3 Report is unaudited. Numbers presented throughout this document may not add up precisely to the totals and percentages may not precisely reflect the absolute figures due to rounding.
In 2024, Deutsche Bank implemented a new client reference data system as well as completed the Postbank integration into the Deutsche Bank platform. Both measures led to process alignments and refinements consequently changing the presentation of certain client exposures by geography and industry (NACE). The process alignments and refinements had no impact on the overall Group’s total client exposures as of yearend 2024.
Disclosure governance
Article 431 (3), 432 and 434CRR
The Group’s Pillar 3 Report is in compliance with the legal and regulatory requirements described above and is prepared in accordance with the Group’s internal policies, processes, systems and internal controls as defined by the Group’s risk disclosure key operating document (KOD). In line with the Group’s KOD, a dedicated process is followed if the Group omits certain disclosures due to the disclosures being immaterial, proprietary or confidential. If the Group classifies information as immaterial in the Pillar 3 Report, this is stated accordingly in the related disclosures. The Group’s Management Board approved this Pillar 3 Report for publication and affirmed that Deutsche Bank has complied with the requirements under Article 431 (3) CRR.
Based upon the Group’s assessment and verification it also believes the risk and regulatory disclosures presented throughout this Pillar 3 Report appropriately and comprehensively convey the Group’s overall risk profile as of December 31, 2024.
This Pillar 3 Report is published on the bank’s website at https://www.db.com/ir/en/regulatory-reporting.htm .
In addition, the bank‘s website includes a description of the main features of the Group’s capital instruments as well as its senior non-preferred subordinated eligible liabilities instruments eligible for subordinated minimum requirement for own funds and eligible liabilities (MREL) and total loss absorbing capacity (TLAC), to the extent that these do not constitute private placements and are treated confidentially (https://investor-relations.db.com/creditors/prospectuses/capital-instruments).
Article 435 (1)(e) CRR (EU OVA)
Deutsche Bank’s Management Board confirms, for the purpose of Article 435 CRR, that the bank’s risk management arrangements are adequate for its risk profile and strategy, and that the bank maintains appropriate resources to implement selected enhancements.
6
|
Deutsche Bank |
||
|
Pillar 3 Report as of December 31, 2024 |
||
Basel 3 and CRR/CRD
The CRR/CRD lays the foundation for the calculation of the minimum regulatory requirements with respect to own funds and eligible liabilities, the liquidity coverage ratio and the net stable funding ratio.
There is still uncertainty as to how some of the CRR/CRD rules should be interpreted and there are still related binding Technical Standards for which a final version is not yet available. Thus, the Group will continue to refine assumptions and models in line with evolution of these regulations as well as the industry’s understanding and interpretation of the rules. Against this background, current CRR/CRD measures may not be comparable to previous expectations. Also, CRR/CRD measures may not be comparable with similarly labeled measures used by competitors, as their assumptions and estimates may differ from Deutsche Bank’s.
MREL and TLAC
Banks in the European Union are required to meet at all times a minimum requirement for own funds and eligible liabilities (MREL) which ensures that banks have sufficient loss absorbing capacity in resolution to avoid recourse to taxpayers’ money. Relevant laws are the Single Resolution Mechanism Regulation (SRMR) and the Bank Recovery and Resolution Directive (BRRD) as implemented through the German Recovery and Resolution Act (Sanierungs- und Abwicklungsgesetz, SAG).
In addition, the CRR requires G-SIIs in Europe to have at least the maximum of 18% plus the combined buffer requirement of risk weighted assets (RWA) and 6.75% of leverage exposure as total loss absorbing capacity (TLAC).
Instruments which qualify for MREL and TLAC as own funds are Common Equity Tier 1, Additional Tier 1, and Tier 2 along with certain eligible liabilities (mainly plain-vanilla unsecured bonds). Instruments qualifying for TLAC need to be fully subordinated to general creditor claims (e.g., senior non-preferred bonds). While this is not required for MREL, MREL regulations allow the Single Resolution Board (SRB) to also set an additional subordination requirement within the MREL requirements (but separate from TLAC), which allows only subordinated liabilities and own funds to be counted.
MREL is determined by the competent resolution authorities for each supervised bank and its preferred resolution strategy. In the case of Deutsche Bank AG, MREL is determined by the SRB. While there is no statutory minimum level of MREL, the CRR, SRMR, BRRD and delegated regulations set out criteria which the resolution authority must consider when determining the relevant required level of MREL. Guidance is provided through a MREL policy published annually by the SRB. Any binding MREL ratio determined by the SRB is communicated to Deutsche Bank via the German Federal Financial Supervisory Authority (BaFin). Deutsche Bank AG received its current total MREL and current subordinated MREL requirement with immediate applicability in the second quarter of 2024.
ICAAP, ILAAP and SREP
The internal capital adequacy assessment process (ICAAP) as stipulated in Pillar 2 of Basel requires banks to identify and assess risks, to apply effective risk management techniques and to maintain adequate capitalization. The Group’s internal liquidity adequacy assessment process (ILAAP) aims to ensure that sufficient levels of liquidity are maintained on an ongoing basis by identifying the key liquidity and funding risks to which the Group is exposed, by monitoring and measuring these risks, and by maintaining tools and resources to manage and mitigate these risks.
In accordance with Article 97 CRD supervisors regularly review, as part of the supervisory review and evaluation process (SREP), the arrangements, strategies, processes, and mechanisms implemented by banks and evaluate: (a) risks to which the institution is or might be exposed; (b) risks the institution poses to the financial system; and (c) risks revealed by stress testing.
Key metrics
Article 447 (a-g) and Article 438 (b) CRR
The following table highlights Deutsche Bank’s key regulatory metrics and ratios, and related input components as defined by CRR and CRD. In line with disclosure requirements the Liquidity Coverage Ratio is based on 12 months rolling averages and the other metrics are based on spot information.
7
|
Deutsche Bank |
||
|
Pillar 3 Report as of December 31, 2024 |
||
EU KM1 – Key metrics
|
|
a |
b |
c |
d |
e |
||||||||
|
in € m. (unless stated otherwise) |
Dec 31, 2024 |
Sep 30, 2024 |
Jun 30, 2024 |
Mar 31, 2024 |
Dec 31, 2023 |
||||||||
|
Available own funds (amounts) |
|||||||||||||
|
1 |
Common Equity Tier 1 (CET 1) capital |
49,457 |
49,183 |
48,113 |
47,672 |
48,066 |
|||||||
|
2 |
Tier 1 capital |
60,835 |
59,061 |
57,992 |
56,050 |
56,395 |
|||||||
|
3 |
Total capital¹ |
68,511 |
66,721 |
66,441 |
64,645 |
65,005 |
|||||||
|
Risk-weighted exposure amounts |
|||||||||||||
|
4 |
Total risk-weighted exposure amount |
357,427 |
356,496 |
356,427 |
354,830 |
349,742 |
|||||||
|
Capital ratios (as percentage of risk-weighted exposure amount) |
|||||||||||||
|
5 |
Common Equity Tier 1 ratio (%) |
13.8 |
13.8 |
13.5 |
13.4 |
13.7 |
|||||||
|
6 |
Tier 1 ratio (%) |
17.0 |
16.6 |
16.3 |
15.8 |
16.1 |
|||||||
|
7 |
Total capital ratio (%)¹ |
19.2 |
18.7 |
18.6 |
18.2 |
18.6 |
|||||||
|
Additional own funds requirements based on SREP (as a percentage of risk-weighted exposure amount) |
|||||||||||||
|
EU 7a |
Additional own funds requirements to address risks other than the risk of excessive leverage (%) |
2.65 |
2.65 |
2.65 |
2.65 |
2.70 |
|||||||
|
of which: |
|||||||||||||
|
EU 7b |
to be made up of CET 1 capital (percentage points) |
1.5 |
1.5 |
1.5 |
1.5 |
1.5 |
|||||||
|
EU 7c |
to be made up of Tier 1 capital (percentage points) |
2.0 |
2.0 |
2.0 |
2.0 |
2.0 |
|||||||
|
EU 7d |
Total SREP own funds requirements (%) |
10.7 |
10.7 |
10.7 |
10.7 |
10.7 |
|||||||
|
Combined buffer requirement (as a percentage of risk-weighted exposure amount) |
|||||||||||||
|
8 |
Capital conservation buffer (%) |
2.5 |
2.5 |
2.5 |
2.5 |
2.5 |
|||||||
|
EU 8a |
Conservation buffer due to macro-prudential or systemic risk identified at the level of a Member State (%) |
0.0 |
0.0 |
0.0 |
0.0 |
0.0 |
|||||||
|
9 |
Institution specific countercyclical capital buffer (%) |
0.49 |
0.49 |
0.50 |
0.45 |
0.45 |
|||||||
|
EU 9a |
Systemic risk buffer (%) |
0.2 |
0.2 |
0.2 |
0.2 |
0.2 |
|||||||
|
10 |
Global Systemically Important Institution buffer (%) |
1.5 |
1.5 |
1.5 |
1.5 |
1.5 |
|||||||
|
EU 10a |
Other Systemically Important Institution buffer (%) |
2.0 |
2.0 |
2.0 |
2.0 |
2.0 |
|||||||
|
11 |
Combined buffer requirement (%) |
5.2 |
5.2 |
5.2 |
5.2 |
5.1 |
|||||||
|
EU 11a |
Overall capital requirements (%) |
15.9 |
15.8 |
15.8 |
15.8 |
15.8 |
|||||||
|
12 |
CET 1 available after meeting the total SREP own funds requirements (%) |
7.8 |
7.8 |
7.5 |
7.4 |
7.7 |
|||||||
|
CET 1 available after meeting the total SREP own funds requirements |
28,045 |
27,826 |
26,761 |
26,415 |
27,016 |
||||||||
|
Leverage ratio |
|||||||||||||
|
13 |
Leverage ratio total exposure measure |
1,315,906 |
1,283,672 |
1,261,804 |
1,253,772 |
1,240,318 |
|||||||
|
14 |
Leverage ratio (%) |
4.6 |
4.6 |
4.6 |
4.5 |
4.5 |
|||||||
|
Additional own funds requirements to address risks of excessive leverage (as a percentage of leverage ratio total exposure amount) |
|||||||||||||
|
EU 14a |
Additional own funds requirements to address the risk of excessive leverage (%) |
0.1 |
0.1 |
0.1 |
0.1 |
0.0 |
|||||||
|
EU 14b |
of which: to be made up of CET 1 capital (percentage points) |
0.0 |
0.0 |
0.0 |
0.0 |
0.0 |
|||||||
|
EU 14c |
Total SREP leverage ratio requirements (%) |
3.1 |
3.1 |
3.1 |
3.1 |
3.0 |
|||||||
|
Leverage ratio buffer and overall leverage ratio requirement (as a percentage of total exposure measure) |
|||||||||||||
|
EU 14d |
Leverage ratio buffer requirement (%) |
0.75 |
0.75 |
0.75 |
0.75 |
0.75 |
|||||||
|
EU 14e |
Overall leverage ratio requirements (%) |
3.85 |
3.85 |
3.85 |
3.85 |
3.75 |
|||||||
|
Liquidity Coverage Ratio |
|||||||||||||
|
15 |
Total high-quality liquid assets (HQLA) (Weighted value - average) |
224,205 |
220,529 |
218,330 |
215,681 |
214,710 |
|||||||
|
EU 16a |
Cash outflows - Total weighted value |
223,914 |
219,478 |
217,413 |
214,663 |
211,856 |
|||||||
|
EU 16b |
Cash inflows - Total weighted value |
57,118 |
56,182 |
56,500 |
56,526 |
54,801 |
|||||||
|
16 |
Total net cash outflows (adjusted value) |
166,796 |
163,296 |
160,913 |
158,138 |
157,055 |
|||||||
|
17 |
Liquidity coverage ratio (%) |
134 |
135 |
136 |
136 |
137 |
|||||||
|
Net Stable Funding Ratio |
|||||||||||||
|
18 |
Total available stable funding |
625,189 |
613,321 |
611,827 |
606,377 |
605,189 |
|||||||
|
19 |
Total required stable funding |
514,802 |
501,874 |
501,813 |
494,797 |
498,548 |
|||||||
|
20 |
NSFR ratio (%) |
121 |
122 |
122 |
123 |
121 |
|||||||
1 The EBA Report on the monitoring of Additional Tier 1, Tier 2 and TLAC/MREL Eligible Liabilities instruments (EBA/REP/2024/11) published on June 27, 2024, has no impact on T1 capital as the AT1 instruments are classified as equity in IFRS; as of June 30, 2024, both Tier 2 capital and total capital would have reduced by € 0.8 billion, resulting in a reduction of 21bps on the total capital ratio; starting with the third quarter 2024 Deutsche Bank implemented the requirements for Tier 2 capital calculation
8
|
Deutsche Bank |
||
|
Pillar 3 Report as of December 31, 2024 |
||
Key metrics of own funds and eligible liabilities
Article 447 (h) CRR and Article 45i(3)(a,c) BRRD
EU KM2 – Key metrics - MREL and G-SII Requirement for own funds and eligible liabilities (TLAC)
|
|
Minimum requirement for own funds and eligible liabilities (MREL) |
G-SII Requirement for own funds and eligible liabilities (TLAC) |
|||||||||||||||
|
a |
b |
c |
d |
e |
f |
||||||||||||
|
in € m. (unless stated otherwise) |
Dec 31, 2024 |
Sep 30, 2024 |
Dec 31, 2024 |
Sep 30, 2024 |
Jun 30, 2024 |
Mar 31, 2024 |
Dec 31, 2023 |
||||||||||
|
Own funds and eligible liabilities, ratios and components |
|||||||||||||||||
|
1 |
Own funds and eligible liabilities |
133,871 |
130,891 |
118,491 |
117,025 |
113,115 |
111,079 |
114,106 |
|||||||||
|
EU 1a |
Own funds and subordinated liabilities |
118,491 |
117,025 |
– |
– |
– |
– |
– |
|||||||||
|
2 |
Total risk exposure amount of the resolution group (TREA) |
357,427 |
356,496 |
357,427 |
356,496 |
356,427 |
354,830 |
349,742 |
|||||||||
|
3 |
Own funds and eligible liabilities as percentage of TREA |
37.45 |
36.72 |
33.15 |
32.83 |
31.74 |
31.30 |
32.63 |
|||||||||
|
of which: |
|||||||||||||||||
|
EU 3a |
Own funds and subordinated liabilities |
33.15 |
32.83 |
– |
– |
– |
– |
– |
|||||||||
|
4 |
Total exposure measure of the resolution group (TEM) |
1,315,906 |
1,283,672 |
1,315,906 |
1,283,672 |
1,261,804 |
1,253,772 |
1,240,318 |
|||||||||
|
5 |
Own funds and eligible liabilities as percentage of TEM |
10.17 |
10.20 |
9.00 |
9.12 |
8.96 |
8.86 |
9.20 |
|||||||||
|
of which: |
|||||||||||||||||
|
EU 5a |
Own funds and subordinated liabilities |
9.00 |
9.12 |
– |
– |
– |
– |
– |
|||||||||
|
6a |
Does the subordination exemption in Article 72b(4) of the CRR apply? (5% exemption) |
– |
– |
no |
no |
no |
no |
no |
|||||||||
|
6b |
Pro-memo item - Aggregate amount of permitted non-subordinated eligible liabilities instruments if the subordination discretion as per Article 72b(3) CRR is applied (max 3.5% exemption) |
– |
– |
0 |
0 |
0 |
0 |
0 |
|||||||||
|
6c |
Pro-memo item: If a capped subordination exemption applies under Article 72b (3) CRR, the amount of funding issued that ranks pari passu with excluded liabilities and that is recognized under row 1, divided by funding issued that ranks pari passu with excluded Liabilities and that would be recognized under row 1 if no cap was applied (%) |
– |
– |
0 |
0 |
0 |
0 |
0 |
|||||||||
|
Minimum requirement for own funds and eligible liabilities (MREL) |
|||||||||||||||||
|
EU 7 |
MREL requirement expressed as percentage of the TREA |
30.98 |
30.96 |
– |
– |
– |
– |
– |
|||||||||
|
of which: |
|||||||||||||||||
|
EU 8 |
to be met with own funds or subordinated liabilities |
24.60 |
24.58 |
– |
– |
– |
– |
– |
|||||||||
|
EU 9 |
MREL requirement expressed as percentage of TEM |
6.95 |
6.95 |
– |
– |
– |
– |
– |
|||||||||
|
of which: |
|||||||||||||||||
|
EU 10 |
to be met with own funds or subordinated liabilities |
6.95 |
6.95 |
– |
– |
– |
– |
– |
|||||||||
As of December 31, 2024 the MREL ratio was 37.45% of Total Risk Exposure Amount (TREA) compared to a requirement of 30.98% of TREA including a 5.21% combined buffer requirement, equaling a surplus of € 23.1 billion above the bank’s MREL requirement. The subordinated MREL ratio was 9.00% of Total Exposure Measure (TEM) compared to a requirement of 6.95% of TEM. The subordinated MREL surplus is € 27.0 billion.
As of December 31, 2024 the TLAC ratio was 33.15% of TREA compared to a requirement of 23.21% including a 5.21% combined buffer requirement, resulting in a surplus of € 35.5 billion. TLAC was 9.00% of TEM compared to a requirement of 6.75%, which corresponds to a surplus of € 29.7 billion.
9
|
Deutsche Bank |
||
|
Pillar 3 Report as of December 31, 2024 |
||
Capital
Development and composition of Own Funds
Article 437 (a, d-f) CRR
The own funds capital ratios provided for Deutsche Bank Group are defined by CRR regulations. Deutsche Bank’s CET 1 capital as of December 31, 2024, amounted to € 49.5 billion, € 1.4 billion higher compared to June 30, 2024. AT1 capital was € 1.5 billion higher as of December 31, 2024, amounted to € 11.4 billion, compared to € 9.9 billion as of June 30, 2024. Tier 1 capital as of December 31, 2024, amounted to € 60.8 billion compared to € 58.0 billion as of June 30, 2024. Tier 2 capital was € 0.8 billion lower as of December 31, 2024, amounted to € 7.7 billion compared to € 8.4 billion as of June 30, 2024. Total capital was € 2.1 billion higher as of December 31, 2024, amounted to € 68.5 billion compared to € 66.4 billion as of June 30, 2024.
CET 1 capital increased by € 1.4 billion for the second half of 2024. This was mainly due to net profit of € 1.9 billion for the second half of 2024 reduced by regulatory deductions for future shareholder distribution and AT1 coupon payments of € 1.8 billion which is in line with the ECB Decision (EU) (2015/656) on the recognition of interim or year-end profits in CET 1 capital in accordance with the Article 26(2) of Regulation (EU) No 575/2013 (ECB/2015/4). In addition, CET 1 capital increased due to the adoption of the temporary treatment of unrealized gains and losses measured at fair value through OCI in accordance with Article 468 CRR by € 1.0 billion, currency translation adjustments € 0.5 billion and lower deferred tax assets of € 0.4 billion. These positive effects were offset by increase in the expected loss shortfall deduction by € 0.4 billion which is mainly due to amended Internal Ratings-Based Approach models following model approval by ECB and deduction related to defined pension fund assets € 0.2 billion.
The Additional Tier 1 capital increase of € 1.5 billion was due to a new AT 1 issuance of € 1.5 billion in the second half of the year.
The Tier 2 capital decrease of € 0.7 billion was due to negative effect of € 0.6 billion amortization and € 0.4 billion in carrying amount change arising from accrued interest and fair value hedge. This was partially offset by € 0.2 billion positive foreign exchange effects.
EU CC1 – Composition of regulatory own funds
|
|
Dec 31, 2024 |
Jun 30, 2024 |
||||||
|
in € m. |
CRR/CRD |
CRR/CRD |
Refe- |
|||||
|
Common Equity Tier 1 (CET 1) capital: instruments and reserves |
||||||||
|
1 |
Capital instruments, related share premium accounts and other reserves |
44,130 |
43,972 |
A |
||||
|
of which: Instrument type 1 (ordinary shares)2 |
44,130 |
43,972 |
A |
|||||
|
of which: Instrument type 2 |
0 |
0 |
||||||
|
of which: Instrument type 3 |
0 |
0 |
||||||
|
2 |
Retained earnings |
19,978 |
19,821 |
B |
||||
|
3 |
Accumulated other comprehensive income (loss), net of tax |
(1,229) |
(1,664) |
C |
||||
|
3a |
Funds for general banking risk |
0 |
0 |
|||||
|
4 |
Amount of qualifying items referred to in Art. 484 (3) and the related share premium accounts subject to phase-out from CET 1 |
0 |
0 |
|||||
|
5 |
Minority interests (amount allowed in consolidated CET 1) |
1,020 |
993 |
|||||
|
5a |
Independently reviewed interim profits net of any foreseeable charge or dividend3 |
801 |
662 |
B |
||||
|
6 |
Common Equity Tier 1 (CET 1) capital before regulatory adjustments |
64,700 |
63,785 |
|||||
|
Common Equity Tier 1 (CET 1) capital: regulatory adjustments |
||||||||
|
7 |
Additional value adjustments (negative amount)4 |
(1,680) |
(1,653) |
|||||
|
8 |
Goodwill and other intangible assets (net of related tax liabilities) (negative amount) |
(5,277) |
(5,141) |
D |
||||
|
10 |
Deferred tax assets that rely on future profitability excluding those arising from temporary differences (net of related tax liabilities where the conditions in Art. 38 (3) are met) (negative amount) |
(3,463) |
(3,815) |
E |
||||
|
11 |
Fair value reserves related to gains or losses on cash flow hedges of financial instruments that are not valued at fair value |
(36) |
183 |
|||||
|
12 |
Negative amounts resulting from the calculation of expected loss amounts |
(3,037) |
(2,588) |
|||||
|
13 |
Any increase in equity that results from securitized assets (negative amount) |
(0) |
(0) |
|||||
|
14 |
Gains or losses on liabilities designated at fair value resulting from changes in own credit standing5 |
131 |
34 |
|||||
|
15 |
Defined benefit pension fund assets (net of related tax liabilities) (negative amount) |
(1,173) |
(956) |
F |
||||
|
16 |
Direct, indirect and synthetic holdings by an institution of own CET 1 instruments (negative amount)6 |
0 |
(0) |
|||||
|
17 |
Direct, indirect and synthetic holdings of the CET 1 instruments of financial sector entities where those entities have reciprocal cross holdings with the institution designed to inflate artificially the own funds of the institution (negative amount) |
0 |
0 |
|||||
|
18 |
Direct, indirect and synthetic holdings by the institution of the CET 1 instruments of financial sector entities where the institution does not have a significant investment in those entities (amount above 10 % threshold and net of eligible short positions) (negative amount)7 |
0 |
0 |
|||||
|
19 |
Direct, indirect and synthetic holdings by the institution of the CET 1 instruments of financial sector entities where the institution has a significant investment in those entities (amount above 10 % threshold and net of eligible short positions) (negative amount) |
0 |
0 |
|||||
10
|
Deutsche Bank |
||
|
Pillar 3 Report as of December 31, 2024 |
||
|
|
Dec 31, 2024 |
Jun 30, 2024 |
||||||
|
in € m. |
CRR/CRD |
CRR/CRD |
Refe- |
|||||
|
20a |
Exposure amount of the following items which qualify for a risk weight of 1,250 %, where the institution opts for the deduction alternative |
0 |
0 |
|||||
|
of which: |
||||||||
|
20b |
Qualifying holdings outside the financial sector (negative amount) |
0 |
0 |
|||||
|
20c |
Securitization positions (negative amount) |
0 |
0 |
|||||
|
20d |
Free deliveries (negative amount) |
0 |
0 |
|||||
|
21 |
Deferred tax assets arising from temporary differences (amount above 10 % threshold, net of related tax liabilities where the conditions in Article 38 (3) are met) (negative amount) |
0 |
0 |
E |
||||
|
22 |
Amount exceeding the 17.65 % threshold (negative amount) |
0 |
0 |
|||||
|
of which: |
||||||||
|
23 |
Direct, indirect and synthetic holdings by the institution of the CET 1 instruments of financial sector entities where the institution has a significant investment in those entities |
0 |
0 |
|||||
|
25 |
Deferred tax assets arising from temporary differences |
0 |
0 |
E |
||||
|
25a |
Losses for the current financial year (negative amount) |
0 |
0 |
|||||
|
25b |
Foreseeable tax charges relating to CET 1 items except where the institution suitably adjusts the amount of CET 1 items insofar as such tax charges reduce the amount up to which those items may be used to cover risks or losses (negative amount) |
0 |
0 |
|||||
|
27 |
Qualifying AT1 deductions that exceed the AT1 items of the institution (negative amount) |
0 |
0 |
|||||
|
Regulatory adjustments relating to unrealized gains and losses pursuant to Art. 468 CRR |
1,012 |
0 |
||||||
|
27a |
Other regulatory adjustments (including IFRS 9 transitional adjustments when relevant)8 |
(1,721) |
(1,736) |
|||||
|
28 |
Total regulatory adjustments to Common Equity Tier 1 (CET 1) capital |
(15,244) |
(15,672) |
|||||
|
29 |
Common Equity Tier 1 (CET 1) capital |
49,457 |
48,113 |
|||||
|
Additional Tier 1 (AT1) capital: instruments |
||||||||
|
30 |
Capital instruments and the related share premium accounts |
11,508 |
10,008 |
G |
||||
|
of which: |
||||||||
|
31 |
Classified as equity under applicable accounting standards12 |
11,578 |
10,078 |
G |
||||
|
32 |
Classified as liabilities under applicable accounting standards |
0 |
0 |
|||||
|
33 |
Amount of qualifying items referred to in Article 484 (4) and the related share premium accounts subject to phase out from AT1 as described in Article 486(3) of CRR |
0 |
0 |
H |
||||
|
of which: |
||||||||
|
EU 33a |
Amount of qualifying items referred to in Article 494a(1) subject to phase out from AT1 |
0 |
0 |
|||||
|
EU 33b |
Amount of qualifying items referred to in Article 494b(1) subject to phase out from AT1 |
0 |
0 |
|||||
|
34 |
Qualifying Tier 1 capital included in consolidated AT1 capital issued by subsidiaries and held by third parties |
0 |
0 |
|||||
|
35 |
of which: instruments issued by subsidiaries subject to phase out |
0 |
0 |
|||||
|
36 |
Additional Tier 1 (AT1) capital before regulatory adjustments |
11,508 |
10,008 |
|||||
|
Additional Tier 1 (AT1) capital: regulatory adjustments |
||||||||
|
37 |
Direct, indirect and synthetic holdings by an institution of own AT1 instruments (negative amount) |
(130) |
(130) |
G |
||||
|
38 |
Direct, indirect and synthetic holdings of the AT1 instruments of financial sector entities where those entities have reciprocal cross holdings with the institution designed to inflate artificially the own funds of the institution (negative amount) |
0 |
0 |
|||||
|
39 |
Direct, indirect and synthetic holdings of the AT1 instruments of financial sector entities where the institution does not have a significant investment in those entities (amount above the 10 % threshold and net of eligible short positions) (negative amount)7 |
0 |
0 |
|||||
|
40 |
Direct, indirect and synthetic holdings by the institution of the AT1 instruments of financial sector entities where the institution has a significant investment in those entities (amount above the 10 % threshold net of eligible short positions) (negative amount) |
0 |
0 |
|||||
|
42 |
Qualifying T2 deductions that exceed the T2 items of the institution (negative amount) |
0 |
0 |
|||||
|
42a |
of which: Other regulatory adjustments to AT1 capital |
0 |
0 |
|||||
|
43 |
Total regulatory adjustments to Additional Tier 1 (AT1) capital |
(130) |
(130) |
|||||
|
44 |
Additional Tier 1 (AT1) capital |
11,378 |
9,878 |
|||||
|
45 |
Tier 1 capital (T1 = CET 1 + AT1) |
60,835 |
57,992 |
|||||
|
Tier 2 (T2) capital: instruments and provisions |
||||||||
|
46 |
Capital instruments and the related share premium accounts9 |
7,827 |
8,593 |
I |
||||
|
47 |
Amount of qualifying items referred to in Article 484 (5) and the related share premium accounts subject to phase out from T2 as described in Article 486(4) of CRR |
19 |
26 |
I |
||||
|
of which: |
||||||||
|
EU 47a |
Amount of qualifying items referred to in Article 494a (2) subject to phase out from T2 |
0 |
0 |
|||||
|
EU 47b |
Amount of qualifying items referred to in Article 494b (2) subject to phase out from T2 |
19 |
26 |
|||||
|
48 |
Qualifying own funds instruments included in consolidated T2 capital issued by subsidiaries and held by third parties |
0 |
0 |
I |
||||
|
49 |
of which: instruments issued by subsidiaries subject to phase out |
0 |
0 |
|||||
|
50 |
Credit risk adjustments |
0 |
0 |
|||||
|
51 |
Tier 2 (T2) capital before regulatory adjustments |
7,846 |
8,619 |
|||||
|
Tier 2 (T2) capital: regulatory adjustments |
||||||||
11
|
Deutsche Bank |
||
|
Pillar 3 Report as of December 31, 2024 |
||
|
|
Dec 31, 2024 |
Jun 30, 2024 |
||||||
|
in € m. |
CRR/CRD |
CRR/CRD |
Refe- |
|||||
|
52 |
Direct, indirect and synthetic holdings by an institution of own T2 instruments and subordinated loans (negative amount) |
(170) |
(170) |
I |
||||
|
53 |
Direct, indirect and synthetic holdings of the T2 instruments and subordinated loans of financial sector entities where those entities have reciprocal cross holdings with the institution designed to inflate artificially the own funds of the institution (negative amount) |
0 |
0 |
|||||
|
54 |
Direct, indirect and synthetic holdings of the T2 instruments and subordinated loans of financial sector entities where the institution does not have a significant investment in those entities (amount above 10 % threshold and net of eligible short positions) (negative amount)7 |
0 |
0 |
|||||
|
55 |
Direct, indirect and synthetic holdings by the institution of the T2 instruments and subordinated loans of financial sector entities where the institution has a significant investment in those entities (net of eligible short positions) (negative amount) |
0 |
0 |
|||||
|
56a |
Qualifying eligible liabilities deductions that exceed the eligible liabilities items of the institution (negative amount) |
0 |
0 |
|||||
|
56b |
Other regulatory adjustments to T2 capital |
0 |
0 |
|||||
|
57 |
Total regulatory adjustments to Tier 2 (T2) capital |
(170) |
(170) |
|||||
|
58 |
Tier 2 (T2) capital |
7,676 |
8,449 |
|||||
|
59 |
Total capital (TC = T1 + T2) |
68,511 |
66,441 |
|||||
|
60 |
Total risk-weighted assets |
357,427 |
356,427 |
|||||
|
Capital ratios and buffers |
||||||||
|
61 |
Common Equity Tier 1 capital ratio (as a percentage of risk-weighted assets) |
13.8 |
13.5 |
|||||
|
62 |
Tier 1 capital ratio (as a percentage of risk-weighted assets) |
17.0 |
16.3 |
|||||
|
63 |
Total capital ratio (as a percentage of risk-weighted assets) |
19.2 |
18.6 |
|||||
|
64 |
Institution CET 1 overall capital requirement (CET 1 requirement in accordance with article 92 (1) of Regulation (EU) No 575/2013, plus additional CET 1 requirement which the institution is required to hold in accordance with Article 104(1)(a) of Directive 2013/36/EU, plus combined buffer requirement in accordance with Article 128(6) of Directive 2013/36/EU) expressed as a percentage of risk exposure amount)10 |
11.2 |
11.2 |
|||||
|
of which: |
||||||||
|
65 |
Capital conservation buffer requirement |
2.5 |
2.5 |
|||||
|
66 |
Countercyclical buffer requirement |
0.49 |
0.50 |
|||||
|
67 |
Systemic risk buffer requirement |
0.2 |
0.2 |
|||||
|
67a |
Global Systemically Important Institution (G-SII) or Other Systemically Important Institution (O-SII) buffer |
2.0 |
2.0 |
|||||
|
67b |
additional own funds requirements to address the risks other than the risk of excessive leverage |
1.5 |
1.5 |
|||||
|
68 |
Common Equity Tier 1 capital available to meet buffers (as a percentage of risk-weighted assets)11 |
7.8 |
7.5 |
|||||
|
Amounts below the thresholds for deduction (before risk weighting) |
||||||||
|
72 |
Direct, indirect and synthetic holdings of the capital of financial sector entities where the institution does not have a significant investment in those entities (amount below 10 % threshold and net of eligible short positions)7 |
3,661 |
3,933 |
|||||
|
73 |
Direct, indirect and synthetic holdings by the institution of the CET 1 instruments of financial sector entities where the institution has a significant investment in those entities (amount below 10 % threshold and net of eligible short positions) |
927 |
863 |
|||||
|
75 |
Deferred tax assets arising from temporary differences (amount below 10 % threshold, net of related tax liability where the conditions in Article 38 (3) CRR are met) |
4,370 |
4,493 |
|||||
|
Applicable caps on the inclusion of provisions in Tier 2 capital |
||||||||
|
76 |
Credit risk adjustments included in T2 in respect of exposures subject to standardized approach (prior to the application of the cap) |
0 |
0 |
|||||
|
77 |
Cap on inclusion of credit risk adjustments in T2 under standardized approach |
272 |
254 |
|||||
|
78 |
Credit risk adjustments included in T2 in respect of exposures subject to internal ratings-based approach (prior to the application of the cap) |
0 |
0 |
|||||
|
79 |
Cap for inclusion of credit risk adjustments in T2 under internal ratings-based approach |
1,280 |
1,281 |
|||||
|
Capital instruments subject to phase-out arrangements |
||||||||
|
80 |
Current cap on CET 1 instruments subject to phase out arrangements |
0 |
0 |
|||||
|
81 |
Amount excluded from CET 1 due to cap (excess over cap after redemptions and maturities) |
0 |
0 |
|||||
|
82 |
Current cap on AT1 instruments subject to phase out arrangements |
0 |
0 |
|||||
|
83 |
Amount excluded from AT1 due to cap (excess over cap after redemptions and maturities) |
0 |
0 |
|||||
|
84 |
Current cap on T2 instruments subject to phase out arrangements |
0 |
0 |
|||||
|
85 |
Amount excluded from T2 due to cap (excess over cap after redemptions and maturities) |
0 |
0 |
|||||
N/M – Not meaningful
1 References provide the mapping of regulatory balance sheet items used to calculate regulatory capital as reflected in the column “References" and as presented in tables “EU CC2 – Reconciliation of regulatory own funds to balance sheet in the audited financial statements”. Where applicable, more detailed information is provided in the respective reference footnote section
2 Based on EBA list of Article 26(3) of CRR, competent authorities shall evaluate whether issuances of Common Equity Tier 1 instruments meet the criteria set out in Article 28 or, where applicable, Article 29
3 Full year profit is recognized as per ECB Decision (EU) 2015/656 in accordance with the Article 26(2) of Regulation (EU) No 575/2013 (ECB/2015/4); current year profits of € 3.4 billion reduced by deductions for AT1 coupons of € 475 million and deductions for announced distribution to shareholders in relation to FY 2024 of € 2.1 billion, which includes an intended dividend of € 1.3 billion (68 Cents per share) and the ECB approved share buyback of € 750 million
4 The € 1.7 billion (June 2024: € 1.7 billion) additional value adjustments were derived from the EBA Regulatory Technical Standard on prudent valuation and are before consideration of a benefit from the related reduction of the shortfall of provisions to expected losses of € 0.5 billion (June 2024: € 0.2 billion)
5 Represents gains and losses on liabilities and derivative liabilities carried at fair value that are a result of changes in own credit of the Group according to Article 33 (1) (b) CRR
6 Excludes holdings that are already considered in the accounting base of Common Equity
7 Based on the Group’s current interpretation no deduction amount expected
8 Includes capital deductions of 1.4 billion (June 2024: € 1.4 billion) based on ECB guidance on irrevocable payment commitments related to the Single Resolution Fund and the Deposit Guarantee Scheme, € 0.3 billion (June 2024: € 0.3 billion) based on ECB’s supervisory recommendation for a prudential provisioning of non-performing exposures
9 Amortization is taken into account
12
|
Deutsche Bank |
||
|
Pillar 3 Report as of December 31, 2024 |
||
10 Includes CET1 Pillar 2 Requirement
11 Calculated as the CET1 Capital less the Group’s CET1 capital requirements in accordance with article 92(1)(a) of Regulation (EU) No 575/2013 and following Article 104(1)(a) of Directive 2013/36/EU, and less any Common Equity Tier 1 items used by the Group to meet its additional Tier 1 and Tier 2 capital requirements
12 The reported position exceeds the total due to the delta amount of € 70 million representing a permanent buyback limit, which is not recognized in the accounting standards
A Common shares, additional paid-in capital and common shares in treasury reflect regulatory eligible CET 1 capital instruments
B Retained earnings in the regulatory balance sheet include Profit (loss) attributable to DB shareholders and additional equity components of € 3.4 billion (June 2024: € 1.4 billion). In the Own funds template (incl. RWA and capital ratios), this item is excluded from retained earnings and shown separately after subtracting the 'AT1 coupon and shareholder distribution deduction' of € (2.6) billion (June 2024: € (767) million) as ‘independently reviewed interim profits net of any foreseeable charge or dividend’ in row id 5a
C Difference to regulatory balance sheet position driven by prudential filters for unrealized gains and losses
D Regulatory applicable amount is goodwill and other intangible assets of € 7,749 million (June 2024: € 7,548 million) plus goodwill from equity method investments of € 63 million (June 2024: € 77 million) as per regulatory balance sheet reduced by deferred tax liabilities on other intangibles of € 521 million (June 2024: € 537 million) and prudent software assets as per Art. 36 (1) (b) CRR of € 2,013 million (June 2024: € 1,947 million)
E Differences to balance sheet position mainly driven by adjustments as set out in Article 38 (2) to (5) CRR (e.g. regulatory offsetting requirements)
F Regulatory applicable amount is defined benefit pension fund assets of € 1,299 million (June 2024: € 1,101 million) reduced by deferred tax liabilities on defined benefit pension fund assets of € 127 million (June 2024: € 145 million)
G Additional equity components reflects regulatory eligible AT1 capital instruments
H Difference to regulatory balance sheet driven by regulatory adjustments as set out in Articles 51 to 61 CRR (e.g. current cap on AT1 instruments subject to phase-out arrangements)
I Difference to regulatory balance sheet driven by regulatory adjustments as set out in Articles 62 to 71 CRR (e.g. amortization, minority interest)
13
|
Deutsche Bank |
||
|
Pillar 3 Report as of December 31, 2024 |
||
Reconciliation of shareholders’ equity to Own Funds
|
in € m. |
Dec 31, 2024 |
Jun 30, 2024 |
||
|
Total shareholders’ equity per accounting balance sheet |
66,276 |
63,634 |
||
|
Deconsolidation/Consolidation of entities |
(24) |
(37) |
||
|
of which: |
||||
|
Additional paid-in capital |
0 |
0 |
||
|
Retained earnings |
(24) |
(37) |
||
|
Accumulated other comprehensive income (loss), net of tax |
0 |
0 |
||
|
Total shareholders' equity per regulatory balance sheet |
66,252 |
63,597 |
||
|
Minority Interests (amount allowed in consolidated CET 1) |
1,020 |
993 |
||
|
AT1 coupon and shareholder distribution deduction1 |
(2,565) |
(767) |
||
|
Capital instruments not eligible under CET 1 as per CRR 28(1) |
(7) |
(38) |
||
|
Common Equity Tier 1 (CET 1) capital before regulatory adjustments |
64,700 |
63,785 |
||
|
Prudential filters |
(1,585) |
(1,435) |
||
|
of which: |
||||
|
Additional value adjustments |
(1,680) |
(1,653) |
||
|
Any increase in equity that results from securitized assets |
0 |
(0) |
||
|
Fair value reserves related to gains or losses on cash flow hedges and gains or losses on liabilities designated at fair value resulting from changes in own credit standing |
95 |
217 |
||
|
Regulatory adjustments |
(13,659) |
(14,237) |
||
|
of which: |
||||
|
Goodwill and other intangible assets (net of related tax liabilities) (negative amount) |
(5,277) |
(5,141) |
||
|
Deferred tax assets that rely on future profitability |
(3,463) |
(3,815) |
||
|
Negative amounts resulting from the calculation of expected loss amounts |
(3,037) |
(2,588) |
||
|
Defined benefit pension fund assets (net of related tax liabilities) (negative amount) |
(1,173) |
(956) |
||
|
Direct, indirect and synthetic holdings by the institution of the CET 1 instruments of financial sector entities where the institution has a significant investment in those entities |
0 |
0 |
||
|
Regulatory adjustments relating to unrealized gains and losses pursuant to Art. 468 CRR |
1,012 |
0 |
||
|
Other2 |
(1,721) |
(1,737) |
||
|
Common Equity Tier 1 capital |
49,457 |
48,113 |
||
|
Additional Tier 1 capital |
11,378 |
9,878 |
||
|
Additional Tier 1 Notes (AT1 Notes) |
11,378 |
9,878 |
||
|
Per balance sheet |
11,550 |
10,052 |
||
|
Deconsolidation/Consolidation of entities |
0 |
0 |
||
|
Regulatory adjustments to balance sheet position |
(172) |
(174) |
||
|
Hybrid capital securities |
0 |
0 |
||
|
Per balance sheet |
0 |
0 |
||
|
Deconsolidation/Consolidation of entities |
0 |
0 |
||
|
Regulatory adjustments to balance sheet position |
0 |
0 |
||
|
Other regulatory adjustments |
0 |
0 |
||
|
Deductions from Additional Tier 1 capital |
0 |
0 |
||
|
Tier 1 capital |
60,835 |
57,992 |
||
|
Tier 2 capital |
7,676 |
8,449 |
||
|
Subordinated debt |
7,676 |
8,449 |
||
|
Per balance sheet |
11,711 |
11,311 |
||
|
Deconsolidation/Consolidation of entities |
0 |
0 |
||
|
Regulatory adjustments to balance sheet position |
(4,035) |
(2,862) |
||
|
of which: |
||||
|
Amortization according to Art. 64 CRR |
(3,451) |
(2,966) |
||
|
Other |
(583) |
104 |
||
|
Other regulatory adjustments |
0 |
0 |
||
|
Deductions from Tier 2 capital |
0 |
0 |
||
|
Total capital |
68,511 |
66,441 |
||
1 Full year profit is recognized as per ECB Decision (EU) 2015/656 in accordance with the Article 26(2) of Regulation (EU) No 575/2013 (ECB/2015/4); current year deductions include deductions for AT1 coupons of € 475 million and deductions for announced distribution to shareholders in relation to FY 2024 of € 2.1 billion, which includes an intended dividend of € 1.3 billion (68 Cents per share) and the ECB approved share buyback of € 750 million
2 Includes capital deductions of 1.4 billion (June 2024: € 1.4 billion) based on ECB guidance on irrevocable payment commitments related to the Single Resolution Fund and the Deposit Guarantee Scheme, € 0.3 billion (June 2024: € 0.3 billion) based on ECB’s supervisory recommendation for a prudential provisioning of non-performing exposures
14
|
Deutsche Bank |
||
|
Pillar 3 Report as of December 31, 2024 |
||
Development of Own Funds
|
in € m. |
six months ended |
six months ended |
||
|
Common Equity Tier 1 (CET 1) capital - opening amount |
48,113 |
48,066 |
||
|
Common shares, net effect |
4 |
(118) |
||
|
of which: |
||||
|
New shares issued (+) |
0 |
0 |
||
|
Shares retired (–) |
0 |
(117) |
||
|
Capital instruments not eligible under CET 1 as per CRR 28(1) |
4 |
(2) |
||
|
Additional paid-in capital |
201 |
(631) |
||
|
Retained earnings |
2,094 |
1,248 |
||
|
of which: |
||||
|
Actuarial gains (losses) rel. to defined benefit plans, net of tax and Currency Translation Adjustment (CTA) |
149 |
(1) |
||
|
Profit (loss) attributable to Deutsche Bank shareholders and additional equity components |
1,937 |
1,429 |
||
|
Common shares in treasury, net effect/(+) sales (–) purchase |
(46) |
(186) |
||
|
Movements in accumulated other comprehensive income |
434 |
96 |
||
|
of which: |
||||
|
Foreign currency translation, net of tax |
494 |
434 |
||
|
Unrealized gains and losses |
(213) |
(184) |
||
|
Other |
153 |
(154) |
||
|
AT1 coupon and shareholder distribution deduction1 |
(1,731) |
(767) |
||
|
of which: |
||||
|
Gross dividends (deduction) |
(1,361) |
(662) |
||
|
Shares issued in lieu of dividends (add back) |
0 |
0 |
||
|
Gross AT1 coupons (deduction) |
(370) |
(105) |
||
|
Additional value adjustments |
(27) |
74 |
||
|
Goodwill and other intangible assets (net of related tax liabilities) (negative amount) |
(136) |
(128) |
||
|
Deferred tax assets that rely on future profitability (excluding those arising from temporary differences) |
352 |
392 |
||
|
Negative amounts resulting from the calculation of expected loss amounts |
(449) |
(202) |
||
|
Removal of gains/losses resulting from changes in own credit standing in liabilities |
97 |
116 |
||
|
Defined benefit pension fund assets (net of related tax liabilities) (negative amount) |
(217) |
(36) |
||
|
Direct, indirect and synthetic holdings by the institution of the CET 1 instruments of financial sector entities |
0 |
0 |
||
|
Securitization positions not included in risk-weighted assets |
0 |
0 |
||
|
Deferred tax assets arising from temporary differences (amount above 10 % and 15 % threshold, |
0 |
0 |
||
|
Other, including regulatory adjustments |
768 |
190 |
||
|
Common Equity Tier 1 (CET 1) capital - closing amount |
49,457 |
48,113 |
||
|
Additional Tier 1 (AT1) capital - opening amount |
9,879 |
8,328 |
||
|
New Additional Tier 1 eligible capital issues |
1,478 |
1,467 |
||
|
Matured and called instruments |
0 |
0 |
||
|
Transitional arrangements |
0 |
0 |
||
|
of which: |
||||
|
Amount excluded from Additional Tier 1 capital due to cap |
0 |
0 |
||
|
Goodwill and other intangible assets (net of related tax liabilities) |
0 |
0 |
||
|
Negative amounts resulting from the calculation of expected loss amounts |
0 |
0 |
||
|
Direct, indirect and synthetic holdings by the institution of the CET 1 instruments of financial sector entities where the institution has a significant investment in those entities |
0 |
0 |
||
|
Other, including regulatory adjustments |
22 |
83 |
||
|
Additional Tier 1 (AT1) capital - closing amount |
11,378 |
9,878 |
||
|
Tier 1 capital (T1 = CET 1 + AT1) |
60,835 |
57,992 |
||
|
Tier 2 (T2) capital - opening amount |
8,449 |
8,610 |
||
|
New Tier 2 eligible capital issues |
0 |
0 |
||
|
Matured and called instruments |
(3) |
(0) |
||
|
Amortization adjustments |
(568) |
(411) |
||
|
Transitional arrangements |
0 |
0 |
||
|
of which: |
||||
|
Inclusion of amount excluded from Additional Tier 1 capital due to cap |
0 |
0 |
||
|
Amount to be deducted from or added to Additional Tier 2 capital with regard to |
0 |
0 |
||
|
Negative amounts resulting from the calculation of expected loss amounts |
0 |
0 |
||
|
Direct, indirect and synthetic holdings by the institution of the CET 1 instruments of financial sector entities where the institution has a significant investment in those entities |
0 |
0 |
||
|
Other, including regulatory adjustments |
(202) |
249 |
||
|
Tier 2 (T2) capital - closing amount |
7,676 |
8,449 |
||
|
Total regulatory capital (TC = T1 + T2) |
68,511 |
66,441 |
||
1 Full year profit is recognized as per ECB Decision (EU) 2015/656 in accordance with the Article 26(2) of Regulation (EU) No 575/2013 (ECB/2015/4)
15
|
Deutsche Bank |
||
|
Pillar 3 Report as of December 31, 2024 |
||
Scope of application of the regulatory framework
Name of institution
Article 436 (a) CRR
Deutsche Bank Aktiengesellschaft (“Deutsche Bank AG”), headquartered in Frankfurt am Main, Germany, is the parent institution of the Deutsche Bank Group (the “regulatory group”). Under Section 10a KWG in conjunction with Articles 11 and 18 CRR, a regulatory group of institutions consists of an institution as the parent company, and all other institutions, financial institutions (comprising inter alia financial holding companies, payment institutions, asset management companies) and ancillary services undertakings that are its subsidiaries within the meaning of Article 4 (1) (16) CRR, or are jointly managed together with other parties within the meaning of Article 18 (4) CRR. Subsidiaries are fully consolidated, while companies which are not subsidiaries but consolidated for regulatory purposes are subject to proportional consolidation.
Insurance companies and companies outside the banking and financial sector are not consolidated in the regulatory group. The bank does not qualify as a financial conglomerate and is not subject to the respective supplementary supervisions.
Differences in the scopes of consolidation
Article 436 (b) CRR
The principles of consolidation for Deutsche Bank’s regulatory group are not identical to those applied for the Group’s financial statements. Nonetheless, the majority of the bank’s subsidiaries in the regulatory group are also fully consolidated in accordance with IFRS in the Group’s consolidated financial statements.
The main differences between regulatory and accounting consolidation are:
– Subsidiaries outside the banking and financial sector are not consolidated within the regulatory group of institutions but are included in the consolidated financial statements according to IFRS
– Most of the Group’s special purpose entities (SPEs) consolidated under IFRS do not meet the regulatory subsidiary definition pursuant to Article 4 (1) (16) CRR and are not consolidated in the regulatory group. However, the risks resulting from the bank’s exposures to such entities are reflected in the regulatory capital requirements
– Only two entities included in the regulatory group are not consolidated as subsidiaries for accounting purposes and are treated differently.
For detailed information and the table LI3, please refer to the Pillar 3 Report section “Outline of differences in scopes of consolidation”.
Derogations from prudential requirements for the parent company and subsidiaries
Article 436 (h) CRR (EU LIB)
As of December 31, 2024, Deutsche Bank AG fully applied the exemptions pursuant to Section 2a (1) KWG in conjunction with Article 7 (3) CRR, Art. 6 (5) CRR and Section 2a (2) KWG in conjunction with Section 25a (1) sentence 3 KWG (so-called “parent waiver”) pursuant to which the bank may waive the application of provisions on own funds and eligible liabilities, capital requirements, large exposures, exposures to transferred credit risks, leverage, reporting requirements and disclosure by institutions as well as certain risk management requirements on a stand-alone basis.
Deutsche Bank AG’s subsidiaries norisbank GmbH, Deutsche Bank Europe GmbH and Deutsche Oppenheim Family Office AG, which all were consolidated within the Deutsche Bank regulatory group, fully applied the same exemptions outlined above (so-called “subsidiary waiver”) pursuant to which the above mentioned subsidiaries may waive certain regulatory requirements to the same extent as Deutsche Bank AG (see preceding paragraph) on a stand-alone basis. In addition, Deutsche Bank AG’s subsidiaries Deutsche Immobilien Leasing GmbH and Leasing Verwaltungsgesellschaft Waltersdorf mbH, also consolidated within the Deutsche Bank regulatory group, applied the “subsidiary waiver” rules to the extent applicable to the subsidiary.
These exemptions are available only for group companies in Germany and can only be applied if, amongst others, the risk strategies and risk management processes of Deutsche Bank AG or the Group also include the companies that apply the “waiver” rules and there is no material practical or legal impediment to the prompt transfer of own funds or repayment of liabilities from Deutsche Bank AG to the respective subsidiaries or from subsidiaries to Deutsche Bank AG Group.
16
|
Deutsche Bank |
||
|
Pillar 3 Report as of December 31, 2024 |
||
The application of the aforementioned exemptions and the fulfillment of the respective requirements were notified to the BaFin and Deutsche Bundesbank. Pursuant to Section 2a (5) KWG the exemptions based on these notifications are grandfathered, i.e. the “waivers” are deemed to be granted under the current CRR and KWG rules.
Additional disclosure requirements for large subsidiaries
Article 13 (1) CRR
The bank’s large subsidiaries are required to disclose information to the extent applicable in respect of own funds, capital requirements, capital buffers, credit risk adjustments, remuneration policy, leverage and use of credit risk mitigation techniques on an individual or sub-consolidated basis.
For some of the bank’s subsidiaries located in Germany it is not mandatory to calculate or report regulatory capital or leverage ratios on a stand-alone basis if they qualify for the exemptions codified in the waiver rule pursuant to Section 2a KWG in conjunction with Article 7 CRR. In these cases, the above-mentioned disclosure requirements are also not applicable for those subsidiaries.
Large subsidiaries are identified in accordance with Article 4 No. 146 and 147 CRR, and applied to all subsidiaries classified as “credit institution” or “investment firm” under the CRR and not qualifying for a waiver status pursuant to Section 2a KWG in conjunction with Article 7 CRR. A subsidiary is required to comply with the requirements in Article 13 (1) CRR (as described above) if at least one criterion mentioned in the list below has been met. The total value of assets referenced below is calculated on an IFRS basis as of December 31, 2024:
– The subsidiary is a global systemically important institution:
– It has been identified as an other systemically important institution (O-SII) in accordance with Article 131(1) and (3) of Directive 2013/36/EU;
– The subsidiary is, in the Member State in which it is established, one of the three largest institutions in terms of total value of assets;
– Total value of assets on an individual basis or sub-consolidated basis is equal to or greater than € 30 billion.
As a result of the selection process described above, the bank identified four subsidiaries as “large” for the Group and hence required to provide additional disclosure requirements:
– DB USA Corporation, United States of America
– BHW Bausparkasse AG, Germany
– Deutsche Bank Luxembourg S.A., Luxemburg
– Deutsche Bank Società per Azioni, Italy
The additional disclosures for the large subsidiaries can be found either within the Pillar 3 Reports of the respective subsidiary as published on its website or on the Group’s website.
Impediments to fund transfers
Article 436 (f) CRR (EU LIB)
The Group entities within the scope of prudential consolidation are subject to local regulatory and tax requirements as well as potentially exchange controls. Deutsche Bank is not aware of any material impediments existing for capital distribution within the Group.
Potential capital shortfalls in unconsolidated subsidiaries
Article 436 (g) CRR (EU LIB)
Deutsche Bank’s subsidiaries which were not included in its regulatory consolidation due to their immateriality did not have to comply with own regulatory minimum capital standards in 2024.
17
|
Deutsche Bank |
||
|
Pillar 3 Report as of December 31, 2024 |
||
Reconciliation of regulatory own funds to the IFRS balance sheet
Article 436 (c, d) CRR
The table EU LI1 below provides a comparison between the consolidated balance sheet for accounting and prudential purposes and also highlights how the amounts reported in the Group’s financial statements, once the regulatory scope of consolidation is applied, are impacted by the different risk frameworks. The regulatory balance sheet is split further into sections subject to credit risk, counterparty credit risk, securitization positions in the regulatory banking book, market risk, and items not subject to capital requirements or relevant for deduction from capital. The market risk framework in column (f) includes the bank’s trading book exposure, its banking book exposure which is booked in a currency different from Euro, as well as securitization positions in the regulatory trading book. Specific assets and liabilities may be subject to more than one regulatory risk framework. Therefore, the sum of values in column (c) to (g) may not be equal to the amounts in column (b). Moreover, the allocation of positions to the regulatory trading or banking book, as well as the product definition, impacts the allocation to and treatment within a regulatory framework and might be different to the product definition or trading classification under IFRS.
Differences between carrying values on the regulatory balance sheet in column (b) and amounts deducted from CRR/CRD capital are explained further in the footnotes of the table “EU CC1 Composition of regulatory own funds” as referenced in the last column of this table.
18
|
Deutsche Bank |
||
|
Pillar 3 Report as of December 31, 2024 |
||
EU LI1 – Differences between accounting and regulatory scopes of consolidation and the mapping of financial statement categories with regulatory risk categories
|
|
Dec 31, 2024 |
|||||||||||||||
|
a |
b |
c |
d |
e |
f |
g |
||||||||||
|
Carrying values of items: |
||||||||||||||||
|
in € m. |
Carrying |
Carrying values under scope of prudential consolidation |
Subject to |
Subject to |
Subject to |
Subject to |
Not subject |
References1 |
||||||||
|
Assets: |
||||||||||||||||
|
Cash and central bank balances |
147,494 |
147,462 |
147,331 |
0 |
0 |
86,770 |
0 |
|||||||||
|
Interbank balances (w/o central banks) |
6,160 |
6,099 |
5,543 |
0 |
0 |
4,703 |
0 |
|||||||||
|
Central bank funds sold and securities purchased under resale agreements |
40,803 |
40,803 |
201 |
40,602 |
0 |
25,446 |
0 |
|||||||||
|
Securities borrowed |
44 |
44 |
0 |
44 |
0 |
11 |
0 |
|||||||||
|
Financial assets at fair value through profit or loss |
||||||||||||||||
|
Trading assets |
139,772 |
137,779 |
4,252 |
118 |
306 |
133,247 |
0 |
|||||||||
|
Positive market values from derivative financial instruments |
291,754 |
291,889 |
21 |
291,643 |
24 |
291,739 |
0 |
|||||||||
|
Non-trading financial assets mandatory at fair value through profit and loss |
114,324 |
114,293 |
5,427 |
103,870 |
701 |
110,822 |
0 |
|||||||||
|
Financial assets designated at fair value through profit or loss |
0 |
0 |
0 |
0 |
0 |
0 |
0 |
|||||||||
|
Total financial assets at fair value through profit or loss |
545,849 |
543,960 |
9,700 |
395,631 |
1,031 |
535,808 |
0 |
|||||||||
|
Financial assets at Fair Value through OCI |
||||||||||||||||
|
Financial assets mandatory at fair value through OCI |
42,090 |
41,901 |
39,113 |
2,786 |
2 |
27,872 |
0 |
|||||||||
|
Equity Instruments designated at fair value through OCI |
0 |
0 |
0 |
0 |
0 |
0 |
0 |
|||||||||
|
Total financial assets at fair value through OCI |
42,090 |
41,901 |
39,113 |
2,786 |
2 |
27,872 |
0 |
|||||||||
|
Equity method investments |
1,028 |
1,028 |
965 |
0 |
1 |
1,028 |
63 |
|||||||||
|
of which: Goodwill |
63 |
63 |
0 |
0 |
0 |
0 |
63 |
D |
||||||||
|
Loans at amortized cost |
478,921 |
483,033 |
451,620 |
0 |
31,274 |
179,790 |
139 |
|||||||||
|
Property and equipment |
6,193 |
6,192 |
6,192 |
0 |
0 |
2,216 |
1 |
|||||||||
|
Goodwill and other intangible assets |
7,749 |
7,749 |
2,013 |
0 |
0 |
0 |
5,736 |
D |
||||||||
|
Other assets |
101,207 |
101,139 |
31,519 |
43,426 |
4,497 |
38,557 |
17,187 |
|||||||||
|
of which: Defined benefit pension fund assets |
1,301 |
1,299 |
0 |
0 |
0 |
0 |
1,299 |
F |
||||||||
|
Assets for current tax |
1,801 |
1,799 |
1,799 |
0 |
0 |
0 |
0 |
|||||||||
|
Deferred tax assets |
7,839 |
7,824 |
4,370 |
0 |
0 |
2,512 |
3,454 |
E |
||||||||
|
Total assets |
1,387,177 |
1,389,033 |
700,366 |
482,488 |
36,805 |
904,712 |
26,580 |
|||||||||
19
|
Deutsche Bank |
||
|
Pillar 3 Report as of December 31, 2024 |
||
|
|
Dec 31, 2024 |
|||||||||||||||
|
a |
b |
c |
d |
e |
f |
g |
||||||||||
|
Carrying values of items: |
||||||||||||||||
|
in € m. |
Carrying |
Carrying values under scope of prudential consolidation |
Subject to |
Subject to |
Subject to |
Subject to |
Not subject |
References1 |
||||||||
|
Liabilities and equity: |
||||||||||||||||
|
Deposits |
666,261 |
666,961 |
0 |
1,108 |
0 |
129,988 |
535,864 |
|||||||||
|
Central bank funds purchased and securities sold under repurchase agreements |
3,740 |
3,740 |
0 |
3,740 |
0 |
1,209 |
0 |
|||||||||
|
Securities loaned |
2 |
2 |
0 |
2 |
0 |
2 |
0 |
|||||||||
|
Financial liabilities at fair value through profit or loss |
||||||||||||||||
|
Trading liabilities |
43,498 |
43,498 |
0 |
14 |
0 |
42,541 |
(280) |
|||||||||
|
Negative market values from derivative financial instruments |
276,395 |
276,500 |
0 |
276,094 |
175 |
276,500 |
0 |
|||||||||
|
Financial liabilities designated at fair value through profit or loss |
92,047 |
91,803 |
0 |
73,179 |
0 |
72,664 |
(7) |
|||||||||
|
Investment contract liabilities |
454 |
0 |
0 |
0 |
0 |
0 |
0 |
|||||||||
|
Total financial liabilities at fair value through profit or loss |
412,395 |
411,801 |
0 |
349,287 |
175 |
391,705 |
(287) |
|||||||||
|
Other short-term borrowings |
9,895 |
9,899 |
0 |
0 |
0 |
2,811 |
7,088 |
|||||||||
|
Other liabilities |
95,631 |
93,550 |
0 |
49,146 |
0 |
34,680 |
17,674 |
|||||||||
|
Provisions |
3,326 |
3,320 |
0 |
0 |
0 |
1,336 |
1,983 |
|||||||||
|
Liabilities for current tax |
720 |
715 |
0 |
0 |
0 |
159 |
556 |
|||||||||
|
Deferred tax liabilities |
590 |
477 |
0 |
0 |
0 |
0 |
477 |
|||||||||
|
Long-term debt |
114,899 |
118,890 |
0 |
0 |
0 |
26,430 |
92,460 |
H.I |
||||||||
|
of which: Subordinated long-term debt2 |
11,711 |
11,711 |
0 |
0 |
0 |
5,249 |
6,461 |
H.I |
||||||||
|
Trust preferred securities2 |
287 |
287 |
0 |
0 |
0 |
0 |
287 |
|||||||||
|
Obligation to purchase common shares |
0 |
0 |
0 |
0 |
0 |
0 |
0 |
|||||||||
|
Total liabilities |
1,307,745 |
1,309,642 |
0 |
403,284 |
175 |
588,322 |
656,102 |
|||||||||
|
Common shares, no par value, nominal value |
5,106 |
5,106 |
0 |
0 |
0 |
0 |
5,106 |
A |
||||||||
|
Additional paid-in capital |
39,744 |
39,744 |
0 |
0 |
0 |
0 |
39,744 |
A |
||||||||
|
Retained earnings |
23,368 |
23,344 |
0 |
0 |
0 |
0 |
23,344 |
B |
||||||||
|
Common shares in treasury, at cost |
(713) |
(713) |
0 |
0 |
0 |
0 |
(713) |
A |
||||||||
|
Equity classified as obligation to purchase common shares |
0 |
0 |
0 |
0 |
0 |
0 |
0 |
A |
||||||||
|
Accumulated other comprehensive income, net of tax |
(1,229) |
(1,229) |
0 |
0 |
0 |
0 |
(1,229) |
C |
||||||||
|
Total shareholders’ equity |
66,276 |
66,252 |
0 |
0 |
0 |
0 |
66,252 |
|||||||||
|
Additional equity components |
11,550 |
11,550 |
0 |
0 |
0 |
0 |
11,550 |
G |
||||||||
|
Noncontrolling interests |
1,606 |
1,589 |
0 |
0 |
0 |
0 |
1,589 |
|||||||||
|
Total equity |
79,432 |
79,391 |
0 |
0 |
0 |
0 |
79,391 |
|||||||||
|
Total liabilities and equity |
1,387,177 |
1,389,033 |
0 |
403,284 |
175 |
588,322 |
735,493 |
|||||||||
1 References provide the mapping of regulatory balance sheet items used to calculate regulatory capital as reflected in the column “References” in “EU CC1– Composition of regulatory own funds”. Where applicable, more detailed information are provided in the respective reference footnote section.
2 Eligible Additional Tier 1 and Tier 2 instruments are reflected in these balance sheet positions based on their IFRS carrying values.
20
|
Deutsche Bank |
||
|
Pillar 3 Report as of December 31, 2024 |
||
|
|
Dec 31, 2023 |
|||||||||||||||
|
a |
b |
c |
d |
e |
f |
g |
||||||||||
|
Carrying values of items: |
||||||||||||||||
|
in € m. |
Carrying |
Carrying values under scope of prudential consolidation |
Subject to |
Subject to |
Subject to |
Subject to |
Not subject |
References1 |
||||||||
|
Assets: |
||||||||||||||||
|
Cash and central bank balances |
178,416 |
178,394 |
178,205 |
0 |
0 |
88,546 |
0 |
|||||||||
|
Interbank balances (w/o central banks) |
6,140 |
6,044 |
5,583 |
0 |
0 |
4,713 |
0 |
|||||||||
|
Central bank funds sold and securities purchased under resale agreements |
14,725 |
14,725 |
1,445 |
13,280 |
0 |
7,846 |
0 |
|||||||||
|
Securities borrowed |
39 |
39 |
0 |
39 |
0 |
6 |
0 |
|||||||||
|
Financial assets at fair value through profit or loss |
||||||||||||||||
|
Trading assets |
125,275 |
123,357 |
5,190 |
147 |
354 |
121,724 |
0 |
|||||||||
|
Positive market values from derivative financial instruments |
251,856 |
252,034 |
31 |
251,850 |
41 |
251,894 |
0 |
|||||||||
|
Non-trading financial assets mandatory at fair value through profit and loss |
88,047 |
88,488 |
5,074 |
77,725 |
1,088 |
85,356 |
0 |
|||||||||
|
Financial assets designated at fair value through profit or loss |
75 |
75 |
75 |
0 |
0 |
0 |
0 |
|||||||||
|
Total financial assets at fair value through profit or loss |
465,252 |
463,953 |
10,369 |
329,722 |
1,483 |
458,974 |
0 |
|||||||||
|
Financial assets at Fair Value through OCI |
||||||||||||||||
|
Financial assets mandatory at fair value through OCI |
35,546 |
35,362 |
33,487 |
1,805 |
0 |
23,129 |
0 |
|||||||||
|
Equity Instruments designated at fair value through OCI |
0 |
0 |
0 |
0 |
0 |
0 |
0 |
|||||||||
|
Total financial assets at fair value through OCI |
35,546 |
35,362 |
33,487 |
1,805 |
0 |
23,129 |
0 |
|||||||||
|
Equity method investments |
1,013 |
1,013 |
1,013 |
0 |
1 |
1,013 |
77 |
|||||||||
|
of which: Goodwill |
77 |
77 |
0 |
0 |
0 |
0 |
77 |
D |
||||||||
|
Loans at amortized cost |
473,705 |
477,382 |
448,000 |
0 |
29,270 |
165,167 |
111 |
|||||||||
|
Property and equipment |
6,185 |
6,159 |
6,159 |
0 |
0 |
2,252 |
0 |
|||||||||
|
Goodwill and other intangible assets |
7,327 |
7,297 |
1,838 |
0 |
0 |
0 |
5,459 |
D |
||||||||
|
Other assets |
114,697 |
114,618 |
32,803 |
41,331 |
3,734 |
39,392 |
29,758 |
|||||||||
|
of which: Defined benefit pension fund assets |
1,089 |
1,062 |
0 |
0 |
0 |
0 |
1,062 |
F |
||||||||
|
Assets for current tax |
1,513 |
1,509 |
1,509 |
0 |
0 |
0 |
0 |
|||||||||
|
Deferred tax assets |
7,773 |
7,736 |
3,910 |
0 |
0 |
2,066 |
3,826 |
E |
||||||||
|
Total assets |
1,312,331 |
1,314,232 |
724,322 |
386,177 |
34,488 |
793,104 |
39,234 |
|||||||||
21
|
Deutsche Bank |
||
|
Pillar 3 Report as of December 31, 2024 |
||
|
|
Dec 31, 2023 |
|||||||||||||||
|
a |
b |
c |
d |
e |
f |
g |
||||||||||
|
Carrying values of items: |
||||||||||||||||
|
in € m. |
Carrying |
Carrying values under scope of prudential consolidation |
Subject to |
Subject to |
Subject to |
Subject to |
Not subject |
References1 |
||||||||
|
Liabilities and equity: |
||||||||||||||||
|
Deposits |
622,035 |
623,011 |
0 |
1,056 |
44 |
105,867 |
516,044 |
|||||||||
|
Central bank funds purchased and securities sold under repurchase agreements |
3,038 |
3,038 |
0 |
3,038 |
0 |
419 |
0 |
|||||||||
|
Securities loaned |
3 |
3 |
0 |
3 |
0 |
3 |
0 |
|||||||||
|
Financial liabilities at fair value through profit or loss |
||||||||||||||||
|
Trading liabilities |
44,005 |
44,002 |
0 |
10 |
0 |
43,604 |
(17) |
|||||||||
|
Negative market values from derivative financial instruments |
238,260 |
238,373 |
0 |
238,099 |
145 |
238,373 |
0 |
|||||||||
|
Financial liabilities designated at fair value through profit or loss |
83,727 |
83,277 |
0 |
75,901 |
0 |
75,986 |
(5) |
|||||||||
|
Investment contract liabilities |
484 |
0 |
0 |
0 |
0 |
0 |
0 |
|||||||||
|
Total financial liabilities at fair value through profit or loss |
366,475 |
365,653 |
0 |
314,010 |
145 |
357,964 |
(22) |
|||||||||
|
Other short-term borrowings |
9,620 |
9,563 |
0 |
0 |
0 |
2,611 |
6,952 |
|||||||||
|
Other liabilities |
113,036 |
111,621 |
0 |
49,533 |
0 |
49,223 |
20,830 |
|||||||||
|
Provisions |
2,448 |
2,416 |
0 |
0 |
0 |
867 |
1,548 |
|||||||||
|
Liabilities for current tax |
631 |
626 |
0 |
0 |
0 |
185 |
441 |
|||||||||
|
Deferred tax liabilities |
546 |
445 |
0 |
0 |
0 |
0 |
445 |
|||||||||
|
Long-term debt |
119,390 |
122,880 |
0 |
0 |
0 |
24,804 |
98,077 |
H.I |
||||||||
|
of which: Subordinated long-term debt2 |
11,311 |
11,311 |
0 |
0 |
0 |
4,921 |
6,391 |
H.I |
||||||||
|
Trust preferred securities2 |
289 |
289 |
0 |
0 |
0 |
0 |
289 |
|||||||||
|
Obligation to purchase common shares |
0 |
0 |
0 |
0 |
0 |
0 |
0 |
|||||||||
|
Total liabilities |
1,237,513 |
1,239,546 |
0 |
367,641 |
190 |
541,944 |
644,604 |
|||||||||
|
Common shares, no par value, nominal value |
5,223 |
5,223 |
0 |
0 |
0 |
0 |
5,223 |
A |
||||||||
|
Additional paid-in capital |
40,187 |
40,187 |
0 |
0 |
0 |
0 |
40,187 |
A |
||||||||
|
Retained earnings |
21,316 |
21,282 |
0 |
0 |
0 |
0 |
21,282 |
B |
||||||||
|
Common shares in treasury, at cost |
(481) |
(481) |
0 |
0 |
0 |
0 |
(481) |
A |
||||||||
|
Equity classified as obligation to purchase common shares |
0 |
0 |
0 |
0 |
0 |
0 |
0 |
A |
||||||||
|
Accumulated other comprehensive income, net of tax |
(1,760) |
(1,760) |
0 |
0 |
0 |
0 |
(1,760) |
C |
||||||||
|
Total shareholders’ equity |
64,486 |
64,451 |
0 |
0 |
0 |
0 |
64,451 |
|||||||||
|
Additional equity components |
8,569 |
8,569 |
0 |
0 |
0 |
0 |
8,569 |
G |
||||||||
|
Noncontrolling interests |
1,763 |
1,666 |
0 |
0 |
0 |
0 |
1,666 |
|||||||||
|
Total equity |
74,818 |
74,686 |
0 |
0 |
0 |
0 |
74,686 |
|||||||||
|
Total liabilities and equity |
1,312,331 |
1,314,233 |
0 |
367,641 |
190 |
541,944 |
719,290 |
|||||||||
1 References provide the mapping of regulatory balance sheet items used to calculate regulatory capital as reflected in the column “References” in “Own funds template (incl. RWA and Capital Ratios)”. Where applicable, more detailed information are provided in the respective reference footnote section.
2 Eligible Additional Tier 1 and Tier 2 instruments are reflected in these balance sheet positions with their values according to IFRS.
Movements in carrying values as reported in published financial statements, i.e. under IFRS scope of consolidation for December 31, 2023 and December 31, 2024 are primarily driven by the following factors:
Cash, central bank and interbank balances decreased by € 30.9 billion, as a result of an increase in central bank funds sold, securities purchased under resale agreements, and securities borrowed across all applicable measurement categories by € 52.7 billion, mainly driven by increased firm trading activities and client flows. Trading assets increased by € 14.5 billion, primarily driven by an increase in bond positions in the bank’s debt securities portfolio due to client flows and desk positioning, as well as an increase in traded loans. Positive and negative market values of derivative financial instruments increased by € 39.9 billion and € 38.1 billion, respectively, mainly due to increased volatility in foreign exchange products caused by political uncertainty towards the end of the year and the strengthening of the U.S. dollar against the euro. Non trading financial assets mandatory at fair value through profit or loss increased by € 26.3 billion, driven by aforementioned increase in securities purchased under resale agreements measured under non-trading financial assets mandatory at fair value through profit and loss. Financial assets at fair value through other comprehensive income increased by € 6.5 billion, driven by an increase in holdings of government securities in line with the bank’s initiative to optimize return on liquidity. Loans at amortized cost increased by € 5.2 billion, driven by a significant impact from foreign exchange movements and growth in Fixed Income & Currencies (FIC) business in the Investment Bank which is partly offset by lower mortgage origination in the Private Bank. Brokerage and securities related receivables and payables decreased by € 11.9 billion and € 17.8 billion, respectively, mainly due to a decrease in receivables and payables from pending settlement of regular way trades. Deposits increased by € 44.2 billion, primarily driven by growth in Corporate Cash Management business in the Corporate Bank as well as higher inflows in the Private Bank and Global Emerging Markets in the Investment Bank. Financial liabilities designated at fair value through profit or loss increased by € 8.3 billion, mainly attributable to an increase in long term debt driven by new issuances in FIC business in the Investment Bank. Long term debt at amortized cost decreased by € 4.5 billion, mainly due to repayments of the Targeted Longer Term Refinancing Operations (TLTRO) funding which were partly offset by new issuances.
22
|
Deutsche Bank |
||
|
Pillar 3 Report as of December 31, 2024 |
||
The overall movement of the balance sheet included an increase of € 31.4 billion due to foreign exchange rate movements, mainly driven by a strengthening of the U.S. dollar versus the euro.
Table EU LI2 presents a description of the differences between the financial statements’ carrying value amounts under the regulatory scope of consolidation and the exposure amounts used for regulatory purposes.
EU LI2 – Main sources of differences between regulatory exposure amounts and carrying values in financial statements
|
|
Dec 31, 2024 |
|||||||||||
|
a |
b |
c |
d |
e |
||||||||
|
Items subject to: |
||||||||||||
|
in € m. |
Total |
Credit risk |
Securitization |
Counterparty |
Market risk |
|||||||
|
1 |
Assets carrying value amount under the scope |
1,389,033 |
700,366 |
36,805 |
482,488 |
904,712 |
||||||
|
2 |
Liabilities carrying value amount under the scope |
1,309,642 |
0 |
175 |
403,284 |
588,322 |
||||||
|
3 |
Total net amount under the scope of prudential consolidation |
79,391 |
700,366 |
36,630 |
79,205 |
316,3905 |
||||||
|
4 |
Off-balance-sheet amounts |
339,804 |
318,362 |
18,123 |
37 |
0 |
||||||
|
5,6 |
Differences in valuations (incl. |
0 |
0 |
206 |
28,118 |
0 |
||||||
|
7 |
Differences due to consideration of provisions3 |
0 |
7,485 |
(30) |
1 |
0 |
||||||
|
8 |
Differences due to the use of credit risk mitigation techniques (CRMs) |
0 |
(2,898) |
0 |
(0) |
0 |
||||||
|
9 |
Differences due to credit conversion factors |
0 |
(181,789) |
0 |
0 |
0 |
||||||
|
10 |
Differences due to Securitisation with risk transfer2 |
0 |
(36,883) |
33,709 |
0 |
(118) |
||||||
|
11 |
Other differences4 |
0 |
19,461 |
396 |
1,214 |
0 |
||||||
|
12 |
Exposure amounts considered for regulatory purposes |
1,024,355 |
824,105 |
89,035 |
108,574 |
2,6416 |
||||||
1 Includes effects due to differences in exposure modelling applying the effective expected positive exposure as well as the SA-CCR for derivatives and financial collateral comprehensive method for Securities Financing Transactions (SFT) respectively; that also reflects differences as a result of the application of credit risk mitigation and regulatory netting rules
2 Included in the sum of € 33.7 billion are FX mismatches amounting to € 1.3 billion; the amount represents the retained synthetic tranches after consideration of bought credit protection
3 Includes credit-risk related purchase price adjustments arising in the context of asset purchases as well as business combinations
4 Primarily reflects valuation differences as a result of regulatory product definition being different from the accounting product definition; moreover, under the counterparty credit risk framework funded default fund contribution in form of securities are considered in the exposure amounts for regulatory purposes
5 Included in the sum of € 316.4 billion are € 2.8 billion net carrying amount attributable to securitization positions in the regulatory trading book covered under the market risk standardized approach
6 Exposure at default is only considered for securitization positions in the regulatory trading book as the remaining exposure is considered within the internally developed market risk models
|
|
Dec 31, 2023 |
|||||||||||
|
a |
b |
c |
d |
e |
||||||||
|
Items subject to: |
||||||||||||
|
in € m. |
Total |
Credit risk |
Securitization |
Counterparty |
Market risk |
|||||||
|
1 |
Assets carrying value amount under the scope |
1,314,232 |
724,322 |
34,488 |
386,177 |
793,104 |
||||||
|
2 |
Liabilities carrying value amount under the scope |
1,239,546 |
0 |
190 |
367,641 |
541,944 |
||||||
|
3 |
Total net amount under the scope of prudential consolidation |
74,686 |
724,322 |
34,298 |
18,537 |
251,1605 |
||||||
|
4 |
Off-balance-sheet amounts |
309,269 |
289,465 |
16,568 |
8,942 |
0 |
||||||
|
5,6 |
Differences in valuations (incl. |
0 |
0 |
149 |
69,778 |
0 |
||||||
|
7 |
Differences due to consideration of provisions3 |
0 |
6,776 |
(25) |
0 |
0 |
||||||
|
8 |
Differences due to the use of credit risk mitigation techniques (CRMs) |
0 |
(3,001) |
0 |
0 |
0 |
||||||
|
9 |
Differences due to credit conversion factors |
0 |
(172,383) |
0 |
232 |
0 |
||||||
|
10 |
Differences due to Securitisation with risk transfer2 |
0 |
(29,809) |
27,428 |
0 |
96 |
||||||
|
11 |
Other differences4 |
0 |
19,048 |
16 |
7,317 |
0 |
||||||
|
12 |
Exposure amounts considered for regulatory purposes |
1,019,689 |
834,418 |
78,436 |
104,807 |
2,0286 |
||||||
1 Includes effects due to differences in exposure modelling applying the effective expected positive exposure as well as the SA-CCR for derivatives and financial collateral comprehensive method for Securities Financing Transactions (SFT) respectively; that also reflects differences as a result of the application of credit risk mitigation and regulatory netting rules
2 Included in the sum of € 27.4 billion are FX mismatches amounting to € 1.1 billion; the amount represents the retained synthetic tranches after consideration of bought credit protection
3 Includes credit-risk related purchase price adjustments arising in the context of asset purchases as well as business combinations
4 Primarily reflects valuation differences as a result of regulatory product definition being different from the accounting product definition; moreover, under the counterparty credit risk framework funded default fund contribution in form of securities are considered in the exposure amounts for regulatory purposes
5 Included in the sum of € 251.2 billion are € 1.9 billion net carrying amount attributable to securitization positions in the regulatory trading book covered under the market risk standardized approach
6 Exposure at default is only considered for securitization positions in the regulatory trading book as the remaining exposure is considered within the internally developed market risk models
Article 437 (a) CRR
The table below highlights the difference in the basis of consolidation for accounting and prudential reporting purposes as it compares the carrying values as reported under IFRS with the carrying values under the scope of the regulatory consolidation. References in the last column of the table provide the mapping of regulatory balance sheet items used to calculate regulatory capital. The reference columns presented below reconcile to the reference columns as presented in the template “EU CC1– Composition of regulatory own funds”.
23
|
Deutsche Bank |
||
|
Pillar 3 Report as of December 31, 2024 |
||
EU CC2 – Reconciliation of regulatory own funds to balance sheet in the audited financial statements
|
|
Dec 31, 2024 |
June 30, 2024 |
||||||||||
|
a |
b |
a |
b |
|||||||||
|
in € m. |
Carrying |
Carrying values under scope of regulatory |
References |
Carrying |
Carrying values under scope of regulatory |
References |
||||||
|
Assets: |
||||||||||||
|
Cash and central bank balances |
147,494 |
147,462 |
148,625 |
148,597 |
||||||||
|
Interbank balances (w/o central banks) |
6,160 |
6,099 |
7,333 |
7,201 |
||||||||
|
Central bank funds sold and securities purchased under resale agreements |
40,803 |
40,803 |
24,937 |
24,937 |
||||||||
|
Securities borrowed |
44 |
44 |
44 |
44 |
||||||||
|
Financial assets at fair value through profit or loss |
||||||||||||
|
of which: |
||||||||||||
|
Trading assets |
139,772 |
137,779 |
134,894 |
132,924 |
||||||||
|
Positive market values from derivative financial instruments |
291,754 |
291,889 |
237,222 |
237,341 |
||||||||
|
Non-trading financial assets mandatory at fair value through profit and loss |
114,324 |
114,293 |
104,577 |
104,955 |
||||||||
|
Financial assets designated at fair value through profit or loss |
0 |
0 |
45 |
45 |
||||||||
|
Total financial assets at fair value through profit or loss |
545,849 |
543,960 |
476,738 |
475,265 |
||||||||
|
Financial assets at Fair Value through OCI |
||||||||||||
|
Financial assets mandatory at fair value through OCI |
42,090 |
41,901 |
40,076 |
39,891 |
||||||||
|
Equity Instruments designated at fair value through OCI |
0 |
0 |
0 |
0 |
||||||||
|
Total financial assets at fair value through OCI |
42,090 |
41,901 |
40,076 |
39,891 |
||||||||
|
Financial assets available for sale |
0 |
0 |
0 |
0 |
||||||||
|
Equity method investments |
1,028 |
1,028 |
1,048 |
1,048 |
||||||||
|
of which: Goodwill |
63 |
63 |
D |
77 |
77 |
D |
||||||
|
Loans at amortized cost |
478,921 |
483,033 |
476,741 |
480,628 |
||||||||
|
Securities held to maturity |
0 |
0 |
0 |
0 |
||||||||
|
Property and equipment |
6,193 |
6,192 |
6,219 |
6,216 |
||||||||
|
Goodwill and other intangible assets |
7,749 |
7,749 |
D |
7,548 |
7,548 |
D |
||||||
|
Other assets |
101,207 |
101,139 |
152,603 |
152,590 |
||||||||
|
of which: Defined benefit pension fund assets |
1,301 |
1,299 |
F |
1,128 |
1,101 |
F |
||||||
|
Assets for current tax |
1,801 |
1,799 |
1,565 |
1,560 |
||||||||
|
Deferred tax assets |
7,839 |
7,824 |
E |
7,931 |
7,892 |
E |
||||||
|
Total assets |
1,387,177 |
1,389,033 |
1,351,406 |
1,353,415 |
||||||||
|
Liabilities and equity: |
||||||||||||
|
Deposits |
666,261 |
666,961 |
640,910 |
641,939 |
||||||||
|
Central bank funds purchased and securities sold under repurchase agreements |
3,740 |
3,740 |
2,632 |
2,632 |
||||||||
|
Securities loaned |
2 |
2 |
4 |
4 |
||||||||
|
Financial liabilities at fair value through profit or loss |
||||||||||||
|
of which: |
||||||||||||
|
Trading liabilities |
43,498 |
43,498 |
48,370 |
48,367 |
||||||||
|
Negative market values from derivative financial instruments |
276,395 |
276,500 |
223,332 |
223,394 |
||||||||
|
Financial liabilities designated at fair value through profit or loss |
92,047 |
91,803 |
92,683 |
92,489 |
||||||||
|
Investment contract liabilities |
454 |
0 |
509 |
0 |
||||||||
|
Total financial liabilities at fair value through profit or loss |
412,395 |
411,801 |
364,893 |
364,251 |
||||||||
|
Other short-term borrowings |
9,895 |
9,899 |
10,696 |
10,689 |
||||||||
|
Other liabilities |
95,631 |
93,550 |
142,808 |
140,950 |
||||||||
|
Provisions |
3,326 |
3,320 |
3,812 |
3,787 |
||||||||
|
Liabilities for current tax |
720 |
715 |
637 |
632 |
||||||||
|
Deferred tax liabilities |
590 |
477 |
610 |
499 |
||||||||
|
Long-term debt |
114,899 |
118,890 |
108,848 |
112,597 |
||||||||
|
of which: Subordinated long-term debt¹ |
11,711 |
11,711 |
H.I |
11,492 |
11,492 |
H.I |
||||||
|
Trust preferred securities¹ |
287 |
287 |
H.I |
288 |
288 |
H.I |
||||||
|
Obligation to purchase common shares |
0 |
0 |
0 |
0 |
||||||||
|
Total liabilities |
1,307,745 |
1,309,642 |
1,276,137 |
1,278,267 |
||||||||
|
Common shares, no par value, nominal value |
5,106 |
5,106 |
A |
5,106 |
5,106 |
A |
||||||
|
Additional paid-in capital |
39,744 |
39,744 |
A |
39,571 |
39,571 |
A |
||||||
24
|
Deutsche Bank |
||
|
Pillar 3 Report as of December 31, 2024 |
||
|
|
Dec 31, 2024 |
June 30, 2024 |
||||||||||
|
a |
b |
a |
b |
|||||||||
|
in € m. |
Carrying |
Carrying values under scope of regulatory |
References |
Carrying |
Carrying values under scope of regulatory |
References |
||||||
|
Retained earnings |
23,368 |
23,344 |
B |
21,288 |
21,250 |
B |
||||||
|
Common shares in treasury, at cost |
(713) |
(713) |
A |
(667) |
(667) |
A |
||||||
|
Equity classified as obligation to purchase common shares |
0 |
0 |
A |
0 |
0 |
A |
||||||
|
Accumulated other comprehensive income, net of tax |
(1,229) |
(1,229) |
C |
(1,664) |
(1,664) |
C |
||||||
|
Total shareholders’ equity |
66,276 |
66,252 |
63,634 |
63,597 |
||||||||
|
Additional equity components |
11,550 |
11,550 |
G |
10,052 |
10,052 |
G |
||||||
|
Noncontrolling interests |
1,606 |
1,589 |
1,583 |
1,499 |
||||||||
|
Total equity |
79,432 |
79,391 |
75,269 |
75,147 |
||||||||
|
Total liabilities and equity |
1,387,177 |
1,389,033 |
1,351,406 |
1,353,415 |
||||||||
1 Eligible Additional Tier 1 and Tier 2 instruments are reflected in these balance sheet positions based on their IFRS carrying values.
Outline of differences in scopes of consolidation
Article 436 (b) CRR
As of year-end 2024, Deutsche Banks’ regulatory group comprised 293 entities (excluding the parent Deutsche Bank Aktiengesellschaft). The classification applied for these entities is in accordance with CRR. The regulatory group comprised 22 credit institutions, one payment institution, two investment firms, 185 financial institutions, three financial holding companies, ten asset management companies and 70 ancillary services undertakings.
As of year-end 2023, the regulatory group comprised 299 entities (excluding the parent Deutsche Bank Aktiengesellschaft), of which one was consolidated on a pro-rata basis. The regulatory group comprised 22 credit institutions, one payment institution, two investment firms, 195 financial institutions, three financial holding companies, ten asset management companies and 66 ancillary services undertakings.
15 entities were exempted from regulatory consolidation pursuant to Section 31 (3) KWG in conjunction with Article 19 CRR as per year end 2024 (year end 2023: 17 entities). These regulations allow the exclusion of small entities in the regulatory scope of application from consolidated regulatory reporting if either their total assets (including off-balance sheet items) are below € 10 million or below 1 % of our Group’s total assets. Also, these entities were not required to be consolidated in our financial statements in accordance with IFRS.
These regulatory unconsolidated entities have to be included in the deduction treatment for significant investments in financial sector entities pursuant to Article 36 (1) (i) CRR in conjunction with Article 43 (c) CRR. The book values of participations in their equity included in the deduction treatment amounted to in total € 2.2 million as per year end 2024 (year end 2023: € 2.2 million).
Table EU LI3 below illustrates the differences in the scopes of consolidation for financial accounting and regulatory purposes for the Group. It considers all entities for which the method of the accounting consolidation is different from the method of the regulatory consolidation. On an entity-by-entity level the table presents the method of accounting consolidation and then in the following columns whether and how – under the regulatory scope of consolidation – the entity is recognized. This is then finally supplemented by a short description of the entity.
EU LI3 – Outline of the differences in the scopes of consolidation (entity by entity)
|
a |
b |
c |
d |
e |
f |
g |
h |
|||||||
|
Method of prudential consolidation |
||||||||||||||
|
Name of the entity |
Method of accounting consolidation |
Full |
Propor- |
Equity |
Neither |
De- |
Description of the entity |
|||||||
|
Al Mi'yar Capital SA |
Full consolidation |
x |
Other Enterprise |
|||||||||||
|
Alfred Herrhausen Gesellschaft mbH i.L. |
Full consolidation |
x |
Other Enterprise |
|||||||||||
|
Alguer Inversiones Designated Activity Company |
Full consolidation |
x |
Financial Institution |
|||||||||||
|
Alixville Invest, S.L. |
Full consolidation |
x |
Ancillary Services Undertaking |
|||||||||||
|
Altersvorsorge Fonds Hamburg Alter Wall Dr. Juncker KG |
Full consolidation |
x |
Other Enterprise |
|||||||||||
|
Atlas Investment Company 1 S.à r.l., en liquidation volontaire |
Full consolidation |
x |
Financial Institution |
|||||||||||
|
Atlas Investment Company 2 S.à r.l., en liquidation volontaire |
Full consolidation |
x |
Financial Institution |
|||||||||||
|
Atlas Investment Company 3 S.à r.l., en liquidation volontaire |
Full consolidation |
x |
Financial Institution |
|||||||||||
25
|
Deutsche Bank |
||
|
Pillar 3 Report as of December 31, 2024 |
||
|
a |
b |
c |
d |
e |
f |
g |
h |
|||||||
|
Method of prudential consolidation |
||||||||||||||
|
Name of the entity |
Method of accounting consolidation |
Full |
Propor- |
Equity |
Neither |
De- |
Description of the entity |
|||||||
|
Atlas Investment Company 4 S.à r.l., en liquidation volontaire |
Full consolidation |
x |
Financial Institution |
|||||||||||
|
Atlas Portfolio Select SPC |
Full consolidation |
x |
Financial Institution |
|||||||||||
|
Atlas SICAV - FIS, en liquidation volontaire |
Full consolidation |
x |
Other Enterprise |
|||||||||||
|
Australian Secured Personal Loans Trust |
Full consolidation |
x |
Other Enterprise |
|||||||||||
|
Axia Insurance, Ltd. |
Full consolidation |
x |
Other Enterprise |
|||||||||||
|
Benefit Trust GmbH |
No consolidation |
x |
Financial Institution |
|||||||||||
|
Borfield Sociedad Anonima |
Full consolidation |
x |
Other Enterprise |
|||||||||||
|
BT Globenet Nominees Limited |
Full consolidation |
x |
Other Enterprise |
|||||||||||
|
Cathay Advisory (Beijing) Co., Ltd. |
Full consolidation |
x |
Other Enterprise |
|||||||||||
|
Cayman Reference Fund Holdings Limited |
Full consolidation |
x |
Ancillary Services Undertaking |
|||||||||||
|
Ceto S.à r.l. |
Full consolidation |
x |
Financial Institution |
|||||||||||
|
Charitable Luxembourg Four S.à r.l. |
Full consolidation |
x |
Financial Institution |
|||||||||||
|
Charitable Luxembourg Three S.à r.l. |
Full consolidation |
x |
Financial Institution |
|||||||||||
|
Charitable Luxembourg Two S.à r.l. |
Full consolidation |
x |
Financial Institution |
|||||||||||
|
CLASS Limited |
Full consolidation |
x |
Other Enterprise |
|||||||||||
|
Collins Capital Low Volatility Performance II Special Investments, Ltd. |
Full consolidation |
x |
Financial Institution |
|||||||||||
|
Crofton Invest, S.L. |
Full consolidation |
x |
Other Enterprise |
|||||||||||
|
Danube Properties S.à r.l., en faillite |
Full consolidation |
x |
Other Enterprise |
|||||||||||
|
DB Holding Fundo de Investimento Multimercado Investimento no Exterior Crédito Privado |
Full consolidation |
x |
Financial Institution |
|||||||||||
|
DB International Trust (Singapore) Limited |
Full consolidation |
x |
Other Enterprise |
|||||||||||
|
DB Management Support GmbH |
Full consolidation |
x |
Ancillary Services Undertaking |
|||||||||||
|
DB Nominees (Hong Kong) Limited |
Full consolidation |
x |
Ancillary Services Undertaking |
|||||||||||
|
DB Nominees (Jersey) Limited |
Full consolidation |
x |
Other Enterprise |
|||||||||||
|
DB Nominees (Singapore) Pte Ltd |
Full consolidation |
x |
Other Enterprise |
|||||||||||
|
DB Re S.A. |
Full consolidation |
x |
Reinsurance Undertaking |
|||||||||||
|
DB SPEARs/LIFERs, Series DB-8092 Trust |
Full consolidation |
x |
Ancillary Services Undertaking |
|||||||||||
|
DB SPEARs/LIFERs, Series DB-8093 Trust |
Full consolidation |
x |
Ancillary Services Undertaking |
|||||||||||
|
DB SPEARs/LIFERs, Series DB-8095 Trust |
Full consolidation |
x |
Ancillary Services Undertaking |
|||||||||||
|
DB SPEARs/LIFERs, Series DB-8096 Trust |
Full consolidation |
x |
Ancillary Services Undertaking |
|||||||||||
|
DB SPEARs/LIFERs, Series DB-8097 Trust |
Full consolidation |
x |
Ancillary Services Undertaking |
|||||||||||
|
DB SPEARs/LIFERs, Series DB-8098 Trust |
Full consolidation |
x |
Ancillary Services Undertaking |
|||||||||||
|
DB SPEARs/LIFERs, Series DB-8103 Trust |
Full consolidation |
x |
Ancillary Services Undertaking |
|||||||||||
|
DB SPEARs/LIFERs, Series DB-8108 Trust |
Full consolidation |
x |
Ancillary Services Undertaking |
|||||||||||
|
DB SPEARs/LIFERs, Series DB-8114 Trust |
Full consolidation |
x |
Ancillary Services Undertaking |
|||||||||||
|
DB SPEARs/LIFERs, Series DB-8119 Trust |
Full consolidation |
x |
Ancillary Services Undertaking |
|||||||||||
|
DB SPEARs/LIFERs, Series DB-8129 Trust |
Full consolidation |
x |
Ancillary Services Undertaking |
|||||||||||
|
DB SPEARs/LIFERs, Series DB-8139 Trust |
Full consolidation |
x |
Ancillary Services Undertaking |
|||||||||||
|
DB SPEARs/LIFERs, Series DB-8141 Trust |
Full consolidation |
x |
Ancillary Services Undertaking |
|||||||||||
|
DB SPEARs/LIFERs, Series DB-8142 Trust |
Full consolidation |
x |
Ancillary Services Undertaking |
|||||||||||
|
DB SPEARs/LIFERs, Series DB-8143 Trust |
Full consolidation |
x |
Ancillary Services Undertaking |
|||||||||||
|
DB SPEARs/LIFERs, Series DB-8144 Trust |
Full consolidation |
x |
Ancillary Services Undertaking |
|||||||||||
|
DB SPEARs/LIFERs, Series DB-8145 Trust |
Full consolidation |
x |
Ancillary Services Undertaking |
|||||||||||
|
DB SPEARs/LIFERs, Series DB-8146 Trust |
Full consolidation |
x |
Ancillary Services Undertaking |
|||||||||||
|
DB SPEARs/LIFERs, Series DB-8147 Trust |
Full consolidation |
x |
Ancillary Services Undertaking |
|||||||||||
|
DB SPEARs/LIFERs, Series DB-8148 Trust |
Full consolidation |
x |
Ancillary Services Undertaking |
|||||||||||
|
DB SPEARs/LIFERs, Series DB-8149 Trust |
Full consolidation |
x |
Ancillary Services Undertaking |
|||||||||||
|
DB SPEARs/LIFERs, Series DB-8150 Trust |
Full consolidation |
x |
Ancillary Services Undertaking |
|||||||||||
|
DB SPEARs/LIFERs, Series DB-8151 Trust |
Full consolidation |
x |
Ancillary Services Undertaking |
|||||||||||
|
DB SPEARs/LIFERs, Series DB-8201 Trust |
Full consolidation |
x |
Ancillary Services Undertaking |
|||||||||||
|
DB SPEARs/LIFERs, Series DB-8202 Trust |
Full consolidation |
x |
Ancillary Services Undertaking |
|||||||||||
|
DB SPEARs/LIFERs, Series DBE-8055 Trust |
Full consolidation |
x |
Ancillary Services Undertaking |
|||||||||||
|
DB SPEARs/LIFERs, Series DBE-8057 Trust |
Full consolidation |
x |
Ancillary Services Undertaking |
|||||||||||
|
DB SPEARs/LIFERs, Series DBE-8060 Trust |
Full consolidation |
x |
Ancillary Services Undertaking |
|||||||||||
|
DB SPEARs/LIFERs, Series DBE-8067 Trust |
Full consolidation |
x |
Ancillary Services Undertaking |
|||||||||||
|
DB SPEARs/LIFERs, Series DBE-8070 Trust |
Full consolidation |
x |
Ancillary Services Undertaking |
|||||||||||
|
DB SPEARs/LIFERs, Series DBE-8071 Trust |
Full consolidation |
x |
Ancillary Services Undertaking |
|||||||||||
|
DB SPEARs/LIFERs, Series DBE-8081 Trust |
Full consolidation |
x |
Ancillary Services Undertaking |
|||||||||||
|
DB SPEARs/LIFERs, Series DBE-8082 Trust |
Full consolidation |
x |
Ancillary Services Undertaking |
|||||||||||
|
DB SPEARs/LIFERs, Series DBE-8090 Trust |
Full consolidation |
x |
Ancillary Services Undertaking |
|||||||||||
|
DB SPEARs/LIFERs, Series DBE-8099 Trust |
Full consolidation |
x |
Ancillary Services Undertaking |
|||||||||||
|
DB SPEARs/LIFERs, Series DBE-8100 Trust |
Full consolidation |
x |
Ancillary Services Undertaking |
|||||||||||
|
DB SPEARs/LIFERs, Series DBE-8101 Trust |
Full consolidation |
x |
Ancillary Services Undertaking |
|||||||||||
|
DB SPEARs/LIFERs, Series DBE-8105 Trust |
Full consolidation |
x |
Ancillary Services Undertaking |
|||||||||||
26
|
Deutsche Bank |
||
|
Pillar 3 Report as of December 31, 2024 |
||
|
a |
b |
c |
d |
e |
f |
g |
h |
|||||||
|
Method of prudential consolidation |
||||||||||||||
|
Name of the entity |
Method of accounting consolidation |
Full |
Propor- |
Equity |
Neither |
De- |
Description of the entity |
|||||||
|
DB SPEARs/LIFERs, Series DBE-8106 Trust |
Full consolidation |
x |
Ancillary Services Undertaking |
|||||||||||
|
DB SPEARs/LIFERs, Series DBE-8107 Trust |
Full consolidation |
x |
Ancillary Services Undertaking |
|||||||||||
|
DB SPEARs/LIFERs, Series DBE-8109 Trust |
Full consolidation |
x |
Ancillary Services Undertaking |
|||||||||||
|
DB SPEARs/LIFERs, Series DBE-8110 Trust |
Full consolidation |
x |
Ancillary Services Undertaking |
|||||||||||
|
DB SPEARs/LIFERs, Series DBE-8113 Trust |
Full consolidation |
x |
Ancillary Services Undertaking |
|||||||||||
|
DB SPEARs/LIFERs, Series DBE-8118 Trust |
Full consolidation |
x |
Ancillary Services Undertaking |
|||||||||||
|
DB SPEARs/LIFERs, Series DBE-8120 Trust |
Full consolidation |
x |
Ancillary Services Undertaking |
|||||||||||
|
DB SPEARs/LIFERs, Series DBE-8121 Trust |
Full consolidation |
x |
Ancillary Services Undertaking |
|||||||||||
|
DB SPEARs/LIFERs, Series DBE-8122 Trust |
Full consolidation |
x |
Ancillary Services Undertaking |
|||||||||||
|
DB SPEARs/LIFERs, Series DBE-8123 Trust |
Full consolidation |
x |
Ancillary Services Undertaking |
|||||||||||
|
DB SPEARs/LIFERs, Series DBE-8124 Trust |
Full consolidation |
x |
Ancillary Services Undertaking |
|||||||||||
|
DB SPEARs/LIFERs, Series DBE-8125 Trust |
Full consolidation |
x |
Ancillary Services Undertaking |
|||||||||||
|
DB SPEARs/LIFERs, Series DBE-8126 Trust |
Full consolidation |
x |
Ancillary Services Undertaking |
|||||||||||
|
DB SPEARs/LIFERs, Series DBE-8128 Trust |
Full consolidation |
x |
Ancillary Services Undertaking |
|||||||||||
|
DB SPEARs/LIFERs, Series DBE-8130 Trust |
Full consolidation |
x |
Ancillary Services Undertaking |
|||||||||||
|
DB SPEARs/LIFERs, Series DBE-8131 Trust |
Full consolidation |
x |
Ancillary Services Undertaking |
|||||||||||
|
DB SPEARs/LIFERs, Series DBE-8132 Trust |
Full consolidation |
x |
Ancillary Services Undertaking |
|||||||||||
|
DB SPEARs/LIFERs, Series DBE-8133 Trust |
Full consolidation |
x |
Ancillary Services Undertaking |
|||||||||||
|
DB SPEARs/LIFERs, Series DBE-8134 Trust |
Full consolidation |
x |
Ancillary Services Undertaking |
|||||||||||
|
DB SPEARs/LIFERs, Series DBE-8135 Trust |
Full consolidation |
x |
Ancillary Services Undertaking |
|||||||||||
|
DB SPEARs/LIFERs, Series DBE-8136 Trust |
Full consolidation |
x |
Ancillary Services Undertaking |
|||||||||||
|
DB SPEARs/LIFERs, Series DBE-8137 Trust |
Full consolidation |
x |
Ancillary Services Undertaking |
|||||||||||
|
DB SPEARs/LIFERs, Series DBE-8138 Trust |
Full consolidation |
x |
Ancillary Services Undertaking |
|||||||||||
|
DB SPEARs/LIFERs, Series DBE-8140 Trust |
Full consolidation |
x |
Ancillary Services Undertaking |
|||||||||||
|
DB SPEARs/LIFERs, Series DBE-8152 Trust |
Full consolidation |
x |
Ancillary Services Undertaking |
|||||||||||
|
DB SPEARs/LIFERs, Series DBE-8153 Trust |
Full consolidation |
x |
Ancillary Services Undertaking |
|||||||||||
|
DB SPEARs/LIFERs, Series DBE-8908 Trust |
Full consolidation |
x |
Ancillary Services Undertaking |
|||||||||||
|
DB SPEARs/LIFERs, Series DBE-8909 Trust |
Full consolidation |
x |
Ancillary Services Undertaking |
|||||||||||
|
DB Trustee Services Limited |
Full consolidation |
x |
Other Enterprise |
|||||||||||
|
DB Trustees (Hong Kong) Limited |
Full consolidation |
x |
Other Enterprise |
|||||||||||
|
DB VersicherungsManager GmbH |
Full consolidation |
x |
Other Enterprise |
|||||||||||
|
DB Vita S.A. |
Full consolidation |
x |
Insurance Undertaking |
|||||||||||
|
DBX ETF Trust |
Full consolidation |
x |
Other Enterprise |
|||||||||||
|
Deloraine Spain, S.L. |
Full consolidation |
x |
Ancillary Services Undertaking |
|||||||||||
|
Deutsche Bank (Cayman) Limited |
Full consolidation |
x |
Other Enterprise |
|||||||||||
|
Deutsche Bank Immobilien GmbH |
Full consolidation |
x |
Other Enterprise |
|||||||||||
|
Deutsche Bank Insurance Agency Incorporated |
Full consolidation |
x |
Other Enterprise |
|||||||||||
|
Deutsche Bank Luxembourg S.A. - Fiduciary Deposits |
Full consolidation |
x |
Other Enterprise |
|||||||||||
|
Deutsche Bank Luxembourg S.A. - Fiduciary Note Programme |
Full consolidation |
x |
Other Enterprise |
|||||||||||
|
Deutsche Bank Representative Office Nigeria Limited |
Full consolidation |
x |
Ancillary Services Undertaking |
|||||||||||
|
Deutsche Cayman Ltd. |
Full consolidation |
x |
Other Enterprise |
|||||||||||
|
Deutsche Custody N.V. |
Full consolidation |
x |
Financial Institution |
|||||||||||
|
Deutsche Gesellschaft für Immobilien-Leasing mit beschränkter Haftung i.L. |
Full consolidation |
x |
Financial Institution |
|||||||||||
|
Deutsche Grundbesitz-Anlagegesellschaft mit beschränkter Haftung |
Full consolidation |
x |
Other Enterprise |
|||||||||||
|
Deutsche Securities (Proprietary) Limited |
Full consolidation |
x |
Other Enterprise |
|||||||||||
|
Deutsche Securities (SA) (Proprietary) Limited |
Full consolidation |
x |
Other Enterprise |
|||||||||||
|
Deutsche StiftungsTrust GmbH |
Full consolidation |
x |
Other Enterprise |
|||||||||||
|
Deutsche Trustee Company Limited |
Full consolidation |
x |
Other Enterprise |
|||||||||||
|
Deutsche Trustee Services (India) Private Limited |
Full consolidation |
x |
Other Enterprise |
|||||||||||
|
Deutsche Trustees Malaysia Berhad |
Full consolidation |
x |
Other Enterprise |
|||||||||||
|
Deutsches Institut für Altersvorsorge GmbH |
Full consolidation |
x |
Other Enterprise |
|||||||||||
|
DI Deutsche Immobilien Treuhandgesellschaft mbH |
Full consolidation |
x |
Other Enterprise |
|||||||||||
|
DWS Alternatives (IE) ICAV |
Full consolidation |
x |
Other Enterprise |
|||||||||||
|
DWS Alternatives France |
Full consolidation |
x |
Other Enterprise |
|||||||||||
|
DWS Concept |
Full consolidation |
x |
Other Enterprise |
|||||||||||
|
DWS Consulting Shanghai Limited |
Full consolidation |
x |
Other Enterprise |
|||||||||||
|
DWS Corporate Management Shanghai Limited |
Full consolidation |
x |
Other Enterprise |
|||||||||||
|
DWS EREP Lux 1 S.à r.l. |
Full consolidation |
x |
Other Enterprise |
|||||||||||
|
DWS European Real Estate Partners S.C.A. SICAV-RAIF |
Full consolidation |
x |
Other Enterprise |
|||||||||||
27
|
Deutsche Bank |
||
|
Pillar 3 Report as of December 31, 2024 |
||
|
a |
b |
c |
d |
e |
f |
g |
h |
|||||||
|
Method of prudential consolidation |
||||||||||||||
|
Name of the entity |
Method of accounting consolidation |
Full |
Propor- |
Equity |
Neither |
De- |
Description of the entity |
|||||||
|
DWS Funds |
Full consolidation |
x |
Other Enterprise |
|||||||||||
|
DWS Garant |
Full consolidation |
x |
Other Enterprise |
|||||||||||
|
DWS Invest |
Full consolidation |
x |
Other Enterprise |
|||||||||||
|
DWS Invest (IE) ICAV |
Full consolidation |
x |
Other Enterprise |
|||||||||||
|
DWS Zeitwert Protect |
Full consolidation |
x |
Other Enterprise |
|||||||||||
|
DWS-Fonds Treasury Liquidity (EUR) |
Full consolidation |
x |
Other Enterprise |
|||||||||||
|
Dynamic Infrastructure Securities Fund LP |
Full consolidation |
x |
Financial Institution |
|||||||||||
|
Earls Eight Limited |
Full consolidation |
x |
Other Enterprise |
|||||||||||
|
Earls Four Limited |
Full consolidation |
x |
Other Enterprise |
|||||||||||
|
EC EUROPA IMMOBILIEN FONDS NR. 3 GmbH & CO. KG i.I. |
Full consolidation |
x |
Other Enterprise |
|||||||||||
|
Einkaufszentrum "HVD Dresden" S.à.r.l & Co. KG i.I. |
Full consolidation |
x |
Other Enterprise |
|||||||||||
|
Emerging Markets Capital Protected Investments Limited |
Full consolidation |
x |
Other Enterprise |
|||||||||||
|
Emeris |
Full consolidation |
x |
Financial Institution |
|||||||||||
|
Fiduciaria Sant' Andrea S.r.l. |
Full consolidation |
x |
Other Enterprise |
|||||||||||
|
Finanzberatungsgesellschaft mbH der Deutschen Bank |
Full consolidation |
x |
Ancillary Services Undertaking |
|||||||||||
|
Fir (Luxembourg) S.à r.l. |
Full consolidation |
x |
Other Enterprise |
|||||||||||
|
Fondo Privado de Titulización PYMES I Designated Activity Company |
Full consolidation |
x |
Other Enterprise |
|||||||||||
|
Franz Urbig- und Oscar Schlitter-Stiftung Gesellschaft mit beschränkter Haftung |
Full consolidation |
x |
Ancillary Services Undertaking |
|||||||||||
|
Freddie Mac Class A Taxable Multifamily M Certificates Series M-037 |
Full consolidation |
x |
Ancillary Services Undertaking |
|||||||||||
|
Freddie Mac Class A Taxable Multifamily M Certificates Series M-039 |
Full consolidation |
x |
Ancillary Services Undertaking |
|||||||||||
|
Freddie Mac Class A Taxable Multifamily M Certificates Series M-040 |
Full consolidation |
x |
Ancillary Services Undertaking |
|||||||||||
|
Freddie Mac Class A Taxable Multifamily M Certificates Series M-041 |
Full consolidation |
x |
Ancillary Services Undertaking |
|||||||||||
|
Freddie Mac Class A Taxable Multifamily M Certificates Series M-043 |
Full consolidation |
x |
Ancillary Services Undertaking |
|||||||||||
|
Freddie Mac Class A Taxable Multifamily M Certificates Series M-044 |
Full consolidation |
x |
Ancillary Services Undertaking |
|||||||||||
|
Fünfte SAB Treuhand und Verwaltung GmbH & Co. Suhl "Rimbachzentrum" KG |
Full consolidation |
x |
Other Enterprise |
|||||||||||
|
Galene S.à r.l. |
Full consolidation |
x |
Other Enterprise |
|||||||||||
|
Gladyr Spain, S.L. |
Full consolidation |
x |
Ancillary Services Undertaking |
|||||||||||
|
Global Opportunities Co-Investment Feeder, LLC |
Full consolidation |
x |
Financial Institution |
|||||||||||
|
Global Opportunities Co-Investment, LLC |
Full consolidation |
x |
Financial Institution |
|||||||||||
|
Greenheart (Luxembourg) S.à r.l. |
Full consolidation |
x |
Other Enterprise |
|||||||||||
|
Grundstücksgesellschaft Frankfurt Bockenheimer Landstraße GbR |
Full consolidation |
x |
Other Enterprise |
|||||||||||
|
Grundstücksgesellschaft Kerpen-Sindorf Vogelrutherfeld GbR |
Full consolidation |
x |
Other Enterprise |
|||||||||||
|
Grundstücksgesellschaft Wiesbaden Luisenstraße/Kirchgasse GbR |
Full consolidation |
x |
Other Enterprise |
|||||||||||
|
Havbell Designated Activity Company |
Full consolidation |
x |
Financial Institution |
|||||||||||
|
Histria Inversiones Designated Activity Company |
Full consolidation |
x |
Financial Institution |
|||||||||||
|
Immobilienfonds Büro-Center Erfurt am Flughafen Bindersleben I GbR |
Full consolidation |
x |
Other Enterprise |
|||||||||||
|
Immobilienfonds Wohn- und Geschäftshaus Köln-Blumenberg V GbR |
Full consolidation |
x |
Other Enterprise |
|||||||||||
|
Infrastructure Debt Fund S.C.Sp. SICAV-RAIF |
Full consolidation |
x |
Other Enterprise |
|||||||||||
|
Inn Properties S.à r.l., en faillite |
Full consolidation |
x |
Other Enterprise |
|||||||||||
|
Investor Solutions Limited |
Full consolidation |
x |
Other Enterprise |
|||||||||||
|
Isar Properties S.à r.l., en faillite |
Full consolidation |
x |
Other Enterprise |
|||||||||||
|
IVAF (Jersey) Limited |
Full consolidation |
x |
Ancillary Services Undertaking |
|||||||||||
|
Kelona Invest, S.L. |
Full consolidation |
x |
Ancillary Services Undertaking |
|||||||||||
|
KH Kitty Hall Holdings Limited |
Full consolidation |
x |
Financial Institution |
|||||||||||
|
Kratus Inversiones Designated Activity Company |
Full consolidation |
x |
Financial Institution |
|||||||||||
|
Kronos Funding Ltd |
Full consolidation |
x |
Financial Institution |
|||||||||||
|
Kuiper Credit Opportunities - Kuiper Compartment 01 - Bel-Air |
Full consolidation |
x |
Other Enterprise |
|||||||||||
|
Ledyard, S.L. |
Full consolidation |
x |
Ancillary Services Undertaking |
|||||||||||
28
|
Deutsche Bank |
||
|
Pillar 3 Report as of December 31, 2024 |
||
|
a |
b |
c |
d |
e |
f |
g |
h |
|||||||
|
Method of prudential consolidation |
||||||||||||||
|
Name of the entity |
Method of accounting consolidation |
Full |
Propor- |
Equity |
Neither |
De- |
Description of the entity |
|||||||
|
Leonardo III Initial GP Limited |
Full consolidation |
x |
Financial Institution |
|||||||||||
|
Life Mortgage S.r.l. |
Full consolidation |
x |
Other Enterprise |
|||||||||||
|
Lockwood Invest, S.L. |
Full consolidation |
x |
Financial Institution |
|||||||||||
|
Lunashadow Limited |
Full consolidation |
x |
Financial Institution |
|||||||||||
|
Malabo Holdings Designated Activity Company |
Full consolidation |
x |
Financial Institution |
|||||||||||
|
Merlin XI |
Full consolidation |
x |
Financial Institution |
|||||||||||
|
Meseta Inversiones Designated Activity Company |
Full consolidation |
x |
Financial Institution |
|||||||||||
|
Numis Nominees (Client) Limited |
Full consolidation |
x |
Other Enterprise |
|||||||||||
|
Numis Nominees (NSI) Limited |
Full consolidation |
x |
Other Enterprise |
|||||||||||
|
Numis Nominees Limited |
Full consolidation |
x |
Other Enterprise |
|||||||||||
|
Oasis Securitisation S.r.l. |
Full consolidation |
x |
Other Enterprise |
|||||||||||
|
Oder Properties S.à r.l., en faillite |
Full consolidation |
x |
Other Enterprise |
|||||||||||
|
OPB-Oktava GmbH |
Full consolidation |
x |
Financial Institution |
|||||||||||
|
OPPENHEIM PRIVATE EQUITY Verwaltungsgesellschaft mbH |
Full consolidation |
x |
Financial Institution |
|||||||||||
|
Palladium Global Investments S.A. |
Full consolidation |
x |
Other Enterprise |
|||||||||||
|
Palladium Securities 1 S.A. |
Full consolidation |
x |
Other Enterprise |
|||||||||||
|
PEIF III SLP Feeder GP, S.à r.l. |
Full consolidation |
x |
Financial Institution |
|||||||||||
|
PEIF III SLP Feeder, SCSp |
Full consolidation |
x |
Other Enterprise |
|||||||||||
|
PEIF IV SLP DWS Feeder 2, SCSp |
No consolidation |
x |
Financial Institution |
|||||||||||
|
Plantation Bay, Inc. |
Full consolidation |
x |
Other Enterprise |
|||||||||||
|
Property Debt Fund S.C.Sp. SICAV-RAIF |
Full consolidation |
x |
Other Enterprise |
|||||||||||
|
PUTTERs/DRIVERs, Series 3004 Trust |
Full consolidation |
x |
Ancillary Services Undertaking |
|||||||||||
|
PUTTERs/DRIVERs, Series 3005DB Trust |
Full consolidation |
x |
Ancillary Services Undertaking |
|||||||||||
|
PUTTERs/DRIVERs, Series 3007DB Trust |
Full consolidation |
x |
Ancillary Services Undertaking |
|||||||||||
|
Radical Properties Unlimited Company |
Full consolidation |
x |
Financial Institution |
|||||||||||
|
Redstone Finance Designated Activity Company |
Full consolidation |
x |
Financial Institution |
|||||||||||
|
Rhine Euro CLO I Designated Activity Company |
Full consolidation |
x |
Other Enterprise |
|||||||||||
|
Rhine Properties S.à r.l., en faillite |
Full consolidation |
x |
Other Enterprise |
|||||||||||
|
ROCKY 2021-1 SPV S.r.l. |
Full consolidation |
x |
Other Enterprise |
|||||||||||
|
Romareda Holdings Designated Activity Company |
Full consolidation |
x |
Financial Institution |
|||||||||||
|
RREEF India Advisors Private Limited |
Full consolidation |
x |
Other Enterprise |
|||||||||||
|
Samburg Invest, S.L. |
Full consolidation |
x |
Other Enterprise |
|||||||||||
|
SCB Alpspitze UG (haftungsbeschränkt) |
Full consolidation |
x |
Financial Institution |
|||||||||||
|
Seaconview Designated Activity Company |
Full consolidation |
x |
Financial Institution |
|||||||||||
|
SGI SLP Feeder GP S.à.r.l. |
Full consolidation |
x |
Financial Institution |
|||||||||||
|
Somkid Immobiliare S.r.l. |
Full consolidation |
x |
Other Enterprise |
|||||||||||
|
SP Mortgage Trust |
Full consolidation |
x |
Other Enterprise |
|||||||||||
|
Stelvio Immobiliare S.r.l. |
Full consolidation |
x |
Other Enterprise |
|||||||||||
|
Style City Limited |
Full consolidation |
x |
Financial Institution |
|||||||||||
|
Swabia 1 Designated Activity Company (in liquidation) |
Full consolidation |
x |
Other Enterprise |
|||||||||||
|
Tagus - Sociedade de Titularização de Creditos, S.A. |
Full consolidation |
x |
Other Enterprise |
|||||||||||
|
Tasman NZ Residential Mortgage Trust |
Full consolidation |
x |
Other Enterprise |
|||||||||||
|
Trave Properties S.à r.l., en faillite |
Full consolidation |
x |
Other Enterprise |
|||||||||||
|
Treuinvest Service GmbH |
Full consolidation |
x |
Other Enterprise |
|||||||||||
|
VCJ Lease S.à r.l. |
Full consolidation |
x |
Other Enterprise |
|||||||||||
|
Waltzfire Limited |
Full consolidation |
x |
Financial Institution |
|||||||||||
|
Wedverville Spain, S.L. |
Full consolidation |
x |
Ancillary Services Undertaking |
|||||||||||
|
Wendelstein 2017-1 UG (haftungsbeschränkt) |
Full consolidation |
x |
Other Enterprise |
|||||||||||
|
Wendelstein 2024-1 UG (haftungsbeschränkt) |
Full consolidation |
x |
Other Enterprise |
|||||||||||
|
5353 WHMR LLC |
Full consolidation |
x |
Other Enterprise |
|||||||||||
|
Xtrackers |
Full consolidation |
x |
Other Enterprise |
|||||||||||
|
Xtrackers (IE) Public Limited Company |
Full consolidation |
x |
Other Enterprise |
|||||||||||
|
Xtrackers II |
Full consolidation |
x |
Other Enterprise |
|||||||||||
29
|
Deutsche Bank |
||
|
Pillar 3 Report as of December 31, 2024 |
||
IFRS 9 / Article 468 CRR transitional arrangements on own funds
Article 473a CRR, Article 468 CRR
As of December 31, 2024, there was no capital add back for the IFRS 9 transitional arrangements from the dynamic component, which compares the credit loss allowance levels since January 1, 2020 and the reporting date.
Starting with the third quarter 2024, Deutsche Bank adopted the transitional arrangements in relation to the temporary treatment of unrealised gains and losses measured at fair value through OCI in accordance with Article 468 CRR. As per Regulation (EU) 2024/1623 the transitional rule as per article 468 CRR applies until year-end 2025. The impact of this implementation is presented in the table below.
IFRS 9/Article 468-FL: Comparison of institutions’ own funds and capital and leverage ratios with and without the application of transitional arrangements for IFRS 9 or analogous ECLs (Expected Credit Losses), and with and without the application of the temporary treatment in accordance with Article 468 of the CRR
|
|
Dec 31, 2024 |
Sep 30, 2024 |
||||
|
a |
b |
|||||
|
Available capital (in € m. ) |
||||||
|
1 |
Common Equity Tier 1 (CET 1) capital |
49,457 |
49,183 |
|||
|
2 |
Common Equity Tier 1 (CET 1) capital as if IFRS 9 or analogous ECLs transitional arrangements had not been applied |
49,457 |
49,183 |
|||
|
2a |
CET1 capital as if the temporary treatment of unrealised gains and losses measured at fair value through OCI (other comprehensive income) in accordance with Article 468 of the CRR had not been applied |
48,445 |
48,393 |
|||
|
3 |
Tier 1 capital |
60,835 |
59,061 |
|||
|
4 |
Tier 1 capital as if IFRS 9 or analogous ECLs transitional arrangements had not been applied |
60,835 |
59,061 |
|||
|
4a |
Tier 1 capital as if the temporary treatment of unrealised gains and losses measured at fair value through OCI in accordance with Article 468 of the CRR had not been applied |
59,823 |
58,272 |
|||
|
5 |
Total capital |
68,511 |
66,721 |
|||
|
6 |
Total capital as if IFRS 9 or analogous ECLs transitional arrangements had not been applied |
68,511 |
66,721 |
|||
|
6a |
Total capital as if the temporary treatment of unrealised gains and losses measured at fair value through OCI in accordance with Article 468 of the CRR had not been applied |
67,499 |
65,932 |
|||
|
Risk-weighted assets (in € m. ) |
||||||
|
7 |
Total risk-weighted assets |
357,427 |
356,496 |
|||
|
8 |
Total risk-weighted assets as if IFRS 9 or analogous ECLs transitional arrangements had not been applied |
357,427 |
356,496 |
|||
|
Total risk-weighted assets as if the temporary treatment of unrealised gains and losses measured at fair value through OCI in accordance with Article 468 of the CRR had not been applied |
358,590 |
356,356 |
||||
|
Capital ratios |
||||||
|
9 |
Common Equity Tier 1 (as a percentage of risk exposure amount) |
13.8 |
13.8 |
|||
|
10 |
Common Equity Tier 1 (as a percentage of risk exposure amount) as if IFRS 9 or analogous ECLs transitional arrangements had not been applied |
13.8 |
13.8 |
|||
|
10a |
CET1 (as a percentage of risk exposure amount) as if the temporary treatment of unrealised gains and losses measured at fair value through OCI in accordance with Article 468 of the CRR had not been applied |
13.5 |
13.6 |
|||
|
11 |
Tier 1 (as a percentage of risk exposure amount) |
17.0 |
16.6 |
|||
|
12 |
Tier 1 (as a percentage of risk exposure amount) as if IFRS 9 or analogous ECLs transitional arrangements had not been applied |
17.0 |
16.6 |
|||
|
12a |
Tier 1 (as a percentage of risk exposure amount) as if the temporary treatment of unrealised gains and losses measured at fair value through OCI in accordance with Article 468 of the CRR had not been applied |
16.7 |
16.4 |
|||
|
13 |
Total capital (as a percentage of risk exposure amount) |
19.2 |
18.7 |
|||
|
14 |
Total capital (as a percentage of risk exposure amount) as if IFRS 9 or analogous ECLs transitional arrangements had not been applied |
19.2 |
18.7 |
|||
|
14a |
Total capital (as a percentage of risk exposure amount) as if the temporary treatment of unrealised gains and losses measured at fair value through OCI in accordance with Article 468 of the CRR had not been applied |
18.8 |
18.5 |
|||
|
Leverage ratio |
||||||
|
15 |
Leverage ratio total exposure measure |
1,315,906 |
1,283,672 |
|||
|
Leverage ratio total exposure measure as if the temporary treatment of unrealised gains and losses measured at fair value through OCI in accordance with Article 468 of the CRR had not been applied |
1,314,501 |
1,282,576 |
||||
|
16 |
Leverage ratio |
4.6 |
4.6 |
|||
|
17 |
Leverage ratio as if IFRS 9 or analogous ECLs transitional arrangements had not been applied |
4.6 |
4.6 |
|||
|
17a |
Leverage ratio as if the temporary treatment of unrealised gains and losses measured at fair value through OCI in accordance with Article 468 of the CRR had not been applied |
4.6 |
4.5 |
|||
Main features of capital instruments
Article 437 (b-c) CRR
A description of the main features of the Common Equity Tier 1, Additional Tier 1 and Tier 2 capital instruments issued by Deutsche Bank is published on Deutsche Bank’s website (http://www.db.com/ir/en/capital-instruments.htm). In addition, this website provides full terms and conditions of all Common Equity Tier 1, Additional Tier 1 and Tier 2 capital instruments to the extent that these do not constitute private placements and are treated confidentially.
30
|
Deutsche Bank |
||
|
Pillar 3 Report as of December 31, 2024 |
||
Capital buffers
Minimum capital requirements and additional capital buffers
Article 438 (b) CRR
The Pillar 1 CET 1 minimum capital requirement applicable to the Group is 4.50% of RWA. The Pillar 1 total capital requirement of 8.00% demands further resources that may be met with up to 1.50% Additional Tier 1 capital and up to 2.00% Tier 2 capital.
Failure to meet minimum capital requirements can result in supervisory measures such as restrictions on profit distributions or limitations on certain businesses, such as lending. Deutsche Bank complied with the minimum regulatory capital adequacy requirements in 2024.
In addition to these minimum capital requirements, the following combined capital buffer requirements were fully effective beginning 2024 onwards. These buffer requirements must be met in addition to the Pillar 1 minimum capital requirements but can be drawn down in times of economic stress.
The capital conservation buffer is implemented in Section 10c German Banking Act, based on Article 129 CRD and equals a requirement of 2.50% CET 1 capital of RWA.
The countercyclical capital buffer is deployed in a jurisdiction when excess credit growth is associated with an increase in system-wide risk. It may vary between 0% and 2.50% CET 1 capital of RWA. In exceptional cases, it could also be higher than 2.50%. The institution-specific countercyclical buffer that applies to Deutsche Bank is the weighted average of the countercyclical capital buffers that apply in the jurisdictions where relevant credit exposures are located. As of December 31, 2024, the institution-specific countercyclical capital buffer was at 0.49%.
In addition to the aforementioned buffers, national authorities, such as the BaFin, may require a systemic risk buffer to prevent and mitigate long-term non-cyclical systemic or macro-prudential risks that are not covered by the CRR. They can require an additional buffer of up to 5.00% CET 1 capital of RWA. Systemic risk buffer applied to Deutsche Bank as of December31, 2024, was 0.22%.
Deutsche Bank continues to be designated as a global systemically important institution (G-SII) by the BaFin in agreement with the Deutsche Bundesbank, resulting in a G-SII buffer requirement of 1.50% CET 1 capital of RWA in 2024 based on the indicators as published in 2020. This assessment has been confirmed by the FSB in 2024. Further, BaFin has announced that the G-SII buffer requirement for Deutsche Bank will remain unchanged for the years 2025 and 2026. Deutsche Bank continues to publish the indicators in the Pillar 3 report on the bank’s website.
Additionally, Deutsche Bank has been classified by BaFin in agreement with the Deutsche Bundesbank as an “other systemically important institution” (O-SII) with an additional capital buffer requirement of 2.00% in 2023 that has to be met on a consolidated level and remain unchanged for 2024 and 2025. The higher of the buffers for systemically important institutions (G-SII buffer or O-SII buffer) must be applied.
Pursuant to the Pillar 2 SREP, the ECB may impose capital requirements on individual banks which are more stringent than statutory requirements (so-called Pillar 2 requirement).
In December 2023, Deutsche Bank was informed by the ECB of its decision regarding prudential minimum capital requirements for 2024 that applied from January 1, 2024 onwards, following the results of the 2023 SREP. The decision set the ECB’s Pillar 2 requirement to 2.65% of RWA, effective January 1, 2024. As of December 31, 2024, Deutsche Bank needs to maintain on a consolidated basis a CET 1 ratio of at least 11.20%, a Tier 1 ratio of at least 13.20%, and a Total Capital ratio of at least 15.86%. The CET 1 requirement comprises the Pillar 1 minimum capital requirement of 4.50%, the Pillar 2 requirement (SREP add-on) of 1.49%, the capital conservation buffer of 2.50%, the countercyclical buffer of 0.49%, and the systemic risk buffer of 0.22% (both subject to change throughout the year) as well as the higher of G-SII/O-SII buffer of 2.00%. Correspondingly, the Tier 1 capital requirement includes additionally a Tier 1 minimum capital requirement of 1.50% plus a Pillar 2 requirement of 0.50%, and the Total Capital requirement includes further a Tier 2 minimum capital requirement of 2.00% and a Pillar 2 requirement of 0.66%. Also, following the results of the 2023 SREP, the ECB communicated to Deutsche Bank an individual expectation to hold a further Pillar 2 CET 1 capital add-on, commonly referred to as the Pillar 2 guidance. The capital add-on pursuant to the Pillar 2 guidance is separate from and in addition to the Pillar 2 requirement. The ECB has stated that it expects banks to meet the Pillar 2 guidance, although it is not legally binding, and failure to meet the Pillar 2 guidance does not lead to automatic restrictions of capital distributions.
On December 13, 2024, Deutsche Bank was informed by the ECB of its decision regarding prudential minimum capital requirements for 2025 that applies from January 1, 2025, onwards, following the results of the 2024 SREP. The decision set ECB’s Pillar 2 requirement to 2.90% of RWA, effective as of January 1, 2025, of which at least 1.63% must be covered by CET 1 capital and 2.18% by Tier 1 capital.
31
|
Deutsche Bank |
||
|
Pillar 3 Report as of December 31, 2024 |
||
Overview total capital requirements and capital buffers
|
|
2024 |
2025 |
||
|
Pillar 1 |
||||
|
Minimum CET 1 requirement |
4.50 % |
4.50 % |
||
|
Combined buffer requirement |
5.21 % |
5.23 % |
||
|
Capital Conservation Buffer |
2.50 % |
2.50 % |
||
|
Countercyclical Buffer¹ |
0.49 % |
0.51 % |
||
|
Systemic Risk Buffer² |
0.22 % |
0.22 % |
||
|
Maximum of: |
2.00 % |
2.00 % |
||
|
G-SII Buffer |
1.50 % |
1.50 % |
||
|
O-SII Buffer |
2.00 % |
2.00 % |
||
|
Pillar 2 |
||||
|
Pillar 2 SREP Add-on of Total capital |
2.65 % |
2.90 % |
||
|
of which covered by CET 1 capital |
1.49 % |
1.63 % |
||
|
of which covered by Tier 1 capital |
1.99 % |
2.18 % |
||
|
of which covered by Tier 2 capital |
0.66 % |
0.72 % |
||
|
Total CET 1 requirement from Pillar 1 and 2³ |
11.20 % |
11.36 % |
||
|
Total Tier 1 requirement from Pillar 1 and 2 |
13.20 % |
13.41 % |
||
|
Total capital requirement from Pillar 1 and 2 |
15.86 % |
16.13 % |
||
1 Deutsche Bank’s countercyclical buffer requirement is subject to country-specific buffer rates decreed by EBA and the Basel Committee of Banking Supervision (BCBS) as well as Deutsche Bank’s relevant credit exposures as per respective reporting date; the countercyclical buffer rate for 2025 has been calculated to be 0.51% based on known countercyclical buffer changes in 2025. The countercyclical buffer is subject to Deutsche Bank portfolio changes and further changes of countercyclical buffer rates throughout the year
2 The Systemic risk buffer rate for 2025 has been calculated to be 0.22% based on known systemic risk buffer changes in 2025. The Systemic risk buffer is subject to Deutsche Bank portfolio changes and further changes in systemic risk buffer rates throughout the year
3 The total Pillar 1 and Pillar 2 CET 1 requirement (excluding the “Pillar 2” guidance) is calculated as the sum of the SREP requirement, the systemic risk buffer requirement, the capital conservation buffer requirement and countercyclical buffer requirement as well as the higher of the G-SII/O-SII requirement
Geographical distribution of credit exposures
Article 440 (a) CRR
The following tables disclose the amount of Deutsche Bank´s countercyclical buffer as well as the geographical distribution of credit exposures relevant for its calculation in the standard format as set out in Commission Delegated Regulation (EU) 2015/1555. The geographical split table shows countries on an individual basis if each country imposes a countercyclical capital buffer rate or the total own funds requirements exceed € 20 million. The values for the remaining countries are shown as “Other”.
Countercyclical capital buffer rates are determined by Basel Committee member jurisdictions. Countercyclical capital buffer varies according to a percentage of risk weighted assets. The “General credit exposures” include only credit exposures to the private sector. Exposures to the public sector and to institutions are not in scope. The “Trading book exposures” contain market risk standardized approach non-securitization and trading book securitization positions as well as the IRC (“Incremental Risk Charge”).
32
|
Deutsche Bank |
||
|
Pillar 3 Report as of December 31, 2024 |
||
EU CCyB1 – Geographical distribution of credit exposures relevant for the calculation of the countercyclical capital buffer
|
|
Dec 31, 2024 |
||||||||||||||||||||||||||
|
a |
b |
c |
d |
e |
f |
g |
h |
i |
j |
k |
l |
m |
|||||||||||||||
|
General credit exposures |
Relevant credit exposures – Market risk |
Securitisation exposures Exposure value for non-trading book |
Total exposure value |
Own funds requirements |
|||||||||||||||||||||||
|
in € m. |
Exposure value |
Exposure value |
Sum of long and |
Value of trading |
Relevant credit risk exposures - Credit risk |
Relevant credit exposures – Market risk |
Relevant credit exposures – Securitisation positions in the non-trading book |
Total |
Risk-weighted exposure amounts |
Own fund requirements weights (%) |
Countercyclical buffer rate (%) |
||||||||||||||||
|
Armenia |
0 |
0 |
0 |
0 |
0 |
0 |
0 |
0 |
0 |
0 |
0 |
0.00 |
1.50 |
||||||||||||||
|
Australia |
143 |
6,075 |
630 |
327 |
3,051 |
10,227 |
201 |
38 |
33 |
271 |
3,387 |
1.24 |
1.00 |
||||||||||||||
|
Austria |
20 |
1,286 |
0 |
72 |
0 |
1,378 |
37 |
2 |
0 |
39 |
488 |
0.18 |
0.00 |
||||||||||||||
|
Bangladesh |
0 |
230 |
0 |
0 |
0 |
230 |
23 |
0 |
0 |
23 |
293 |
0.11 |
0.00 |
||||||||||||||
|
Belgium |
266 |
2,989 |
0 |
503 |
25 |
3,783 |
91 |
10 |
0 |
101 |
1,268 |
0.46 |
1.00 |
||||||||||||||
|
Bermuda |
21 |
2,268 |
0 |
16 |
417 |
2,723 |
88 |
0 |
8 |
96 |
1,201 |
0.44 |
0.00 |
||||||||||||||
|
Brazil |
30 |
1,331 |
0 |
812 |
0 |
2,172 |
64 |
27 |
0 |
92 |
1,149 |
0.42 |
0.00 |
||||||||||||||
|
British Virgin Islands |
48 |
5,254 |
0 |
18 |
0 |
5,320 |
65 |
1 |
0 |
66 |
827 |
0.30 |
0.00 |
||||||||||||||
|
Bulgaria |
0 |
20 |
0 |
12 |
0 |
32 |
1 |
0 |
0 |
1 |
12 |
0.00 |
2.00 |
||||||||||||||
|
Canada |
139 |
3,151 |
0 |
150 |
471 |
3,910 |
89 |
0 |
6 |
94 |
1,179 |
0.43 |
0.00 |
||||||||||||||
|
Cayman Islands |
551 |
14,228 |
2 |
0 |
2,074 |
16,855 |
452 |
1 |
49 |
502 |
6,275 |
2.30 |
0.00 |
||||||||||||||
|
Chile |
54 |
230 |
0 |
0 |
0 |
284 |
13 |
0 |
0 |
13 |
162 |
0.06 |
0.50 |
||||||||||||||
|
China |
60 |
5,007 |
37 |
0 |
0 |
5,103 |
197 |
23 |
0 |
220 |
2,755 |
1.01 |
0.00 |
||||||||||||||
|
Croatia |
1 |
25 |
0 |
7 |
0 |
32 |
1 |
0 |
0 |
1 |
9 |
0.00 |
1.50 |
||||||||||||||
|
Cyprus |
0 |
229 |
0 |
91 |
0 |
321 |
1 |
2 |
0 |
3 |
43 |
0.02 |
1.00 |
||||||||||||||
|
Czech Republic |
35 |
230 |
8 |
11 |
0 |
283 |
8 |
2 |
0 |
9 |
116 |
0.04 |
1.25 |
||||||||||||||
|
Denmark |
12 |
1,767 |
0 |
16 |
0 |
1,795 |
48 |
3 |
0 |
51 |
633 |
0.23 |
2.50 |
||||||||||||||
|
Egypt |
1 |
512 |
0 |
0 |
0 |
512 |
28 |
0 |
0 |
28 |
352 |
0.13 |
0.00 |
||||||||||||||
|
Estonia |
0 |
255 |
0 |
8 |
0 |
264 |
9 |
0 |
0 |
9 |
113 |
0.04 |
1.50 |
||||||||||||||
|
Finland |
4 |
521 |
9 |
784 |
0 |
1,318 |
12 |
13 |
0 |
25 |
317 |
0.12 |
0.00 |
||||||||||||||
|
France |
214 |
8,081 |
175 |
1,681 |
315 |
10,465 |
241 |
61 |
4 |
306 |
3,822 |
1.40 |
1.00 |
||||||||||||||
|
Germany |
8,062 |
256,271 |
45 |
0 |
16,626 |
281,004 |
8,108 |
54 |
275 |
8,437 |
105,465 |
38.64 |
0.75 |
||||||||||||||
|
Guernsey |
69 |
1,058 |
0 |
0 |
0 |
1,127 |
45 |
0 |
0 |
45 |
565 |
0.21 |
0.00 |
||||||||||||||
|
Hong Kong |
60 |
3,541 |
0 |
200 |
0 |
3,800 |
94 |
8 |
0 |
102 |
1,273 |
0.47 |
0.50 |
||||||||||||||
|
Hungary |
1 |
315 |
0 |
0 |
0 |
316 |
13 |
0 |
0 |
13 |
160 |
0.06 |
0.50 |
||||||||||||||
|
Iceland |
2 |
11 |
0 |
29 |
0 |
41 |
1 |
0 |
0 |
1 |
10 |
0.00 |
2.50 |
||||||||||||||
|
India |
3,255 |
7,887 |
0 |
0 |
162 |
11,304 |
800 |
7 |
3 |
811 |
10,134 |
3.71 |
0.00 |
||||||||||||||
|
Indonesia |
1 |
1,347 |
0 |
308 |
0 |
1,656 |
61 |
13 |
0 |
75 |
932 |
0.34 |
0.00 |
||||||||||||||
|
Ireland |
632 |
7,840 |
12 |
194 |
3,159 |
11,837 |
188 |
4 |
91 |
283 |
3,535 |
1.30 |
1.50 |
||||||||||||||
|
Israel |
1 |
540 |
0 |
817 |
0 |
1,358 |
18 |
18 |
0 |
37 |
457 |
0.17 |
0.00 |
||||||||||||||
|
Italy (incl. San Marino) |
2,016 |
24,642 |
75 |
0 |
58 |
26,791 |
1,111 |
28 |
1 |
1,140 |
14,252 |
5.22 |
0.00 |
||||||||||||||
|
Japan |
88 |
2,179 |
0 |
546 |
37 |
2,849 |
107 |
33 |
0 |
141 |
1,758 |
0.64 |
0.00 |
||||||||||||||
|
Jersey |
222 |
2,667 |
0 |
0 |
937 |
3,826 |
114 |
5 |
12 |
131 |
1,639 |
0.60 |
0.00 |
||||||||||||||
|
Latvia |
0 |
84 |
0 |
0 |
0 |
84 |
4 |
0 |
0 |
4 |
46 |
0.02 |
0.50 |
||||||||||||||
|
Lithuania |
0 |
6 |
2 |
0 |
0 |
8 |
0 |
0 |
0 |
0 |
5 |
0.00 |
1.00 |
||||||||||||||
|
Luxembourg |
3,637 |
18,930 |
0 |
27 |
5,614 |
28,208 |
675 |
0 |
74 |
748 |
9,356 |
3.43 |
0.50 |
||||||||||||||
|
Malaysia |
4 |
925 |
1 |
87 |
0 |
1,016 |
32 |
0 |
0 |
32 |
397 |
0.15 |
0.00 |
||||||||||||||
|
Mauritius |
51 |
343 |
0 |
0 |
0 |
394 |
21 |
0 |
0 |
21 |
261 |
0.10 |
0.00 |
||||||||||||||
|
Mexico |
8 |
1,721 |
0 |
0 |
0 |
1,729 |
57 |
0 |
0 |
57 |
715 |
0.26 |
0.00 |
||||||||||||||
33
|
Deutsche Bank |
||
|
Pillar 3 Report as of December 31, 2024 |
||
|
|
Dec 31, 2024 |
||||||||||||||||||||||||||
|
a |
b |
c |
d |
e |
f |
g |
h |
i |
j |
k |
l |
m |
|||||||||||||||
|
General credit exposures |
Relevant credit exposures – Market risk |
Securitisation exposures Exposure value for non-trading book |
Total exposure value |
Own funds requirements |
|||||||||||||||||||||||
|
in € m. |
Exposure value |
Exposure value |
Sum of long and |
Value of trading |
Relevant credit risk exposures - Credit risk |
Relevant credit exposures – Market risk |
Relevant credit exposures – Securitisation positions in the non-trading book |
Total |
Risk-weighted exposure amounts |
Own fund requirements weights (%) |
Countercyclical buffer rate (%) |
||||||||||||||||
|
Netherlands |
426 |
13,166 |
84 |
538 |
199 |
14,414 |
367 |
21 |
5 |
393 |
4,914 |
1.80 |
2.00 |
||||||||||||||
|
New Zealand |
3 |
322 |
0 |
42 |
3 |
370 |
26 |
0 |
1 |
28 |
344 |
0.13 |
0.00 |
||||||||||||||
|
Norway |
14 |
938 |
0 |
215 |
0 |
1,167 |
25 |
2 |
0 |
27 |
344 |
0.13 |
2.50 |
||||||||||||||
|
Philippines |
7 |
920 |
0 |
424 |
0 |
1,351 |
25 |
11 |
0 |
36 |
446 |
0.16 |
0.00 |
||||||||||||||
|
Poland |
39 |
2,022 |
0 |
44 |
0 |
2,106 |
59 |
1 |
0 |
61 |
761 |
0.28 |
0.00 |
||||||||||||||
|
Qatar |
22 |
2,184 |
0 |
0 |
0 |
2,206 |
47 |
0 |
0 |
47 |
588 |
0.22 |
0.00 |
||||||||||||||
|
Romania |
0 |
131 |
0 |
6 |
0 |
137 |
7 |
0 |
0 |
7 |
84 |
0.03 |
1.00 |
||||||||||||||
|
Saudi Arabia |
72 |
772 |
0 |
0 |
0 |
843 |
24 |
2 |
0 |
26 |
322 |
0.12 |
0.00 |
||||||||||||||
|
Singapore |
786 |
6,690 |
6 |
522 |
0 |
8,004 |
228 |
1 |
0 |
229 |
2,867 |
1.05 |
0.00 |
||||||||||||||
|
Slovakia |
1 |
86 |
0 |
0 |
0 |
87 |
1 |
2 |
0 |
3 |
38 |
0.01 |
1.50 |
||||||||||||||
|
Slovenia |
1 |
73 |
0 |
0 |
0 |
74 |
1 |
0 |
0 |
1 |
13 |
0.00 |
0.50 |
||||||||||||||
|
South Korea |
15 |
1,493 |
0 |
0 |
0 |
1,508 |
50 |
23 |
0 |
73 |
906 |
0.33 |
1.00 |
||||||||||||||
|
Spain |
400 |
17,783 |
33 |
498 |
8 |
18,722 |
627 |
15 |
0 |
642 |
8,031 |
2.94 |
0.00 |
||||||||||||||
|
Sweden |
13 |
2,687 |
0 |
0 |
0 |
2,700 |
90 |
4 |
0 |
93 |
1,167 |
0.43 |
2.00 |
||||||||||||||
|
Switzerland |
70 |
7,900 |
0 |
64 |
0 |
8,035 |
180 |
0 |
0 |
180 |
2,245 |
0.82 |
0.00 |
||||||||||||||
|
Taiwan |
50 |
777 |
0 |
56 |
0 |
883 |
29 |
0 |
0 |
29 |
369 |
0.14 |
0.00 |
||||||||||||||
|
Thailand |
4 |
876 |
1 |
254 |
0 |
1,135 |
32 |
11 |
0 |
43 |
540 |
0.20 |
0.00 |
||||||||||||||
|
Tunesia |
23 |
49 |
0 |
17 |
0 |
89 |
5 |
16 |
0 |
22 |
272 |
0.10 |
0.00 |
||||||||||||||
|
Turkey |
20 |
765 |
0 |
0 |
0 |
785 |
24 |
0 |
0 |
24 |
302 |
0.11 |
0.00 |
||||||||||||||
|
Ukraine |
2 |
188 |
0 |
150 |
0 |
340 |
49 |
83 |
0 |
132 |
1,644 |
0.60 |
0.00 |
||||||||||||||
|
United Arab Emirates |
22 |
2,789 |
0 |
0 |
0 |
2,811 |
49 |
0 |
0 |
49 |
614 |
0.22 |
0.00 |
||||||||||||||
|
United Kingdom |
1,135 |
22,269 |
0 |
1,409 |
1,447 |
26,260 |
745 |
28 |
24 |
797 |
9,964 |
3.65 |
2.00 |
||||||||||||||
|
United States of America |
1,884 |
133,491 |
1,171 |
0 |
50,672 |
187,217 |
3,445 |
207 |
654 |
4,306 |
53,822 |
19.72 |
0.00 |
||||||||||||||
|
Uzbekistan |
0 |
896 |
0 |
0 |
0 |
896 |
44 |
0 |
0 |
44 |
554 |
0.20 |
0.00 |
||||||||||||||
|
Vietnam |
6 |
653 |
0 |
12 |
0 |
671 |
38 |
0 |
0 |
38 |
478 |
0.18 |
0.00 |
||||||||||||||
|
Other |
766 |
10,549 |
350 |
746 |
3,759 |
16,170 |
383 |
52 |
38 |
474 |
5,919 |
2.17 |
0.00 |
||||||||||||||
|
Total |
25,486 |
614,463 |
2,641 |
11,713 |
89,035 |
743,339 |
19,719 |
836 |
1,278 |
21,833 |
272,911 |
100.00 |
0.49 |
||||||||||||||
34
|
Deutsche Bank |
||
|
Pillar 3 Report as of December 31, 2024 |
||
|
|
Jun 30, 2024 |
||||||||||||||||||||||||||
|
a |
b |
c |
d |
e |
f |
g |
h |
i |
j |
k |
l |
m |
|||||||||||||||
|
General credit exposures |
Relevant credit exposures – Market risk |
Securitisation exposures Exposure value for non-trading book |
Total exposure value |
Own funds requirements |
|||||||||||||||||||||||
|
in € m. |
Exposure value |
Exposure value |
Sum of long and |
Value of trading |
Relevant credit risk exposures - Credit risk |
Relevant credit exposures – Market risk |
Relevant credit exposures – Securitisation positions in the non-trading book |
Total |
Risk-weighted exposure amounts |
Own fund requirements weights (%) |
Countercyclical buffer rate (%) |
||||||||||||||||
|
Angola |
0 |
299 |
0 |
0 |
0 |
299 |
23 |
0 |
0 |
23 |
285 |
0.11 |
0.00 |
||||||||||||||
|
Armenia |
0 |
3 |
0 |
0 |
0 |
3 |
0 |
0 |
0 |
0 |
1 |
0.00 |
1.50 |
||||||||||||||
|
Australia |
170 |
5,349 |
486 |
647 |
2,820 |
9,472 |
189 |
29 |
34 |
252 |
3,152 |
1.18 |
1.00 |
||||||||||||||
|
Austria |
1 |
1,242 |
0 |
0 |
0 |
1,243 |
33 |
0 |
0 |
33 |
417 |
0.16 |
0.00 |
||||||||||||||
|
Bangladesh |
0 |
182 |
0 |
0 |
0 |
182 |
24 |
0 |
0 |
24 |
299 |
0.11 |
0.00 |
||||||||||||||
|
Belgium |
84 |
3,538 |
0 |
0 |
25 |
3,646 |
74 |
5 |
0 |
80 |
994 |
0.37 |
0.50 |
||||||||||||||
|
Benin |
0 |
328 |
0 |
0 |
0 |
329 |
21 |
0 |
0 |
21 |
267 |
0.10 |
0.00 |
||||||||||||||
|
Bermuda |
15 |
1,581 |
0 |
0 |
404 |
2,000 |
66 |
0 |
6 |
73 |
910 |
0.34 |
0.00 |
||||||||||||||
|
Brazil |
11 |
1,403 |
0 |
455 |
0 |
1,869 |
66 |
31 |
0 |
97 |
1,209 |
0.45 |
0.00 |
||||||||||||||
|
British Virgin Islands |
5 |
3,798 |
0 |
0 |
0 |
3,803 |
46 |
0 |
0 |
46 |
574 |
0.21 |
0.00 |
||||||||||||||
|
Bulgaria |
0 |
22 |
0 |
0 |
0 |
22 |
1 |
0 |
0 |
1 |
8 |
0.00 |
2.00 |
||||||||||||||
|
Canada |
71 |
2,729 |
0 |
162 |
448 |
3,409 |
84 |
0 |
5 |
90 |
1,121 |
0.42 |
0.00 |
||||||||||||||
|
Cayman Islands |
247 |
9,692 |
0 |
4 |
45 |
9,989 |
312 |
0 |
18 |
330 |
4,120 |
1.54 |
0.00 |
||||||||||||||
|
Chile |
57 |
158 |
0 |
0 |
0 |
215 |
16 |
1 |
0 |
17 |
207 |
0.08 |
0.50 |
||||||||||||||
|
China |
36 |
4,880 |
4 |
1,754 |
0 |
6,674 |
233 |
75 |
0 |
307 |
3,842 |
1.43 |
0.00 |
||||||||||||||
|
Colombia |
10 |
556 |
0 |
0 |
0 |
566 |
36 |
6 |
0 |
42 |
525 |
0.20 |
0.00 |
||||||||||||||
|
Croatia |
2 |
22 |
0 |
0 |
0 |
23 |
1 |
0 |
0 |
1 |
9 |
0.00 |
1.50 |
||||||||||||||
|
Cyprus |
4 |
668 |
0 |
61 |
0 |
734 |
3 |
1 |
0 |
4 |
48 |
0.02 |
1.00 |
||||||||||||||
|
Czech Republic |
5 |
271 |
0 |
11 |
0 |
286 |
8 |
0 |
0 |
8 |
102 |
0.04 |
2.00 |
||||||||||||||
|
Denmark |
20 |
1,645 |
0 |
129 |
0 |
1,794 |
47 |
10 |
0 |
57 |
717 |
0.27 |
2.50 |
||||||||||||||
|
Egypt |
0 |
551 |
0 |
80 |
0 |
631 |
27 |
10 |
0 |
37 |
463 |
0.17 |
0.00 |
||||||||||||||
|
Estonia |
0 |
272 |
0 |
0 |
0 |
272 |
10 |
0 |
0 |
10 |
130 |
0.05 |
1.50 |
||||||||||||||
|
Finland |
0 |
495 |
3 |
637 |
0 |
1,136 |
17 |
16 |
0 |
33 |
412 |
0.15 |
0.00 |
||||||||||||||
|
France |
120 |
8,188 |
193 |
1,375 |
387 |
10,263 |
260 |
42 |
4 |
306 |
3,829 |
1.43 |
1.00 |
||||||||||||||
|
Germany |
8,511 |
260,636 |
37 |
243 |
28,570 |
297,997 |
7,944 |
68 |
375 |
8,386 |
104,826 |
39.09 |
0.75 |
||||||||||||||
|
Guernsey |
27 |
1,080 |
0 |
12 |
0 |
1,119 |
22 |
1 |
0 |
23 |
291 |
0.11 |
0.00 |
||||||||||||||
|
Hong Kong |
57 |
3,362 |
0 |
174 |
0 |
3,594 |
83 |
6 |
0 |
90 |
1,122 |
0.42 |
1.00 |
||||||||||||||
|
Iceland |
2 |
9 |
0 |
28 |
0 |
39 |
1 |
0 |
0 |
1 |
11 |
0.00 |
2.50 |
||||||||||||||
|
India |
3,087 |
7,845 |
0 |
0 |
37 |
10,970 |
700 |
21 |
0 |
722 |
9,025 |
3.37 |
0.00 |
||||||||||||||
|
Indonesia |
8 |
1,126 |
1 |
285 |
0 |
1,420 |
49 |
20 |
0 |
69 |
858 |
0.32 |
0.00 |
||||||||||||||
|
Ireland |
398 |
8,100 |
40 |
113 |
3,792 |
12,444 |
146 |
7 |
99 |
252 |
3,144 |
1.17 |
1.50 |
||||||||||||||
|
Israel |
6 |
498 |
0 |
255 |
0 |
759 |
18 |
2 |
0 |
20 |
254 |
0.09 |
0.00 |
||||||||||||||
|
Italy (incl. San Marino) |
1,554 |
23,765 |
44 |
535 |
115 |
26,013 |
1,209 |
68 |
4 |
1,281 |
16,011 |
5.97 |
0.00 |
||||||||||||||
|
Ivory Coast |
0 |
500 |
0 |
41 |
0 |
541 |
32 |
0 |
0 |
32 |
398 |
0.15 |
0.00 |
||||||||||||||
|
Japan |
78 |
2,348 |
0 |
553 |
25 |
3,003 |
108 |
21 |
0 |
130 |
1,619 |
0.60 |
0.00 |
||||||||||||||
|
Jersey |
219 |
2,538 |
0 |
0 |
798 |
3,556 |
117 |
0 |
10 |
127 |
1,582 |
0.59 |
0.00 |
||||||||||||||
|
Lithuania |
0 |
7 |
2 |
0 |
0 |
9 |
1 |
0 |
0 |
1 |
10 |
0.00 |
1.00 |
||||||||||||||
|
Luxembourg |
2,912 |
17,704 |
0 |
130 |
6,110 |
26,856 |
531 |
0 |
82 |
613 |
7,659 |
2.86 |
0.50 |
||||||||||||||
|
Malaysia |
10 |
579 |
0 |
402 |
0 |
991 |
20 |
5 |
0 |
25 |
309 |
0.12 |
0.00 |
||||||||||||||
|
Mauritius |
95 |
471 |
0 |
3 |
0 |
569 |
34 |
0 |
0 |
34 |
428 |
0.16 |
0.00 |
||||||||||||||
35
|
Deutsche Bank |
||
|
Pillar 3 Report as of December 31, 2024 |
||
|
|
Jun 30, 2024 |
||||||||||||||||||||||||||
|
a |
b |
c |
d |
e |
f |
g |
h |
i |
j |
k |
l |
m |
|||||||||||||||
|
General credit exposures |
Relevant credit exposures – Market risk |
Securitisation exposures Exposure value for non-trading book |
Total exposure value |
Own funds requirements |
|||||||||||||||||||||||
|
in € m. |
Exposure value |
Exposure value |
Sum of long and |
Value of trading |
Relevant credit risk exposures - Credit risk |
Relevant credit exposures – Market risk |
Relevant credit exposures – Securitisation positions in the non-trading book |
Total |
Risk-weighted exposure amounts |
Own fund requirements weights (%) |
Countercyclical buffer rate (%) |
||||||||||||||||
|
Mexico |
12 |
1,211 |
0 |
0 |
0 |
1,223 |
50 |
0 |
0 |
50 |
627 |
0.23 |
0.00 |
||||||||||||||
|
Netherlands |
1,161 |
13,622 |
66 |
661 |
266 |
15,776 |
439 |
16 |
5 |
460 |
5,752 |
2.15 |
2.00 |
||||||||||||||
|
Norway |
15 |
921 |
0 |
210 |
0 |
1,146 |
25 |
3 |
0 |
28 |
352 |
0.13 |
2.50 |
||||||||||||||
|
Poland |
4 |
2,067 |
0 |
103 |
0 |
2,173 |
49 |
2 |
0 |
50 |
628 |
0.23 |
0.00 |
||||||||||||||
|
Portugal |
5 |
550 |
13 |
290 |
9 |
868 |
14 |
12 |
0 |
26 |
325 |
0.12 |
0.00 |
||||||||||||||
|
Qatar |
37 |
2,192 |
0 |
0 |
0 |
2,229 |
53 |
0 |
0 |
53 |
667 |
0.25 |
0.00 |
||||||||||||||
|
Romania |
28 |
60 |
0 |
24 |
0 |
111 |
4 |
0 |
0 |
5 |
61 |
0.02 |
1.00 |
||||||||||||||
|
Saudi Arabia |
32 |
3,381 |
0 |
0 |
0 |
3,413 |
30 |
0 |
0 |
30 |
379 |
0.14 |
0.00 |
||||||||||||||
|
Singapore |
400 |
5,527 |
253 |
431 |
0 |
6,610 |
190 |
6 |
0 |
196 |
2,449 |
0.91 |
0.00 |
||||||||||||||
|
Slovakia |
0 |
105 |
0 |
0 |
0 |
106 |
2 |
0 |
0 |
2 |
29 |
0.01 |
1.50 |
||||||||||||||
|
Slovenia |
1 |
59 |
0 |
0 |
0 |
60 |
1 |
0 |
0 |
1 |
13 |
0.00 |
0.50 |
||||||||||||||
|
South Africa |
7 |
499 |
0 |
0 |
0 |
506 |
20 |
0 |
0 |
20 |
254 |
0.09 |
0.00 |
||||||||||||||
|
South Korea |
13 |
2,589 |
0 |
0 |
0 |
2,602 |
47 |
12 |
0 |
58 |
731 |
0.27 |
1.00 |
||||||||||||||
|
Spain |
283 |
17,219 |
27 |
232 |
6 |
17,768 |
627 |
5 |
0 |
632 |
7,894 |
2.94 |
0.00 |
||||||||||||||
|
Sri Lanka |
1 |
206 |
0 |
66 |
0 |
272 |
9 |
14 |
0 |
23 |
285 |
0.11 |
0.00 |
||||||||||||||
|
Sweden |
14 |
2,271 |
0 |
104 |
0 |
2,389 |
72 |
1 |
0 |
74 |
924 |
0.34 |
2.00 |
||||||||||||||
|
Switzerland |
99 |
11,775 |
0 |
286 |
0 |
12,161 |
228 |
0 |
0 |
228 |
2,844 |
1.06 |
0.00 |
||||||||||||||
|
Taiwan |
15 |
790 |
0 |
69 |
0 |
874 |
24 |
0 |
0 |
24 |
303 |
0.11 |
0.00 |
||||||||||||||
|
Thailand |
0 |
734 |
0 |
195 |
0 |
929 |
32 |
7 |
0 |
39 |
484 |
0.18 |
0.00 |
||||||||||||||
|
Turkey |
62 |
933 |
0 |
0 |
0 |
995 |
41 |
6 |
0 |
47 |
590 |
0.22 |
0.00 |
||||||||||||||
|
Ukraine |
2 |
171 |
0 |
118 |
0 |
291 |
38 |
20 |
0 |
58 |
720 |
0.27 |
0.00 |
||||||||||||||
|
United Arab Emirates |
25 |
2,717 |
0 |
0 |
0 |
2,741 |
45 |
0 |
0 |
45 |
557 |
0.21 |
0.00 |
||||||||||||||
|
United Kingdom |
477 |
26,973 |
64 |
967 |
1,627 |
30,108 |
789 |
19 |
32 |
840 |
10,495 |
3.91 |
2.00 |
||||||||||||||
|
United Republic of Tanzania |
1 |
372 |
0 |
0 |
0 |
372 |
24 |
0 |
0 |
24 |
296 |
0.11 |
0.00 |
||||||||||||||
|
United States of America |
1,898 |
134,335 |
1,240 |
0 |
35,991 |
173,464 |
3,581 |
266 |
472 |
4,319 |
53,986 |
20.13 |
0.00 |
||||||||||||||
|
Uzbekistan |
0 |
1,049 |
0 |
0 |
0 |
1,049 |
52 |
0 |
0 |
52 |
646 |
0.24 |
0.00 |
||||||||||||||
|
Vietnam |
7 |
617 |
0 |
16 |
0 |
640 |
36 |
1 |
0 |
37 |
462 |
0.17 |
0.00 |
||||||||||||||
|
Other |
95 |
8,126 |
280 |
985 |
167 |
9,653 |
267 |
66 |
3 |
336 |
4,204 |
1.57 |
0.00 |
||||||||||||||
|
Total |
22,521 |
619,508 |
2,753 |
12,845 |
81,643 |
739,270 |
19,399 |
902 |
1,150 |
21,451 |
268,142 |
100.00 |
0.50 |
||||||||||||||
36
|
Deutsche Bank |
||
|
Pillar 3 Report as of December 31, 2024 |
||
Institution specific countercyclical capital buffer
Article 440 (b) CRR
The following table shows an overview of Deutsche Bank´s countercyclical buffer rate and requirements.
EU CCyB2 – Institution-specific countercyclical capital buffer
|
|
Dec 31, 2024 |
Jun 30, 2024 |
||||
|
a |
a |
|||||
|
1 |
Total risk exposure amount (in € m.) |
357,427 |
356,427 |
|||
|
2 |
Institution specific countercyclical buffer rate |
0.49 % |
0.50 % |
|||
|
3 |
Institution specific countercyclical buffer requirement (in € m.) |
1,760 |
1,784 |
|||
Indicators of global systemic importance
Article 441 CRR
Global systemic importance is measured in terms of the impact an institution's failure might have on the global financial system and the wider economy, rather than the risk that a failure could actually occur. The measurement approach of the global systemic importance is indicator-based, with the indicators reflecting size, interconnectedness, substitutability, or financial institution infrastructure for the services provided, as well as complexity and global (cross-jurisdictional) activity.
EBA issued revised guidelines on the specification of the indicators of global systemic importance and how they determine the score of G-SII’s under Article 441 CRR as published in the Commission Implementing Regulation (EU) 2016/818 amending Implementing Regulation (EU) No 1030/2014. This regulation sets forth implementing technical standards regarding the uniform formats and date for the disclosure of the values used to identify global systemically important institutions according to Regulation (EU) No 575/2013 of the European Parliament and of the Council. Moreover, the Commission Delegated Regulation (EU) 2016/1608 as well as the EBA Guideline “EBA/RTS/2020/08” amended Delegated Regulation (EU) No 1222/2014 regarding regulatory technical standards for the specification of the methodology for the identification of global systemically important institutions and for the definition of subcategories of global systemically important institutions. Further specifications are laid down in the Instructions for year end 2024 G-SIB assessment, as published by the BCBS on January 23, 2025.
It falls under the aegis of the Financial Stability Board (FSB) and is intended to develop a methodology comprising both quantitative and qualitative indicators that can contribute to the assessment of the systemic importance of financial institutions at a global level.
The systemic importance of banks is assessed by the FSB in a global context. In the European Union, national competent authorities are responsible for identifying G-SIIs. In Germany, the BaFin is responsible for this assessment as prescribed by the German Banking Act.
Deutsche Bank continues to be designated as a G-SII by the BaFin in agreement with the Deutsche Bundesbank, resulting in a G-SII buffer requirement of 1.50% CET 1 capital of RWA in the year 2024 based on the indicators as published in 2022. This assessment has been confirmed by the FSB in 2023 and 2024.
The disclosure as of December 31, 2023 provided below show indicators used for determining the score of the institutions which are calculated based on the aforementioned specific instructions and thus are not directly comparable to other disclosed information. The EBA respectively the BCBS instructions are based on the regulatory, not the IFRS accounting consolidated Group. Further, calculation methods as per EBA’s/BCBS’ instructions may lead to further deviations from other disclosures.
The template below shows the final G-SIB 2023 submission to the regulator post their industry wide review process that was carried out during the second quarter of 2024 and based on the initial publication of the G-SIB template. Indicator data for the G-SII assessment reporting template as of December 31, 2024, will be shown in an update to this Pillar 3 report to be provided with the regulatory submission in April 2025.
37
|
Deutsche Bank |
||
|
Pillar 3 Report as of December 31, 2024 |
||
G-SIB Assessment Exercise reporting template
|
|
in € m. (unless stated otherwise) |
G-SIB |
Dec 31, 2023 |
|||
|
General Bank Data |
||||||
|
Section 1 - General information |
||||||
|
a. General information provided by the relevant supervisory authority: |
||||||
|
(1) Country code |
1001 |
DE |
||||
|
(2) Bank name |
1002 |
Deutsche Bank AG |
||||
|
(3) Reporting date (yyyy-mm-dd) |
1003 |
2023-12-31 |
||||
|
(4) Reporting currency |
1004 |
EUR |
||||
|
(5) Euro conversion rate |
1005 |
1 |
||||
|
(6) Submission date (yyyy-mm-dd) |
1006 |
2024-07-16 |
||||
|
b. General Information provided by the reporting institution: |
||||||
|
(1) Reporting unit |
1007 |
1,000,000 |
||||
|
(2) Accounting standard |
1008 |
IFRS |
||||
|
(3) Date of public disclosure (yyyy-mm-dd) |
1009 |
2024-07-18 |
||||
|
(4) Language of public disclosure |
1010 |
English |
||||
|
(5) Web address of public disclosure |
1011 |
https://www.db.com/ir/en/regulatory-reporting.htm |
||||
|
(6) LEI code |
2015 |
7LTWFZYICNSX8D621K86 |
||||
|
Size Indicator |
||||||
|
Section 2 - Total exposures |
||||||
|
a. Derivatives |
||||||
|
(1) Counterparty exposure of derivatives contracts |
1012 |
37,248 |
||||
|
(2) Capped notional amount of credit derivatives |
1201 |
21,449 |
||||
|
(3) Potential future exposure of derivative contracts |
1018 |
72,247 |
||||
|
b. Securities financing transactions (SFTs) |
||||||
|
(1) Adjusted gross value of SFTs |
1013 |
93,196 |
||||
|
(2) Counterparty exposure of SFTs |
1014 |
5,983 |
||||
|
c. Other assets |
1015 |
894,430 |
||||
|
d. Gross notional amount of off-balance sheet items |
||||||
|
(1) Items subject to a 0% credit conversion factor (CCF) |
N/A |
|||||
|
(1) Items subject to a 10% credit conversion factor (CCF) |
1019 |
94,927 |
||||
|
(2) Items subject to a 20% CCF |
1022 |
92,924 |
||||
|
(3) Items subject to a 40% CCF |
2300 |
0 |
||||
|
(3) Items subject to a 50% CCF |
1023 |
184,655 |
||||
|
(4) Items subject to a 100% CCF |
1024 |
9,311 |
||||
|
e. Regulatory adjustments |
1031 |
13,951 |
||||
|
f. Total exposures prior to regulatory adjustments (sum of items 2.a.(1) thorough 2.c, 0.1 times 2.d.(1), 0.2 times 2.d.(2), 0.5 times 2.d.(3), and 2.d.(4)) |
1103 |
1,254,269 |
||||
|
g. Exposures of insurance subsidiaries not included in 2.f net of intragroup: |
||||||
|
(1) On-balance sheet and off-balance sheet insurance assets |
1701 |
856 |
||||
|
(2) Potential future exposure of derivatives contracts for insurance subsidiaries |
1205 |
0 |
||||
|
(3) Investment value in consolidated entities |
1208 |
282 |
||||
|
h. Intragroup exposures with insurance subsidiaries reported in 2.g that are included in 2.f |
2101 |
4 |
||||
|
i. Total exposures indicator, including insurance subsidiaries (sum of items 2.f, 2.g.(1) thorough 2.g.(2) minus 2.g.(3) thorough 2.h) |
1117 |
1,254,839 |
||||
|
Interconnectedness Indicators |
||||||
|
Section 3 - Intra-Financial System Assets |
||||||
|
a. Funds deposited with or lent to other financial institutions |
1216 |
52,583 |
||||
|
(1) Certificates of deposit |
2102 |
2 |
||||
|
b. Unused portion of committed lines extended to other financial institutions |
1217 |
23,950 |
||||
|
c. Holdings of securities issued by other financial institutions |
||||||
|
(1) Secured debt securities |
2103 |
955 |
||||
|
(2) Senior unsecured debt securities |
2104 |
16,710 |
||||
|
(3) Subordinated debt securities |
2105 |
539 |
||||
|
(4) Commercial paper |
2106 |
0 |
||||
|
(5) Equity securities |
2107 |
3,638 |
||||
|
(6) Offsetting short positions in relation to the specific equity securities included in item 3.c.(5) |
2108 |
0 |
||||
|
d. Net positive current exposure of SFTs with other financial institutions |
1219 |
10,261 |
||||
|
e. OTC derivatives with other financial institutions that have a net positive fair value |
||||||
|
(1) Net positive fair value |
2109 |
6,879 |
||||
|
(2) Potential future exposure |
2110 |
25,262 |
||||
|
f. Intra-financial system assets indicator, including insurance subsidiaries (sum of items 3.a, 3.b through 3.c.(5), 3.d, 3.e.(1), and 3.e.(2), minus 3.c.(6)) |
1215 |
140,777 |
||||
38
|
Deutsche Bank |
||
|
Pillar 3 Report as of December 31, 2024 |
||
|
|
in € m. (unless stated otherwise) |
G-SIB |
Dec 31, 2023 |
|||
|
Section 4 - Intra-Financial System Liabilities |
||||||
|
a. Funds deposited by or borrowed from other financial institutions |
||||||
|
(1) Deposits due to depository institutions |
2111 |
26,560 |
||||
|
(2) Deposits due to non-depository financial institutions |
2112 |
54,643 |
||||
|
(3) Loans obtained from other financial institutions |
2113 |
0 |
||||
|
b. Unused portion of committed lines obtained from other financial institutions |
1223 |
0 |
||||
|
c. Net negative current exposure of SFTs with other financial institutions |
1224 |
21,252 |
||||
|
d. OTC derivatives with other financial institutions that have a net negative fair value |
||||||
|
(1) Net negative fair value |
2114 |
6,248 |
||||
|
(2) Potential future exposure |
2115 |
23,501 |
||||
|
e. Intra-financial system liabilities indicator, including insurance subsidiaries (sum of items 4.a.(1) through 4.d.(2)) |
1221 |
132,204 |
||||
|
Section 5 - Securities Outstanding |
||||||
|
a. Secured debt securities |
2116 |
18,000 |
||||
|
b. Senior unsecured debt securities |
2117 |
74,128 |
||||
|
c. Subordinated debt securities |
2118 |
11,452 |
||||
|
d. Commercial paper |
2119 |
5,497 |
||||
|
e. Certificates of deposit |
2120 |
4,246 |
||||
|
f. Common equity |
2121 |
24,622 |
||||
|
g. Preferred shares and any other forms of subordinated funding not captured in item 5.c. |
2122 |
8,569 |
||||
|
h. Securities outstanding indicator, including the securities issued by insurance subsidiaries (sum of items 5.a through 5.g) |
1226 |
146,514 |
||||
|
Substitutability/Financial Institution Infrastructure Indicators |
||||||
|
Section 6 - Payments made in the reporting year (excluding intragroup payments) |
||||||
|
a. Australian dollars (AUD) |
1061 |
129,153 |
||||
|
b. Canadian dollars (CAD) |
1063 |
398,565 |
||||
|
c. Swiss francs (CHF) |
1064 |
222,033 |
||||
|
d. Chinese yuan (CNY) |
1065 |
1,786,752 |
||||
|
e. Euros (EUR) |
1066 |
35,393,982 |
||||
|
f. British pounds (GBP) |
1067 |
2,926,824 |
||||
|
g. Hong Kong dollars (HKD) |
1068 |
187,198 |
||||
|
h. Indian rupee (INR) |
1069 |
537,010 |
||||
|
i. Japanese yen (JPY) |
1070 |
710,614 |
||||
|
j. New Zealand dollars (NZD) |
1109 |
N/A |
||||
|
k. Swedish krona (SEK) |
1071 |
43,980 |
||||
|
k. Singapore dollar (SGD) |
2133 |
139,816 |
||||
|
l. United States dollars (USD) |
1072 |
83,867,963 |
||||
|
m. Payments activity indicator (sum of items 6.a through 6.l) |
1073 |
126,343,889 |
||||
|
Section 7 - Assets Under Custody |
||||||
|
a. Assets under custody indicator |
1074 |
3,031,231 |
||||
|
Section 8 - Underwritten Transactions in Debt and Equity Markets |
||||||
|
a. Equity underwriting activity |
1075 |
5,729 |
||||
|
b. Debt underwriting activity |
1076 |
180,673 |
||||
|
c. Underwriting activity indicator (sum of items 8.a and 8.b) |
1077 |
186,402 |
||||
|
Section 9 - Trading Volume |
||||||
|
a. Trading volume of securities issued by other public sector entities, excluding intragroup transactions |
2123 |
1,982,215 |
||||
|
b. Trading volume of other fixed income securities, excluding intragroup transactions |
2124 |
440,390 |
||||
|
c. Trading volume fixed income sub-indicator (sum of items 9.a and 9.b) |
2125 |
2,422,605 |
||||
|
d. Trading volume of listed equities, excluding intragroup transactions |
2126 |
402,979 |
||||
|
e. Trading volume of all other securities, excluding intragroup transactions |
2127 |
391 |
||||
|
f. Trading volume equities and other securities sub-indicator (sum of items 9.d and 9.e) |
2128 |
403,370 |
||||
|
Complexity indicators |
||||||
|
Section 10 - Notional Amount of Over-the-Counter (OTC) Derivatives |
||||||
|
a. OTC derivatives cleared through a central counterparty |
2129 |
28,110,638 |
||||
|
b. OTC derivatives settled bilaterally |
1905 |
13,987,741 |
||||
|
c. Notional amount of over-the-counter (OTC) derivatives indicator, including insurance subsidiaries (sum of items 10.a and 10.b) |
1227 |
42,098,379 |
||||
|
Section 11 - Trading and Available-for-Sale Securities |
||||||
|
a. Held-for-trading securities (HFT) |
1081 |
139,615 |
||||
|
b. Available-for-sale securities (AFS) |
1082 |
28,690 |
||||
|
c. Trading and AFS securities that meet the definition of Level 1 assets |
1083 |
110,247 |
||||
|
d. Trading and AFS securities that meet the definition of Level 2 assets, with haircuts |
1084 |
15,436 |
||||
|
e. Trading and AFS securities indicator (sum of items 11.a and 11.b, minus the sum of 11.c and 11.d) |
1085 |
42,621 |
||||
|
Section 12 - Level 3 Assets |
||||||
|
a. Level 3 assets indicator, including insurance subsidiaries |
1229 |
24,900 |
||||
39
|
Deutsche Bank |
||
|
Pillar 3 Report as of December 31, 2024 |
||
|
|
in € m. (unless stated otherwise) |
G-SIB |
Dec 31, 2023 |
|||
|
Cross-Jurisdictional Activity Indicators |
||||||
|
Section 13 - Cross-Jurisdictional Claims |
||||||
|
a. Total foreign claims on an ultimate risk basis |
1087 |
663,290 |
||||
|
b. Foreign derivative claims on an ultimate risk basis |
1146 |
244,693 |
||||
|
c. Cross-jurisdictional claims indicator (sum of items 13.a and 13.b) |
2130 |
907,983 |
||||
|
Section 14 - Cross-Jurisdictional Liabilities |
||||||
|
a. Foreign liabilities on an immediate risk basis, excluding derivatives and including local liabilities in local currency |
2131 |
444,997 |
||||
|
b. Foreign derivative liabilities on an immediate risk basis |
1149 |
229,039 |
||||
|
c. Cross-jurisdictional liabilities indicator (sum of items 14.a and 14.b) |
1148 |
674,036 |
||||
|
Memorandum Items |
||||||
|
Section 21 - Cross-Jurisdictional Activity Items |
||||||
|
d. Total foreign claims on an ultimate risk basis (considering SRM as a single jurisdiction) |
1280 |
464,996 |
||||
|
e. Foreign derivatives claims on an ultimate risk basis (considering SRM as a single jurisdiction) |
1281 |
191,647 |
||||
|
f. Foreign liabilities on an immediate risk basis, including derivatives (considering SRM as a single jurisdiction) |
1282 |
531,190 |
||||
Composition of own funds and eligible liabilities
Article 437a CRR and Article 45i(3)(b) BRRD
This section provides detailed information on the composition of Deutsche Bank’s own funds and eligible liabilities, its main features, its ranking in the creditor hierarchy and its maturities.
As of December 31, 2024 the Group’s available own funds and eligible liabilities amounted to € 133.9 billion, consisting of € 68.5 billion own funds, € 50.0 billion subordinated liabilities and € 15.4 billion non-subordinated liabilities. The Group’s regulatory CET1 capital included in the own funds currently contains no impact from the IFRS 9 transitional impact.
Deutsche Bank predominantly relies on own funds and subordinated eligible liabilities counting towards TLAC and subordinated MREL for meeting its MREL requirement, while 11.49% of the Group’s MREL capacity is contributed from eligible liabilities which are not subordinated. Deutsche Bank has no permission as per CRR Article 72b (3) or (4) to use non-subordinated eligible liabilities for meeting subordinated MREL or TLAC.
As of December 31, 2024, Deutsche Bank has excess of CET 1 capital of 7.85% of TREA after meeting the resolution group’s requirements. This is well above the institution specific combined buffer requirement of 5.21% and establishes a comfortable distance to triggering distribution restrictions under the MREL Maximum Distributable Amount (M-MDA) rules.
40
|
Deutsche Bank |
||
|
Pillar 3 Report as of December 31, 2024 |
||
EU TLAC1 – Composition of MREL and G-SII requirement for own funds end eligible liabilities
|
|
Dec 31, 2024 |
|||||||
|
a |
b |
c |
||||||
|
in € m. |
Minimum requirement for own funds and eligible liabilities (MREL) |
G-SII Requirement for own funds and eligible liabilities (TLAC) |
Memo item: Amounts eligible for the purposes of MREL, but not TLAC |
|||||
|
Own funds and eligible liabilities and adjustments |
||||||||
|
1 |
Common Equity Tier 1 capital (CET1) |
49,457 |
49,457 |
− |
||||
|
2 |
Additional Tier 1 capital (AT1) |
11,378 |
11,378 |
− |
||||
|
6 |
Tier 2 capital (T2) |
7,676 |
7,676 |
− |
||||
|
11 |
Own funds for the purpose of Articles 92a CRR and 45 BRRD |
68,511 |
68,511 |
− |
||||
|
Own funds and eligible liabilities: Non-regulatory capital elements |
||||||||
|
12 |
Eligible liabilities instruments issued directly by the resolution entity that are subordinated to excluded liabilities (not grandfathered) |
38,420 |
38,420 |
− |
||||
|
EU 12a |
Eligible liabilities instruments issued by other entities within the resolution group that are subordinated to excluded liabilities (not grandfathered) |
0 |
0 |
− |
||||
|
EU 12b |
Eligible liabilities instruments that are subordinated to excluded liabilities, issued prior to 27 June 2019 (subordinated grandfathered) |
12,811 |
12,811 |
− |
||||
|
EU 12c |
Tier 2 instruments with a residual maturity of at least one year to the extent they do not qualify as Tier 2 items |
628 |
628 |
− |
||||
|
13 |
Eligible liabilities that are not subordinated to excluded liabilities (not grandfathered pre cap) |
13,676 |
− |
13,676 |
||||
|
EU 13a |
Eligible liabilities that are not subordinated to excluded liabilities issued prior to 27 June 2019 (pre-cap) |
1,704 |
− |
1,704 |
||||
|
14 |
Amount of non subordinated instruments eligible, where applicable after application of Article 72b (3) CRR |
− |
− |
− |
||||
|
17 |
Eligible liabilities items before adjustments |
67,239 |
51,859 |
15,380 |
||||
|
of which: |
||||||||
|
EU 17a |
subordinated |
51,859 |
− |
− |
||||
|
Own funds and eligible liabilities: Adjustments to non-regulatory capital elements |
||||||||
|
18 |
Own funds and eligible liabilities items before adjustments |
135,751 |
120,371 |
15,380 |
||||
|
19 |
(Deduction of exposures between MPE resolution groups) |
– |
− |
– |
||||
|
20 |
(Deduction of investments in other eligible liabilities instruments) |
(1,879) |
(1,879) |
– |
||||
|
22 |
Own funds and eligible liabilities after adjustments |
133,871 |
118,491 |
15,380 |
||||
|
of which: |
||||||||
|
EU 22a |
Own funds and subordinated |
118,491 |
− |
− |
||||
|
Risk-weighted exposure amount and leverage exposure measure of the resolution group |
||||||||
|
23 |
Total risk exposure amount |
357,427 |
357,427 |
− |
||||
|
24 |
Total exposure measure |
1,315,906 |
1,315,906 |
− |
||||
|
Ratio of own funds and eligible liabilities |
||||||||
|
25 |
Own funds and eligible liabilities (as a percentage of total risk exposure amount) |
37.45 |
33.15 |
− |
||||
|
of which: |
||||||||
|
EU 25a |
Own funds and subordinated |
33.15 |
– |
– |
||||
|
26 |
Own funds and eligible liabilities (as a percentage of total exposure measure) |
10.17 |
9.00 |
− |
||||
|
of which: |
||||||||
|
EU 26a |
Own funds and subordinated |
9.00 |
– |
– |
||||
|
27 |
CET1 (as a percentage of TREA) available after meeting the resolution group’s requirements |
7.85 |
7.85 |
– |
||||
|
28 |
Institution-specific combined buffer requirement |
– |
5.21 |
– |
||||
|
of which: |
||||||||
|
29 |
Capital conservation buffer requirement |
– |
2.50 |
– |
||||
|
30 |
Countercyclical buffer requirement |
– |
0.49 |
– |
||||
|
31 |
Systemic risk buffer requirement |
– |
0.22 |
– |
||||
|
EU 31a |
Global Systemically Important Institution (G-SII) or Other Systemically Important Institution (O-SII) buffer |
– |
2.00 |
– |
||||
|
Memorandum items |
||||||||
|
EU 32a |
Total amount of excluded liabilities referred to in Article 72a(2) CRR |
– |
396,572 |
– |
||||
41
|
Deutsche Bank |
||
|
Pillar 3 Report as of December 31, 2024 |
||
|
|
Jun 30, 2024 |
|||||||
|
a |
b |
c |
||||||
|
in € m. |
Minimum requirement for own funds and eligible liabilities (MREL) |
G-SII Requirement for own funds and eligible liabilities (TLAC) |
Memo item: Amounts eligible for the purposes of MREL, but not TLAC |
|||||
|
Own funds and eligible liabilities and adjustments |
||||||||
|
1 |
Common Equity Tier 1 capital (CET1) |
48,113 |
48,113 |
− |
||||
|
2 |
Additional Tier 1 capital (AT1) |
9,878 |
9,878 |
− |
||||
|
6 |
Tier 2 capital (T2) |
8,449 |
8,449 |
− |
||||
|
11 |
Own funds for the purpose of Articles 92a CRR and 45 BRRD |
66,441 |
66,441 |
− |
||||
|
Own funds and eligible liabilities: Non-regulatory capital elements |
||||||||
|
12 |
Eligible liabilities instruments issued directly by the resolution entity that are subordinated to excluded liabilities (not grandfathered) |
33,995 |
33,995 |
− |
||||
|
EU 12a |
Eligible liabilities instruments issued by other entities within the resolution group that are subordinated to excluded liabilities (not grandfathered) |
0 |
0 |
− |
||||
|
EU 12b |
Eligible liabilities instruments that are subordinated to excluded liabilities, issued prior to 27 June 2019 (subordinated grandfathered) |
12,172 |
12,172 |
− |
||||
|
EU 12c |
Tier 2 instruments with a residual maturity of at least one year to the extent they do not qualify as Tier 2 items |
508 |
508 |
− |
||||
|
13 |
Eligible liabilities that are not subordinated to excluded liabilities (not grandfathered pre cap) |
12,145 |
− |
12,145 |
||||
|
EU 13a |
Eligible liabilities that are not subordinated to excluded liabilities issued prior to 27 June 2019 (pre-cap) |
1,823 |
− |
1,823 |
||||
|
14 |
Amount of non subordinated instruments eligible, where applicable after application of Article 72b (3) CRR |
− |
− |
− |
||||
|
17 |
Eligible liabilities items before adjustments |
60,643 |
46,675 |
13,968 |
||||
|
of which: |
||||||||
|
EU 17a |
subordinated |
46,675 |
− |
− |
||||
|
Own funds and eligible liabilities: Adjustments to non-regulatory capital elements |
||||||||
|
18 |
Own funds and eligible liabilities items before adjustments |
127,083 |
113,115 |
13,968 |
||||
|
19 |
(Deduction of exposures between MPE resolution groups) |
– |
− |
– |
||||
|
20 |
(Deduction of investments in other eligible liabilities instruments) |
– |
− |
– |
||||
|
22 |
Own funds and eligible liabilities after adjustments |
127,083 |
113,115 |
13,968 |
||||
|
of which: |
||||||||
|
EU 22a |
Own funds and subordinated |
113,115 |
− |
− |
||||
|
Risk-weighted exposure amount and leverage exposure measure of the resolution group |
||||||||
|
23 |
Total risk exposure amount |
356,427 |
356,427 |
|||||
|
24 |
Total exposure measure |
1,261,804 |
1,261,804 |
|||||
|
Ratio of own funds and eligible liabilities |
||||||||
|
25 |
Own funds and eligible liabilities (as a percentage of total risk exposure amount) |
35.65 |
31.74 |
|||||
|
of which: |
||||||||
|
EU 25a |
Own funds and subordinated |
31.74 |
– |
– |
||||
|
26 |
Own funds and eligible liabilities (as a percentage of total exposure measure) |
10.07 |
8.96 |
− |
||||
|
of which: |
||||||||
|
EU 26a |
Own funds and subordinated |
8.96 |
– |
– |
||||
|
27 |
CET1 (as a percentage of TREA) available after meeting the resolution group’s requirements |
− |
7.51 |
– |
||||
|
28 |
Institution-specific combined buffer requirement |
– |
5.20 |
– |
||||
|
of which: |
||||||||
|
29 |
Capital conservation buffer requirement |
– |
2.50 |
– |
||||
|
30 |
Countercyclical buffer requirement |
– |
0.50 |
– |
||||
|
31 |
Systemic risk buffer requirement |
– |
0.20 |
– |
||||
|
EU 31a |
Global Systemically Important Institution (G-SII) or Other Systemically Important Institution (O-SII) buffer |
– |
2.00 |
– |
||||
|
Memorandum items |
||||||||
|
EU 32a |
Total amount of excluded liabilities referred to in Article 72a(2) CRR |
– |
445,581 |
– |
||||
42
|
Deutsche Bank |
||
|
Pillar 3 Report as of December 31, 2024 |
||
Main features of eligible liabilities instruments
A description of the main features of the Group’s senior non-preferred subordinated eligible liabilities instruments eligible for subordinated MREL and TLAC and issued by Deutsche Bank is published on Deutsche Bank’s website (https://investor-relations.db.com/creditors/prospectuses/capital-instruments) to the extent that these do not constitute private placements and are treated confidentially.
Ranking in the creditor hierarchy and maturity
The following table provides a simplified overview of the ranking of liabilities in an insolvency proceeding under German law. The ranking is presented from the more junior liabilities to the more senior liabilities. Deutsche Bank AG’s subordinated eligible liability instruments qualifying for MREL and TLAC through meeting all the conditions in CRR Article 72b (2) or being grandfathered pursuant to CRR Article 494b (3) are exclusively rank at position 11 in the below order. Non-subordinated eligible liabilities instruments which are eligible for MREL rank in position 12. Deutsche Bank’s eligible liabilities instruments do not include any eligible liability according to CRR Article 72b (3) or (4).
Ranking of liabilities in an insolvency proceeding under German law
|
Rank |
Label of claims |
Code |
|
1 |
Common equity Tier 1 instruments |
Section 199 of the Insolvency Code |
|
2 |
Additional Tier 1 instruments |
Section 39 (2) of the Insolvency Code |
|
3 |
Tier 2 instruments |
|
|
4 |
Claims subordinated by virtue of a contractual subordination clause not specifying the pertinent rank (other than Additional Tier 1 or Tier 2 instruments) |
|
|
5 |
Claims for repayment of shareholder loans and accrued interest thereon |
Section 39 (1) no. 5 of the Insolvency Code |
|
6 |
Claims for the delivery of goods or provision of services free of charge |
Section 39 (1) no. 4 of the Insolvency Code |
|
7 |
Criminal and administrative fines |
Section 39 (1) no. 3 of the Insolvency Code |
|
8 |
Creditors’ costs related to the insolvency proceeding |
Section 39 (1) no. 2 of the Insolvency Code |
|
9 |
Interest and late payment surcharges accrued after the opening of insolvency proceedings |
Section 39 (1) no. 1 of the Insolvency Code |
|
10 |
Claims subordinated by virtue of a contractual subordination clause which specifies the relevant ranking |
Section 39 (2) of the Insolvency Code |
|
11 |
Non-preferred creditor claims arising from non-subordinated, unsecured non-structured debt instruments which
|
|
|
12 |
General creditors’ claims |
Section 38 of the Insolvency Code in conjunction with Section 46f (5) of the Banking Act, including instruments covered by Section 46f (6) sentence 3 and 46f (7) of the Banking Act |
|
13 |
Deposits not covered, but preferential |
Section 46f (4) no. 2 of the Banking Act |
|
14 |
Deposits covered and preferential |
Section 46f (4) no. 1 of the Banking Act |
|
15 |
Costs of proceeding and obligations binding on the estate |
Sections 53 to 55 of the Insolvency Code |
|
16 |
Claims subject to a right of separation in insolvency proceedings |
Sections 49 to 51 of the Insolvency Code |
|
17 |
Claims subject to a right of segregation in insolvency proceedings |
Sections 47 and 48 of the Insolvency Code |
Deutsche Bank’s own funds and eligible liabilities fall into these insolvency ranks as per below table EU TLAC3a based on German insolvency law. Liabilities fulfilling the MREL eligibility criteria as per CRR Art 72 are shown in the section “subset of liabilities and own funds less excluded liabilities that are own funds and liabilities potentially eligible for meeting MREL” and are issued out of the resolution entity Deutsche Bank AG.
43
|
Deutsche Bank |
||
|
Pillar 3 Report as of December 31, 2024 |
||
EU TLAC3a – Creditor ranking
|
|
Dec 31, 2024 |
|||||||||||||||||||
|
1 |
2 |
3 |
4 |
5 |
6 |
7 |
8 |
9 |
||||||||||||
|
in € m. |
Total |
|||||||||||||||||||
|
Description of insolvency rank |
R1 |
R2 |
R3 |
R11 |
R12 |
R13 |
R14 |
R16 |
R17 |
|||||||||||
|
Liabilities and own funds |
49,457 |
11,378 |
8,304 |
53,249 |
529,976 |
99,234 |
204,053 |
146,032 |
7,210 |
1,108,894 |
||||||||||
|
of which: |
||||||||||||||||||||
|
Excluded liabilities |
0 |
0 |
0 |
0 |
53,203 |
0 |
204,053 |
132,106 |
7,210 |
396,572 |
||||||||||
|
Liabilities and own funds less excluded liabilities |
49,457 |
11,378 |
8,304 |
53,249 |
476,773 |
99,234 |
0 |
13,926 |
0 |
712,321 |
||||||||||
|
Subset of Liabilities and own funds less excluded liabilities that are own funds and liabilities potentially eligible for meeting TLAC/MREL |
49,457 |
11,378 |
8,304 |
49,352 |
15,380 |
0 |
0 |
0 |
0 |
133,871 |
||||||||||
|
of which: |
||||||||||||||||||||
|
Residual maturity ≥ 1 year < 2 years |
0 |
0 |
944 |
9,054 |
3,731 |
0 |
0 |
0 |
0 |
13,729 |
||||||||||
|
Residual maturity ≥ 2 year < 5 years |
0 |
0 |
53 |
19,244 |
5,134 |
0 |
0 |
0 |
0 |
24,432 |
||||||||||
|
Residual maturity ≥ 5 years < 10 years |
0 |
0 |
7,296 |
12,264 |
4,586 |
0 |
0 |
0 |
0 |
24,146 |
||||||||||
|
Residual maturity ≥ 10 years, but excluding perpetual securities |
0 |
0 |
10 |
8,791 |
1,929 |
0 |
0 |
0 |
0 |
10,730 |
||||||||||
|
Perpetual securities |
49,457 |
11,378 |
0 |
0 |
0 |
0 |
0 |
0 |
0 |
60,835 |
||||||||||
|
|
Jun 30, 2024 |
|||||||||||||||||||
|
1 |
2 |
3 |
4 |
5 |
6 |
7 |
8 |
9 |
||||||||||||
|
in € m. |
Total |
|||||||||||||||||||
|
Description of insolvency rank |
R1 |
R2 |
R3 |
R11 |
R12 |
R13 |
R14 |
R16 |
R17 |
|||||||||||
|
Liabilities and own funds |
48,113 |
9,878 |
8,957 |
51,557 |
508,805 |
91,434 |
203,258 |
200,666 |
6,279 |
1,128,947 |
||||||||||
|
of which: |
||||||||||||||||||||
|
Excluded liabilities |
0 |
0 |
0 |
0 |
50,193 |
0 |
203,258 |
185,851 |
6,279 |
445,581 |
||||||||||
|
Liabilities and own funds less excluded liabilities |
48,113 |
9,878 |
8,957 |
51,557 |
458,612 |
91,434 |
0 |
14,815 |
0 |
683,366 |
||||||||||
|
Subset of Liabilities and own funds less excluded liabilities that are own funds and liabilities potentially eligible for meeting TLAC/MREL |
48,113 |
9,878 |
8,957 |
46,167 |
13,968 |
0 |
0 |
0 |
0 |
127,083 |
||||||||||
|
of which: |
||||||||||||||||||||
|
Residual maturity ≥ 1 year < 2 years |
0 |
0 |
1,155 |
5,664 |
4,416 |
0 |
0 |
0 |
0 |
11,235 |
||||||||||
|
Residual maturity ≥ 2 year < 5 years |
0 |
0 |
78 |
21,340 |
4,465 |
0 |
0 |
0 |
0 |
25,883 |
||||||||||
|
Residual maturity ≥ 5 years < 10 years |
0 |
0 |
7,706 |
12,192 |
3,621 |
0 |
0 |
0 |
0 |
23,519 |
||||||||||
|
Residual maturity ≥ 10 years, but excluding perpetual securities |
0 |
0 |
17 |
6,971 |
1,467 |
0 |
0 |
0 |
0 |
8,455 |
||||||||||
|
Perpetual securities |
48,113 |
9,878 |
0 |
0 |
0 |
0 |
0 |
0 |
0 |
57,992 |
||||||||||
44
|
Deutsche Bank |
||
|
Pillar 3 Report as of December 31, 2024 |
||
Capital requirements
Summary of Deutsche Bank’s ICAAP approach
Article 438 (a) CRR (EU OVC)
The internal capital adequacy assessment process (ICAAP) consists of several elements that aim to ensure that Deutsche Bank maintains, on an ongoing basis, an adequate capitalisation to cover the risks to which it is exposed.
– Risk identification and assessment: The risk identification process forms the basis of the ICAAP and results in an inventory of risks for the Group, and where appropriate, material legal entities, key branches and business units; the process identifies risks across risk types (e.g. credit, market, operational) and incorporates input from both the first line and second line of defense; materiality of all identified risks is assessed, based on their severity and likelihood to materialise in stressed conditions
The risk identification process adopts a descriptive, as opposed to taxonomy-driven, risk approach, eliciting how identified risks could manifest themselves based on potential real-world scenarios and events; this descriptive risk approach ensures the inventory covers both normative and economic perspectives and allows contributors to focus on future developments, risk behaviour under stress, and impact of mitigating actions; the risks in the risk inventory are mapped to Deutsche Bank’s group risk type taxonomy; the resulting inventory of risks, after review and challenge by senior management, informs key risk management processes, including the development of stress scenarios tailored to Deutsche Bank’s risk profile, informing business unit risk appetite statements, and risk profile monitoring and reporting
– Capital demand/risk measurement: Risk measurement methodologies and models are applied to quantify the capital demand required to cover all material risks, excluding those that cannot be adequately limited by capital, e.g. liquidity risk. ICAAP differentiates between the normative and economic perspective and this is reflected in the risk measurement process, which distinguishes between regulatory capital models which form an input into the normative perspective and economic capital models which form an input into the economic perspective
Under the normative perspective, Deutsche Bank applies regulatory models to measure risk-weighted assets in order to determine the regulatory capital demand:
– Credit risks are predominantly measured via the Advanced Internal Ratings Based Approach (A-IRBA); for the majority of the derivative counterparty exposures as well as securities financing transactions (SFT), internal model method (IMM) is used in accordance with the CRR
– Market risks are measured by internally developed risk metrics (as approved by the regulator) and regulatory-defined market risk approaches, namely the Value-at-Risk (VaR), Stressed Value-at-Risk (sVaR) and Incremental Risk Charge (IRC); the Market Risk Standardised Approach (MRSA) is used to determine the regulatory capital charge for the specific market risk arising on securitisations in the trading book
– Operational risks are measured using the Advanced Measurement Approach (AMA) methodology until end of 2024
For the measurement of capital demand under the economic perspective, Deutsche Bank applies various internally developed capital models in line with the economic capital framework and set at a level to absorb, with a confidence level of 99.9 %, aggregate unexpected losses within a one-year time period; the economic capital model landscape covers all material risks, i.e. quantifies credit, market, operational and strategic risk; diversification and concentrations are calculated on a group-wide basis; further details on the economic capital models are provided in the following sections
– Capital supply: Capital supply quantification refers to the definition of available capital resources to absorb losses; capital supply is defined for the normative and for the economic perspectives; the capital supply definition under the normative perspective follows the regulatory requirements in the CRR/CRD while the economic perspective follows an internal capital supply definition
– Risk appetite: Risk appetite is an expression of the level of risk that Deutsche Bank is willing to assume to achieve its strategic objectives; risk appetite plays an integral part in the business planning processes via risk strategy and plan, and promotes the appropriate alignment of risk, capital and performance targets; compliance of the plan with risk appetite and capacity is also tested under stressed market conditions
From an ICAAP perspective, risk appetite is set for key capital adequacy metrics and thereby covers the normative (via the CET 1 ratio, leverage ratio and MREL) and the economic (via the economic capital adequacy (ECA) ratio) perspective; these metrics are fully integrated across strategic planning, risk appetite framework, stress testing (except MREL), and recovery and resolution planning practices; threshold breaches are subject to a dedicated governance framework triggering management actions up to the execution of Deutsche Bank’s recovery plan; the Management Board reviews and approves the risk appetite and capacity on an annual basis, or more frequently in the event of unexpected changes to the risk environment, with the aim of ensuring that they are consistent with the Group’s strategy, business and regulatory environment and stakeholders’ requirements
45
|
Deutsche Bank |
||
|
Pillar 3 Report as of December 31, 2024 |
||
– Capital planning: Deutsche Bank’s capital management steers the bank's capital stack and capital demand in the short, middle and long term, specifically via the strategic and capital plan, the rolling forecast, and the downside and countermeasures analysis process; the holistic management of Deutsche Bank’s capital position looks at each of these elements, with differing focuses driven by the decision-making context
The integrated strategic and capital plan translates Deutsche Bank’s overall risk and business objectives as well as external targets into risk, capital, liquidity, and performance targets for the Group, divisions/business units, and infrastructure functions; the strategic plan is based on assumptions regarding the future development of regulatory requirements and supervisory practices, the banking market and revenue pools, expected client behaviour and relative strengths and capabilities to serve the clients in a competitive environment; the strategic and capital plan is built over a 5-year horizon and thoroughly reviewed on an annual basis, including changes to the macro-economic and competitive landscape as well as any other updates to key planning assumptions, e.g. to the regulatory environment; the strategic plan is finalised with the Management Board approval and thereafter sent to the Supervisory Board
As actual developments might deviate from the strategic plan, Deutsche Bank conducts a monthly rolling forecast; the granularity of each forecast is designed to cover the development of Deutsche Bank’s earnings as well as balance sheet, resources and capital components; the development of capital and resources is part of the discussions in the Group Risk Committee (GRC) and Asset and Liability Committee (ALCO); the forecast develops a best estimate of the base case development at the time, including all material impacts of likely events at an expected level; these assumptions contain a judgmental element and might include a range of outcomes; to address this, Deutsche Bank complements the base case with a well-established downside and countermeasure analysis framework
– Stress testing: Capital plan figures are also considered under various stress test scenarios to prove resilience and overall viability of Deutsche Bank. Regulatory and economic capital adequacy metrics are also subject to regular stress tests throughout the year to constantly evaluate Deutsche Bank’s capital position in hypothetical stress scenarios and to detect vulnerabilities; the stress testing framework comprises regular, sensitivity-based and scenario-based approaches addressing different severities and regional hotspots; these activities are complemented by portfolio- and country-specific downside analyses as well as regulatory-driven exercises such as reverse stress tests
– Capital adequacy assessment: In addition to the constant monitoring process that capital adequacy undergoes throughout the year, the ICAAP concludes with a dedicated annual capital adequacy assessment; the assessment consists of a Management Board statement about Deutsche Bank’s capital adequacy that is linked to specific conclusions and management actions to be taken to safeguard capital adequacy on a forward-looking basis
Credit risk economic capital model
Deutsche Bank calculates economic capital for counterparty risk, transfer risk and settlement risk as elements of credit risk. In line with the bank’s economic capital framework, economic capital for credit risk is set at a level to absorb with a probability of 99.9 % very severe aggregate unexpected losses within one year.
The Group’s economic capital for credit risk is derived from the loss distribution of a portfolio via Monte Carlo Simulation of correlated rating migrations. The portfolio loss distribution is calculated as follows: in a first step, potential credit losses are quantified on transactional level based on available exposure and loss-given-default information, where loss-given-default is stochastic. In a second step, the probability of joint defaults is modeled stochastically in terms of risk factors representing the relevant countries and industries that the counterparties are linked to. The simulation of portfolio losses is then performed by an internally developed model, which takes rating migration and maturity effects into account. Effects due to wrong-way derivatives risk (i.e., the credit exposure of a derivative in the default case is higher than in non-default scenarios) are modeled by applying an own alpha factor when deriving the exposure value for derivatives and securities financing transactions under the Internal Models Method (IMM). The bank allocates expected losses and economic capital derived from loss distributions down to transaction level to enable management on transaction, customer and business level.
Deutsche Bank’s asset value credit portfolio model is based on the assumption that an obligor firm defaults when its value is no longer high enough to cover its liabilities. The obligor’s asset value or "ability to pay" is modeled as a random process, the ability to pay process. An obligor is taken to default when its asset value or ability to pay falls below a given default point. Changes in the value of systematic and specific factors are simulated in terms of multivariate distributions. The weight assigned to systematic and specific components and the covariance of systematic factors are estimated using equity, credit spread and rating time series or are based on standard settings for particular portfolio segments.
Modeling correlations via a factor model: A factor model describes the dynamics of a large number of random variables by making use of a reduced and fixed number of other random variables, called factors. The approach has the advantage of reducing computing time: fewer correlations need to be evaluated, and the factor correlation matrix does not change when new obligors are introduced. The parameters that specify the factor model are:
46
|
Deutsche Bank |
||
|
Pillar 3 Report as of December 31, 2024 |
||
– The factor model characteristics for the different borrowers, i.e., the weights for the systematic country and industry factors (the model uses 41 systematic factors) and the R2, which determines the weight for the specific factor
– The covariance matrix between the country and industry factors
Modeling rating migration: The rating migration methodology requires additional information, namely yield curves and transition matrices describing the probabilities of migrating between different credit ratings.
– Migration matrix: For K non-default credit rating grades and 1 default credit rating, a migration matrix is a (K + 1) × (K + 1) matrix with entries πij. It expresses in percentage terms the probability πij that any borrower with the credit rating i moves to the credit rating j in the next time step.
– Risk-free curve: The risk-free curve required as an input for different points in time is used to derive the corresponding risk-free discount factors.
Economic capital is derived from Value-at-Risk (VaR) with confidence level α = 99.9 %. The economic capital is allocated to individual transactions using expected shortfall allocation. Portfolio information includes exposure, loss given default, one-year default probability and maturity. The parameters are largely consistent with the best-estimate components of the parameters used for regulatory reporting, with the exception of those for derivatives and securities financing exposure.
Market risk economic capital model
Economic capital for market risk measures the amount of capital needed to absorb very severe, unexpected losses arising from exposures over the period of one year. “Very severe” in this context means that the underlying economic capital is set at a level which covers, with a probability of 99.9 %, all unexpected losses over a one year time horizon. Market Risk Economic Capital consists of the following three components:
– Traded Market Risk, capturing the risk due to valuation changes from market price movements
– Traded Default Risk, capturing the risk due to valuation changes caused by issuer default and migration risk
– Non-traded Market Risk, market risk arising outside of the core trading activities
Traded market risk economic capital (TMR EC)
Deutsche Bank’s traded market risk economic capital model - scaled Stressed VaR based EC (SVaR based EC) - comprises two core components, the “common risk” component covering risk drivers across all businesses and the “business-specific risk” component, which enriches the Common Risk via a suite of Business Specific Stress Tests (BSSTs). Both components are calibrated to historically-observed severe market shocks.
Common risk is calculated using a scaled version of the SVaR framework. The SVaR based EC uses the Monte Carlo SVaR framework. The SVaR measure itself replicates the Value-at-Risk calculation that would be generated on the bank’s current portfolio if the relevant market factors were experiencing a period of stress. In particular, the model inputs are calibrated to historical data from a continuous 12-month period of significant financial stress relevant to the bank’s portfolio. The SVaR model is then scaled-up to cover a different liquidity horizon (up to 1 year) and confidence level (99.9 %). The liquidity horizon framework that is utilized in the SVaR based EC model accounts for different levels of market liquidity as well as risk concentrations in the bank’s portfolios. In terms of coverage, the “common risk” captures outright linear and some non-linear risks (e.g. Gamma, Vega etc.) to systematic and idiosyncratic risk drivers. The model incorporates the following risk factors: interest rates, credit spreads, equity prices, foreign exchange rates, commodity prices, volatilities and correlations.
The “business-specific risk” captures more product/business-related bespoke risks (e.g. complex basis risks) as well as higher order risks (e.g. for equity options) not captured in the common risk component. The concept of business-specific risk is in particular important in areas where the lack of meaningful market data prevents direct use of the common risk model. BSSTs are in general calibrated to available historical data to obtain a stress scenario. Where appropriate, risk managers use their expert judgment to define severe market shocks, based upon the knowledge of past extreme market conditions. In addition to the BSSTs the business specific risk component of the SVaR based EC model also contains placeholders which carry an estimated EC component on a temporary basis, while efforts are being made to cover those risks with a proper business-specific stress test or integrate it in the common risk framework.
The Group continuously assesses and refines its market risk EC model to ensure the capture of new material risks as well as the appropriateness of the shocks applied. The calculation of the Traded Market Risk EC is performed weekly.
Traded default risk economic capital (TDR EC)
TDR refers to changes in the value of instruments caused by default or rating changes of the issuer. For credit derivatives like credit default swaps (CDS), the rating of the issuer of the reference asset is modeled. TDR covers the following positions:
47
|
Deutsche Bank |
||
|
Pillar 3 Report as of December 31, 2024 |
||
– Fair value assets in the banking book;
– Unsecuritized credit products in the trading book;
– Securitized products in the trading book.
The TDR methodology is similar to the credit risk methodology. An important difference between the EC calculation for traded default risk and credit risk is the capital horizon of 6 months which is used for most TDR positions compared to 12 months used for credit risk. Recognizing traded default risk EC for unsecuritized credit products corresponds to the calculation of the incremental risk charge for the trading book for regulatory purposes. EC for TDR represents an estimate of the default and migration risks of credit products at a 99.9 % confidence level, taking into account the liquidity horizons of the respective sub-portfolios.
TDR EC captures the relevant credit exposures across its trading and fair value banking books. Trading book exposures are monitored by market risk management via single name concentration and portfolio thresholds which are set based upon rating, size and liquidity. Single name concentration risk thresholds are set for two key metrics: Default Exposure, i.e., the P&L impact of an instantaneous default at the current recovery rate, and bond equivalent market value, i.e. default exposure at 0 % recovery. In order to capture diversification and concentration effects the bank performs a joint calculation for traded default risk economic capital and credit risk economic capital. Important parameters for the calculation of traded default risk are exposures, recovery rates and default probabilities as well as maturities. For trading book positions exposures, recovery rates and default probabilities are derived from market information and external ratings and for banking book positions from internal assessments analogous to the credit risk economic capital model. Rating migrations are governed by issuer type specific migration matrices, which are obtained from historical rating time series from rating agencies and internal observations. The probability of joint rating downgrades and defaults is determined by the default and rating correlations of the portfolio model. These correlations are specified through systematic factors that represent countries, geographical regions and industries.
Non-traded market risk economic capital (NTMR EC)
Non-traded market risk arises from market movements, primarily outside the activities of the Group’s trading units, in the banking book and from off-balance sheet items. Significant market risk factors which the bank is exposed to and are overseen by risk management groups in that area are:
– Interest rate risk (including risk from embedded optionality and changes in behavioral patterns for relevant product types), credit spread risk, foreign exchange risk, equity risk (including investments in public and private equity as well as real estate, infrastructure and fund assets); and
– Market risks from off-balance sheet items such as pension schemes and guarantees as well as structural foreign exchange risk and equity compensation risk.
Non-traded market risk economic capital is being calculated either by applying the standard traded market risk EC methodology (SVaR based EC model) or through the use of non-traded market risk models that are specific to each risk class and which consider, among other factors, large historically observed market moves, the liquidity of each asset class, and changes in client’s behavior in relation to products with behavioral optionalities. The calculation of EC for non-traded market risk is performed monthly.
An independent model validation team reviews all quantitative aspects of the MR EC model on a regular basis. The review covers, but is not limited to, model assumptions and calibration approaches for risk parameters.
Operational risk economic capital model
For the quantification of its economic capital demands the Group uses the Advanced Measurement Approach (AMA). To absorb very severe unexpected losses within one year, both economic and regulatory capital are calculated at a 99.9 % confidence level.
Strategic risk economic capital model
The strategic risk category captures the economic capital arising from earnings volatility risk (which also includes potential losses from software assets), tax redetermination risk, and a capital charge for the risk related to deferred tax assets on temporary differences.
The earnings volatility risk economic capital model projects the earnings distribution for the next twelve months on group level. Important input parameters of the model are the expected revenues and costs from the strategic plan and monthly forecasts on business unit level. This ensures that the model includes strategic decisions or changes to the business environment in a timely manner. These projections determine the mean values of the revenue and cost distributions. The volatilities of the revenue distributions are derived from historical revenue time series of the business units. Risk concentrations within and across businesses are calibrated using historical revenue time series. Revenues are then simulated together with costs to allow for a partial offset of revenue decreases by cost reductions, e.g. reduced bonus payments. Potential cost increases related to software assets are also modelled. The resulting earnings distribution for the Group is used to derive the economic capital amount, which is held to protect against potential operating losses covering twelve months with a confidence level of 99.9%, in line with the general economic capital definition.
48
|
Deutsche Bank |
||
|
Pillar 3 Report as of December 31, 2024 |
||
Tax risk is determined by reference to corporate income tax, indirect and operational tax re-determination risk with respect to transactions undertaken by the bank. Tax re-determination risk is the risk that the eventual tax treatment of a transaction differs from that initially determined by the bank because of a judicial determination or a compromise by the bank with a tax authority. Examples of tax re-determination risk include a tax ceasing to be creditable, taxable income being treated as arising, a tax deduction not being granted, a tax consolidated group not being respected, or an anti-avoidance rule being determined to apply. Tax related inputs of the process are under the direction and control of tax professionals of the bank who are independent of business units. The calculation of tax risk economic capital is performed in a portfolio model which incorporates issues with a one-year time horizon. The notional exposure for each “tax issue” is determined and is then modified for reserves and a settlement adjustment. A probability is assigned to each “tax issue”. Tax risk economic capital is computed at the 99.9% confidence level of the portfolio loss distribution, which is obtained through a Monte Carlo simulation.
The capital charge to account for the risk of deferred tax assets on temporary differences mirrors regulatory treatment and is incorporated through an economic capital placeholder.
Risk type diversification
The economic capital model for risk type diversification and aggregation is a key component of Deutsche Bank’s economic capital framework. The purpose of the risk type diversification and aggregation model is to reflect the diversification effects across all risk types, resulting in the diversified economic capital at group level. The risk type diversification and aggregation methodology is based on the specification of analytical loss distributions for individual risk types (i.e. credit, market, operational and strategic risk), which are linked via a copula function to reflect their dependence structure. Using advanced simulation techniques, an aggregate loss distribution across all risk types is calculated for the whole portfolio. Total diversified economic capital is then derived from the aggregate loss distribution at the 99.9% quantile, i.e. to capture aggregate unexpected losses at group level over a one-year horizon with a confidence level of 99.9%.
Result of ICAAP
Article 438 (c) CRR (EU OVC)
The internal capital adequacy assessment process concludes that Deutsche Bank is adequately capitalized to cover its material risks and relevant regulatory requirements under the economic and normative perspective.
The bank assesses capital adequacy from an economic perspective as the ratio of economic capital supply divided by economic capital demand as shown in the table below. A ratio of more than 100% indicates that the available capital is sufficient to cover the risk positions. The economic capital adequacy ratio was 199% as of December 31, 2024, compared with 205% as of December 31, 2023. The decline in the ratio was due to an increase in economic capital demand which was partly offset by an increase in economic capital supply.
Total economic capital supply and demand
|
in € m. |
Dec 31, 2024 |
Dec 31, 2023 |
||
|
Components of economic capital supply |
||||
|
Shareholders' equity |
65,535 |
64,486 |
||
|
Noncontrolling interests¹ |
957 |
899 |
||
|
AT1 coupons deduction |
(475) |
(381) |
||
|
Gain on sale of securitizations, cash flow hedges |
(36) |
(45) |
||
|
Fair value gains on own debt and debt valuation adjustments, subject to own credit risk |
131 |
(82) |
||
|
Additional valuation adjustments |
(1,680) |
(1,727) |
||
|
Intangible assets |
(3,847) |
(3,692) |
||
|
IFRS deferred tax assets excl. temporary differences |
(4,073) |
(4,737) |
||
|
Expected loss shortfall |
(3,037) |
(2,386) |
||
|
Defined benefit pension fund assets |
(1,174) |
(947) |
||
|
Other adjustments |
(4,182) |
(3,782) |
||
|
Economic capital supply |
48,119 |
47,607 |
||
|
Components of economic capital demand |
||||
|
Credit risk |
12,507 |
11,875 |
||
|
Market risk |
8,667 |
8,328 |
||
|
Operational risk |
4,645 |
4,572 |
||
|
Strategic risk |
1,936 |
1,874 |
||
|
Diversification benefit |
(3,530) |
(3,385) |
||
|
Total economic capital demand |
24,225 |
23,265 |
||
|
Economic capital adequacy ratio |
199% |
205% |
||
1 Includes noncontrolling interest up to the economic capital requirement for each subsidiary
49
|
Deutsche Bank |
||
|
Pillar 3 Report as of December 31, 2024 |
||
As per December 31, 2024 the economic capital amounted to € 48,1 billion. It increased by € 0.5 billion compared to year-end 2023 which was mainly driven by a positive net income of € 3.4 billion, currency translation adjustments of € 0.9 billion and lower capital deductions for IFRS deferred tax assets excluding temporary differences of € 0.7 billion. These increases were partly offset by deductions for future shareholder distribution and AT1 coupon payments of € 2.6 billion as well as higher capital deduction from expected loss shortfall of € 0.7 billion which is mainly due to amended Internal Ratings-Based Approach models following model approval by ECB. Additionally, economic capital supply decreased due to completed share buybacks of € 0.7 billion in 2024, increase in unrealized losses of € 0.4 billion and higher capital deduction from defined benefit pension fund assets of € 0.2 billion.
The economic capital demand increased by € 1.0 billion mainly driven by an increase in credit risk and market risk. The increase in credit risk of € 0.6 billion was mainly driven by changes in the composition of the Corporate Bank loan portfolio. The increase in market risk of € 0.3 billion was mainly driven by higher behavioral interest rate risk arising from modelling assumptions in non-maturity deposit portfolios and increase in USD structural foreign exchange exposure, partially offset by a decrease in interest rate risk exposure in Treasury.
The development of capital adequacy ratios under the normative perspective (CET 1 ratio, leverage ratio and MREL) and respective SREP requirements are described in this report in sections “Own funds”, “Overview of capital requirements” and “Leverage ratio”.
Overview of RWA and capital requirements
Article 438 (d) CRR
The table below shows the composition of RWA by risk types and model approaches compared to the previous quarter end. It also shows the corresponding minimum capital requirements, which is derived by multiplying the respective RWA by an 8% capital ratio.
EU OV1 – Overview of RWA
|
|
Dec 31, 2024 |
Sep 30, 2024 |
||||||||
|
a |
c1 |
b |
c2 |
|||||||
|
in € m. |
RWA |
Minimum |
RWA |
Minimum |
||||||
|
1 |
Credit risk (excluding CCR) |
224,648 |
17,972 |
219,263 |
17,541 |
|||||
|
of which: |
||||||||||
|
2 |
The standardized approach (SA) |
19,814 |
1,585 |
18,412 |
1,473 |
|||||
|
3 |
The foundation IRB (FIRB) approach |
1,029 |
82 |
782 |
63 |
|||||
|
4 |
Slotting approach |
313 |
25 |
316 |
25 |
|||||
|
EU 4a |
Equities under the simple riskweighted approach |
10,485 |
839 |
9,601 |
768 |
|||||
|
5 |
The advanced IRB (AIRB) approach |
193,008 |
15,441 |
190,152 |
15,212 |
|||||
|
6 |
Counterparty credit risk (CCR) |
26,521 |
2,122 |
25,461 |
2,037 |
|||||
|
of which: |
||||||||||
|
7 |
The standardized approach |
1,209 |
97 |
1,316 |
105 |
|||||
|
8 |
Internal model method (IMM) |
15,189 |
1,215 |
15,495 |
1,240 |
|||||
|
EU 8a |
Risk exposure to a CCP |
4,531 |
362 |
3,486 |
279 |
|||||
|
EU 8b |
Credit Valuation Adjustment (CVA) |
3,431 |
275 |
2,967 |
237 |
|||||
|
9 |
Other CCR |
2,160 |
173 |
2,196 |
176 |
|||||
|
15 |
Settlement risk |
15 |
1 |
4 |
0 |
|||||
|
16 |
Securitization exposures in the banking book (after the cap) |
15,970 |
1,278 |
15,423 |
1,234 |
|||||
|
of which: |
||||||||||
|
17 |
SEC-IRBA approach |
8,538 |
683 |
8,346 |
668 |
|||||
|
18 |
SEC-ERBA (including IAA) |
648 |
52 |
478 |
38 |
|||||
|
19 |
SEC-SA approach |
5,484 |
439 |
5,623 |
450 |
|||||
|
EU 19a |
1250% / deduction |
1,300 |
104 |
976 |
78 |
|||||
|
20 |
Market risk |
18,965 |
1,517 |
25,995 |
2,080 |
|||||
|
of which: |
||||||||||
|
20 |
Standardized approach |
3,359 |
269 |
3,536 |
283 |
|||||
|
21 |
IMA |
15,605 |
1,248 |
22,460 |
1,797 |
|||||
|
EU 22a |
Large exposures |
0 |
0 |
0 |
0 |
|||||
|
23 |
Operational risk |
58,061 |
4,645 |
57,691 |
4,615 |
|||||
|
of which: |
||||||||||
|
EU 23a |
Basic indicator approach |
0 |
0 |
0 |
0 |
|||||
|
EU 23b |
Standardized approach |
0 |
0 |
0 |
0 |
|||||
|
EU 23c |
Advanced measurement approach |
58,061 |
4,645 |
57,691 |
4,615 |
|||||
|
24 |
Amounts below the thresholds for deduction (subject |
13,248 |
1,060 |
12,659 |
1,013 |
|||||
|
29 |
Total |
357,427 |
28,594 |
356,496 |
28,520 |
|||||
50
|
Deutsche Bank |
||
|
Pillar 3 Report as of December 31, 2024 |
||
As of December 31, 2024, RWA were € 357.4 billion compared to € 356.5 billion as of September 30, 2024. The increase of € 0.9 billion was primarily driven by RWA for credit risk (excluding counterparty credit risk), RWA for counterparty credit risk (CCR), RWA for amounts below thresholds for deduction (subject to 250% risk weight), RWA for securitization exposures in the banking book (after the cap) and operational risk RWA, which was partly offset by market risk RWA.
Credit risk RWA (excluding counterparty credit risk) increased by € 5.4 billion, mainly driven by RWA under the internal rating-based approach, which increased by € 3.1 billion mainly due to foreign exchange movements as well as updates in methodology and policy, partly offset by capital efficiency measures. RWA under the standardized approach increased by € 1.4 billion mainly due to increased exposures in exposure classes “corporates”, “exposures in default”, “retail” and “secured by mortgages on immovable properties”, partly offset by reduced exposures along with lower risk weights in exposure class “collective investment undertakings”. RWA for equities under the simple risk weight approach increased by € 0.9 billion, mainly driven by increased exposures for exchange traded equities and sufficiently diversified private equities. Counterparty credit risk RWA increased by € 1.1 billion, mainly driven by an increase of € 1.0 billion for risk exposures to a central counterparty (CCP). Additionally, credit valuation adjustment RWA increased by € 0.5 billion, mainly driven by increased exposure. These increases were partly offset by counterparty credit risk under the internal model method, which decreased by € 0.3 billion, predominantly reflecting changes in the composition of the derivatives portfolio, partly offset by foreign exchange movements and increased exposures for SFTs. Furthermore, RWA for amounts below the thresholds for deduction (subject to 250% risk weight) increased by € 0.6 billion, primarily driven by higher RWA for deferred tax assets and investments in financial sector entities. RWA for securitization exposures in the banking book (after the cap) increased by € 0.5 billion mainly driven by increased exposures calculated with a risk weight of 1,250%, the securitization internal rating-based approach (SEC-IRBA) and the securitization external rating-based approach (SEC-ERBA). Deutsche Bank´s operational risk RWA increased by € 0.4 billion mainly driven by internal and external losses as well as an unfavourable development of qualitative adjustments.
The aforementioned increases were partly offset by market risk RWA, which decreased by € 7.0 billion, primarily driven by lower Stressed-Value-at-Risk (SVaR) and incremental risk charge due to overall reduced risk levels under Fixed Income and Currencies Trading business.
The movements of RWA for credit, credit valuation adjustment, market and operational risk are discussed below in sections “Development of credit risk RWA”, “CCR exposures development”, “CCR CVA capital charge”, “Development of market risk RWA” and “Operational risk measurement”.
Crypto-asset exposures and related activities
Article 451b CRR
The following table shows the exposure values, RWA and own funds requirements for the types of exposures to crypto-assets referred to in Article 501d(2) of Regulation (EU) No 575/2013. Additionally, the exposure to other crypto assets is expressed as a percentage of the Tier1 capital.
EU CAE1 – Exposures to crypto-assets
|
|
Dec 31, 2024 |
|||||||
|
a |
b |
c |
||||||
|
Type of exposures, in € m. |
Exposure value |
Risk weighted exposures amounts (RWEA) |
Own funds requirements |
|||||
|
1 |
Tokenised traditional assets |
10 |
0 |
0 |
||||
|
2 |
Asset referencered tokens |
0 |
0 |
0 |
||||
|
3 |
Exposures to other crypto assets |
0 |
0 |
0 |
||||
|
4 |
Total |
10 |
0 |
0 |
||||
|
Memorandum item |
||||||||
|
5 |
Exposures to other crypto assets expressed as a percentage of the institutions's T1 capital |
0 |
– |
– |
||||
Deutsche Bank holds tokenised and other crypto assets to enable its strategic product build for custody & tokenization. In addition, the bank is currently building a custody solution capable of institutional-grade safekeeping for selected digital assets to enable clients to benefit from the decentralized ledger technology. The scope is currently limited to administration and transfer of digital assets on behalf of the bank’s clients. Go-live (subject to regulatory approval) is planned for the first quarter of 2025. Management of risks resulting from crypto-assets and crypto-asset services are embedded within the Group’s risk management framework and covered by the existent risk appetite statement and applicable Group-wide policies. In addition, bespoke documentation has been established to cover the crypto-assets and Markets in Crypto Assets (MiCA) requirement ((EU) 2023/1114).
51
|
Deutsche Bank |
||
|
Pillar 3 Report as of December 31, 2024 |
||
Leverage ratio
Leverage ratio according to CRR/CRD framework
The non-risk-based leverage ratio is intended to act as a supplementary measure to the risk-based capital requirements. Its objectives are to constrain the build-up of leverage in the banking sector, helping avoid destabilizing deleveraging processes which can damage the broader financial system and the economy, and to reinforce the risk-based requirements with a simple, non-risk based “backstop” measure.
A minimum leverage ratio requirement of 3% was introduced effective June 28, 2021. Starting with January 1, 2023, an additional leverage ratio buffer requirement of 50% of the applicable G-SII buffer rate applies. This additional requirement equals 0.75% for Deutsche Bank. Furthermore, the European Central Bank has set a Pillar 2 requirement for the leverage ratio for the first time; effective January 1, 2024, this requirement is 0.10%. This adds up to an overall leverage ratio requirement of 3.85%. Also, following the results of the 2023 SREP, the ECB communicated to Deutsche Bank an individual expectation to hold a further Pillar 2 Tier 1 capital add-on in relation to the leverage ratio, commonly referred to as the Pillar 2 guidance. The capital add-on pursuant to the Pillar 2 guidance is separate from and in addition to the Pillar 2 requirement. The ECB has stated that it expects banks to meet the Pillar 2 guidance although it is not legally binding, and failure to meet the Pillar 2 guidance does not lead to automatic restrictions of capital distributions.
Deutsche Bank calculates its leverage ratio exposure in accordance with Articles 429 to 429g of the CRR.
The Group’s total leverage ratio exposure includes derivatives, securities financing transactions (SFTs), off-balance sheet exposure and other on-balance sheet exposure (excluding derivatives and SFTs).
The leverage exposure for derivatives is calculated by using a modified version of the standardized approach for counterparty credit risk (SA-CCR), comprising the current replacement cost plus a regulatory defined add-on for the potential future exposure. The effective notional amount of written credit derivatives, i.e., the notional reduced by any negative fair value changes that have been incorporated in Tier 1 capital is included in the leverage ratio exposure measure; the resulting exposure measure is further reduced by the effective notional amount of purchased credit derivative protection on the same reference name provided certain conditions are met.
The SFT component includes the gross receivables for SFTs, which are netted with SFT payables if specific conditions are met. In addition to the gross exposure a regulatory add-on for the counterparty credit risk is included.
The off-balance sheet exposure component follows the standardized approach for credit risk with credit risk conversion factors (CCF) depending on the risk category (0% for low risk, 20% for medium/low risk, 50% for medium risk, or 100% for full risk). For the determination of the leverage exposure a floor of 10% is applied leading to a 10% CCF for the low risk category.
The on-balance sheet exposures (excluding derivatives and SFTs) component reflects the accounting values of the assets (excluding derivatives, SFTs and regular-way purchases and sales awaiting settlement). The exposure value of regular-way purchases and sales awaiting settlement is determined as offset between those cash receivables and cash payables where the related regular-way sales and purchases are both settled on a delivery-versus payment basis.
Assets can be excluded from the leverage ratio exposure measure if they have been deducted in the determination of Tier 1 capital. The corresponding regulatory adjustments are reflected in the asset amounts deducted in determining Tier 1 capital component.
Article 451 (1)(a-c),(2) and (3) CRR
The following tables show the leverage ratio exposure and the leverage ratio. The first table EU LR1 delivers a reconciliation of accounting assets reported in the IFRS financial statements to the leverage ratio exposure. The leverage ratio common disclosure table EU LR2 presents the components of the leverage exposure, the Tier 1 capital and the leverage ratio as well as the mean value for gross securities financing transaction (SFT) assets. Table EU LR3 provides a further breakdown of the balance sheet exposures (excluding derivatives, SFTs and exempted exposures).
52
|
Deutsche Bank |
||
|
Pillar 3 Report as of December 31, 2024 |
||
EU LR1 – LRSum: Summary reconciliation of accounting assets and leverage ratio exposures
|
|
a |
a |
||||
|
in € bn. |
Dec 31, 2024 |
Jun 30, 2024 |
||||
|
1 |
Total assets as per published financial statements |
1,387 |
1,351 |
|||
|
2 |
Adjustment for entities which are consolidated for accounting purposes but are outside the scope |
2 |
2 |
|||
|
3 |
(Adjustment for securitised exposures that meet the operational requirements for the recognition of risk transference) |
0 |
0 |
|||
|
4 |
(Adjustment for temporary exemption of exposures to central banks (if applicable)) |
0 |
0 |
|||
|
5 |
(Adjustment for fiduciary assets recognised on the balance sheet pursuant to the applicable accounting framework but excluded from the total exposure measure in accordance with point (i) of Article 429a(1) CRR) |
N/M |
N/M |
|||
|
6 |
Adjustment for regular-way purchases and sales of financial assets subject to trade date accounting |
(9) |
(55) |
|||
|
7 |
Adjustment for eligible cash pooling transactions |
0 |
0 |
|||
|
8 |
Adjustment for derivative financial instruments |
(157) |
(111) |
|||
|
9 |
Adjustment for securities financing transactions (SFTs) |
4 |
4 |
|||
|
10 |
Adjustment for off-balance sheet items (ie conversion to credit equivalent amounts of off-balance sheet exposures) |
160 |
136 |
|||
|
11 |
(Adjustment for prudent valuation adjustments and specific and general provisions which have reduced Tier 1 capital) |
(6) |
(6) |
|||
|
EU-11a |
(Adjustment for exposures excluded from the total exposure measure in accordance with point (c) of Article 429a(1) CRR) |
N/M |
N/M |
|||
|
EU-11b |
(Adjustment for exposures excluded from the total exposure measure in accordance with point (j) of Article 429a(1) CRR) |
N/M |
N/M |
|||
|
12 |
Other adjustments |
(65) |
(60) |
|||
|
13 |
Total exposure measure |
1,316 |
1,262 |
|||
N/M – Not meaningful
53
|
Deutsche Bank |
||
|
Pillar 3 Report as of December 31, 2024 |
||
EU LR2 – LRCom: Leverage ratio common disclosure
|
|
a |
b |
||||
|
in € bn. |
Dec 31, 2024 |
Jun 30, 2024 |
||||
|
On-balance sheet exposures (excluding derivatives and SFTs) |
||||||
|
1 |
On-balance sheet items (excluding derivatives, SFTs, but including collateral) |
928 |
931 |
|||
|
2 |
Gross-up for derivatives collateral provided, where deducted from the balance sheet assets pursuant to the applicable accounting framework |
0 |
0 |
|||
|
3 |
(Deductions of receivables assets for cash variation margin provided in derivatives transactions) |
(29) |
(27) |
|||
|
4 |
(Adjustment for securities received under securities financing transactions that are recognised as an asset) |
0 |
0 |
|||
|
5 |
(General credit risk adjustments to on-balance sheet items) |
(6) |
(6) |
|||
|
6 |
(Asset amounts deducted in determining Tier 1 capital) |
(13) |
(14) |
|||
|
7 |
Total on-balance sheet exposures (excluding derivatives and SFTs) |
879 |
884 |
|||
|
Derivative exposures |
||||||
|
8 |
Replacement cost associated with SA-CCR derivatives transactions (ie net of eligible cash variation margin) |
48 |
42 |
|||
|
EU-8a |
Derogation for derivatives: replacement costs contribution under the simplified standardised approach |
N/M |
N/M |
|||
|
9 |
Add-on amounts for potential future exposure associated with SA-CCR derivatives transactions |
83 |
80 |
|||
|
EU-9a |
Derogation for derivatives: Potential future exposure contribution under the simplified standardised approach |
N/M |
N/M |
|||
|
EU-9b |
Exposure determined under Original Exposure Method |
N/M |
N/M |
|||
|
10 |
(Exempted CCP leg of client-cleared trade exposures) (SA-CCR) |
(15) |
(16) |
|||
|
EU-10a |
(Exempted CCP leg of client-cleared trade exposures) (simplified standardised approach) |
N/M |
N/M |
|||
|
EU-10b |
(Exempted CCP leg of client-cleared trade exposures) (Original exposure method) |
N/M |
N/M |
|||
|
11 |
Adjusted effective notional amount of written credit derivatives |
569 |
565 |
|||
|
12 |
(Adjusted effective notional offsets and add-on deductions for written credit derivatives) |
(549) |
(543) |
|||
|
13 |
Total derivatives exposures |
137 |
128 |
|||
|
Securities financing transaction (SFT) exposures |
||||||
|
14 |
Gross SFT assets (with no recognition of netting), after adjustment for sales accounting transactions |
380 |
316 |
|||
|
15 |
(Netted amounts of cash payables and cash receivables of gross SFT assets) |
(232) |
(195) |
|||
|
16 |
Counterparty credit risk exposure for SFT assets |
4 |
5 |
|||
|
EU-16a |
Derogation for SFTs: Counterparty credit risk exposure in accordance with Articles 429e(5) and 222 CRR |
N/M |
N/M |
|||
|
17 |
Agent transaction exposures |
0 |
0 |
|||
|
EU-17a |
(Exempted CCP leg of client-cleared SFT exposure) |
0 |
0 |
|||
|
18 |
Total securities financing transaction exposures |
152 |
126 |
|||
|
Other off-balance sheet exposures |
||||||
|
19 |
Off-balance sheet exposures at gross notional amount |
590 |
401 |
|||
|
20 |
(Adjustments for conversion to credit equivalent amounts) |
(430) |
(265) |
|||
|
21 |
(General provisions deducted in determining Tier 1 capital and specific provisions associated with off-balance sheet exposures) |
(0) |
(0) |
|||
|
22 |
Off-balance sheet exposures |
160 |
136 |
|||
|
Excluded exposures |
||||||
|
EU-22a |
(Exposures excluded from the total exposure measure in accordance with point (c) of Article 429a(1) CRR) |
N/M |
N/M |
|||
|
EU-22b |
(Exposures exempted in accordance with point (j) of Article 429a(1) CRR (on and off balance sheet)) |
N/M |
N/M |
|||
|
EU-22c |
(Excluded exposures of public development banks (or units) - Public sector investments) |
N/M |
N/M |
|||
|
EU-22d |
(Excluded exposures of public development banks (or units) - Promotional loans) |
N/M |
N/M |
|||
|
EU-22e |
(Excluded passing-through promotional loan exposures by non-public development banks (or units)) |
N/M |
N/M |
|||
|
EU-22f |
(Excluded guaranteed parts of exposures arising from export credits) |
(7) |
(7) |
|||
|
EU-22g |
(Excluded excess collateral deposited at triparty agents) |
N/M |
N/M |
|||
|
EU-22h |
(Excluded CSD related services of CSD/institutions in accordance with point (o) of Article 429a(1) CRR) |
N/M |
N/M |
|||
|
EU-22i |
(Excluded CSD related services of designated institutions in accordance with point (p) of Article 429a(1) CRR) |
N/M |
N/M |
|||
|
EU-22j |
(Reduction of the exposure value of pre-financing or intermediate loans) |
(5) |
(5) |
|||
|
EU-22k |
(Total exempted exposures) |
(12) |
(12) |
|||
|
Capital and total exposure measure |
||||||
|
23 |
Tier 1 capital |
60.8 |
58.0 |
|||
|
24 |
Total exposure measure |
1,316 |
1,262 |
|||
|
Leverage ratio |
||||||
|
25 |
Leverage ratio (in %) |
4.6% |
4.6% |
|||
|
EU-25 |
Leverage ratio (excluding the impact of the exemption of public sector investments and promotional loans) (%) |
4.6% |
4.6% |
|||
|
25a |
Leverage ratio (excluding the impact of any applicable temporary exemption of central bank reserves) (%) |
4.6% |
4.6% |
|||
|
26 |
Regulatory minimum leverage ratio requirement (%) |
3.0% |
3.0% |
|||
|
EU-26a |
Additional own funds requirements to address the risk of excessive leverage (%) |
0.1% |
0.1% |
|||
|
EU-26b |
of which: to be made up of CET1 capital |
0.0% |
0.0% |
|||
|
27 |
Leverage ratio buffer requirement (%) |
0.75% |
0.75% |
|||
|
EU-27a |
Overall leverage ratio requirement (%) |
3.85% |
3.85% |
|||
|
Choice on transitional arrangements and relevant exposures |
||||||
|
EU-27b |
Choice on transitional arrangements for the definition of the capital measure |
Transitional |
Transitional |
54
|
Deutsche Bank |
||
|
Pillar 3 Report as of December 31, 2024 |
||
|
|
a |
b |
||||
|
in € bn. |
Dec 31, 2024 |
Jun 30, 2024 |
||||
|
Disclosure of mean values |
||||||
|
28 |
Mean of daily values of gross SFT assets, after adjustment for sale accounting transactions and netted of amounts of associated cash payables and cash receivable |
182 |
153 |
|||
|
29 |
Quarter-end value of gross SFT assets, after adjustment for sale accounting transactions and netted of amounts of associated cash payables and cash receivables |
147 |
121 |
|||
|
30 |
Total exposure measure (including the impact of any applicable temporary exemption of central bank reserves) incorporating mean values from row 28 of gross SFT assets (after adjustment for sale accounting transactions and netted of amounts of associated cash payables and cash receivables) |
1,351 |
1,294 |
|||
|
30a |
Total exposure measure (excluding the impact of any applicable temporary exemption of central bank reserves) incorporating mean values from row 28 of gross SFT assets (after adjustment for sale accounting transactions and netted of amounts of associated cash payables and cash receivables) |
1,351 |
1,294 |
|||
|
31 |
Leverage ratio (including the impact of any applicable temporary exemption of central bank reserves) incorporating mean values from row 28 of gross SFT assets (after adjustment for sale accounting transactions and netted of amounts of associated cash payables and cash receivables) |
4.5% |
4.5% |
|||
|
31a |
Leverage ratio (excluding the impact of any applicable temporary exemption of central bank reserves) incorporating mean values from row 28 of gross SFT assets (after adjustment for sale accounting transactions and netted of amounts of associated cash payables and cash receivables) |
4.5% |
4.5% |
|||
N/M – Not meaningful
EU LR3 – LRSpl: Split-up of on balance sheet exposures (excluding derivatives, SFTs and exempted exposures)
|
|
a |
a |
||||
|
in € bn. |
Dec 31, 2024 |
Jun 30, 2024 |
||||
|
EU-1 |
Total on-balance sheet exposures (excluding derivatives, SFTs, and exempted exposures) |
880 |
886 |
|||
|
of which: |
||||||
|
EU-2 |
Trading book exposures |
139 |
134 |
|||
|
EU-3 |
Banking book exposures |
741 |
752 |
|||
|
of which: |
||||||
|
EU-4 |
Covered bonds |
0 |
0 |
|||
|
EU-5 |
Exposures treated as sovereigns |
203 |
200 |
|||
|
EU-6 |
Exposures to regional governments, MDB, international organizations and PSE, not treated as sovereigns |
1 |
1 |
|||
|
EU-7 |
Institutions |
10 |
12 |
|||
|
EU-8 |
Secured by mortgages of immovable properties |
209 |
209 |
|||
|
EU-9 |
Retail exposures |
33 |
32 |
|||
|
EU-10 |
Corporates |
199 |
204 |
|||
|
EU-11 |
Exposures in default |
13 |
12 |
|||
|
EU-12 |
Other exposures (e.g. equity, securitizations, and other non-credit obligation assets) |
74 |
82 |
|||
Process used to manage the risk of excessive leverage
Article 451 (1)(d) CRR and EU LRA
The Group Risk Committee is mandated to oversee, control and monitor integrated planning of the Group’s risk profile and capital capacity. The Group Asset and Liability Committee (ALCO) actively manages leverage exposure capacity within the Risk Appetite Framework via a limit setting process to
– Allocate group leverage exposure capacity to businesses
– Support business achievement of strategic performance plans
– Provide a firm basis for achieving the target leverage ratio
– Incentivize businesses to make appropriate decisions on its portfolios, with consideration to asset maturity and encumbrance amongst others
– Maintain risk and leverage exposure discipline
The governance framework ensures that the leverage exposure capacity is carefully decided to reach the Group’s external leverage ratio target and avoids an excessive leverage of the bank and its divisions. The resulting leverage exposure limits include all assets including those inflating the Group’s balance sheet through asset encumbrance. In the case of divisions exceeding its agreed limits, charges are imposed on the division for the excess amount. The limit excess charges are calculated in accordance with the Group-wide limit-setting framework for leverage.
55
|
Deutsche Bank |
||
|
Pillar 3 Report as of December 31, 2024 |
||
Factors that had an impact on the leverage ratio in the second half of 2024
Article 451 (1)(e) CRR and EU LRA
As of December 31, 2024, Deutsche Bank’s leverage ratio was 4.6%, unchanged compared June 30, 2024. This takes into account a Tier 1 capital of € 60.8 billion over an applicable exposure measure of € 1,315.9 billion as of December 31, 2024 (€ 58.0 billion and € 1,261.8 billion as of June 30, 2024, respectively).
In the second half of 2024 the leverage exposure increased by € 54.1 billion.
The leverage exposure for securities financing transactions (SFTs) increased by € 25.8 billion, largely in line with the development on the balance sheet.
Off-balance sheet leverage exposures increased by € 24.1 billion corresponding to higher notional amounts for irrevocable lending commitments and financial guarantees, including impacts from early adoption of rules for commitments as per Article 5 (10) CRR 3.
The leverage exposure related to derivatives increased by € 8.7 billion.
These increases were partly offset by the leverage exposure for the asset items not related to derivatives and SFTs which decreased by € 4.5 billion. This largely reflects the development of the balance sheet: decreases in receivables from unsettled regular way trades by € 7.7 billion on a net basis (€ 53.3 billion on a gross basis due to seasonally low year-end levels) and cash and central bank/interbank balances of € 2.2 billion were partly offset by increases in non-derivative trading assets by € 1.2 billion and in loans by € 1.2 billion; remaining asset items not outlined separately increased by € 2.0 billion. Furthermore, Asset amounts deducted in determining Tier 1 capital are included which increased by € 0.9 billion mainly driven by the temporary treatment of unrealized gains and losses measured at fair value through OCI in accordance with Article 468 CRR which applies until year-end 2025.
The increase in leverage exposure in the second half of 2024 included a positive foreign exchange impact of € 20.2 billion, mainly due to the strengthening of the U.S. Dollar versus the Euro. The effects from foreign exchange rate movements are embedded in the movement of the leverage exposure items discussed in this section.
For the main drivers of the Tier 1 capital development please refer to section “Development and composition of Own Funds”.
56
|
Deutsche Bank |
||
|
Pillar 3 Report as of December 31, 2024 |
||
Risk management objectives and policies
Enterprise Risk
Risk management structure and organization
Article 435 (1)(b) CRR (EU OVA)
Governance principles
The Management Board is responsible for managing Deutsche Bank AG in accordance with the law, the Articles of Association, and its Terms of Reference.
The Management Board is responsible for ensuring the proper business organization of the Group, which includes appropriate and effective risk management as well as compliance with legal requirements and internal guidelines, along with taking the necessary measures to ensure that adequate internal guidelines are developed and implemented.
The bank’s Code of Conduct is designed to ensure ethical conduct, in accordance with Deutsche Bank’s policies and procedures as well as the laws and regulations that apply to the Group worldwide.
Accountability of senior management is ensured through transparency of its specific position and associated decision-making authority. Each position requires a separate position description with responsibilities against which individual performance is assessed.
Management committees (i.e. decision making bodies) are only permitted where true joint decision making is required. When committees are established, all members are equally accountable for all topics and decisions within the committees’ scope of responsibility.
Risk management principles
Deutsche Bank’s business model inherently involves taking risks. Risks can be financial and non-financial and include on and off-balance sheet risks. The risk management framework aligns the bank’s planned and actual risk taking with its risk appetite as expressed by the Management Board, while being in line with the Group’s available capital and liquidity.
Deutsche Bank’s risk management framework consists of various components, which include the established internal control mechanisms. Principles and standards are set for each component:
– Organizational structures must follow the Three Lines of Defense (3LoD) model with a clear definition of roles and responsibilities for all risk types
– The 1st Line of Defense (1st LoD) refers to those roles in the Bank whose activities generate risks, whether financial or non-financial, and who own and are accountable for these risks. The 1st LoD manages these risks within the defined risk appetite, establishes an appropriate risk governance and risk culture, and adheres to the risk type frameworks defined by the 2nd Line of Defense (2nd LoD)
– The 2nd LoD refers to the roles in the Bank who define the risk management framework for a specific risk type. The 2nd LoD independently assesses and challenges the implementation of the risk type framework and adherence to the risk appetite, and acts as an advisor to the 1st LoD on how to identify, assess and manage risks
– The 3rd Line of Defense (3rd LoD) is Group Audit, which is accountable for providing independent and objective assurance on the adequacy of the design, operating effectiveness and efficiency of the risk management system and systems of internal control
– Every employee must act as a risk manager consistent with the bank’s risk appetite, risk management standards and values
– The Management Board approved risk appetite must be cascaded and adhered to across all dimensions of the Group, with appropriate consequences in the event of a breach
– Risks must be identified and assessed
– Risks must be actively managed including via appropriate risk mitigation and effective internal control systems
– Risks must be measured and reported using accurate, complete and timely data using approved models
– Regular stress tests must be performed against adverse scenarios and appropriate crisis response planning must be established
The Group promotes a strong risk culture where every employee must fully understand and take a holistic view of the risks which could result from their actions, understand the consequences and manage them appropriately against the risk appetite of the bank. The bank expects employees to exhibit behaviors that support a strong risk culture in line with the bank’s Code of Conduct. To promote this, Deutsche Bank’s policies require that risks taken (including against risk appetite) must be taken into account during the bank’s performance assessment and compensation processes. This expectation continues to be reinforced through communications campaigns and mandatory training courses for all DB employees. In addition, Management Board members and senior management frequently communicate the importance of a strong risk culture to support a consistent tone from the top.
57
|
Deutsche Bank |
||
|
Pillar 3 Report as of December 31, 2024 |
||
Risk governance
Deutsche Bank’s operations throughout the world are regulated and supervised by relevant authorities in each of the jurisdictions in which the bank conducts business. Such regulation focuses on licensing, capital adequacy, liquidity, risk concentration, conduct of business as well as organizational and reporting requirements. The ECB in connection with the competent authorities of EU countries which joined the Single Supervisory Mechanism via the Joint Supervisory Team act in cooperation as Deutsche Bank’s primary supervisors to monitor the bank’s compliance with the German Banking Act and other applicable laws and regulations.
Several layers of management provide cohesive risk governance:
Deutsche Bank’s Supervisory Board is informed regularly on the risk situation, risk management and risk controlling, including reputational risk related items as well as material litigation cases. It has formed various committees to handle specific topics as outlined below.
– At the meetings of the Risk Committee, the Management Board reports on current and forward-looking risk exposures, portfolios, on risk appetite and strategy and on matters deemed relevant for the assessment and oversight of the risk situation of Deutsche Bank; it also reports on loans requiring a Supervisory Board resolution pursuant to law or the Articles of Association; the Risk Committee advises on issues related to the overall risk appetite, aggregate risk position and the risk strategy and keeps the Supervisory Board informed of its activities
– The Regulatory Oversight Committee, among other responsibilities, monitors the Management Board’s measures that promote the company’s compliance with legal requirements, authorities’ regulations and the company’s own policies; it also reviews the Bank’s codes of conduct and ethics as well as its policy framework, and, upon request, supports the Risk Committee in monitoring and analyzing the Bank’s legal and reputational risks; the Management Board informs the Committee about contacts with Regulators with a significant relevance for the business activity
– The Audit Committee, among other matters, monitors the effectiveness of the risk management system, particularly the internal control system and the internal audit system; it also monitors the Management Board’s remediation of deficiencies identified
The Management Board established the Group Risk Committee as the central forum for review and decision on material risk and capital-related topics. The Group Risk Committee has various duties and dedicated authority, including approval of new or changed material risk and capital models and review of the inventory of risks, high-level risk portfolios, risk exposure developments, and internal and regulatory Group-wide stress testing results. In addition, the Group Risk Committee reviews and recommends items for Management Board approval, such as key risk management principles, the Group risk appetite statement, the Group recovery plan and the contingency funding plan, over-arching risk appetite parameters, and recovery and escalation indicators. The Group Risk Committee also supports the Management Board during Group-wide risk and capital planning processes.
The Group Reputational Risk Committee has been established by the Management Board with the responsibility to review, decide and manage all transactions, client relationships or other primary reputational risk matters escalated in line with the underlying reputational risk policies and framework, including from the Regional Reputational Risk Committees.
The Financial Resource Management Council is an ad-hoc governance body, chaired by the Chief Financial Officer and the Chief Risk Officer, with delegated authority from the Management Board, to oversee financial crisis management at the bank. The Financial Resource Management Council provides a single forum to oversee execution of both the contingency funding plan and the Group recovery plan. The council recommends upon mitigating actions to be taken in a time of anticipated or actual capital or liquidity stress. Specifically, the Financial Resource Management Council is tasked with analyzing the bank’s capital and liquidity position, in anticipation of a stress scenario recommending proposals for capital and liquidity related matters and overseeing the execution of decisions.
The Group Asset & Liability Committee has been established by the Management Board. Its mandate is to optimize the sourcing and deployment of the bank’s balance sheet and financial resources within the overarching risk appetite set by the Management Board.
Deutsche Bank’s Chief Risk Officer, who is a member of the Management Board, has Group-wide, supra-divisional responsibility for establishing a risk management framework with appropriate identification, measurement, monitoring, mitigation and reporting of liquidity, credit, market, enterprise, model and non-financial risks (including operational and reputational risks). However, frameworks for certain risks are established by other functions as per the business allocation plan.
The Chief Risk Officer has direct management responsibility for the Chief Risk Office function. Risk management and control duties in the Chief Risk Office function are generally assigned to specialized risk management units focusing on the management of specific risk types, risks within a specific business or risks in a specific region.
58
|
Deutsche Bank |
||
|
Pillar 3 Report as of December 31, 2024 |
||
These specialized risk management units generally handle the following core tasks:
– Foster consistency with the risk appetite set by the Management Board and applied to business divisions and their business units
– Determine and implement risk and capital management policies, procedures and methodologies that are appropriate to the businesses within each division
– Establish and approve risk limits
– Conduct periodic portfolio reviews to keep the portfolio of risks within acceptable parameters
– Develop and implement risk and capital management infrastructures and systems that are appropriate for each division.
Chief Risk Officers for each business division as well as each region challenge and influence the divisional and regional strategies, risk awareness and ownership as well as their adherence to risk appetite.
Risk committee and number of meetings
Article 435 (2)(d) CRR (EU OVB)
Dedicated risk committees are in place both to support the Supervisory Board (the Risk Committee of the Supervisory Board) as well as the Management Board (the Group Risk Committee).
The Risk Committee of the Supervisory Board held 6 meetings in 2024.
The Group Risk Committee held 38 meetings in 2024.
Risk management strategies and processes
Article 435 (1)(a) CRR (EU OVA)
Enterprise risk relates to the potential losses or adverse consequences from strategic risk, insufficient capital, unduly portfolio concentrations or step-in risk on an enterprise level. Enterprise risk therefore covers various risk types with cross-risk character impacting Deutsche Bank holistically:
– Strategic risk is the risk of a shortfall in earnings (excluding other material risks) due to incorrect business plans (owing to flawed assumptions), ineffective plan execution or a lack of responsiveness to material plan deviations
– Capital risk is the risk that Deutsche Bank has an insufficient level or composition of capital supply to support its current and planned business activities and associated risks during normal and stressed conditions
– Portfolio concentration risk is the risk of exposures to common drivers, including on a country, industry or asset class basis
– Step-in risk is the risk that Deutsche Bank decides to provide support beyond contractual obligations to an entity outside the regulatory consolidation circle that is facing stress, in order to avoid the bank’s reputational damage, negative impacts to its businesses or operations
Enterprise Risk Management function establishes strategies and processes to manage most enterprise risks. This includes inter alia the establishment of an appropriate risk governance, setting of a risk appetite and risk measurement and reporting. The management of these risks is also closely integrated with Deutsche Bank’s overall strategy and processes on internal capital and liquidity adequacy.
Enterprise Risk Management is also responsible for defining a bank-wide framework for risk management, integrating and aggregating risks to provide greater enterprise risk transparency and support decision making, commissioning forward-looking stress tests and managing group recovery plans.
The stress test framework defined by Enterprise Risk Management satisfies internal as well as external stress test requirements. The internal stress tests are based on in-house developed methods and inform a variety of risk management use cases (risk type specific as well as cross risk). Internal stress tests form an integral part of Deutsche Bank’s risk management framework, complementing traditional risk measures. The cross-risk stress test framework, the Group Wide Stress Test (GWST), serves a variety of bank management processes, in particular the strategic planning process, the ICAAP, the risk appetite framework and capital allocation. Capital plan stress testing is performed to assess the viability of the bank’s capital plan in adverse circumstances and to demonstrate a clear link between risk appetite, business strategy, capital plan and stress testing. The time-horizon of internal stress tests is between one and five years, depending on the use case and scenario assumptions. The regulatory stress tests, e.g. the EBA stress test and the US-based CCAR (Comprehensive Capital Analysis and Review) stress tests, strictly follow the processes and methodologies prescribed by the regulatory authorities.
Deutsche Bank’s internal stress tests are performed on a regular basis in order to assess the impact of a severe economic downturn as well as adverse bank-specific events on the bank’s risk profile and financial position. The stress test framework comprises regular, sensitivity-based and scenario-based approaches addressing different severities and regional hotspots. The Group includes all material risk types in its stress testing activities. These activities are complemented by portfolio- and country-specific downside analysis as well as further regulatory requirements, such as reverse stress tests and additional stress tests requested by the regulators at group or legal entity level. The results of the stress tests also inform the bank’s recovery planning. The bank’s methodologies undergo regular scrutiny from Deutsche Bank’s internal validation team (Model Risk Management) to ensure they correctly capture the impact of a given stress scenario.
59
|
Deutsche Bank |
||
|
Pillar 3 Report as of December 31, 2024 |
||
Scope and nature of risk measurement and reporting systems
Article 435 (1)(c), Article 435 (2)(e) CRR (EU OVA)
Overview
Deutsche Bank’s risk measurement systems support regulatory reporting and external disclosures, as well as internal management reporting across all risk types. The risk infrastructure incorporates the relevant legal entities and business divisions and provides the basis for reporting on risk positions, capital adequacy and limit, threshold, or target utilization to the relevant functions on a regular and ad-hoc basis. Established units within the CFO and CRO function assume responsibility for measurement, analysis and reporting of risk while promoting sufficient quality and integrity of risk-related data and consider, where relevant, the principles for effective risk data aggregation and risk reporting as per the Basel Committee on Banking Supervision's regulation number 239 (“BCBS 239”). The Group’s risk management systems are reviewed by Group Audit following a risk-based audit approach.
Deutsche Bank’s reporting is an integral part of Deutsche Bank’s risk management framework and as such aligns with the organizational setup by delivering consistent information on Group level and for material legal entities as well as breakdowns by risk types, business division and material business units.
The following principles guide Deutsche Bank’s “risk measurement and reporting” practices:
– Deutsche Bank monitors risks taken against risk appetite and risk-reward considerations on various levels across the Group, e.g. Group, business divisions, material business units, material legal entities, risk types, material asset classes, portfolio and counterparty levels
– Risk reporting is required to be accurate, clear, useful and complete and must convey reconciled and validated risk data to communicate information in a concise manner to ensure, across material Financial and Non-Financial Risks, the bank’s risk profile is clearly understood
– Senior risk committees, such as the Enterprise Risk Committee and the Group Risk Committee, as well as the Management Board who are responsible for risk and capital management receive regular reporting (as well as ad-hoc reporting as required)
– Dedicated teams within Deutsche Bank proactively manage material Financial and Non-Financial Risks and must ensure that required management information is in place to enable proactive identification and management of risks and avoid undue concentrations within a specific Risk Type and across risks (Cross-Risk view)
In applying the previously mentioned principles, Deutsche Bank maintains a common basis for all risk reports and aims to minimize segregated reporting efforts to allow Deutsche Bank to provide consistent information, which only differs by granularity and audience focus.
Key risk metrics
The Bank identifies a large number of metrics within its risk measurement systems which support regulatory reporting and external disclosures, as well as internal management reporting across risks and for material risk types. Deutsche Bank designates a subset of those as “Key Risk Metrics” that represent the most critical ones for which the Bank places an appetite, limit, threshold or target at Group level and / or are reported routinely to senior management for discussion or decision making. The identified Key Risk Metrics include Capital Adequacy and Liquidity metrics; further details can be found in the section “Key risk metrics”.
Key risk reports
While a large number of reports are used across the Bank, Deutsche Bank designates a subset of these as “Key Risk Reports” that are critical to support Deutsche Bank’s Risk Management Framework through the provision of risk information to senior management and therefore enable the relevant governing bodies to monitor, steer and control the Bank’s risk taking activities effectively. To ensure that Key Risk Reports meet recipients’ requirements, report producing functions regularly check whether the Key Risk Reports are clear and useful.
The main reports on risk and capital management that are used to provide Deutsche Bank’s central governance bodies with information relating to the Group risk profile are the following:
– The monthly Risk and Capital Profile report is a Cross-Risk report, provides a comprehensive view of Deutsche Bank’s risk profile and is used to inform the ERC, the Group Risk Committee as well as the Management Board and subsequently the Risk Committee of the Supervisory Board; the Risk and Capital Profile includes Risk Type specific and Business-Aligned overviews and Enterprise-wide risk topics; it also includes updates on Key Group Risk Appetite Metrics and other Key Portfolio Risk Type Control Metrics as well as updates on Key Risk Developments, highlighting areas of particular interest with updates on corresponding risk management strategies
60
|
Deutsche Bank |
||
|
Pillar 3 Report as of December 31, 2024 |
||
– The Weekly Risk Report is a weekly briefing covering high-level topical issues across key risk areas and is submitted every Friday to the Members of the Enterprise Risk Committee, the Group Risk Committee and the Management Board and subsequently to the Members of the Risk Committee of the Supervisory Board; the Weekly Risk Report is characterized by the ad-hoc nature of its commentary as well as coverage of themes and focuses on more volatile risk metrics
– Deutsche Bank runs several Group-wide macroeconomic stress tests. A monthly Risk Appetite scenario serves the purpose to set and regularly monitor the bank’s stress loss appetite; in addition, there are topical scenarios which are reported to and discussed in the Enterprise Risk Committee and escalated to the Group Risk Committee if deemed necessary; the stressed key performance indicators are benchmarked against the Group Risk Appetite thresholds
While the above reports are used at a Group level to monitor and review the risk profile of Deutsche Bank holistically, there are other, supplementing standard and ad-hoc management reports, including for Risk Types or Focus Portfolios, which are used to monitor and control the risk profile.
Policies for hedging and mitigating risk
Article 435 (1)(d) CRR (EU OVA)
The bank is utilizing a variety of risk mitigation techniques to manage financial and non-financial risk exposures. More detailed risk type specific considerations can be found in following chapters.
Concise risk statement approved by the board
Article 435 (1)(f) CRR (EU OVA & EU LIQA)
Deutsche Bank’s Management Board approves, for the purpose of Article 435 CRR, this concise risk statement succinctly describing the institution's overall risk profile associated with the business strategy.
The Group’s business model inherently involves taking risks. Risk types as reflected in the risk type taxonomy include credit risk, market risk, liquidity risk, enterprise risk, model risk, reputational risk and operational risk.
The risk management framework aims to align the bank’s planned and actual risk taking with the risk appetite as expressed by the Management Board, while being in line with the bank’s available capital and liquidity. Deutsche Bank’s risk management framework consists of various components including risk governance, risk organization, risk culture, risk appetite, strategy & planning, risk identification & assessment, mitigation & controls, risk measurement & reporting, stress planning & execution.
Risk appetite is an integral element in the business planning processes via the bank’s risk strategy and plan, to promote the appropriate alignment of risk, capital and performance targets, while at the same time considering risk capacity and appetite constraints from both financial and non-financial risks. Compliance of the plan with risk appetite and capacity is also tested under stressed market conditions. Top-down risk appetite serves as the limit for risk-taking for the bottom-up planning from the business functions.
The table below shows the risk profile of business divisions as measured by economic capital calculated for credit, market, operational and strategic risk.
Risk profile of Deutsche Bank’s business divisions as measured by economic capital
|
|
Dec 31, 2024 |
|||||||||||||
|
in € m. (unless |
Corporate Bank |
Investment Bank |
Private Bank |
Asset Management |
Corporate & Other |
Total |
Total |
|||||||
|
Credit risk |
3,455 |
4,512 |
2,164 |
46 |
2,329 |
12,507 |
52 |
|||||||
|
Market risk |
1,040 |
2,086 |
1,561 |
304 |
3,676 |
8,667 |
36 |
|||||||
|
Operational risk |
863 |
1,182 |
1,155 |
376 |
1,069 |
4,645 |
19 |
|||||||
|
Strategic risk |
0 |
0 |
0 |
0 |
1,936 |
1,936 |
8 |
|||||||
|
Diversification benefit¹ |
(715) |
(1,007) |
(803) |
(190) |
(814) |
(3,530) |
(15) |
|||||||
|
Total EC |
4,643 |
6,772 |
4,077 |
536 |
8,196 |
24,225 |
100 |
|||||||
|
Total EC in % |
19 |
28 |
17 |
2 |
34 |
100 |
N/M |
|||||||
1 Diversification benefit across credit, market, operational and strategic risk
Deutsche Bank’s mix of business activities results in diverse risk taking. The Group measures key risks inherent to the respective business models through the total economic capital metric, which captures the business division’s risk profile and considers cross-risk effects at group level.
Corporate Bank’s risk profile mainly arises from the products and services offered in Corporate Treasury Services (including Trade Finance, Lending and Corporate Cash Management), Strategic Corporate Lending and Business Banking. Economic capital demand in these segments arises largely from credit risk.
61
|
Deutsche Bank |
||
|
Pillar 3 Report as of December 31, 2024 |
||
Investment Bank’s risk profile is dominated by its financing and trading activities, which give rise to all major risk types. Credit risk in the Investment Bank is broadly distributed across business units but most prominent in Fixed Income & Currencies and Leveraged Debt Capital Markets. Market risk arises mainly from trading and market making activities.
Private Bank’s risk profile comprises credit risks from business with German and international retail clients, business clients and wealth management clients as well as non-trading market risks from modelling of client deposits and credit spread risk.
Asset Management, as a fiduciary asset manager, invests money on behalf of clients. As such, the main risk drivers are non-financial. The economic capital demand for market risk is mainly driven by non-trading market risks, which arise from guaranteed products and co-investments in the funds.
Corporate & Other’s risk profile embeds a range of different risk drivers including those pertaining to Treasury, certain corporate items, and legacy portfolios. The economic capital demand mainly comprises non-trading market risk from interest rate risk in Treasury, structural foreign exchange risk, pension risk and equity compensation risk, credit risk from Treasury’s investments, strategic risk from tax-related risks and software asset risks and operational risk from legacy portfolios.
The table below shows the results of the bank’s stressed Net Liquidity Position (sNLP) under various scenarios. The sNLP is an internal liquidity risk management tool.
Global All Currency Daily Stress Testing Results
|
|
Dec 31, 2024 |
Dec 31, 2023 |
||||||||||
|
in € bn. |
Funding |
Gap |
Net Liquidity |
Funding |
Gap |
Net Liquidity |
||||||
|
Systemic market risk |
208 |
265 |
56 |
123 |
242 |
119 |
||||||
|
1 notch downgrade (DB specific) |
34 |
174 |
140 |
38 |
180 |
142 |
||||||
|
Severe downgrade (DB specific) |
142 |
241 |
99 |
161 |
259 |
97 |
||||||
|
Combined³ |
216 |
275 |
59 |
203 |
261 |
58 |
||||||
1 Funding gap caused by impaired rollover of liabilities and other projected outflows
2 Based on liquidity generation through Liquidity Reserves and other business mitigants
3 Combined impact of systemic market risk and severe downgrade
As part of the stress testing and scenario analysis the business portfolios are categorized under various liquidity risk drivers and appropriate models are defined for each of the liquidity risk drivers to arrive at the above results. The Corporate Bank and Private Bank are primarily loan and deposit businesses, which on a net basis generate liquidity for Deutsche Bank due to their surplus deposits in excess of their loan portfolios. This surplus liquidity is passed to Group Treasury. The Investment Bank by contrast is a net consumer of liquidity, predominantly due to its large loan and securities portfolios, and borrows from Group Treasury. The Investment Bank holds a portion of its liquid securities unencumbered as part of Deutsche Bank’s liquidity reserves. Group Treasury raises funding primarily from long-term debt issuance, participation in central bank money market operations as well as short-term wholesale deposits. Group Treasury holds Deutsche Bank’s liquidity reserves in the form of Central Bank cash and a highly liquid unencumbered securities portfolio.
Additional key risk ratios and figures are included in EU KM1, EU KM2, EU OVC and the various risk type specific sections.
Information on capital and risk measurement is based on the principles of consolidation. Intragroup transactions and transactions with related parties do not have any material impact on the Group’s capital risk profile. For the Bank’s consolidated LCR, NSFR (Pillar 1) and sNLP (Pillar 2), available surplus that resides in entities with restriction to transfer liquidity to other group entities, for example due to regulatory lending requirements, is considered to be trapped and as such not counted in the calculation of the consolidated group liquidity surplus.
62
|
Deutsche Bank |
||
|
Pillar 3 Report as of December 31, 2024 |
||
Credit risk and credit risk mitigation
General qualitative information on credit risk
Credit risk management strategies and processes
Article 435 (1)(a) CRR (EU OVA & EU CRA)
Credit risk arises from all transactions where actual, contingent or potential claims against any counterparty, borrower, obligor or issuer (which Deutsche Bank refers to collectively as “counterparties”) exist, including those claims that Deutsche Bank plans to distribute. It captures the risk of loss because of a deterioration of a counterparty’s creditworthiness or the failure of a counterparty to meet the terms of any contract with DB Group or otherwise performed as agreed.
Based on the Risk Type Taxonomy, credit risk is grouped into four material categories, namely default/migration risk, transaction/settlement risk (exposure risk), mitigation risk and concentration risk. This is complemented by a regular risk identification and materiality assessment.
– Default/migration risk as the main element of credit risk, is the risk that a counterparty defaults on its payment obligations or experiences material credit quality deterioration increasing the likelihood of a default
– Transaction/settlement risk (exposure risk) is the risk that arises from any existing, contingent or potential future positive exposure
– Mitigation risk is the risk of higher losses due to risk mitigation measures not performing as anticipated
– Credit concentration risk is the risk of an adverse development in a specific single counterparty, country, industry or product leading to a disproportionate deterioration in the risk profile of Deutsche Bank’s credit exposures to that counterparty, country, industry or product
An appropriate set of credit metrics is used to properly monitor DB Group’s Credit Risk:
To manage counterparties and portfolios the Bank uses gross/ net credit limits and other credit exposure metrics. Where deemed appropriate, additional risk metrics (PD, EL, LGD, loan loss provisions) are applied and related capital consumption (EC, RWA) as well as risk/ reward are referenced. Enhanced focus is put on balance sheet consumption and stress losses.
The management of Credit Risk follows clearly defined and documented credit processes.
Key elements are:
– deriving a Credit Rating for the counterparties
– approving individual counterparty credit limits with the required credit authority
– setting credit limits for certain counterparties or portfolios, the latter in line with the allocated Risk Appetite also ensuring adequate limit/ exposure reflection in risk systems
– deciding on the requirement for Credit Risk Mitigation (including collateral and risk transfer)
– monitoring of the credit exposures on a counterparty level; monitoring on a portfolio level including specific stress testing to ensure adherence to the allocated Risk Appetite (in addition to the tasks of the independent Risk Control Function)
– managing higher risk counterparties via Watchlist process and transfer to Workout Units
– proactively managing Concentration Risks and identifying quality trends to adhere to the allocated Risk Appetite.
The credit rating is an essential part of Deutsche Bank’s credit process and builds – amongst others – the basis for maximum credit limit determination on a Borrower level and adequate pricing of the transaction and credit decision. The Bank performs an appropriate risk assessment of all Borrowers and the associated exposure on at least an annual basis. Ongoing active monitoring and management of individual Credit Risk positions is an integral part of Credit Risk Management and is regarded as the responsibility of all functions being part of the credit process. A credit rating is a prerequisite for any credit limit established/ approved. For each credit rating the appropriate rating approach has to be applied and the derived credit rating has to be established in the relevant systems. Different rating approaches have been established to best reflect the specific characteristics of exposure classes, including specific product types, central governments and central banks, institutions, corporates and retail.
Counterparties in the bank’s non-homogenous portfolios are rated by Deutsche Bank’s independent Credit Risk Management function. Country risk ratings are provided by Enterprise Risk Management Risk Research.
Deutsche Bank’s rating analysis is based on a combination of qualitative (including environmental) and quantitative factors. When rating a counterparty Deutsche Bank applies in-house assessment methodologies, scorecards as well as the bank’s 21-grade rating scale.
63
|
Deutsche Bank |
||
|
Pillar 3 Report as of December 31, 2024 |
||
Deutsche Bank measures risk-weighted assets to determine the regulatory capital demand for credit risk using “advanced”, “foundation” and “standard” approaches of which “advanced” and “foundation” are approved by the bank’s regulator.
The advanced Internal Ratings Based Approach (IRBA) is the most sophisticated approach available under the regulatory framework for credit risk and allows Deutsche Bank to make use of the bank’s internal credit rating models as well as internal estimates of specific further risk parameters. These methods and parameters represent long-used key components of the internal risk measurement and management process supporting the credit approval process, the economic capital and expected loss calculation and the internal monitoring and reporting of credit risk. The relevant parameters include the probability of default (PD), the loss given default (LGD) and the maturity (M) driving the regulatory risk-weight and the credit conversion factor (CCF) as part of the regulatory exposure at default (EAD) estimation. For the majority of derivative counterparty exposures as well as securities financing transactions (SFT), Deutsche Bank makes use of the internal model method (IMM) in accordance with the CRR in order to calculate EAD. For most of the bank’s internal rating systems more than seven years of historical information is available to assess these parameters. Deutsche Bank’s internal rating methodologies aim at point-in-time rather than a through-the-cycle rating, but in line with regulatory solvency requirements, they are calibrated based on long-term averages of observed default rates.
The foundation IRBA is an approach available under the regulatory framework for credit risk allowing institutions to make use of their internal rating methodologies while using pre-defined regulatory values for all other risk parameters. Parameters subject to internal estimates include the PD while the LGD and the CCF are defined in the regulatory framework. Foundation IRBA remains in place for some exposures stemming from ex-Postbank.
Deutsche Bank applies the standardized approach to a subset of the bank’s credit risk exposures. The standardized approach measures credit risk either pursuant to fixed risk weights, which are predefined by the regulator, or through the application of external ratings. Deutsche Bank assigns certain credit exposures permanently to the standardized approach in accordance with Article 150 CRR. These are predominantly exposures to the Federal Republic of Germany and other German public sector entities as well as exposures to central governments of other European Member States that meet the required conditions. These exposures make up the majority of the exposures carried in the standardized approach and receive predominantly a risk weight of zero percent. For internal purposes, however, these exposures are subject to an internal credit assessment and fully integrated in the risk management and economic capital processes.
In addition to the above-described regulatory capital demand, Deutsche Bank determines the internal capital demand for credit risk via an economic capital model.
Deutsche Bank calculates economic capital for the default risk, country risk and settlement risk as elements of credit risk. In line with the bank’s economic capital framework, economic capital for credit risk is set at a level to absorb with a probability of 99.9 % very severe aggregate unexpected losses within one year. Deutsche Bank’s economic capital for credit risk is derived from the loss distribution of a portfolio via Monte Carlo Simulation of correlated rating migrations. The loss distribution is modeled in two steps. First, individual credit exposures are specified based on parameters for the probability of default, exposure at default and loss given default. In a second step, the probability of joint defaults is modeled through the introduction of economic factors, which correspond to geographic regions and industries. The simulation of portfolio losses is then performed by an internally developed model, which takes rating migration and maturity effects into account. Effects due to wrong-way derivatives risk (i.e., the credit exposure of a derivative in the default case is higher than in non-default scenarios) are modeled by applying the bank’s own alpha factor when deriving the exposure at default for derivatives and securities financing transactions under the CRR. Deutsche Bank allocates expected losses and economic capital derived from loss distributions down to transaction level to enable management on transaction, customer and business level.
In determining the credit limit for a counterparty, Deutsche Bank considers the counterparty’s credit quality by reference to its internal credit rating. Credit limits and credit exposures are both measured on a gross and net basis where net is derived by deducting hedges and certain collateral from respective gross figures. For derivatives, Deutsche Bank looks at current market values and the potential future exposure over the relevant time horizon which is based upon the bank’s legal agreements with the counterparty. Deutsche Bank also takes into consideration the risk-return characteristics of individual transactions and portfolios. Risk-return metrics explain the development of client revenues as well as capital consumption.
64
|
Deutsche Bank |
||
|
Pillar 3 Report as of December 31, 2024 |
||
Credit risk management structure and organization
Article 435 (1)(b) CRR EU OVA & EU CRA
Deutsche Bank manages its credit risk using the following philosophy and principles:
– Credit Risk is only accepted:
– for adopted clients
– after completed proper due diligence involving the Business as 1st LoD
– for explicitly approved businesses, products and locations; New, products and changes to existing products have to be assessed within DB Group’s new product approval (NPA) framework
– if a Rating has been assigned in line with agreed and approved processes
– if all credit relevant exposures are correctly reflected in the relevant risk systems
– if plans for an orderly termination of the risk positions have been considered
– Credit Risk is assumed within the applicable Risk Appetite
– P&L responsibility for credit exposures is kept and remains with the sponsoring Corporate Division
– Risk taken needs to be adequately compensated
– Risk must be continuously monitored and managed across 1st and 2nd LoD
– Credit standards are applied consistently across all Group Divisions in order to maintain a favorable risk profile in line with the Risk Appetite
– Collateral or other risk mitigating, hedging or rating transfer instruments which can be an alternative source of repayment do not substitute for underwriting standards and a thorough assessment of the debt service ability of the counterparty has to be performed during the credit process
– Deutsche Bank strives to adequately secure, guarantee or hedge outright Cash Risk and longer tenor exposures with acceptable remuneration. This approach does usually not include lower risk short-term transactions and facilities supporting specific trade finance or other lower risk products where the margin allows for adequate loss coverage
– Deutsche Bank measures and consolidates globally all exposure and facilities to the same Obligor. A Key Contact Person (KCP) within a Credit Team is assigned to each group of connected clients (Obligor) to globally co-ordinate the Credit Risk process for the respective Obligor
– Deutsche Bank has established within Credit Risk Management – where appropriate – specialized teams for deriving internal client ratings, analyzing and approving transactions or covering workout clients; for transaction approval purposes, structured credit risk management teams are aligned to the respective lending business areas to ascertain adequate product expertise
– Where required, Deutsche Bank has established processes to manage credit exposures at a legal entity level
– To meet the requirements of Article 190 CRR, DB Group has allocated the various control requirements for the credit processes to units that are best suited to perform such controls
The model change process and the relevant governance bodies are described in the chapter “Role of the function in the credit risk model process, scope and main content of credit risk models”.
Climate and environmental risks are integrated across the different stages of the credit lifecycle including transaction approval / client onboarding, risk classification and credit ratings, portfolio analysis and monitoring and, collateral valuation.
Climate and environmental risks are incorporated into the credit approval process for corporate clients via enhanced due diligence requirements. New loan requests (defined as increments, renewals/tenor extensions) above selected tenor and rating-based thresholds to corporate clients in high-carbon intensive sectors as well as those in sectors vulnerable to climate-physical and nature (or “other environmental”) risks require dedicated climate risk assessment from the front office and review by Credit Risk Management. More information on additional controls and processes around the appetite and management of environmental risks in the bank’s lending portfolio are reported in the following sections of this chapter.
Scope and nature of credit risk measurement and reporting systems
Article 435 (1)(c) CRR (EU OVA & EU CRA)
Both credit and non-credit risk measurement systems support credit risk related management reporting and provide the basis for reporting on credit risk positions and utilization under established limits to relevant stakeholders on a regular and ad-hoc basis. Established units within the Chief Risk Officer function assume responsibility for measurement, analysis and reporting of risk while promoting sufficient quality and integrity of credit risk-related data.
65
|
Deutsche Bank |
||
|
Pillar 3 Report as of December 31, 2024 |
||
The main reports on credit risk that are used to provide stakeholders with information relating to the group credit risk profile are the following:
– The Key Risk Report focused on credit risk is the Credit Risk Appetite & Portfolio Management Report, issued monthly; this Key Risk Report holistically covers credit risk across Deutsche Bank Group; it has been established to monitor and promote discussion on qualitative and quantitative credit portfolio developments and the current macroeconomic environment including market trends and events; the material typically covers key credit risk themes, the credit portfolio risk profile, credit portfolio appetite, informs on potential counterparty and portfolio concentrations, provides information on the development of financial resources such as credit risk RWA and credit risk economic capital including stress testing, updates on credit portfolio risk mitigation across the banking and trading book positions and wrong way risk as well as the development and outlook of Credit Loss Provisions (CLP)
– The Weekly Credit Risk Wrap, a summary that provides an update of latest credit risk developments over the week, including recent news, CLP, and underwriting pipeline trends
While the above reports are used at a Group level to monitor and review the credit risk profile of Deutsche Bank holistically, there are other, supplementing standard and ad-hoc management reports, including for sub- and focus portfolios, asset classes as well as legal entities, which are used to monitor and control the risk profile. Fully automated credit portfolio overview reports can be also utilized and show, for the selected portfolio scope, key credit risk metrics and various portfolio splits, such as top movers by product classification, tenor and country. In addition, credit risk feeds information into the bank’s cross risk reports as outlined earlier.
Policies for hedging and mitigating credit risk
Article 435 (1)(d) CRR (EU OVA & EU CRA)
Deutsche Bank has regulated the acceptance, valuation and management of risk mitigating and hedging instruments in a framework of approved global, local and product or business specific documents which determine the Bank´s standards and consider legal and regulatory requirements. Tasks, responsibilities and respective authorities are dedicated here while the processes are executed mainly decentralized or locally or in specific teams with delegated tasks.
Under the framework of the “Principles for Managing Credit Risk” as well as the “Policy for Managing Credit Risk” the bank´s main respective documents for hedging and mitigating credit risk are:
– The Global Collateral Management Guide (for Banking Book Collateral)
– The Global Collateral Guideline (for Derivatives and Securities Financing Transactions)
– Mandated Hedge Guidance for CPM Framework
– Leveraged and Hedge Funds Process Guide - CRO CRM
supplemented by divisional credit policies and process guides and a comprehensive regime of local, divisional and business specific collateral management and valuation procedures, directives and manuals. All these regulations are reviewed, updated and approved at least annually and distributed to the relevant staff as well as accessible on the bank´s Policy Portal.
Article 431 (5) CRR
Deutsche Bank Group, if requested, provides explanations of rating decisions to small and medium entities and other corporates.
Definitions of past due and impairment
Article 442 (a) CRR (EU CRB)
Exposures are considered to be past due if contractually agreed payments of principal and/or interest remain unpaid by the borrower, except if those are acquired through consolidation. The latter are considered to be past due if payments of principal and/or interest, which were expected at a certain payment date at the time of the initial consolidation of the loans, are unpaid by the borrower.
The Group has aligned its definition of “credit impaired” under IFRS 9 to the default definition as per Art. 178 of the Capital Requirements Regulation for regulatory purposes. As a consequence, credit impaired financial assets (or Stage 3 financial assets) consist of two types of defaulted financial assets: financial assets where the Group expects an impairment loss and the amount is reflected in the allowance for credit losses and financial assets, where the Group does not expect an impairment loss (e.g., due to high quality collateral or sufficient expected future cash flows following thorough due diligence).
Credit risk adjustments
Article 442 (b) CRR (EU CRB)
The determination of impairment losses and allowances is based on the expected credit loss model under IFRS 9, where allowances for loan losses are recorded upon initial recognition of the financial asset, based on expectations of potential credit losses at the time of initial recognition.
The impairment requirements of IFRS 9 apply to all credit exposures that are measured at amortized cost or fair value through other comprehensive income and to off balance sheet lending commitments, such as loan commitments and financial guarantees. For purposes of the Group’s impairment approach, the bank refers to these instruments as financial assets.
66
|
Deutsche Bank |
||
|
Pillar 3 Report as of December 31, 2024 |
||
The Group determines its allowance for credit losses in accordance with IFRS 9 as follows:
– Stage 1 reflects financial instruments where it is assumed that credit risk has not increased significantly after initial recognition
– Stage 2 contains all financial assets, that are not defaulted, but have experienced a significant increase in credit risk since initial recognition
– Stage 3 consists of financial assets of clients which are defaulted in accordance with DB’s policies on regulatory default, which are based on the Capital Requirements Regulation (CRR) under Art. 178; the Group defines these financial assets as impaired, non-performing and defaulted
– Significant increase in Credit Risk is determined using quantitative and qualitative information based on the Group’s historical experience, credit risk assessment and forward-looking information
– Purchased or Originated Credit Impaired (POCI) financial assets are assets where at the time of initial recognition there is objective evidence of impairment
The IFRS 9 impairment approach is an integral part of the Group’s Credit Risk Management procedures. The estimation of expected credit losses (ECL’s) is either performed via the automated, parameter based ECL calculation using the Group’s ECL model or determined by Credit Officers. In both cases, the calculation takes place for each financial asset individually. Similarly, the determination of the need to transfer between stages is made on an individual asset basis. The Group’s ECL model is used to calculate the allowance for credit losses for all financial assets in Stage 1 and Stage 2, as well as for Stage 3 in the homogeneous portfolio (i.e. retail and small business loans with similar credit risk characteristics). For financial assets in the bank’s non-homogeneous portfolio in Stage 3 and for POCI assets, the allowance for credit losses is determined by Credit Officers.
The Group uses three main components to measure ECL. These are PD, LGD and EAD. The Group leverages existing parameters used for determination of capital demand under the Basel Internal Ratings Based Approach and internal risk management practices as much as possible to calculate ECL. These parameters are adjusted where necessary to comply with IFRS 9 requirements (e.g. use of point in time ratings and removal of downturn add-ons in the regulatory parameters). Incorporating forecasts of future economic conditions into the measurement of expected credit losses influences the allowance for credit losses. In order to calculate lifetime expected credit losses, the Group’s calculation derives the corresponding lifetime PDs from migration matrices that reflect economic forecasts.
General quantitative information on credit risk
Residual maturity breakdown of credit exposure
Article 442 (g) CRR
Table EU CR1-A provides the net credit exposures by maturities and exposure classes. The exposure amount includes on-balance sheet items, whereby the net exposure value is calculated by deducting credit risk adjustments from its gross carrying amount. The net exposure is split into the below 5 categories based on the residual contractual maturity of the instrument.
– On demand: where the counterparty has a choice of when the amount is repaid
– Bucketing remaining maturity: 0 to 1 year, 1 to 5 years, and more than 5 years
– No stated maturity: where an exposure has no stated maturity for reasons other than the counterparty having the choice of the repayment date
The breakdown into the exposure classes follows those as defined for the IRBA (i.e., combining the advanced and foundation IRB) as well as for the standardized approach. In the IRB approach, the line item “Central governments and central banks” includes exposures to regional governments or local authorities, public sector entities, multilateral developments banks and international organizations. The exposure class “Other items” within the standardized approach includes all exposures not covered in the other categories.
67
|
Deutsche Bank |
||
|
Pillar 3 Report as of December 31, 2024 |
||
EU CR1-A – Maturity of exposures
|
|
Dec 31, 2024 |
|||||||||||||
|
a |
b |
c |
d |
e |
f |
|||||||||
|
Net exposure value |
||||||||||||||
|
in € m. |
On demand |
<= 1 year |
> 1 year |
> 5 years |
No stated |
Total |
||||||||
|
1 |
Central governments and central banks |
80,293 |
12,879 |
9,801 |
17,852 |
0 |
120,826 |
|||||||
|
2 |
Institutions |
4,032 |
5,733 |
755 |
1,718 |
0 |
12,239 |
|||||||
|
3 |
Corporates |
12,177 |
100,678 |
102,183 |
27,734 |
0 |
242,771 |
|||||||
|
4 |
Retail |
2,414 |
7,007 |
26,467 |
164,789 |
0 |
200,677 |
|||||||
|
5 |
Equity |
827 |
960 |
0 |
0 |
0 |
1,787 |
|||||||
|
5a |
Other non-credit obligation asset |
3,723 |
1,835 |
871 |
4,969 |
0 |
11,398 |
|||||||
|
6 |
Total IRB approach |
103,467 |
129,091 |
140,076 |
217,064 |
0 |
589,698 |
|||||||
|
|
|
56,853 |
11,001 |
4,207 |
14,058 |
0 |
86,119 |
|||||||
|
8 |
Regional governments or local authorities |
69 |
264 |
154 |
694 |
0 |
1,181 |
|||||||
|
9 |
Public sector entities |
24 |
239 |
78 |
342 |
0 |
683 |
|||||||
|
10 |
Multilateral development banks |
0 |
48 |
306 |
109 |
0 |
463 |
|||||||
|
11 |
International organizations |
0 |
0 |
0 |
0 |
0 |
0 |
|||||||
|
12 |
Institutions |
6 |
6 |
0 |
0 |
0 |
12 |
|||||||
|
13 |
Corporates |
2,296 |
7,716 |
3,875 |
1,315 |
0 |
15,201 |
|||||||
|
14 |
Retail |
456 |
70 |
287 |
745 |
0 |
1,558 |
|||||||
|
15 |
Secured by mortgages on immovable property |
536 |
396 |
575 |
3,686 |
0 |
5,194 |
|||||||
|
16 |
Exposures in default1 |
247 |
267 |
392 |
566 |
0 |
1,472 |
|||||||
|
17 |
Items associated with particularly high risk |
2 |
5 |
9 |
47 |
0 |
63 |
|||||||
|
18 |
Covered bonds |
0 |
0 |
0 |
0 |
0 |
0 |
|||||||
|
19 |
Claims on institutions and corporates with a short-term credit assessment |
0 |
0 |
0 |
0 |
0 |
0 |
|||||||
|
20 |
Collective investments undertakings (CIU) |
0 |
0 |
0 |
0 |
0 |
0 |
|||||||
|
21 |
Equity exposures |
33 |
0 |
0 |
70 |
0 |
103 |
|||||||
|
22 |
Other items |
0 |
90 |
0 |
0 |
0 |
90 |
|||||||
|
23 |
Total standardized approach |
60,275 |
19,835 |
9,491 |
21,067 |
0 |
110,668 |
|||||||
|
|
|
163,742 |
148,926 |
149,568 |
238,131 |
0 |
700,366 |
|||||||
|
|
Jun 30, 2024 |
|||||||||||||
|
a |
b |
c |
d |
e |
f |
|||||||||
|
Net exposure value |
||||||||||||||
|
in € m. |
On demand |
<= 1 year |
> 1 year |
> 5 years |
No stated |
Total |
||||||||
|
1 |
Central governments and central banks |
78,156 |
11,654 |
9,274 |
16,101 |
0 |
115,185 |
|||||||
|
2 |
Institutions |
5,503 |
5,650 |
838 |
1,548 |
0 |
13,539 |
|||||||
|
3 |
Corporates |
12,964 |
104,314 |
97,140 |
31,698 |
0 |
246,117 |
|||||||
|
4 |
Retail |
2,104 |
5,622 |
19,425 |
177,259 |
0 |
204,410 |
|||||||
|
5 |
Equity |
741 |
985 |
0 |
0 |
0 |
1,726 |
|||||||
|
5a |
Other non-credit obligation asset |
3,741 |
1,781 |
1,288 |
4,643 |
0 |
11,453 |
|||||||
|
6 |
Total IRB approach |
103,209 |
130,005 |
127,965 |
231,249 |
0 |
592,429 |
|||||||
|
|
|
63,825 |
7,493 |
3,536 |
13,719 |
0 |
88,573 |
|||||||
|
8 |
Regional governments or local authorities |
82 |
374 |
181 |
591 |
0 |
1,227 |
|||||||
|
9 |
Public sector entities |
127 |
297 |
48 |
247 |
0 |
718 |
|||||||
|
10 |
Multilateral development banks |
0 |
46 |
300 |
105 |
0 |
451 |
|||||||
|
11 |
International organizations |
0 |
0 |
0 |
0 |
0 |
0 |
|||||||
|
12 |
Institutions |
117 |
35 |
0 |
3,575 |
0 |
3,727 |
|||||||
|
13 |
Corporates |
1,838 |
803 |
3,384 |
1,368 |
0 |
7,394 |
|||||||
|
14 |
Retail |
447 |
131 |
352 |
548 |
0 |
1,478 |
|||||||
|
15 |
Secured by mortgages on immovable property |
570 |
350 |
619 |
3,249 |
0 |
4,788 |
|||||||
|
16 |
Exposures in default1 |
113 |
282 |
186 |
411 |
0 |
992 |
|||||||
|
17 |
Items associated with particularly high risk |
24 |
1 |
2 |
22 |
0 |
49 |
|||||||
|
18 |
Covered bonds |
0 |
0 |
0 |
0 |
0 |
0 |
|||||||
|
19 |
Claims on institutions and corporates with a short-term credit assessment |
0 |
0 |
0 |
0 |
0 |
0 |
|||||||
|
20 |
Collective investments undertakings (CIU) |
0 |
0 |
0 |
0 |
0 |
0 |
|||||||
|
21 |
Equity exposures |
0 |
0 |
0 |
67 |
0 |
67 |
|||||||
|
22 |
Other items |
0 |
5 |
0 |
0 |
0 |
5 |
|||||||
|
23 |
Total standardized approach |
67,030 |
9,534 |
8,423 |
23,490 |
0 |
108,477 |
|||||||
|
|
|
170,238 |
139,539 |
136,388 |
254,740 |
0 |
700,906 |
|||||||
1 In light of EBA guidance (Q&A 2017_3481) the defaulted exposure is presented within the standardized approach as a total in row 16 but also shown as assigned to their respective exposure classes. In order to avoid double counting of exposures, the total exposure of the standardized approach as presented in row 23 does not take into account figures disclosed under row 16
68
|
Deutsche Bank |
||
|
Pillar 3 Report as of December 31, 2024 |
||
Quality of non-performing exposures by geography
The following 6 tables (EU CQ4, EU CQ5, EU CR1, EU CQ3, EU CR2 and EU CQ1) provide information on performing and non-performing exposures.
Relevant exposures are debt instruments (debt securities, loans, advances, cash at central bank balances, demand deposits) as well as off-balance sheet exposures (loan commitments given, financial guarantees given and any other commitments) excluding those exposures held for trading.
The amounts shown are based on the IFRS gross carrying and nominal values according to the regulatory scope of consolidation. The gross carrying amount reflects the exposure value before deduction of accumulated impairment, provisions and accumulated negative changes due to credit risk for non-performing exposures.
An exposure is being classified as non-performing if it meets the non-performing criteria in Article 47a of the CRR and an exposure is classified as defaulted if it meets the definition of default as per Article 178 of the CRR. Exposures subject to impairment under IFRS 9 include debt instruments at amortized cost and fair value through OCI as well as off-balance sheet exposures.
Article 442 (c+e) CRR
Table EU CQ4 provides information about performing and non-performing exposures broken down by significant countries. For each reporting period Deutsche Bank considers the top 25 countries by exposure to be significant, as it represents more than 90% of the Group’s total exposure. Immaterial exposures, with individual exposures being below € 3.8 billion, are included in “Other countries”. The geographical distribution is based on the legal domicile of the counterparty or issuer.
69
|
Deutsche Bank |
||
|
Pillar 3 Report as of December 31, 2024 |
||
EU CQ4 – Quality of non-performing exposures by geography
|
|
Dec 31, 2024 |
|||||||||||||||
|
a |
b |
c |
d |
e |
f |
g |
||||||||||
|
Gross carrying/nominal amount |
Accumulated |
Provisions on off-balance-sheet commitments and financial guarantees |
Accumulated negative changes in fair value due to credit risk on non-performing exposures |
|||||||||||||
|
of which non-performing |
of which subject to impairment |
|||||||||||||||
|
in € m. |
of which defaulted |
|||||||||||||||
|
1 |
On-balance-sheet exposures¹ |
774,974 |
16,154 |
16,133 |
664,209 |
(5,772) |
0 |
(17) |
||||||||
|
2 |
Australia |
9,800 |
88 |
88 |
7,077 |
(13) |
0 |
0 |
||||||||
|
3 |
Belgium |
3,755 |
15 |
15 |
3,719 |
(4) |
0 |
0 |
||||||||
|
4 |
Brazil |
3,246 |
28 |
28 |
3,242 |
(2) |
0 |
0 |
||||||||
|
5 |
Canada |
5,834 |
1 |
1 |
2,222 |
(6) |
0 |
0 |
||||||||
|
6 |
Cayman Islands |
21,571 |
123 |
123 |
11,852 |
(9) |
0 |
0 |
||||||||
|
7 |
China |
5,852 |
17 |
17 |
4,805 |
(1) |
0 |
0 |
||||||||
|
8 |
France |
23,709 |
387 |
387 |
15,522 |
(111) |
0 |
0 |
||||||||
|
9 |
Germany |
241,255 |
4,588 |
4,586 |
240,185 |
(2,850) |
0 |
0 |
||||||||
|
10 |
Hong Kong |
4,468 |
225 |
225 |
4,137 |
(184) |
0 |
0 |
||||||||
|
11 |
India |
11,386 |
242 |
242 |
11,098 |
(59) |
0 |
0 |
||||||||
|
12 |
Ireland |
9,984 |
416 |
404 |
8,231 |
(95) |
0 |
0 |
||||||||
|
13 |
Italy |
38,310 |
1,065 |
1,063 |
36,862 |
(717) |
0 |
0 |
||||||||
|
14 |
Japan |
13,926 |
74 |
74 |
5,071 |
(1) |
0 |
0 |
||||||||
|
15 |
Jersey |
4,820 |
57 |
57 |
2,535 |
(8) |
0 |
0 |
||||||||
|
16 |
Luxembourg |
22,469 |
137 |
137 |
18,834 |
(44) |
0 |
0 |
||||||||
|
17 |
Netherlands |
11,706 |
336 |
336 |
11,615 |
(62) |
0 |
(13) |
||||||||
|
18 |
Poland |
5,812 |
77 |
76 |
5,728 |
(31) |
0 |
0 |
||||||||
|
19 |
Singapore |
6,588 |
125 |
125 |
5,859 |
(24) |
0 |
0 |
||||||||
|
20 |
Spain |
18,984 |
800 |
800 |
18,911 |
(349) |
0 |
0 |
||||||||
|
21 |
Sweden |
1,911 |
305 |
305 |
1,704 |
(3) |
0 |
0 |
||||||||
|
22 |
Switzerland |
10,067 |
44 |
44 |
9,787 |
(11) |
0 |
0 |
||||||||
|
23 |
Turkey |
6,319 |
98 |
98 |
5,095 |
(1) |
0 |
0 |
||||||||
|
24 |
U.S. |
182,751 |
4,766 |
4,764 |
141,595 |
(739) |
0 |
0 |
||||||||
|
25 |
United Kingdom |
51,625 |
506 |
506 |
36,241 |
(25) |
0 |
0 |
||||||||
|
26 |
Virgin Islands, British |
4,438 |
291 |
291 |
4,438 |
(34) |
0 |
0 |
||||||||
|
27 |
Other countries |
54,387 |
1,343 |
1,342 |
47,843 |
(387) |
0 |
(4) |
||||||||
|
28 |
Off-balance-sheet exposures |
338,634 |
2,531 |
2,517 |
0 |
0 |
(362) |
0 |
||||||||
|
29 |
Australia |
4,181 |
9 |
9 |
0 |
0 |
(3) |
0 |
||||||||
|
30 |
Belgium |
3,304 |
2 |
2 |
0 |
0 |
(1) |
0 |
||||||||
|
31 |
Brazil |
629 |
35 |
35 |
0 |
0 |
(0) |
0 |
||||||||
|
32 |
Canada |
2,689 |
0 |
0 |
0 |
0 |
(4) |
0 |
||||||||
|
33 |
Cayman Islands |
3,431 |
0 |
0 |
0 |
0 |
(1) |
0 |
||||||||
|
34 |
China |
2,626 |
0 |
0 |
0 |
0 |
(0) |
0 |
||||||||
|
35 |
France |
9,209 |
152 |
152 |
0 |
0 |
(9) |
0 |
||||||||
|
36 |
Germany |
85,748 |
444 |
436 |
0 |
0 |
(120) |
0 |
||||||||
|
37 |
Hong Kong |
1,157 |
5 |
5 |
0 |
0 |
(3) |
0 |
||||||||
|
38 |
India |
5,016 |
6 |
6 |
0 |
0 |
(4) |
0 |
||||||||
|
39 |
Ireland |
5,502 |
3 |
3 |
0 |
0 |
(3) |
0 |
||||||||
|
40 |
Italy |
9,621 |
44 |
44 |
0 |
0 |
(16) |
0 |
||||||||
|
41 |
Japan |
1,174 |
1 |
1 |
0 |
0 |
(0) |
0 |
||||||||
|
42 |
Jersey |
1,011 |
57 |
57 |
0 |
0 |
(3) |
0 |
||||||||
|
43 |
Luxembourg |
9,279 |
91 |
90 |
0 |
0 |
(6) |
0 |
||||||||
|
44 |
Netherlands |
12,634 |
116 |
116 |
0 |
0 |
(21) |
0 |
||||||||
|
45 |
Poland |
2,586 |
1 |
1 |
0 |
0 |
(1) |
0 |
||||||||
|
46 |
Singapore |
2,291 |
11 |
11 |
0 |
0 |
(1) |
0 |
||||||||
|
47 |
Spain |
7,966 |
50 |
50 |
0 |
0 |
(20) |
0 |
||||||||
|
48 |
Sweden |
3,157 |
10 |
10 |
0 |
0 |
(4) |
0 |
||||||||
|
49 |
Switzerland |
11,910 |
13 |
13 |
0 |
0 |
(3) |
0 |
||||||||
|
50 |
Turkey |
845 |
0 |
0 |
0 |
0 |
(1) |
0 |
||||||||
|
51 |
U.S. |
115,132 |
1,040 |
1,035 |
0 |
0 |
(98) |
0 |
||||||||
|
52 |
United Kingdom |
14,501 |
48 |
48 |
0 |
0 |
(14) |
0 |
||||||||
|
53 |
Virgin Islands, British |
297 |
24 |
24 |
0 |
0 |
(0) |
0 |
||||||||
|
54 |
Other countries |
22,739 |
368 |
368 |
0 |
0 |
(28) |
0 |
||||||||
|
55 |
Total |
1,113,608 |
18,685 |
18,650 |
664,209 |
(5,772) |
(362) |
(17) |
||||||||
1 The on-balance sheet exposure includes debt securities and loans and advances.
70
|
Deutsche Bank |
||
|
Pillar 3 Report as of December 31, 2024 |
||
|
|
Jun 30, 2024 |
|||||||||||||||
|
a |
b |
c |
d |
e |
f |
g |
||||||||||
|
Gross carrying/nominal amount |
Accumulated |
Provisions on off-balance-sheet commitments and financial guarantees² |
Accumulated negative changes in fair value due to credit risk on non-performing exposures² |
|||||||||||||
|
of which non-performing |
of which subject to impairment |
|||||||||||||||
|
in € m. |
of which defaulted |
|||||||||||||||
|
1 |
On-balance-sheet exposures¹ |
797,376 |
15,382 |
15,353 |
695,463 |
(5,517) |
0 |
(18) |
||||||||
|
2 |
Australia |
6,407 |
38 |
38 |
6,249 |
(7) |
0 |
0 |
||||||||
|
3 |
Austria |
2,453 |
2 |
2 |
2,333 |
(2) |
0 |
0 |
||||||||
|
4 |
Belgium |
3,492 |
16 |
16 |
3,447 |
(3) |
0 |
0 |
||||||||
|
5 |
Canada |
4,895 |
0 |
0 |
2,034 |
(3) |
0 |
0 |
||||||||
|
6 |
Cayman Islands |
56,727 |
96 |
94 |
12,089 |
(11) |
0 |
0 |
||||||||
|
7 |
China |
7,573 |
24 |
24 |
5,015 |
(6) |
0 |
0 |
||||||||
|
8 |
Denmark |
1,768 |
1 |
1 |
749 |
(2) |
0 |
0 |
||||||||
|
9 |
France |
15,567 |
523 |
523 |
13,020 |
(234) |
0 |
0 |
||||||||
|
10 |
Germany |
253,274 |
4,084 |
4,083 |
251,867 |
(2,598) |
0 |
0 |
||||||||
|
11 |
Hong Kong |
3,493 |
221 |
221 |
3,326 |
(184) |
0 |
0 |
||||||||
|
12 |
India |
8,722 |
180 |
180 |
8,258 |
(45) |
0 |
0 |
||||||||
|
13 |
Ireland |
9,357 |
444 |
444 |
7,215 |
(91) |
0 |
0 |
||||||||
|
14 |
Italy |
37,054 |
1,063 |
1,058 |
35,744 |
(736) |
0 |
0 |
||||||||
|
15 |
Japan |
17,430 |
38 |
38 |
7,477 |
(5) |
0 |
0 |
||||||||
|
16 |
Luxembourg |
20,182 |
184 |
184 |
19,571 |
(39) |
0 |
0 |
||||||||
|
17 |
Netherlands |
12,338 |
226 |
226 |
12,034 |
(60) |
0 |
(13) |
||||||||
|
18 |
Poland |
5,537 |
115 |
113 |
5,480 |
(36) |
0 |
(1) |
||||||||
|
19 |
Singapore |
6,183 |
89 |
89 |
5,275 |
(13) |
0 |
0 |
||||||||
|
20 |
Spain |
19,558 |
978 |
972 |
19,519 |
(346) |
0 |
0 |
||||||||
|
21 |
Sweden |
3,524 |
1 |
1 |
1,279 |
(4) |
0 |
0 |
||||||||
|
22 |
Switzerland |
7,936 |
543 |
543 |
7,768 |
(30) |
0 |
0 |
||||||||
|
23 |
Turkey |
6,104 |
98 |
98 |
4,632 |
(5) |
0 |
0 |
||||||||
|
24 |
U.S. |
176,531 |
4,221 |
4,213 |
157,164 |
(684) |
0 |
0 |
||||||||
|
25 |
United Kingdom |
44,522 |
224 |
221 |
41,081 |
(18) |
0 |
0 |
||||||||
|
26 |
Virgin Islands, British |
3,755 |
226 |
226 |
3,755 |
(37) |
0 |
0 |
||||||||
|
27 |
Other countries |
62,995 |
1,748 |
1,743 |
59,081 |
(318) |
0 |
(4) |
||||||||
|
28 |
Off-balance-sheet exposures |
328,926 |
1,982 |
1,982 |
0 |
0 |
(376) |
0 |
||||||||
|
29 |
Australia |
3,584 |
0 |
0 |
0 |
0 |
(3) |
0 |
||||||||
|
30 |
Austria |
1,306 |
0 |
0 |
0 |
0 |
(1) |
0 |
||||||||
|
31 |
Belgium |
3,081 |
8 |
8 |
0 |
0 |
(1) |
0 |
||||||||
|
32 |
Canada |
2,206 |
0 |
0 |
0 |
0 |
(4) |
0 |
||||||||
|
33 |
Cayman Islands |
2,496 |
11 |
11 |
0 |
0 |
(1) |
0 |
||||||||
|
34 |
China |
2,567 |
0 |
0 |
0 |
0 |
(1) |
0 |
||||||||
|
35 |
Denmark |
2,816 |
0 |
0 |
0 |
0 |
(0) |
0 |
||||||||
|
36 |
France |
9,125 |
1 |
1 |
0 |
0 |
(5) |
0 |
||||||||
|
37 |
Germany |
85,603 |
308 |
308 |
0 |
0 |
(136) |
0 |
||||||||
|
38 |
Hong Kong |
1,265 |
8 |
8 |
0 |
0 |
(5) |
0 |
||||||||
|
39 |
India |
4,560 |
3 |
3 |
0 |
0 |
(3) |
0 |
||||||||
|
40 |
Ireland |
5,416 |
1 |
1 |
0 |
0 |
(2) |
0 |
||||||||
|
41 |
Italy |
10,573 |
44 |
44 |
0 |
0 |
(30) |
0 |
||||||||
|
42 |
Japan |
1,619 |
0 |
0 |
0 |
0 |
(0) |
0 |
||||||||
|
43 |
Luxembourg |
9,422 |
112 |
112 |
0 |
0 |
(4) |
0 |
||||||||
|
44 |
Netherlands |
12,323 |
137 |
137 |
0 |
0 |
(14) |
0 |
||||||||
|
45 |
Poland |
2,679 |
4 |
4 |
0 |
0 |
(1) |
0 |
||||||||
|
46 |
Singapore |
2,056 |
22 |
22 |
0 |
0 |
(1) |
0 |
||||||||
|
47 |
Spain |
7,537 |
42 |
42 |
0 |
0 |
(18) |
0 |
||||||||
|
48 |
Sweden |
3,339 |
0 |
0 |
0 |
0 |
(3) |
0 |
||||||||
|
49 |
Switzerland |
12,316 |
32 |
32 |
0 |
0 |
(2) |
0 |
||||||||
|
50 |
Turkey |
1,097 |
0 |
0 |
0 |
0 |
(0) |
0 |
||||||||
|
51 |
U.S. |
107,880 |
877 |
877 |
0 |
0 |
(101) |
0 |
||||||||
|
52 |
United Kingdom |
13,941 |
17 |
17 |
0 |
0 |
(13) |
0 |
||||||||
|
53 |
Virgin Islands, British |
232 |
19 |
19 |
0 |
0 |
(0) |
0 |
||||||||
|
54 |
Other countries |
19,887 |
335 |
335 |
0 |
0 |
(27) |
0 |
||||||||
|
55 |
Total |
1,126,302 |
17,364 |
17,335 |
695,463 |
(5,517) |
(376) |
(18) |
||||||||
1 The on-balance sheet exposure includes debt securities and loans and advances.
Credit quality of loans and advances to non-financial corporations by industry
Article 442 (c+e) CRR
Table EU CQ5 provides information about performing and non-performing exposures to non-financial corporations broken down by industry. The industry classification is based on NACE codes. NACE (Nomenclature des Activités Économiques dans la Communauté Européenne) is a European industry standard classification system for classifying business activities.
71
|
Deutsche Bank |
||
|
Pillar 3 Report as of December 31, 2024 |
||
EU CQ5 – Credit quality of loans and advances to non-financial corporations by industry
|
|
Dec 31, 2024 |
||||||||||||||
|
a |
b |
c |
d |
e |
f |
||||||||||
|
Gross carrying amount |
Accumulated |
Accumulated negative changes in fair value due to credit risk on non-performing exposures |
|||||||||||||
|
of which non-performing |
of which loans and advances subject to impairment |
||||||||||||||
|
in € m. |
of which defaulted |
||||||||||||||
|
1 |
Agriculture, forestry and fishing |
427 |
12 |
12 |
427 |
(6) |
0 |
||||||||
|
2 |
Mining and quarrying |
1,950 |
4 |
4 |
1,885 |
(11) |
0 |
||||||||
|
3 |
Manufacturing |
28,408 |
1,378 |
1,376 |
28,362 |
(599) |
0 |
||||||||
|
4 |
Electricity, gas, steam and air conditioning supply |
4,357 |
210 |
210 |
4,357 |
(93) |
0 |
||||||||
|
5 |
Water supply |
598 |
5 |
5 |
598 |
(4) |
0 |
||||||||
|
6 |
Construction |
4,250 |
234 |
234 |
4,250 |
(94) |
0 |
||||||||
|
7 |
Wholesale and retail trade |
22,621 |
730 |
730 |
22,519 |
(379) |
0 |
||||||||
|
8 |
Transport and storage |
5,001 |
279 |
269 |
4,997 |
(57) |
0 |
||||||||
|
9 |
Accommodation and food service activities |
2,695 |
63 |
63 |
2,695 |
(33) |
0 |
||||||||
|
10 |
Information and communication |
9,630 |
212 |
212 |
9,614 |
(79) |
0 |
||||||||
|
11 |
Financial and insurance activities |
44,139 |
1,428 |
1,428 |
43,292 |
(605) |
0 |
||||||||
|
12 |
Real estate activities |
51,127 |
3,840 |
3,839 |
50,980 |
(648) |
(4) |
||||||||
|
13 |
Professional, scientific and technical activities |
7,471 |
223 |
223 |
7,471 |
(103) |
0 |
||||||||
|
14 |
Administrative and support service activities |
9,397 |
237 |
237 |
9,287 |
(74) |
0 |
||||||||
|
15 |
Public administration and defense, compulsory social security |
102 |
0 |
0 |
102 |
(0) |
0 |
||||||||
|
16 |
Education |
295 |
7 |
7 |
295 |
(3) |
0 |
||||||||
|
17 |
Human health services and social work activities |
4,174 |
115 |
115 |
4,173 |
(30) |
0 |
||||||||
|
18 |
Arts, entertainment and recreation |
837 |
11 |
11 |
837 |
(6) |
0 |
||||||||
|
19 |
Other service activities |
13,491 |
385 |
385 |
13,108 |
(161) |
0 |
||||||||
|
20 |
Total |
210,972 |
9,375 |
9,361 |
209,248 |
(2,986) |
(4) |
||||||||
|
|
Jun 30, 2024 |
||||||||||||||
|
a |
b |
c |
d |
e |
f |
||||||||||
|
Gross carrying amount |
Accumulated |
Accumulated negative changes in fair value due to credit risk on non-performing exposures¹ |
|||||||||||||
|
of which non-performing |
of which loans and advances subject to impairment |
||||||||||||||
|
in € m. |
of which defaulted |
||||||||||||||
|
1 |
Agriculture, forestry and fishing |
445 |
15 |
15 |
445 |
(6) |
0 |
||||||||
|
2 |
Mining and quarrying |
2,997 |
8 |
8 |
2,865 |
(11) |
0 |
||||||||
|
3 |
Manufacturing |
30,314 |
1,314 |
1,314 |
30,309 |
(541) |
0 |
||||||||
|
4 |
Electricity, gas, steam and air conditioning supply |
4,456 |
98 |
93 |
4,411 |
(33) |
0 |
||||||||
|
5 |
Water supply |
686 |
5 |
5 |
686 |
(5) |
0 |
||||||||
|
6 |
Construction |
4,481 |
252 |
252 |
4,481 |
(108) |
0 |
||||||||
|
7 |
Wholesale and retail trade |
21,772 |
782 |
782 |
21,661 |
(401) |
0 |
||||||||
|
8 |
Transport and storage |
5,714 |
162 |
160 |
5,704 |
(45) |
0 |
||||||||
|
9 |
Accommodation and food service activities |
1,923 |
67 |
67 |
1,923 |
(34) |
0 |
||||||||
|
10 |
Information and communication |
9,333 |
214 |
214 |
9,313 |
(178) |
0 |
||||||||
|
11 |
Financial and insurance activities |
40,571 |
1,272 |
1,266 |
39,480 |
(435) |
0 |
||||||||
|
12 |
Real estate activities |
50,465 |
3,896 |
3,896 |
50,310 |
(690) |
(4) |
||||||||
|
13 |
Professional, scientific and technical activities |
9,068 |
189 |
189 |
9,068 |
(84) |
0 |
||||||||
|
14 |
Administrative and support service activities |
9,822 |
376 |
376 |
9,653 |
(94) |
0 |
||||||||
|
15 |
Public administration and defense, compulsory social security |
3,329 |
29 |
29 |
521 |
(0) |
0 |
||||||||
|
16 |
Education |
361 |
10 |
10 |
361 |
(3) |
0 |
||||||||
|
17 |
Human health services and social work activities |
4,465 |
38 |
37 |
4,465 |
(27) |
0 |
||||||||
|
18 |
Arts, entertainment and recreation |
934 |
17 |
17 |
934 |
(8) |
0 |
||||||||
|
19 |
Other service activities |
9,317 |
189 |
189 |
9,305 |
(119) |
0 |
||||||||
|
20 |
Total |
210,453 |
8,933 |
8,920 |
205,893 |
(2,822) |
(4) |
||||||||
Performing and non-performing exposures and related provisions
Article 442 (c) CRR
Table EU CR1 provides information about performing and non-performing exposures broken down by Supervisory Reporting counterparty classes.
72
|
Deutsche Bank |
||
|
Pillar 3 Report as of December 31, 2024 |
||
EU CR1 - Performing and non-performing exposures and related provisions
|
|
Dec 31, 2024 |
|||||||||||||||||||||||||||||
|
a |
b |
c |
d |
e |
f |
g |
h |
i |
j |
k |
l |
m |
n |
o |
||||||||||||||||
|
Gross carrying amount/nominal amount |
Accumulated impairment, accumulated negative changes |
|||||||||||||||||||||||||||||
|
Performing exposures |
Non-performing exposures |
Performing exposures - accumulated |
Non-performing exposures - accumulated |
Collaterals and financial |
||||||||||||||||||||||||||
|
in € m. |
Total |
of which: |
of which: |
Total |
of which: |
of which: |
Total |
of which: |
of which: |
Total |
of which: |
of which: |
Accumula- |
performing |
non-performing |
|||||||||||||||
|
Cash balances at central banks and other demand deposits |
151,601 |
145,327 |
6,275 |
47 |
0 |
47 |
(15) |
(4) |
(11) |
0 |
0 |
0 |
0 |
6 |
0 |
|||||||||||||||
|
Loans and advances |
||||||||||||||||||||||||||||||
|
Central banks |
3,041 |
1,264 |
97 |
0 |
0 |
0 |
(0) |
(0) |
(0) |
0 |
0 |
0 |
0 |
2,668 |
0 |
|||||||||||||||
|
General governments |
16,443 |
13,842 |
609 |
645 |
0 |
645 |
(22) |
(17) |
(5) |
(31) |
0 |
(31) |
0 |
4,979 |
594 |
|||||||||||||||
|
Credit institutions |
52,500 |
41,808 |
221 |
4 |
0 |
0 |
(3) |
(3) |
(0) |
0 |
0 |
0 |
0 |
34,378 |
0 |
|||||||||||||||
|
Other financial corporations |
231,943 |
136,092 |
4,064 |
1,033 |
0 |
944 |
(54) |
(39) |
(15) |
(115) |
0 |
(114) |
(1) |
149,718 |
502 |
|||||||||||||||
|
Non-financial corporations |
201,598 |
169,401 |
30,636 |
9,375 |
14 |
8,859 |
(432) |
(182) |
(250) |
(2,558) |
(0) |
(2,433) |
(285) |
111,798 |
4,421 |
|||||||||||||||
|
of which: SMEs |
42,931 |
32,759 |
10,069 |
3,645 |
4 |
3,555 |
(111) |
(37) |
(74) |
(691) |
(0) |
(685) |
(96) |
31,072 |
2,238 |
|||||||||||||||
|
Households |
194,706 |
172,742 |
21,964 |
4,882 |
7 |
4,874 |
(669) |
(200) |
(469) |
(1,837) |
(0) |
(1,836) |
(11) |
146,625 |
2,496 |
|||||||||||||||
|
Total Loans and advances |
700,231 |
535,150 |
57,591 |
15,938 |
20 |
15,322 |
(1,181) |
(441) |
(740) |
(4,541) |
(0) |
(4,414) |
(297) |
450,167 |
8,014 |
|||||||||||||||
|
Debt securities |
||||||||||||||||||||||||||||||
|
Central banks |
3,087 |
3,087 |
0 |
0 |
0 |
0 |
(0) |
(0) |
0 |
0 |
0 |
0 |
0 |
0 |
0 |
|||||||||||||||
|
General governments |
43,769 |
38,645 |
4,535 |
1 |
0 |
0 |
(13) |
(10) |
(2) |
0 |
0 |
0 |
0 |
198 |
0 |
|||||||||||||||
|
Credit institutions |
1,869 |
1,848 |
0 |
0 |
0 |
0 |
(0) |
(0) |
0 |
0 |
0 |
0 |
0 |
32 |
0 |
|||||||||||||||
|
Other financial corporations |
6,013 |
5,015 |
328 |
41 |
0 |
25 |
(22) |
(1) |
(21) |
(19) |
0 |
(6) |
0 |
518 |
0 |
|||||||||||||||
|
Non-financial corporations |
3,852 |
1,892 |
290 |
174 |
0 |
48 |
(7) |
(6) |
(2) |
(5) |
0 |
(5) |
(4) |
1,224 |
111 |
|||||||||||||||
|
Total Debt securities |
58,590 |
50,487 |
5,153 |
216 |
0 |
73 |
(43) |
(18) |
(25) |
(24) |
0 |
(11) |
(4) |
1,973 |
111 |
|||||||||||||||
|
|
||||||||||||||||||||||||||||||
|
Central banks |
71 |
70 |
2 |
0 |
0 |
0 |
(0) |
(0) |
(0) |
0 |
0 |
0 |
0 |
65 |
0 |
|||||||||||||||
|
General governments |
8,477 |
8,153 |
324 |
222 |
0 |
222 |
(4) |
(3) |
(1) |
(5) |
0 |
(5) |
0 |
213 |
15 |
|||||||||||||||
|
Credit institutions |
9,390 |
9,297 |
92 |
0 |
0 |
0 |
(1) |
(1) |
(0) |
0 |
0 |
0 |
0 |
1,681 |
0 |
|||||||||||||||
|
Other financial corporations |
63,783 |
62,514 |
1,269 |
318 |
0 |
318 |
(17) |
(14) |
(3) |
(9) |
0 |
(9) |
0 |
14,276 |
73 |
|||||||||||||||
|
Non-financial corporations |
233,754 |
218,905 |
14,849 |
1,872 |
14 |
1,851 |
(154) |
(83) |
(70) |
(129) |
(0) |
(129) |
0 |
23,779 |
212 |
|||||||||||||||
|
Households |
20,628 |
19,057 |
1,571 |
119 |
0 |
119 |
(13) |
(5) |
(8) |
(31) |
(0) |
(31) |
0 |
3,628 |
79 |
|||||||||||||||
|
Total Off-balance sheet exposures |
336,103 |
317,996 |
18,107 |
2,531 |
14 |
2,510 |
(189) |
(107) |
(82) |
(173) |
(0) |
(173) |
0 |
43,642 |
379 |
|||||||||||||||
|
Total¹ |
1,246,525 |
1,048,958 |
87,126 |
18,732 |
34 |
17,952 |
(1,428) |
(570) |
(858) |
(4,738) |
(0) |
(4,599) |
(301) |
495,787 |
8,504 |
|||||||||||||||
1 Total including Cash balances at central banks and other demand deposits.
73
|
Deutsche Bank |
||
|
Pillar 3 Report as of December 31, 2024 |
||
|
|
Jun 30, 2024 |
|||||||||||||||||||||||||||||
|
a |
b |
c |
d |
e |
f |
g |
h |
i |
j |
k |
l |
m |
n |
o |
||||||||||||||||
|
Gross carrying amount/nominal amount |
Accumulated impairment, accumulated negative changes |
|||||||||||||||||||||||||||||
|
Performing exposures |
Non-performing exposures |
Performing exposures - accumulated |
Non-performing exposures - accumulated |
Collaterals and financial |
||||||||||||||||||||||||||
|
in € m. |
Total |
of which: |
of which: |
Total |
of which: |
of which: |
Total |
of which: |
of which: |
Total |
of which: |
of which: |
Accumula- |
performing |
non-performing |
|||||||||||||||
|
Cash balances at central banks and other demand deposits |
154,031 |
153,003 |
1,028 |
52 |
0 |
52 |
(9) |
(3) |
(7) |
0 |
0 |
0 |
0 |
49 |
0 |
|||||||||||||||
|
Loans and advances |
||||||||||||||||||||||||||||||
|
Central banks |
6,101 |
2,474 |
95 |
0 |
0 |
0 |
(1) |
(0) |
(0) |
0 |
0 |
0 |
0 |
5,396 |
0 |
|||||||||||||||
|
General governments |
28,114 |
23,565 |
529 |
716 |
0 |
687 |
(5) |
(5) |
(1) |
(38) |
0 |
(38) |
0 |
6,988 |
626 |
|||||||||||||||
|
Credit institutions |
56,707 |
44,847 |
2,218 |
14 |
0 |
11 |
(4) |
(3) |
(1) |
(1) |
0 |
(1) |
0 |
20,431 |
0 |
|||||||||||||||
|
Other financial corporations |
228,396 |
147,403 |
4,147 |
1,009 |
0 |
781 |
(74) |
(51) |
(23) |
(208) |
(0) |
(175) |
(6) |
128,365 |
339 |
|||||||||||||||
|
Non-financial corporations |
201,519 |
165,954 |
31,268 |
8,933 |
14 |
8,316 |
(486) |
(200) |
(286) |
(2,340) |
(0) |
(2,249) |
(135) |
109,141 |
4,332 |
|||||||||||||||
|
of which: SMEs |
42,956 |
31,687 |
11,182 |
3,389 |
10 |
3,347 |
(154) |
(29) |
(124) |
(782) |
(0) |
(779) |
(33) |
32,862 |
1,918 |
|||||||||||||||
|
Households |
204,193 |
184,988 |
19,205 |
4,636 |
62 |
4,571 |
(616) |
(196) |
(420) |
(1,721) |
(2) |
(1,717) |
(12) |
149,598 |
2,213 |
|||||||||||||||
|
Total Loans and advances |
725,030 |
569,231 |
57,461 |
15,308 |
76 |
14,366 |
(1,186) |
(455) |
(731) |
(4,308) |
(2) |
(4,179) |
(152) |
419,918 |
7,510 |
|||||||||||||||
|
|
||||||||||||||||||||||||||||||
|
Central banks |
2,643 |
2,643 |
0 |
0 |
0 |
0 |
(0) |
(0) |
0 |
0 |
0 |
0 |
0 |
0 |
0 |
|||||||||||||||
|
General governments |
41,588 |
40,816 |
76 |
0 |
0 |
0 |
(9) |
(8) |
(1) |
0 |
0 |
0 |
0 |
520 |
0 |
|||||||||||||||
|
Credit institutions |
2,605 |
2,589 |
0 |
0 |
0 |
0 |
(0) |
(0) |
0 |
0 |
0 |
0 |
0 |
0 |
0 |
|||||||||||||||
|
Other financial corporations |
6,834 |
5,168 |
336 |
35 |
0 |
21 |
(6) |
(1) |
(5) |
(16) |
0 |
(3) |
0 |
764 |
0 |
|||||||||||||||
|
Non-financial corporations |
3,295 |
2,053 |
55 |
39 |
0 |
15 |
(5) |
(4) |
(0) |
(5) |
0 |
(5) |
0 |
1,403 |
0 |
|||||||||||||||
|
Total Debt securities |
56,964 |
53,269 |
467 |
74 |
0 |
35 |
(20) |
(14) |
(6) |
(21) |
0 |
(8) |
0 |
2,687 |
0 |
|||||||||||||||
|
|
||||||||||||||||||||||||||||||
|
Central banks |
150 |
150 |
0 |
0 |
0 |
0 |
(0) |
(0) |
0 |
0 |
0 |
0 |
0 |
134 |
0 |
|||||||||||||||
|
General governments |
6,901 |
6,771 |
130 |
221 |
0 |
221 |
(1) |
(1) |
(0) |
(4) |
0 |
(4) |
0 |
125 |
0 |
|||||||||||||||
|
Credit institutions |
9,274 |
9,262 |
11 |
0 |
0 |
0 |
(1) |
(1) |
(0) |
0 |
0 |
0 |
0 |
554 |
0 |
|||||||||||||||
|
Other financial corporations |
56,494 |
54,489 |
2,005 |
161 |
0 |
161 |
(20) |
(15) |
(5) |
(7) |
0 |
(7) |
0 |
12,034 |
15 |
|||||||||||||||
|
Non-financial corporations |
228,398 |
209,964 |
18,434 |
1,426 |
0 |
1,419 |
(154) |
(91) |
(63) |
(125) |
0 |
(125) |
0 |
24,031 |
162 |
|||||||||||||||
|
Households |
25,728 |
23,738 |
1,989 |
173 |
0 |
173 |
(32) |
(18) |
(14) |
(32) |
(0) |
(32) |
0 |
5,965 |
112 |
|||||||||||||||
|
Total Off-balance sheet exposures |
326,944 |
304,374 |
22,570 |
1,982 |
0 |
1,975 |
(208) |
(126) |
(83) |
(167) |
(0) |
(167) |
0 |
42,843 |
289 |
|||||||||||||||
|
Total¹ |
1,262,969 |
1,079,877 |
81,526 |
17,416 |
76 |
16,428 |
(1,423) |
(597) |
(826) |
(4,497) |
(2) |
(4,355) |
(152) |
465,497 |
7,799 |
|||||||||||||||
1 Total including Cash balances at central banks and other demand deposits.
74
|
Deutsche Bank |
||
|
Pillar 3 Report as of December 31, 2024 |
||
Credit quality of performing and non-performing exposures by days past due
Article 442 (c-d) CRR
Table EU CQ3 provides information about performing and non-performing exposures by days past due broken down by Supervisory Reporting counterparty classes.
75
|
Deutsche Bank |
||
|
Pillar 3 Report as of December 31, 2024 |
||
EU CQ3 – Credit quality of performing and non-performing exposures by past due days
|
|
Dec 31, 2024 |
||||||||||||||||||||||||
|
a |
b |
c |
d |
e |
f |
g |
h |
i |
j |
k |
l |
||||||||||||||
|
Performing exposures |
Non-performing exposure |
||||||||||||||||||||||||
|
in € m. |
Total |
Not past due |
Past due >30d |
Total |
Unlikely to pay that are not past due or past due <= 90d |
Past due >90d |
Past due >180d |
Past due >1yr |
Past due |
Past due |
Past due |
of which |
|||||||||||||
|
Cash balances at central banks and other demand deposits |
151,601 |
151,240 |
362 |
47 |
47 |
0 |
0 |
0 |
0 |
0 |
0 |
47 |
|||||||||||||
|
Loans and advances |
|||||||||||||||||||||||||
|
Central banks |
3,041 |
3,041 |
0 |
0 |
0 |
0 |
0 |
0 |
0 |
0 |
0 |
0 |
|||||||||||||
|
General governments |
16,443 |
16,440 |
3 |
645 |
385 |
0 |
0 |
46 |
215 |
0 |
0 |
645 |
|||||||||||||
|
Credit institutions |
52,500 |
52,400 |
100 |
4 |
4 |
0 |
0 |
0 |
0 |
0 |
0 |
4 |
|||||||||||||
|
Other financial corporations |
231,943 |
231,542 |
401 |
1,033 |
1,000 |
2 |
5 |
2 |
18 |
5 |
2 |
1,033 |
|||||||||||||
|
Non-financial corporations |
201,598 |
200,870 |
727 |
9,375 |
6,202 |
424 |
847 |
800 |
592 |
309 |
201 |
9,361 |
|||||||||||||
|
of which: |
|||||||||||||||||||||||||
|
SME's |
42,931 |
42,755 |
177 |
3,645 |
2,058 |
205 |
580 |
394 |
166 |
176 |
66 |
3,641 |
|||||||||||||
|
Households |
194,706 |
194,012 |
694 |
4,882 |
2,399 |
406 |
674 |
642 |
560 |
83 |
118 |
4,875 |
|||||||||||||
|
Total Loans and advances |
700,231 |
698,305 |
1,926 |
15,938 |
9,990 |
831 |
1,525 |
1,489 |
1,385 |
397 |
320 |
15,918 |
|||||||||||||
|
|
|||||||||||||||||||||||||
|
Central banks |
3,087 |
3,087 |
0 |
0 |
0 |
0 |
0 |
0 |
0 |
0 |
0 |
0 |
|||||||||||||
|
General governments |
43,769 |
43,769 |
0 |
1 |
1 |
0 |
0 |
0 |
0 |
0 |
0 |
1 |
|||||||||||||
|
Credit institutions |
1,869 |
1,869 |
0 |
0 |
0 |
0 |
0 |
0 |
0 |
0 |
0 |
0 |
|||||||||||||
|
Other financial corporations |
6,013 |
6,013 |
0 |
41 |
41 |
0 |
0 |
0 |
0 |
0 |
0 |
41 |
|||||||||||||
|
Non-financial corporations |
3,852 |
3,852 |
0 |
174 |
165 |
0 |
0 |
0 |
9 |
0 |
0 |
174 |
|||||||||||||
|
Total Debt securities |
58,590 |
58,590 |
0 |
216 |
207 |
0 |
0 |
0 |
9 |
0 |
0 |
216 |
|||||||||||||
|
|
|||||||||||||||||||||||||
|
Central banks |
71 |
- |
- |
0 |
- |
- |
- |
- |
- |
- |
- |
0 |
|||||||||||||
|
General governments |
8,477 |
- |
- |
222 |
- |
- |
- |
- |
- |
- |
- |
222 |
|||||||||||||
|
Credit institutions |
9,390 |
- |
- |
0 |
- |
- |
- |
- |
- |
- |
- |
0 |
|||||||||||||
|
Other financial corporations |
63,783 |
- |
- |
318 |
- |
- |
- |
- |
- |
- |
- |
318 |
|||||||||||||
|
Non-financial corporations |
233,754 |
- |
- |
1,872 |
- |
- |
- |
- |
- |
- |
- |
1,858 |
|||||||||||||
|
Households |
20,628 |
- |
- |
119 |
- |
- |
- |
- |
- |
- |
- |
119 |
|||||||||||||
|
Total Off-balance sheet exposures |
336,103 |
- |
- |
2,531 |
- |
- |
- |
- |
- |
- |
- |
2,517 |
|||||||||||||
|
Total¹ |
1,246,525 |
908,134 |
2,288 |
18,732 |
10,244 |
831 |
1,525 |
1,489 |
1,395 |
397 |
320 |
18,698 |
|||||||||||||
1 Total including Cash balances at central banks and other demand deposits.
76
|
Deutsche Bank |
||
|
Pillar 3 Report as of December 31, 2024 |
||
|
|
Jun 30, 2024 |
||||||||||||||||||||||||
|
a |
b |
c |
d |
e |
f |
g |
h |
i |
j |
k |
l |
||||||||||||||
|
Performing exposures |
Non-performing exposure |
||||||||||||||||||||||||
|
in € m. |
Total |
Not past due |
Past due >30d |
Total |
Unlikely to pay that are not past due or past due <= 90d |
Past due >90d |
Past due >180d |
Past due >1yr |
Past due |
Past due |
Past due |
of which |
|||||||||||||
|
Cash balances at central banks and other demand deposits |
154,031 |
153,285 |
746 |
52 |
52 |
0 |
0 |
0 |
0 |
0 |
0 |
52 |
|||||||||||||
|
Loans and advances |
|||||||||||||||||||||||||
|
Central banks |
6,101 |
6,101 |
0 |
0 |
0 |
0 |
0 |
0 |
0 |
0 |
0 |
0 |
|||||||||||||
|
General governments |
28,114 |
28,109 |
4 |
716 |
604 |
0 |
0 |
112 |
0 |
0 |
0 |
716 |
|||||||||||||
|
Credit institutions |
56,707 |
56,707 |
0 |
14 |
14 |
0 |
0 |
0 |
0 |
0 |
0 |
14 |
|||||||||||||
|
Other financial corporations |
228,396 |
228,305 |
91 |
1,009 |
822 |
4 |
32 |
68 |
3 |
80 |
1 |
1,009 |
|||||||||||||
|
Non-financial corporations |
201,519 |
201,260 |
259 |
8,933 |
6,344 |
449 |
656 |
804 |
379 |
95 |
206 |
8,920 |
|||||||||||||
|
of which: |
|||||||||||||||||||||||||
|
SME's |
42,956 |
42,905 |
51 |
3,389 |
2,195 |
221 |
404 |
282 |
158 |
44 |
85 |
3,379 |
|||||||||||||
|
Households |
204,193 |
203,548 |
645 |
4,636 |
2,073 |
389 |
630 |
491 |
764 |
164 |
126 |
4,621 |
|||||||||||||
|
Total Loans and advances |
725,030 |
724,030 |
1,000 |
15,308 |
9,857 |
843 |
1,318 |
1,474 |
1,145 |
339 |
333 |
15,279 |
|||||||||||||
|
|
|||||||||||||||||||||||||
|
Central banks |
2,643 |
2,643 |
0 |
0 |
0 |
0 |
0 |
0 |
0 |
0 |
0 |
0 |
|||||||||||||
|
General governments |
41,588 |
41,588 |
0 |
0 |
0 |
0 |
0 |
0 |
0 |
0 |
0 |
0 |
|||||||||||||
|
Credit institutions |
2,605 |
2,605 |
0 |
0 |
0 |
0 |
0 |
0 |
0 |
0 |
0 |
0 |
|||||||||||||
|
Other financial corporations |
6,834 |
6,834 |
0 |
35 |
35 |
0 |
0 |
0 |
0 |
0 |
0 |
35 |
|||||||||||||
|
Non-financial corporations |
3,295 |
3,295 |
0 |
39 |
30 |
0 |
0 |
0 |
9 |
0 |
0 |
39 |
|||||||||||||
|
Total Debt securities |
56,964 |
56,964 |
0 |
74 |
65 |
0 |
0 |
0 |
9 |
0 |
0 |
74 |
|||||||||||||
|
|
|||||||||||||||||||||||||
|
Central banks |
150 |
- |
- |
0 |
- |
- |
- |
- |
- |
- |
- |
0 |
|||||||||||||
|
General governments |
6,901 |
- |
- |
221 |
- |
- |
- |
- |
- |
- |
- |
221 |
|||||||||||||
|
Credit institutions |
9,274 |
- |
- |
0 |
- |
- |
- |
- |
- |
- |
- |
0 |
|||||||||||||
|
Other financial corporations |
56,494 |
- |
- |
161 |
- |
- |
- |
- |
- |
- |
- |
161 |
|||||||||||||
|
Non-financial corporations |
228,398 |
- |
- |
1,426 |
- |
- |
- |
- |
- |
- |
- |
1,426 |
|||||||||||||
|
Households |
25,728 |
- |
- |
173 |
- |
- |
- |
- |
- |
- |
- |
173 |
|||||||||||||
|
Total Off-balance sheet exposures |
326,944 |
- |
- |
1,982 |
- |
- |
- |
- |
- |
- |
- |
1,982 |
|||||||||||||
|
Total¹ |
1,262,969 |
934,279 |
1,746 |
17,416 |
9,974 |
843 |
1,318 |
1,474 |
1,154 |
339 |
333 |
17,387 |
|||||||||||||
1 Total including Cash balances at central banks and other demand deposits.
77
|
Deutsche Bank |
||
|
Pillar 3 Report as of December 31, 2024 |
||
Development of non-performing loans and advances
Article 442 (f) CRR
EU CR2 – Changes in the stock of non-performing loans and advances
|
|
Dec 31, 2024 |
Jun 30, 2024 |
|||||
|
a |
a |
||||||
|
in € m. |
Gross carrying amount |
Gross carrying amount |
|||||
|
1 |
Initial stock of non-performing loans and advances |
15,308 |
13,960 |
||||
|
2 |
Inflows to non-performing portfolios |
4,077 |
3,729 |
||||
|
3 |
Outflows from non-performing portfolios |
(3,447) |
(2,381) |
||||
|
4 |
Outflows due to write-offs |
(615) |
(620) |
||||
|
5 |
Outflow due to other situations¹ |
(2,832) |
(1,761) |
||||
|
6 |
Final stock of non-performing loans and advances |
15,938 |
15,308 |
||||
1 Inflows and outflows include restructurings and modifications
Credit quality of forborne exposures
Article 442 (c) CRR
Exposures are being classified as forborne according to the criteria in Article 47b of the CRR.
EU CQ1 – Credit quality of forborne exposures
|
|
Dec 31, 2024 |
|||||||||||||||
|
a |
b |
c |
d |
e |
f |
g |
h |
|||||||||
|
Gross carrying amount of forborne exposures |
Accumulated impairment, |
Collateral received and financial guarantees received on forborne exposures |
||||||||||||||
|
in € m. |
Performing |
Non-performing |
Non-performing |
Non-performing |
on performing |
on non-perfor- |
Total |
of which, non- |
||||||||
|
Cash balances at central banks and other demand deposits |
0 |
0 |
0 |
0 |
0 |
0 |
0 |
0 |
||||||||
|
Loans and advances |
9,423 |
5,893 |
5,873 |
5,766 |
(87) |
(1,498) |
10,107 |
2,940 |
||||||||
|
Central banks |
0 |
0 |
0 |
0 |
0 |
0 |
0 |
0 |
||||||||
|
General governments |
7 |
3 |
3 |
3 |
(0) |
(0) |
10 |
3 |
||||||||
|
Credit institutions |
0 |
0 |
0 |
0 |
0 |
0 |
0 |
0 |
||||||||
|
Other financial corporations |
266 |
497 |
497 |
497 |
(1) |
(32) |
545 |
314 |
||||||||
|
Non-financial corporations |
7,666 |
4,723 |
4,710 |
4,603 |
(50) |
(1,239) |
8,470 |
2,281 |
||||||||
|
Households |
1,484 |
669 |
662 |
662 |
(37) |
(227) |
1,082 |
343 |
||||||||
|
Debt securities |
141 |
9 |
9 |
9 |
(0) |
(1) |
141 |
0 |
||||||||
|
Loan commitments given |
1,649 |
502 |
494 |
494 |
(7) |
(41) |
329 |
42 |
||||||||
|
Total¹ |
11,213 |
6,405 |
6,376 |
6,269 |
(94) |
(1,540) |
10,578 |
2,982 |
||||||||
1 Total including Cash balances at central banks and other demand deposits.
78
|
Deutsche Bank |
||
|
Pillar 3 Report as of December 31, 2024 |
||
|
|
Jun 30, 2024 |
|||||||||||||||
|
a |
b |
c |
d |
e |
f |
g |
h |
|||||||||
|
Gross carrying amount of forborne exposures |
Accumulated impairment, |
Collateral received and financial guarantees received on forborne exposures |
||||||||||||||
|
in € m. |
Performing |
Non-performing |
Non-performing |
Non-performing |
on performing |
on non-perfor- |
Total |
of which, non- |
||||||||
|
Cash balances at central banks and other demand deposits |
0 |
0 |
0 |
0 |
0 |
0 |
0 |
0 |
||||||||
|
Loans and advances |
9,536 |
5,055 |
5,033 |
4,867 |
(117) |
(1,251) |
9,573 |
2,573 |
||||||||
|
Central banks |
0 |
0 |
0 |
0 |
0 |
0 |
0 |
0 |
||||||||
|
General governments |
8 |
1 |
1 |
1 |
(0) |
(0) |
8 |
0 |
||||||||
|
Credit institutions |
0 |
0 |
0 |
0 |
0 |
0 |
0 |
0 |
||||||||
|
Other financial corporations |
192 |
399 |
399 |
399 |
(1) |
(30) |
426 |
250 |
||||||||
|
Non-financial corporations |
7,317 |
3,842 |
3,833 |
3,667 |
(79) |
(981) |
7,414 |
1,827 |
||||||||
|
Households |
2,019 |
813 |
801 |
801 |
(38) |
(240) |
1,725 |
496 |
||||||||
|
Debt securities |
141 |
9 |
9 |
9 |
(0) |
(1) |
140 |
0 |
||||||||
|
Loan commitments given |
1,751 |
403 |
403 |
403 |
(10) |
(45) |
339 |
36 |
||||||||
|
Total¹ |
11,427 |
5,467 |
5,445 |
5,279 |
(127) |
(1,297) |
10,052 |
2,609 |
||||||||
1 Total including Cash balances at central banks and other demand deposits.
Minimum loss coverage for non-performing exposure
Minimum loss coverage for non-performing exposure under Pillar 1
On April 25, 2019 the European Commission published the amendment on Regulation (EU) 2019/630 on minimum loss coverage on non-performing exposure. This regulation established a prudential treatment for NPEs arising from loans originated from April 26, 2019 onwards (“CRR – new NPE’s originated after April 26, 2019”) and represents a Pillar 1 measure which is legally binding and applies to all banks established in the EU.
The CRR regulation on minimum loss coverage for non-performing exposure does not focus on NPEs arising from loans originated before April 26, 2019 (“CRR - NPE Stock”).
The following table provides an overview on Deutsche Bank’s CRR – new NPE’s originated after April 26, 2019 as of December 31, 2024 and June 30, 2024.
CRR – new NPE’s originated after April 26, 2019
|
|
Dec 31, 2024 |
|||||||
|
Time passed since exposures classified as non-performing |
|
|||||||
|
in € m. |
up to 2yrs |
>2 and <=9yrs |
>9yrs |
Total |
||||
|
Non-Performing Exposure |
8,131 |
2,515 |
0 |
10,646 |
||||
|
Exposure value¹ |
9,404 |
2,776 |
0 |
12,180 |
||||
|
Total minimum coverage requirement |
0 |
1,029 |
0 |
1,029 |
||||
|
Total provisions and adjustments or deductions (uncapped) |
2,828 |
1,408 |
0 |
4,236 |
||||
|
Total provisions and adjustments or deductions (capped) |
0 |
791 |
0 |
791 |
||||
|
Applicable amount of insufficient coverage |
0 |
239 |
0 |
239 |
||||
1 Exposure value in accordance with Article 47c CRR
|
|
Jun 30, 2024 |
|||||||
|
Time passed since exposures classified as non-performing |
||||||||
|
in € m. |
up to 2yrs |
>2 and <=9yrs |
>9yrs |
Total |
||||
|
Non-Performing Exposure |
6,982 |
1,510 |
0 |
8,492 |
||||
|
Exposure value¹ |
8,349 |
1,839 |
0 |
10,188 |
||||
|
Total minimum coverage requirement |
0 |
932 |
0 |
932 |
||||
|
Total provisions and adjustments or deductions (uncapped) |
2,399 |
1,058 |
0 |
3,457 |
||||
|
Total provisions and adjustments or deductions (capped) |
0 |
682 |
0 |
682 |
||||
|
Applicable amount of insufficient coverage |
0 |
250 |
0 |
250 |
||||
1 Exposure value in accordance with Article 47c CRR
79
|
Deutsche Bank |
||
|
Pillar 3 Report as of December 31, 2024 |
||
Minimum loss coverage for non-performing exposure under Pillar 2
Non-performing exposures arising from clients defaulting after April 1, 2018
In March 2018 ECB published its “Addendum to the ECB Guidance to banks on non-performing loans: supervisory expectations for prudential provisioning of non-performing exposures”. The guidance focuses on NPEs arising from clients defaulting after April 1, 2018 (“ECB – new NPE’s after April 1, 2018”). Like for the CRR – new NPE’s originated after April 26, 2019 a time dependent minimum loss coverage is required. The ECB guidance represents a Pillar 2 measure and its application is subject to a supervisory dialog between the bank and the ECB in context of the annual SREP process.
The ECB – new NPE’s after April 1, 2018 and the CRR – new NPE’s originated after April 26, 2019 differ in the following three key aspects:
– Timing of application: Exposures defaulting after April 1, 2018 are in scope of the ECB – new NPE’s after April 1, 2018, but are only in scope of the CRR – new NPE’s originated after April 26, 2019, if loans are originated after April 26, 2019
– Treatment of loans in the trading book / traded assets: the CRR – new NPE’s originated after April 26, 2019 excludes all loans in the regulatory trading book whereas the ECB – new NPE’s after April 1, 2018 excludes traded assets in accordance with the accounting classifications
– Treatment of Forbearance Measuring: the CRR – new NPE’s originated after April 26, 2019 considers a one year freeze period of minimum loss coverage for exposures where a forbearance measure has been granted. This freeze period for loans with forbearance measure does not exist under the ECB – new NPE’s after April 1, 2018
As long as the aforementioned differences exist, Deutsche Bank will report in the following table all NPE exposures under the ECB – new NPE’s after April 1, 2018, which are not covered in the CRR – new NPE’s originated after April 26, 2019.
The following table provides an overview on Deutsche Bank’s ECB – new NPE’s after April 1, 2018 as of December 31, 2024 and June 30, 2024, not reflected within the CRR – new NPE’s originated after April 26, 2019:
ECB – new NPE’s after April 1, 2018
|
|
Dec 31, 2024 |
|||||||
|
Time passed since exposures classified as non-performing |
||||||||
|
in € m. |
up to 2yrs |
>2 and <=9yrs |
>9yrs |
Total |
||||
|
Non-Performing Exposure |
4,489 |
2,623 |
0 |
7,112 |
||||
|
Exposure value¹ |
4,721 |
2,553 |
0 |
7,274 |
||||
|
Total minimum coverage requirement |
0 |
1,305 |
0 |
1,305 |
||||
|
Total provisions and adjustments or deductions (uncapped) |
1,193 |
1,909 |
0 |
3,103 |
||||
|
Total provisions and adjustments or deductions (capped) |
0 |
1,283 |
0 |
1,283 |
||||
|
Applicable amount of insufficient coverage |
0 |
22 |
0 |
22 |
||||
1 Exposure value in accordance with Article 47c CRR
|
|
Jun 30, 2024 |
|||||||
|
Time passed since exposures classified as non-performing |
||||||||
|
in € m. |
up to 2yrs |
>2 and <=9yrs |
>9yrs |
Total |
||||
|
Non-Performing Exposure |
5,159 |
2,682 |
0 |
7,841 |
||||
|
Exposure value¹ |
5,287 |
2,666 |
0 |
7,953 |
||||
|
Total minimum coverage requirement |
0 |
1,641 |
0 |
1,641 |
||||
|
Total provisions and adjustments or deductions (uncapped) |
1,288 |
1,820 |
0 |
3,108 |
||||
|
Total provisions and adjustments or deductions (capped) |
0 |
1,620 |
0 |
1,620 |
||||
|
Applicable amount of insufficient coverage |
0 |
21 |
0 |
21 |
||||
1 Exposure value in accordance with Article 47c CRR
Non-performing exposures arising from clients defaulting before April 1, 2018
ECB announced on July 11, 2018 that legacy stock of NPEs would be addressed by discussing bank-specific supervisory expectations for the provisioning of NPEs.
In August 2019, the ECB published its “Communication on supervisory coverage expectations for NPEs” introducing a minimum loss coverage expectation for NPEs arising from clients defaulting before April 1, 2018 (ECB – NPE Stock).
In a first step, banks were allocated to three comparable groups on the basis of the bank’s net NPL ratios at the end of 2017 and in a second step an assessment of capacity regarding the potential impact was carried out for each individual bank with a horizon of end 2026.
Deutsche Bank has been assigned to Group 1, which requires 100% minimum loss coverage by year end 2024 for secured loans and by year end 2023 for unsecured loans.
80
|
Deutsche Bank |
||
|
Pillar 3 Report as of December 31, 2024 |
||
The following table provides an overview on Deutsche Bank’s ECB - NPE Stock as of December 31, 2024 and June 30, 2024.
ECB – NPE Stock
|
|
Dec 31, 2024 |
|||||||
|
Time passed since exposures classified as non-performing |
||||||||
|
in € m. |
up to 2yrs |
>2 and <=9yrs |
>9yrs |
Total |
||||
|
Non-Performing Exposure |
0 |
548 |
427 |
974 |
||||
|
Exposure value¹ |
0 |
1,712 |
1,650 |
3,362 |
||||
|
Total minimum coverage requirement |
0 |
1,353 |
1,647 |
3,000 |
||||
|
Total provisions and adjustments or deductions (uncapped) |
0 |
1,552 |
1,763 |
3,315 |
||||
|
Total provisions and adjustments or deductions (capped) |
0 |
1,343 |
1,616 |
2,959 |
||||
|
Applicable amount of insufficient coverage |
0 |
10 |
31 |
41 |
||||
1 Exposure value in accordance with Article 47c CRR
|
|
Jun 30, 2024 |
||||||||
|
Time passed since exposures classified as non-performing |
|||||||||
|
in € m. |
up to 2yrs |
>2 and <=9yrs |
>9yrs |
Total |
|||||
|
Non-Performing Exposure |
0 |
722 |
361 |
1,083 |
|||||
|
Exposure value¹ |
0 |
2,238 |
1,284 |
3,522 |
|||||
|
Total minimum coverage requirement |
0 |
1,849 |
1,275 |
3,124 |
|||||
|
Total provisions and adjustments or deductions (uncapped) |
0 |
2,034 |
1,286 |
3,320 |
|||||
|
Total provisions and adjustments or deductions (capped) |
0 |
1,837 |
1,244 |
3,082 |
|||||
|
Applicable amount of insufficient coverage |
0 |
12 |
31 |
42 |
|||||
1 Exposure value in accordance with Article 47c CRR
The shortfall between the minimum loss coverage requirements for non-performing exposure for the ECB – new NPE’s after April 1, 2018 and the ECB ‑ NPE Stock and the risk reserves recorded in line with IFRS 9 for defaulted (Stage 3) assets amounted to € 0.3 billion as of December 31, 2024 versus € 0.3 billion as of June 30, 2024 and was deducted from CET 1. This additional CET 1 charge can be considered as additional regulatory loss reserve and led to a € 2.7 billion RWA relief as of December 31, 2024 and € 2.1 billion as of June 30, 2024.
Reconciliation of non-performing exposure
The following table reconciles the non-performing exposure reported in template EU CR1 into the minimum loss coverage framework.
Reconciliation of non-performing exposure
|
|
Dec 31, 2024 |
||||
|
in € m. |
Exposure |
Provisions |
|||
|
Total Non-Performing Exposure and related provisions |
18,732 |
4,738 |
|||
|
of which: |
|||||
|
CRR – new NPE’s originated after April 26, 2019¹ |
10,646 |
1,811 |
|||
|
ECB – new NPE’s after April 1, 2018¹ |
7,112 |
2,465 |
|||
|
ECB – NPE Stock |
974 |
463 |
|||
1 Treatment of loans in the Trading Book / Traded Assets: the CRR – new NPE’s originated after April 26, 2019 exclude all loans in the regulatory Trading Book whereas the ECB – new NPE’s after April 1, 2018 exclude Traded Assets in accordance with the accounting classifications
|
|
Jun 30, 2024 |
||||
|
in € m. |
Exposure |
Provisions |
|||
|
Total Non-Performing Exposure and related provisions |
17,416 |
4,497 |
|||
|
of which: |
|||||
|
CRR – new NPE’s originated after April 26, 2019¹ |
8,492 |
1,936 |
|||
|
ECB – new NPE’s after April 1, 2018¹ |
7,841 |
2,098 |
|||
|
ECB – NPE Stock |
1,083 |
463 |
|||
1 Treatment of loans in the Trading Book / Traded Assets: the CRR – new NPE’s originated after April 26, 2019 exclude all loans in the regulatory Trading Book whereas the ECB – new NPE’s after April 1, 2018 exclude Traded Assets in accordance with the accounting classifications
Collateral obtained by taking possession
Article 442 (c) CRR
Table EU CQ7 provides information about the collateral that has been obtained at the reporting date. Collateral obtained by taking possession includes assets that were not pledged by the debtor as collateral but obtained in exchange for the cancellation of debt.
The value at initial recognition reflects the gross carrying amount at the point in time of the initial recognition in the Group’s balance sheet, while accumulated negative changes reflect the difference between the value at initial recognition and the carrying amount at the reporting date.
81
|
Deutsche Bank |
||
|
Pillar 3 Report as of December 31, 2024 |
||
EU CQ7 – Collateral obtained by taking possession and execution processes
|
|
Dec 31, 2024 |
Jun 30, 2024 |
||||||||
|
a |
b |
a |
b |
|||||||
|
Collateral obtained by taking possession |
Collateral obtained by taking possession |
|||||||||
|
in € m. |
Value at initial |
Accumulated |
Value at initial recognition |
Accumulated |
||||||
|
1 |
Property, plant and equipment (PP&E) |
0 |
0 |
0 |
0 |
|||||
|
2 |
Other than PP&E |
292 |
(26) |
38 |
(26) |
|||||
|
3 |
Residential immovable property |
28 |
(19) |
29 |
(21) |
|||||
|
4 |
Commercial immovable property |
264 |
(6) |
9 |
(6) |
|||||
|
5 |
Movable property (auto, shipping, etc.) |
0 |
0 |
0 |
0 |
|||||
|
6 |
Equity and debt instruments |
0 |
0 |
0 |
0 |
|||||
|
7 |
Other |
0 |
0 |
0 |
0 |
|||||
|
8 |
Total |
292 |
(26) |
38 |
(26) |
|||||
General qualitative information on credit risk mitigation
Article 453 (a-e) CRR (EU CRC)
Use of on- and off-balance sheet netting
Article 453 (a) CRR
Netting is applicable to both exchange traded derivatives and OTC derivatives. Netting is also applied to securities financing transactions (e.g. repurchase, securities lending and margin lending transactions) as far as documentation, structure and nature of the risk mitigation allow netting with the underlying credit risk in accordance with applicable law and the bank’s Financial Contracts Netting and Collateral KOD– Legal (“Netting Policy”). While cross-product netting between derivatives and securities financing transactions may be used in certain cases, the bank does not make use of cross-product netting for regulatory purposes.
All exchange traded derivatives are cleared through central counterparties (CCPs), which interpose themselves between the trading entities by becoming the counterparty to each of the entities. Where legally required or where available and to the extent agreed with the bank’s counterparties, Deutsche Bank also uses CCP clearing for its OTC derivative transactions.
The Dodd-Frank Act and related Commodity Futures Trading Commission (CFTC) rules require CCP clearing in the United States for certain standardized OTC derivative transactions, including certain interest rate swaps and index credit default swaps, subject to limited exceptions when facing certain counterparties. The European Regulation (EU) No 648/2012 on OTC Derivatives, Central Counterparties and Trade Repositories (EMIR) and the Commission Delegated Regulations (EU) 2015/2205, (EU) 2015/592 and (EU) 2016/1178 based thereupon introduced mandatory CCP clearing in the EU for certain standardized OTC derivatives transactions. Mandatory CCP clearing in the EU began for certain interest rate derivatives on June 21, 2016 and for certain iTraxx-based credit derivatives and additional interest rate derivatives on February 9, 2017. Article 4 (2) of EMIR authorizes competent authorities to exempt intragroup transactions from mandatory CCP clearing, provided certain requirements, such as full consolidation of the intragroup transactions and the application of an appropriate centralized risk evaluation, measurement and control procedure are met. The bank successfully applied for the clearing exemption for a number of its regulatory consolidated subsidiaries with intragroup derivatives, including e.g., Deutsche Bank Securities Inc. and Deutsche Bank Luxembourg S.A. The extent of the exemptions granted differs as not all entities enter into relevant transaction types subject to the clearing obligation. Of the exempted intragroup relationships, ca. two thirds are relationships where one entity is established in a third country (Third Country Relationship). Third Country Relationships required repeat applications for each new asset class being subject to the clearing obligation; the process took place in the course of 2017. Due to “Brexit”, the status of some group entities has changed from an EU entity to a third country entity, but there has not been an impact for the bank in respect of clearing exemptions. Since 2017, no new clearing exemption application has been filed. EMIR amendments in force since December 24, 2024 change the requirements for intragroup exemptions, but, as a matter of principle, Deutsche Bank will be able to continue the use of pre-existing clearing exemptions.
The rules and regulations of CCPs typically allow for the bilateral set off of all amounts payable on the same day and in the same currency (“payment netting”) thereby reducing the bank’s settlement risk. Depending on the business model applied by the CCP, this payment netting applies either to all of the bank’s derivatives cleared by the CCP or at least to those that form part of the same class of derivatives. Many CCPs’ rules and regulations also provide for the termination, close-out and netting of all cleared transactions upon the CCP’s default (close-out netting), which reduces the bank’s credit risk further. In its risk measurement and risk assessment processes Deutsche Bank applies close-out netting only to the extent Deutsche Bank believes that the relevant CCP’s close-out netting provisions are legally valid and enforceable and enforceable and have been approved in accordance with the bank’s Netting Policy.
In order to reduce the credit risk resulting from OTC derivative transactions, where CCP clearing is not available, Deutsche Bank regularly seeks the execution of standard master agreements with the bank’s counterparties (such as master agreements for derivatives published
82
|
Deutsche Bank |
||
|
Pillar 3 Report as of December 31, 2024 |
||
by the International Swaps and Derivatives Association, Inc. (ISDA) or the “German Master Agreement for Financial Derivative Transactions” sponsored by the German Banking Association). A master agreement, upon the counterparty’s default, allows for the close-out netting of rights and obligations arising under derivative transactions that have been entered into under such an agreement, resulting in a single net claim owed by or to the counterparty. Payment netting may be agreed from time to time with the bank’s counterparties for multiple transactions having the same payment dates (e.g., foreign exchange transactions) pursuant to the terms of master agreement which can reduce the bank’s settlement risk. In its risk measurement and risk assessment processes, Deutsche Bank applies close-out netting only to the extent Deutsche Bank has concluded that the master agreement is legally valid and enforceable in all relevant jurisdictions and the recognition of close-out netting has been approved in accordance with the bank’s Netting Policy.
Deutsche Bank also enters into credit support annexes (CSAs) to master agreements in order to further reduce the bank’s derivatives-related credit risk. These annexes generally provide risk mitigation through periodic, usually daily, margining of the covered exposure. The CSAs also provide for the right to terminate the related derivative transactions upon the counterparty’s failure to honor a margin call. As with netting, when Deutsche Bank believes the annex is enforceable, Deutsche Bank reflects this in its exposure measurement.
Certain CSAs to master agreements provide for rating-dependent triggers, where additional collateral must be pledged if a party’s rating is downgraded. Deutsche Bank also enters into master agreements that provide for an additional termination event upon a party’s rating downgrade. These downgrade provisions in CSAs and master agreements usually apply to both parties but in some agreements may apply to Deutsche Bank only. Deutsche Bank analyzes and monitors its potential contingent payment obligations resulting from a rating downgrade in its stress testing and liquidity coverage ratio approach for liquidity risk on an ongoing basis. For an assessment of the quantitative impact of a downgrading of the bank’s credit rating please refer to table “Stress Testing Results” in the section “Liquidity Risk”.
The Dodd-Frank Act and CFTC rules thereunder, including CFTC rule § 23.504, as well as EMIR and Commission Delegated Regulation based thereon, namely Commission Delegated Regulation (EU) 2016/2251, introduced the mandatory use of master agreements and related CSAs, which must be executed prior to or contemporaneously with entering into an uncleared OTC derivative transaction. Certain documentation is also required by the U.S. margin rules adopted by U.S. prudential regulators. Under the U.S. prudential regulators’ margin rules, Deutsche Bank is required to post and collect initial margin for its derivatives exposures with other derivatives dealers, as well as with the bank’s counterparties that (a) are “financial end users,” as that term is defined in the U.S. margin rules, and (b) have an average daily aggregate notional amount of uncleared swaps, uncleared security-based swaps, foreign exchange forwards and foreign exchange swaps exceeding U.S.$ 8 billion in June, July and August of the previous calendar year. The U.S. margin rules additionally require Deutsche Bank to post and collect variation margin for its derivatives with other derivatives dealers and certain financial end user counterparties. These margin requirements are subject to a U.S.$ 50 million threshold for initial margin, but no threshold for variation margin, with a combined U.S.$ 500,000 minimum transfer amount. The U.S. margin requirements have been in effect for large banks since September 2016, with additional variation margin requirements having come into effect March 1, 2017, and additional initial margin requirements being phased in from September 2017 through September 2022.
Under Commission Delegated Regulation (EU) 2016/2251, which implements the EMIR margin requirements, the CSA must provide for daily valuation and daily variation margining based on a zero threshold and a minimum transfer amount of not more than € 500,000. For large derivative exposures exceeding € 8 billion, initial margin has to be posted as well. The variation margin requirements under EMIR apply as of March 1, 2017; the initial margin requirements originally were subject to a staged phase-in until September 1, 2021. However, legislative changes published on February 17, 2021 extended deadlines into 2022. Under Article 31 of Commission Delegated Regulation (EU) 2016/2251, an EU party may decide to not exchange margin with counterparties in certain non-netting jurisdictions provided certain requirements are met. Pursuant to Article 11 (5) to (10) of EMIR, competent authorities are authorized to exempt intragroup transactions from the margining obligation, provided certain requirements are met. While some of those requirements are the same as for the EMIR clearing exemptions (see above), there are additional requirements such as the absence of any current or foreseen practical or legal impediment to the prompt transfer of funds or repayment of liabilities between intragroup counterparties. The bank is making use of this exemption. The bank has successfully applied for the collateral exemption for some of its regulatory-consolidated subsidiaries with intragroup derivatives, including, e.g., Deutsche Bank Securities Inc. and Deutsche Bank Luxembourg S.A. The bank is allowed to use intragroup exemptions from the EMIR collateral obligation for a number of bilateral intragroup relationships which are published under https://www.db.com/legal-resources/european-market-infrastructure-regulation/intra-group-exemptions-margining. For some bilateral intragroup relationships, the EMIR margining exemption may be used based on Article 11 (5) of EMIR, i.e. without the need for any application, because both entities are established in the same EU Member State. For third country subsidiaries, the intragroup exemption was originally limited until the earlier of June 30, 2022 and four months after the publication of an equivalence decision by the EU Commission under Article 13(2) EMIR, unless, in the case of an equivalence decision being applicable, a follow-up exemption application is made and granted. On February 13, 2023, an amendment to Regulation (EU) 2016/2251 has been published in the Official Journal, which amendment relates to the extension of the exemption end date until June 30, 2025. With the EMIR amendments having entered into force on December 24, 2024 (Regulation (EU) 2024/2987), a so-called “equivalence decision” is no longer a requirement for a margin exemption. As a matter of principle, Deutsche Bank will be able to continue to use pre-existing margin exemptions.
83
|
Deutsche Bank |
||
|
Pillar 3 Report as of December 31, 2024 |
||
Collateral evaluation and management
Article 453 (b) CRR
Deutsche Bank’s processes ensure onboarding of high-quality collateral the bank accepts for risk mitigation purposes and their prudent valuation and management. This includes processes to generally ensure legally effective and enforceable documentation for realizable and measurable collateral assets which are evaluated within the on-boarding process by dedicated internal appraisers or teams with the respective qualification, skills and experience or adequate external valuers mandated in regulated processes. The applied valuations follow generally accepted valuation methods or models. Ongoing correctness of values is monitored by collateral type specific appropriate frequent and event-driven reviews considering relevant risk parameters. Revaluations are applied in cases of identified probable material deteriorations and future monitoring may be adjusted respectively. The assessment of the suitability of collateral for a specific transaction is part of the credit decision and must be undertaken in a conservative way, including collateral haircuts that are applied. Deutsche Bank has collateral type specific haircuts in place which are regularly reviewed and approved. In this regard, Deutsche Bank strives to avoid “wrong-way” risk characteristics where the counterparty’s risk is positively correlated with the risk of deterioration in the collateral value. If collateral with material correlation risk is accepted anyhow, a potential impact on its value is considered conservatively in the valuation. For guarantee collateral, the process for the analysis of the guarantor’s creditworthiness is aligned to the credit assessment process for counterparties.
The valuation of collateral is considered under a liquidation scenario. The liquidation value is equal to the expected proceeds of collateral monetization/realization in a base case scenario, wherein a fair price is achieved through careful preparation and orderly liquidation of the collateral. Collateral can either move in value over time (dynamic value) or not (static value). The dynamic liquidation value generally includes a safety margin or haircut over realizable value to address liquidity and marketability aspects.
The Group assigns a liquidation value to eligible collateral, based on, among other things:
– The market value and / or lending value, notional amount or face value of a collateral as a starting point
– The type of collateral; the currency mismatch, if any, between the secured exposure and the collateral; and a maturity mismatch, if any
– The applicable legal environment or jurisdiction (onshore versus offshore collateral)
– The market liquidity and volatility in relation to agreed termination clauses
– The correlation between the performance of the borrower and the value of the collateral, e.g., in the case of the pledge of a borrower’s own shares or securities (in this case generally full correlation leads to no liquidation value)
– The quality of physical collateral and potential for litigation or environmental risks; and
– A determined collateral type specific haircut (0 – 100 %) reflecting collection risks (i.e. price risks over the average liquidation period and processing/utilization/sales costs) as specified in the respective policies
While climate & environmental risks are already part of applied valuation approaches – specifically for physical collateral like real estate – consideration of available data on energy performance and exposition to physical risk from natural hazards is subject of improved documentation in the respective valuation processes.
Collateral haircut settings are typically based on available historic internal and/or external recovery data (expert opinions may also be used, where appropriate). They also incorporate a forward-looking component in the form of collection and valuation forecast provided by experts within Risk Management. Considering the expected proceeds from the liquidation of the different collateral types, respective value fluctuations, market specific liquidation costs and time applied haircuts vary between 0% to 100%. When data is not sufficiently available or inconclusive, more conservative haircuts than otherwise used must be applied. Haircut settings are reviewed at least annually. Historically validated proceeds from collateral liquidation are also implied respectively in current Loss-Given-Default calculations where market values of collateral instead of liquidation values are applied.
Main types of collateral
Article 453 (c) CRR
Deutsche Bank regularly agrees on collateral to be received from customers that are subject to credit risk or to be provided by third parties agreed by legally effective and enforceable contracts, documented by a written and reasoned legal opinion. Collateral is credit protection in the form of (funded) assigned or pledged assets or (unfunded) third-party obligations that serves to mitigate the inherent risk of credit loss in an exposure, by either substituting the counterparty default risk or improving recoveries in the event of a default. Deutsche Bank generally takes all types of valuable and eligible collateral for its respective businesses but may limit accepted collateral types for specific businesses or regions as customary in the respective market or driven by purpose of efficiency. While collateral can be an alternative source of repayment, it does not replace the necessity of high-quality underwriting standards and a thorough assessment of the debt service ability of the counterparty in line with Article 194 (9) CRR.
84
|
Deutsche Bank |
||
|
Pillar 3 Report as of December 31, 2024 |
||
Deutsche Bank distinguishes between following two types of credit protection approaches:
– Funded credit protection in forms of financial and other collateral, which enables Deutsche Bank to recover all or part of the outstanding exposure by liquidating the collateral asset provided, in cases where the counterparty is unable or unwilling to fulfill its primary obligations; cash collateral, securities (equity, bonds), collateral pledges or assignments of other claims or inventory, movable assets (i.e., plant, machinery, ships and aircraft) and real estate typically fall into this category; all financial collateral is regularly, mostly daily, revalued and measured against the respective credit exposure; the value of other collateral, including real estate, is monitored based upon established processes that include regular reviews or revaluations by internal and/or external experts with appropriate qualification, skills and experience
– Unfunded credit protection in forms of guarantees , which complements the counterparty’s ability to fulfill its obligation under the legal contract and as such is provided by uncorrelated third parties; letters of credit, insurance contracts, export credit insurance, guarantees, credit derivatives and risk participations typically fall into this category; guarantees and strong letters of comfort provided by correlated group members of customers (generally the parent company) are also accepted and considered in approved rating approaches; guarantee collateral with a non-investment grade rating of the guarantor is limited
Main types of guarantor and credit derivative counterparties
Article 453 (d) CRR
Deutsche Bank accepts different types of unfunded credit protection, which complements the counterparty’s ability to fulfill its obligation under the legal contract and as such is provided by uncorrelated third parties with checked creditworthiness. The process for the analysis of the guarantor’s creditworthiness is aligned to the credit assessment process for counterparties. Letters of credit, insurance contracts, export credit insurance, guarantees, credit derivatives and risk participations typically fall into this category. Main guarantor types are banks, export credit agencies and other public-sector undertakings and insurance companies whose obligations are recognized via several methodologies, e.g. substitution of risk parameters approach or modelling approach. Also, corporate clients play an important role in providing declarations of liability. Guarantees and strong letters of comfort provided by correlated group members of customers (generally the parent company) are accepted and considered in approved rating approaches. Guarantee collateral with a non-investment grade rating of the guarantor is limited.
Risk concentrations within credit risk mitigation
Article 453 (e) CRR
Concentrations within credit risk mitigations taken may occur if a number of guarantors and credit derivative providers with similar economic characteristics are engaged in comparable activities with changes in economic or industry conditions affecting their ability to meet contractual obligations. Concentration risk may also occur in collateral portfolios (e.g. multiple claims and receivables against third parties) which are considered conservatively within the valuation process and/or on-site inspections where applicable. Deutsche Bank uses a range of tools and metrics to monitor concentrations in its credit risk mitigating activities and initiate respective actions if deemed necessary.
General quantitative information on credit risk mitigation
Overview of credit risk mitigation techniques
Article 453 (f) CRR
The table EU CR3 below shows a breakdown of unsecured and secured credit risk exposures and credit risk exposures secured by various credit risk mitigants for all loans and debt securities including the carrying amounts of the total population which are in default. Exposures unsecured (column a) represent the carrying amount of credit risk exposures (net of credit risk adjustments) that do not benefit from a credit risk mitigation technique, regardless of whether this technique is recognized in the CRR. Exposures secured (column b) represent the carrying amount of exposures that have at least one credit risk mitigation mechanism (collateral, financial guarantees, credit derivatives) associated with them. Exposure secured by various credit risk mitigants (column c-e) are the carrying amount of exposures (net of credit risk adjustments) partly or totally secured by collateral, financial guarantees and credit derivatives, whereby only the secured portion of the overall exposure is presented. The allocation of the carrying amount of multi-secured exposures to their different credit risk mitigation mechanisms is made by order of priority, starting with the credit risk mitigation mechanism expected to be called first in the event of a loss, and within the limits of the carrying amount primarily observed of the secured exposures. Moreover, no overcollateralization is considered.
85
|
Deutsche Bank |
||
|
Pillar 3 Report as of December 31, 2024 |
||
EU CR3 – Credit Risk Mitigation techniques – Overview
|
|
Dec 31, 2024 |
|||||||||||
|
a |
b |
c |
d |
e |
||||||||
|
in € m. |
Exposures |
Exposures |
Exposures |
Exposures |
Exposures |
|||||||
|
1 |
Total Loans and advances |
403,901 |
458,180 |
412,356 |
45,824 |
0 |
||||||
|
2 |
Total Debt securities |
56,654 |
2,084 |
1,968 |
116 |
0 |
||||||
|
3 |
Total exposures |
460,555 |
460,264 |
414,324 |
45,940 |
0 |
||||||
|
4 |
of which: non-performing |
3,464 |
8,125 |
6,699 |
1,426 |
0 |
||||||
|
5 |
of which: defaulted |
3,444 |
8,116 |
6,690 |
1,426 |
0 |
||||||
|
|
Jun 30, 2024 |
|||||||||||
|
a |
b |
c |
d |
e |
||||||||
|
in € m. |
Exposures |
Exposures |
Exposures |
Exposures |
Exposures |
|||||||
|
1 |
Total Loans and advances |
461,491 |
427,428 |
379,674 |
47,754 |
0 |
||||||
|
2 |
Total Debt securities |
54,309 |
2,687 |
2,243 |
444 |
0 |
||||||
|
3 |
Total exposures |
515,800 |
430,115 |
381,918 |
48,198 |
0 |
||||||
|
4 |
of which: non-performing |
3,543 |
7,510 |
6,035 |
1,475 |
0 |
||||||
|
5 |
of which: defaulted |
3,513 |
7,492 |
6,022 |
1,471 |
0 |
||||||
Secured and unsecured total exposures decreased to € 921 billion in December 2024 compared to 946 billion in June 2024, driven by decrease in unsecured exposure by € 55.2 billion which is partly offset by increase in secured exposure by € 30.1 billion.
86
|
Deutsche Bank |
||
|
Pillar 3 Report as of December 31, 2024 |
||
Credit risk and credit risk mitigation in the standardized approach
Qualitative information on the use of the standardized approach
Deutsche Bank treats a subset of the credit risk exposures within the standardized approach. The standardized approach measures credit risk either pursuant to fixed risk weights, which are regulatory predefined or determined through the application of external ratings.
Certain credit exposures are permanently assigned to the standardized approach, in accordance with Article 150 CRR. These are predominantly exposures to the Federal Republic of Germany and other German public sector entities as well as exposures to central governments of other European Member States that meet the required conditions. These exposures make up the majority of the exposures carried under the standardized approach and receive predominantly a risk weight of zero percent. For internal purposes, however, these exposures are subject to an internal credit assessment and fully integrated in the risk management and economic capital processes.
In line with Article 150 CRR and Section 10 SolvV, Deutsche Bank assigns further exposures permanently to the standardized approach. This population comprises several small-sized portfolios, which are considered to be immaterial on a stand-alone basis for inclusion in the IRBA.
External ratings in the standardized approach and usage of issue rating
Article 444 (a-d) CRR and EU CRD
In order to calculate the regulatory capital requirements under the standardized approach, Deutsche Bank uses eligible external ratings from Standard & Poor’s, Moody’s, Fitch Ratings and in some cases from DBRS. Ratings are applied to all relevant exposure classes in the standardized approach. If more than one rating is available for a specific counterparty, the selection criteria as set out in Article 138 CRR are applied in order to determine the relevant risk weight for the capital calculation.
Given the low volume of exposures covered under the standardized approach and the high percentage of (externally rated) central government exposures therein, Deutsche Bank principally does not consider impacts from inferring issue ratings from issuer ratings.
This information does not need to be disclosed separately as Deutsche Bank complies with the standard association published by EBA.
Quantitative information on the use of the standardized approach
Standardized approach exposure by risk weight before and after credit mitigation
Article 444 (e) CRR and Article 453 (g-i) CRR
The table below shows the credit risk exposure before and post credit conversion factors and credit risk mitigation obtained in the form of eligible financial collateral, guarantees and credit derivatives based on the exposure-at-default (EAD) in the standardized approach as well as related RWA and average risk weights broken down by regulatory exposure classes and a split into on- and off-balance sheet exposures.
87
|
Deutsche Bank |
||
|
Pillar 3 Report as of December 31, 2024 |
||
EU CR4 – Standardized approach – credit risk exposure and credit risk mitigation (CRM) effects
|
|
Dec 31, 2024 |
|||||||||||||
|
a |
b |
c |
d |
e |
f |
|||||||||
|
in € m. |
Exposures before |
Exposures post-CCF and CRM |
RWA and RWA density |
|||||||||||
|
Exposure classes |
On-balance sheet amount |
Off-balance sheet amount |
On-balance sheet amount |
Off-balance sheet amount |
RWA |
RWA density |
||||||||
|
1 |
Central governments or central banks |
86,661 |
308 |
86,761 |
108 |
52 |
0.06% |
|||||||
|
2 |
Regional government or local authorities |
1,183 |
5,413 |
1,183 |
4,028 |
1 |
0.02% |
|||||||
|
3 |
Public sector entities |
622 |
7 |
622 |
1 |
37 |
5.90% |
|||||||
|
4 |
Multilateral development banks |
469 |
0 |
469 |
0 |
0 |
0% |
|||||||
|
5 |
International organizations |
0 |
0 |
0 |
0 |
0 |
0% |
|||||||
|
6 |
Institutions |
98 |
142 |
792 |
89 |
268 |
30.45% |
|||||||
|
7 |
Corporates |
14,054 |
3,170 |
10,911 |
771 |
10,318 |
88.32% |
|||||||
|
8 |
Retail |
2,017 |
1,732 |
1,849 |
196 |
1,440 |
70.42% |
|||||||
|
9 |
Secured by mortgages on immovable property |
4,215 |
0 |
4,068 |
0 |
1,496 |
36.78% |
|||||||
|
10 |
Exposures in default |
1,495 |
53 |
1,331 |
6 |
1,687 |
126.15% |
|||||||
|
11 |
Exposures associated with particularly high risk |
60 |
17 |
55 |
0 |
84 |
150.00% |
|||||||
|
12 |
Covered bonds |
0 |
0 |
0 |
0 |
0 |
0% |
|||||||
|
13 |
Institutions and corporates with a short-term credit assessment |
0 |
0 |
0 |
0 |
0 |
0% |
|||||||
|
14 |
Collective investments undertakings (CIU) |
792 |
9,033 |
792 |
2,424 |
4,282 |
133.18% |
|||||||
|
15 |
Equity |
119 |
0 |
119 |
0 |
119 |
100.00% |
|||||||
|
16 |
Other items |
102 |
0 |
102 |
0 |
30 |
29.17% |
|||||||
|
17 |
Total |
111,887 |
19,874 |
109,055 |
7,624 |
19,814 |
16.98% |
|||||||
|
|
Jun 30, 2024 |
|||||||||||||
|
a |
b |
c |
d |
e |
f |
|||||||||
|
in € m. |
Exposures before |
Exposures post-CCF and CRM |
RWA and RWA density |
|||||||||||
|
Exposure classes |
On-balance sheet amount |
Off-balance sheet amount |
On-balance sheet amount |
Off-balance sheet amount |
RWA |
RWA density |
||||||||
|
1 |
Central governments or central banks |
88,719 |
93 |
88,736 |
2 |
4 |
0% |
|||||||
|
2 |
Regional government or local authorities |
1,233 |
5,399 |
1,232 |
4,029 |
1 |
0.03% |
|||||||
|
3 |
Public sector entities |
713 |
57 |
714 |
0 |
28 |
3.93% |
|||||||
|
4 |
Multilateral development banks |
452 |
0 |
452 |
0 |
0 |
0% |
|||||||
|
5 |
International organizations |
0 |
0 |
0 |
0 |
0 |
0% |
|||||||
|
6 |
Institutions |
165 |
326 |
172 |
71 |
124 |
51.17% |
|||||||
|
7 |
Corporates |
12,707 |
2,114 |
10,572 |
584 |
10,311 |
92.43% |
|||||||
|
8 |
Retail |
1,870 |
1,635 |
1,523 |
138 |
1,171 |
70.50% |
|||||||
|
9 |
Secured by mortgages on immovable property |
3,899 |
0 |
3,743 |
0 |
1,368 |
36.53% |
|||||||
|
10 |
Exposures in default |
1,003 |
16 |
942 |
6 |
1,262 |
133.06% |
|||||||
|
11 |
Items associated with particularly high risk |
45 |
16 |
44 |
1 |
67 |
150.00% |
|||||||
|
12 |
Covered bonds |
0 |
0 |
0 |
0 |
0 |
0% |
|||||||
|
13 |
Claims on institutions and corporates with a short-term credit assessment |
0 |
0 |
0 |
0 |
0 |
0% |
|||||||
|
14 |
Collective investments undertakings (CIU) |
547 |
9,678 |
547 |
2,525 |
4,719 |
153.60% |
|||||||
|
15 |
Equity exposures |
67 |
0 |
67 |
0 |
67 |
100.00% |
|||||||
|
16 |
Other items |
5 |
0 |
5 |
0 |
1 |
20.00% |
|||||||
|
17 |
Total |
111,426 |
19,333 |
108,751 |
7,356 |
19,123 |
16.47% |
|||||||
RWA for credit risk (excluding CCR) in the standardized approach were € 19.8 billion as of December 31, 2024, compared to € 19.1 billion as of June 30, 2024. The increase of € 0.7 billion was mainly driven by increased exposures in exposure classes “exposures in default”, “retail” and “secured by mortgages on immovable property” as well as increased exposures in exposure class “institutions” which were partly offset by lower risk weights. These increases were partly offset by lower risk weights in the exposure class “collective investments undertakings (CIU)” which more than compensated the increased exposures in this exposure class.
In the following tables the EAD per regulatory exposure class are assigned to their standardized risk weights. Deducted or unrated items are split out separately. The exposures are shown after the shift to the exposure class of the protection seller, if applicable.
88
|
Deutsche Bank |
||
|
Pillar 3 Report as of December 31, 2024 |
||
EU CR5 – Standardized approach
|
|
Dec 31, 2024 |
|||||||||||||
|
in € m. |
Risk Weight |
|||||||||||||
|
a |
b |
c |
d |
e |
f |
|||||||||
|
Exposure classes |
0% |
2% |
4% |
10% |
20% |
35% |
||||||||
|
1 |
Central governments or central banks |
86,759 |
0 |
0 |
0 |
36 |
0 |
|||||||
|
2 |
Regional governments or local authorities |
5,205 |
0 |
0 |
0 |
6 |
0 |
|||||||
|
3 |
Public sector entities |
483 |
0 |
0 |
0 |
128 |
0 |
|||||||
|
4 |
Multilateral development banks |
469 |
0 |
0 |
0 |
0 |
0 |
|||||||
|
5 |
International organizations |
0 |
0 |
0 |
0 |
0 |
0 |
|||||||
|
6 |
Institutions |
0 |
0 |
0 |
0 |
748 |
0 |
|||||||
|
7 |
Corporates |
1,070 |
0 |
0 |
0 |
299 |
0 |
|||||||
|
8 |
Retail exposures |
0 |
0 |
0 |
0 |
0 |
183 |
|||||||
|
9 |
Exposures secured by mortgages on immovable property |
0 |
0 |
0 |
0 |
0 |
3,528 |
|||||||
|
10 |
Exposures in default |
0 |
0 |
0 |
0 |
0 |
0 |
|||||||
|
11 |
Exposures associated with particularly high risk |
0 |
0 |
0 |
0 |
0 |
0 |
|||||||
|
12 |
Covered bonds |
0 |
0 |
0 |
0 |
0 |
0 |
|||||||
|
13 |
Exposures to institutions and corporates with a short-term credit assessment |
0 |
0 |
0 |
0 |
0 |
0 |
|||||||
|
14 |
Units or shares in collective investment undertakings (CIU) |
1,700 |
0 |
230 |
0 |
410 |
0 |
|||||||
|
15 |
Equity exposures |
0 |
0 |
0 |
0 |
0 |
0 |
|||||||
|
16 |
Other items |
0 |
0 |
0 |
0 |
90 |
0 |
|||||||
|
17 |
Total |
95,688 |
0 |
230 |
0 |
1,717 |
3,711 |
|||||||
|
|
Dec 31, 2024 |
|||||||||||||
|
in € m. |
Risk Weight |
|||||||||||||
|
g |
h |
i |
j |
k |
l |
|||||||||
|
Exposure classes |
50% |
70% |
75% |
100% |
150% |
250% |
||||||||
|
1 |
Central governments or central banks |
58 |
0 |
0 |
16 |
0 |
0 |
|||||||
|
2 |
Regional governments or local authorities |
0 |
0 |
0 |
0 |
0 |
0 |
|||||||
|
3 |
Public sector entities |
0 |
0 |
0 |
11 |
0 |
0 |
|||||||
|
4 |
Multilateral development banks |
0 |
0 |
0 |
0 |
0 |
0 |
|||||||
|
5 |
International organizations |
0 |
0 |
0 |
0 |
0 |
0 |
|||||||
|
6 |
Institutions |
29 |
0 |
0 |
104 |
0 |
0 |
|||||||
|
7 |
Corporates |
198 |
0 |
0 |
10,051 |
64 |
0 |
|||||||
|
8 |
Retail |
0 |
0 |
1,862 |
0 |
0 |
0 |
|||||||
|
9 |
Secured by mortgages on immovable property |
540 |
0 |
0 |
0 |
0 |
0 |
|||||||
|
10 |
Exposures in default |
0 |
0 |
0 |
638 |
699 |
0 |
|||||||
|
11 |
Items associated with particularly high risk |
0 |
0 |
0 |
0 |
56 |
0 |
|||||||
|
12 |
Covered bonds |
0 |
0 |
0 |
0 |
0 |
0 |
|||||||
|
13 |
Claims on institutions and corporates with a short-term credit assessment |
0 |
0 |
0 |
0 |
0 |
0 |
|||||||
|
14 |
Collective investments undertakings (CIU) |
52 |
0 |
0 |
418 |
1 |
0 |
|||||||
|
15 |
Equity exposures |
0 |
0 |
0 |
119 |
0 |
0 |
|||||||
|
16 |
Other items |
0 |
0 |
0 |
12 |
0 |
0 |
|||||||
|
17 |
Total |
877 |
0 |
1,862 |
11,369 |
820 |
0 |
|||||||
|
|
Dec 31, 2024 |
|||||||||||
|
in € m. |
Risk Weight |
|||||||||||
|
m |
n |
o |
p |
q |
||||||||
|
Exposure classes |
370% |
1250% |
Others |
Total |
Of which: |
|||||||
|
1 |
Central governments or central banks |
0 |
0 |
0 |
86,870 |
86,870 |
||||||
|
2 |
Regional governments or local authorities |
0 |
0 |
0 |
5,211 |
5,211 |
||||||
|
3 |
Public sector entities |
0 |
0 |
0 |
623 |
614 |
||||||
|
4 |
Multilateral development banks |
0 |
0 |
0 |
469 |
469 |
||||||
|
5 |
International organizations |
0 |
0 |
0 |
0 |
0 |
||||||
|
6 |
Institutions |
0 |
0 |
0 |
881 |
874 |
||||||
|
7 |
Corporates |
0 |
0 |
0 |
11,682 |
11,304 |
||||||
|
8 |
Retail |
0 |
0 |
0 |
2,045 |
2,045 |
||||||
|
9 |
Secured by mortgages on immovable property |
0 |
0 |
0 |
4,068 |
4,068 |
||||||
|
10 |
Exposures in default |
0 |
0 |
0 |
1,337 |
1,337 |
||||||
|
11 |
Items associated with particularly high risk |
0 |
0 |
0 |
56 |
56 |
||||||
|
12 |
Covered bonds |
0 |
0 |
0 |
0 |
0 |
||||||
|
13 |
Claims on institutions and corporates with a short-term credit assessment |
0 |
0 |
0 |
0 |
0 |
||||||
|
14 |
Collective investments undertakings (CIU) |
0 |
271 |
135 |
3,215 |
3,162 |
||||||
|
15 |
Equity exposures |
0 |
0 |
0 |
119 |
119 |
||||||
|
16 |
Other items |
0 |
0 |
0 |
102 |
102 |
||||||
|
17 |
Total |
0 |
271 |
135 |
116,679 |
116,231 |
||||||
89
|
Deutsche Bank |
||
|
Pillar 3 Report as of December 31, 2024 |
||
|
|
Jun 30, 2024 |
|||||||||||||
|
in € m. |
Risk Weight |
|||||||||||||
|
a |
b |
c |
d |
e |
f |
|||||||||
|
Exposure classes |
0% |
2% |
4% |
10% |
20% |
35% |
||||||||
|
1 |
Central governments or central banks |
88,723 |
0 |
0 |
0 |
12 |
0 |
|||||||
|
2 |
Regional governments or local authorities |
5,257 |
0 |
0 |
0 |
5 |
0 |
|||||||
|
3 |
Public sector entities |
578 |
0 |
0 |
0 |
134 |
0 |
|||||||
|
4 |
Multilateral development banks |
452 |
0 |
0 |
0 |
0 |
0 |
|||||||
|
5 |
International organizations |
0 |
0 |
0 |
0 |
0 |
0 |
|||||||
|
6 |
Institutions |
0 |
0 |
0 |
0 |
145 |
0 |
|||||||
|
7 |
Corporates |
40 |
0 |
0 |
0 |
841 |
0 |
|||||||
|
8 |
Retail |
0 |
0 |
0 |
0 |
0 |
187 |
|||||||
|
9 |
Secured by mortgages on immovable property |
0 |
0 |
0 |
0 |
0 |
3,306 |
|||||||
|
10 |
Exposures in default |
0 |
0 |
0 |
0 |
0 |
0 |
|||||||
|
11 |
Items associated with particularly high risk |
0 |
0 |
0 |
0 |
0 |
0 |
|||||||
|
12 |
Covered bonds |
0 |
0 |
0 |
0 |
0 |
0 |
|||||||
|
13 |
Claims on institutions and corporates with a short-term credit assessment |
0 |
0 |
0 |
0 |
0 |
0 |
|||||||
|
14 |
Collective investments undertakings (CIU) |
1,571 |
0 |
187 |
0 |
338 |
0 |
|||||||
|
15 |
Equity exposures |
0 |
0 |
0 |
0 |
0 |
0 |
|||||||
|
16 |
Other items |
0 |
0 |
0 |
0 |
5 |
0 |
|||||||
|
17 |
Total |
96,620 |
0 |
187 |
0 |
1,479 |
3,493 |
|||||||
|
|
Jun 30, 2024 |
|||||||||||||
|
in € m. |
Risk Weight |
|||||||||||||
|
g |
h |
i |
j |
k |
l |
|||||||||
|
Exposure classes |
50% |
70% |
75% |
100% |
150% |
250% |
||||||||
|
1 |
Central governments or central banks |
4 |
0 |
0 |
0 |
0 |
0 |
|||||||
|
2 |
Regional governments or local authorities |
0 |
0 |
0 |
0 |
0 |
0 |
|||||||
|
3 |
Public sector entities |
2 |
0 |
0 |
0 |
0 |
0 |
|||||||
|
4 |
Multilateral development banks |
0 |
0 |
0 |
0 |
0 |
0 |
|||||||
|
5 |
International organizations |
0 |
0 |
0 |
0 |
0 |
0 |
|||||||
|
6 |
Institutions |
5 |
0 |
0 |
93 |
0 |
0 |
|||||||
|
7 |
Corporates |
215 |
0 |
0 |
10,031 |
25 |
0 |
|||||||
|
8 |
Retail |
0 |
0 |
1,474 |
0 |
0 |
0 |
|||||||
|
9 |
Secured by mortgages on immovable property |
437 |
0 |
0 |
0 |
0 |
0 |
|||||||
|
10 |
Exposures in default |
0 |
0 |
0 |
321 |
627 |
0 |
|||||||
|
11 |
Items associated with particularly high risk |
0 |
0 |
0 |
0 |
45 |
0 |
|||||||
|
12 |
Covered bonds |
0 |
0 |
0 |
0 |
0 |
0 |
|||||||
|
13 |
Claims on institutions and corporates with a short-term credit assessment |
0 |
0 |
0 |
0 |
0 |
0 |
|||||||
|
14 |
Collective investments undertakings (CIU) |
27 |
0 |
0 |
349 |
1 |
0 |
|||||||
|
15 |
Equity exposures |
0 |
0 |
0 |
67 |
0 |
0 |
|||||||
|
16 |
Other items |
0 |
0 |
0 |
0 |
0 |
0 |
|||||||
|
17 |
Total |
691 |
0 |
1,474 |
10,862 |
697 |
0 |
|||||||
|
|
Jun 30, 2024 |
||||||||||||
|
in € m. |
Risk Weight |
||||||||||||
|
m |
n |
o |
p |
q |
|||||||||
|
Exposure classes |
370% |
1250% |
Others |
Total |
Of which: |
||||||||
|
1 |
Central governments or central banks |
0 |
0 |
0 |
88,738 |
88,738 |
|||||||
|
2 |
Regional governments or local authorities |
0 |
0 |
0 |
5,262 |
5,262 |
|||||||
|
3 |
Public sector entities |
0 |
0 |
0 |
714 |
612 |
|||||||
|
4 |
Multilateral development banks |
0 |
0 |
0 |
452 |
452 |
|||||||
|
5 |
International organizations |
0 |
0 |
0 |
0 |
0 |
|||||||
|
6 |
Institutions |
0 |
0 |
0 |
243 |
234 |
|||||||
|
7 |
Corporates |
0 |
4 |
0 |
11,156 |
11,036 |
|||||||
|
8 |
Retail |
0 |
0 |
0 |
1,661 |
1,661 |
|||||||
|
9 |
Secured by mortgages on immovable property |
0 |
0 |
0 |
3,743 |
3,743 |
|||||||
|
10 |
Exposures in default |
0 |
0 |
0 |
948 |
948 |
|||||||
|
11 |
Items associated with particularly high risk |
0 |
0 |
0 |
45 |
45 |
|||||||
|
12 |
Covered bonds |
0 |
0 |
0 |
0 |
0 |
|||||||
|
13 |
Claims on institutions and corporates with a short-term credit assessment |
0 |
0 |
0 |
0 |
0 |
|||||||
|
14 |
Collective investments undertakings (CIU) |
0 |
263 |
337 |
3,072 |
3,024 |
|||||||
|
15 |
Equity exposures |
0 |
0 |
0 |
67 |
67 |
|||||||
|
16 |
Other items |
0 |
0 |
0 |
5 |
5 |
|||||||
|
17 |
Total |
0 |
267 |
337 |
116,107 |
115,827 |
|||||||
90
|
Deutsche Bank |
||
|
Pillar 3 Report as of December 31, 2024 |
||
Credit risk exposure and credit risk mitigation in the internal-rating-based approach
Qualitative information on the use of the IRB approach
Approval status for IRB approaches
Article 452 (a) CRR
For the majority of the Group’s credit portfolios, the bank applies the advanced IRBA to calculate the regulatory capital requirements according to the CRR/CRD 4 framework, based on respective approvals received from BaFin and ECB. Overall, IRB approved models cover all of the bank’s material exposures in the IRB eligible exposure classes “Central governments and central banks”, “Institutions”, “Corporates”, and “Retail”.
As an IRB institution, Deutsche Bank is required to treat specific equity positions and other non-credit obligation assets generally within the IRB. For these exposure types typically regulatory defined IRB risk weights are applied.
The Group’s exposures reported under foundation IRB include parts of former Postbank’s corporate portfolios, which partially receive regulatory risk weights using the so-called ‘supervisory slotting criteria’ approach. Further details of the Foundation Approach are provided in the section “Foundation Internal Ratings Based Approach”.
At Group level, the bank assigns a few portfolios to the standardized approach. Details of the standardized approach and the standardized approach exposures are discussed in the section “Credit risk and credit risk mitigation in the standardized approach” within this report.
The bank is in regular exchange with ECB on model enhancements, changes in the IRB model landscape and other model related changes that are monitored jointly with ECB based on a model map.
Details on the number of IRB approved models and their performance are shown in the section “Model Validation Results”.
Scope of the use of IRB and SA approaches
Article 452 (b) CRR (EU CRE)
The table EU CR6-A below shows exposures and percentages covered by the IRB and standardized approaches, also showing exposures subject to the permanent partial use. It splits the exposures further down into the major regulatory exposure classes. Differences between the exposure value as defined in Art. 166 CRR and the total exposure value for exposures subject to the standardized approach and to the IRB approach following the leverage exposure approach are explained in the leverage section of this report.
91
|
Deutsche Bank |
||
|
Pillar 3 Report as of December 31, 2024 |
||
EU CR6-A - Scope of the use of IRB and SA approaches
|
|
Dec 31, 2024 |
|||||||||||
|
a |
b |
c |
d |
e |
||||||||
|
in € m. (unless stated otherwise) |
Exposure value as defined in Article 166 CRR for exposures subject to IRB approach |
Total exposure value for exposures subject to the Standardized approach and to the IRB approach |
Percentage of total exposure value subject to the permanent partial use of the SA |
Percentage of total exposure value subject to IRB Approach |
Percentage of total exposure value subject to a roll-out plan |
|||||||
|
1 |
Central governments or central banks |
128,696 |
205,981 |
43 |
57 |
0 |
||||||
|
of which: |
||||||||||||
|
1.1 |
Regional governments or local authorities |
- |
1,353 |
100 |
0 |
0 |
||||||
|
1.2 |
Public sector entities |
- |
691 |
100 |
0 |
0 |
||||||
|
2 |
Institutions |
15,331 |
13,860 |
1 |
99 |
0 |
||||||
|
3 |
Corporates |
329,598 |
389,488 |
4 |
96 |
0 |
||||||
|
of which: |
||||||||||||
|
3.1 |
Corporates - Specialised lending, excluding slotting approach |
- |
52,882 |
0 |
100 |
0 |
||||||
|
3.2 |
Corporates - Specialised lending under slotting approach |
- |
486 |
0 |
100 |
0 |
||||||
|
4 |
Retail |
212,024 |
203,497 |
3 |
97 |
0 |
||||||
|
of which: |
||||||||||||
|
4.1 |
Retail – Secured by real estate SMEs |
- |
983 |
0 |
100 |
0 |
||||||
|
4.2 |
Retail – Secured by real estate non-SMEs |
- |
160,471 |
0 |
100 |
0 |
||||||
|
4.3 |
Retail – Qualifying revolving |
- |
1,989 |
0 |
100 |
0 |
||||||
|
4.4 |
Retail – Other SMEs |
- |
4,395 |
0 |
100 |
0 |
||||||
|
4.5 |
Retail – Other non-SMEs |
- |
29,912 |
0 |
100 |
0 |
||||||
|
5 |
Equity |
5,069 |
4,041 |
3 |
97 |
0 |
||||||
|
6 |
Other non-credit obligation assets |
11,056 |
10,340 |
0 |
100 |
0 |
||||||
|
7 |
Total |
701,774 |
827,207 |
14 |
86 |
0 |
||||||
|
|
Dec 31, 2023 |
|||||||||||
|
a |
b |
c |
d |
e |
||||||||
|
in € m. (unless stated otherwise) |
Exposure value as defined in Article 166 CRR for exposures subject to IRB approach |
Total exposure value for exposures subject to the Standardized approach and to the IRB approach |
Percentage of total exposure value subject to the permanent partial use of the SA |
Percentage of total exposure value subject to IRB Approach |
Percentage of total exposure value subject to a roll-out plan |
|||||||
|
1 |
Central governments or central banks |
121,047 |
229,483 |
50 |
50 |
0 |
||||||
|
of which: |
||||||||||||
|
1.1 |
Regional governments or local authorities |
- |
1,623 |
100 |
0 |
0 |
||||||
|
1.2 |
Public sector entities |
- |
509 |
100 |
0 |
0 |
||||||
|
2 |
Institutions |
15,163 |
13,536 |
2 |
98 |
0 |
||||||
|
3 |
Corporates |
320,244 |
357,219 |
4 |
96 |
0 |
||||||
|
of which: |
||||||||||||
|
3.1 |
Corporates - Specialised lending, excluding slotting approach |
- |
48,361 |
0 |
100 |
0 |
||||||
|
3.2 |
Corporates - Specialised lending under slotting approach |
- |
722 |
0 |
100 |
0 |
||||||
|
4 |
Retail |
219,675 |
209,408 |
2 |
98 |
0 |
||||||
|
of which: |
||||||||||||
|
4.1 |
Retail – Secured by real estate SMEs |
- |
9,378 |
0 |
100 |
0 |
||||||
|
4.2 |
Retail – Secured by real estate non-SMEs |
- |
160,134 |
0 |
100 |
0 |
||||||
|
4.3 |
Retail – Qualifying revolving |
- |
1,993 |
0 |
100 |
0 |
||||||
|
4.4 |
Retail – Other SMEs |
- |
5,103 |
0 |
100 |
0 |
||||||
|
4.5 |
Retail – Other non-SMEs |
- |
27,702 |
0 |
100 |
0 |
||||||
|
5 |
Equity |
4,362 |
3,526 |
2 |
98 |
0 |
||||||
|
6 |
Other non-credit obligation assets |
10,416 |
8,341 |
0 |
100 |
0 |
||||||
|
7 |
Total |
690,908 |
821,512 |
16 |
84 |
0 |
||||||
Relationship between the risk management function and the internal audit function
Article 452 (c)(i) CRR (EU CRE)
As discussed in the Enterprise Risk Management section “Risk Management structure and organization”, Deutsche Bank’s risk management framework consists of various components and the organizational structures follow the 3LoD model with a clear definition of roles and responsibilities for all risk types.
Group Audit is a part of the 3LoD and an instrument of the Management Board and the Global Head of Group Audit reports administratively to the CEO. Group Audit supports the MB in identifying significant known and emerging weaknesses in the control framework, assessing whether risks, including the potential occurrences of fraud, are appropriately identified and managed. Group Audit is also responsible for assessing the effectiveness and efficiency of risk management, internal controls, governance processes and systems in a holistic and forward-looking manner. Group Audit is not responsible for the design, installation, procedures, or operations of the institution's internal control.
92
|
Deutsche Bank |
||
|
Pillar 3 Report as of December 31, 2024 |
||
Rating system review
Article 452 (c)(ii) CRR (EU CRE)
The 2nd LoD for model risk is Model Risk Management. The Model Risk Management function comprises the Credit Validation unit which performs different types of independent validations across the rating system’s lifecycle in accordance with the standards set in the applicable Model Risk Management Policy.
Procedure of independence between reviewing function and development function
Article 452 (c)(iii) CRR (EU CRE)
A high level of independence of the Model Risk Management function (including the Credit Validation unit) is ensured through organizational set-up independent from the Credit Risk Control Unit (comprising credit model owners and developers). The Head of Model Risk Management reports into the Chief Risk Officer. The independent Credit Validation unit reports into the Head of Model Risk Management.
Procedure to ensure accountability of development and reviewing function
Article 452 (c)(iv) CRR (EU CRE)
The model development function is accountable for reflecting IRB requirements in the design, development and documentation of IRB models. Furthermore, it is accountable to provide model users, model owners and control functions with accurate information on IRB models including relevant assumptions and limitations.
Credit Validation unit as part of Model Risk Management function is accountable for ongoing review of IRB models and assumptions taken in the development of these models.
Group Audit as 3rd LoD is accountable for providing independent and objective assurance on the adequacy of the design, operating effectiveness and efficiency of the risk management system and systems of internal control.
Role of the function in the credit risk model process, scope and main content of credit risk models
Article 452 (d-e) CRR (EU CRE)
Model change process
New model development or changes to existing models are agreed between model developers within DB Group Strategic Analytics and users of the models within CRM. Other departments of the bank are involved as required e.g., to support on the provision of data required for model development or on the implementation of models in production systems.
Changes to existing credit models and introduction of new models are approved by the Regulatory Credit Risk Model Committee chaired by the Head of CRM before the models are used for credit decisions and capital calculation for the first time or before they are significantly changed. Separately, an approval by the Head of Model Risk Management is required. Where appropriate, less significant changes can be approved by a delegate or function under a delegated authority – mainly to the Regulatory Credit Risk Model Forum. Proposals with high impact are recommended for approval to the Group Risk Committee. Regulatory notification or approval may also be required.
The model validation is performed independently of model development by Model Risk Management. The results of the regular validation processes as stipulated by internal policies are brought to the attention of the Regulatory Credit Risk Model Forum and the Regulatory Credit Risk Model Committee, even if the validation results do not lead to a change.
Credit Risk Model reporting
Aggregate model risk for credit risk is reported on a quarterly basis by Model Risk Management in a dedicated credit risk section of the CRO Model Risk Profile report. The main scope of the credit risk section of this report is to inform on model usages in credit risk contributing to or towards a breach of the Group Risk Appetite metrics for model risk related to Model Risk Framework requirements like unapproved model use, material validation findings remediation, and gaps in ongoing performance monitoring.
Significant model risk matters and model risk contribution to Risk Appetite metrics for model risk are outlined by individual model usage. Reported details cover amongst others, key issue for contribution, status of remedial actions, the responsible issue owner and duration of issue since identification. The latter builds the basis for the assessment of application of internal consequences in case remediation exceeds the remediation timeline.
93
|
Deutsche Bank |
||
|
Pillar 3 Report as of December 31, 2024 |
||
Furthermore, there is also a standing agenda item on Credit Risk Models in the Regulatory Credit Risk Model Committee that covers model risk focus topics as well as the status and development and timely remediation of all internal validation findings across all Credit Risk Models.
Internal rating-based approaches
Article 452 (f) CRR (EU CRE)
Advanced Internal Ratings Based Approach
The advanced IRBA is the most sophisticated approach available under the regulatory framework for credit risk and allows us to make use of Deutsche Bank’s internal rating methodologies as well as internal estimates of specific other risk parameters. These methods and parameters represent long-used key components of the internal risk measurement and management process supporting the credit approval process, the economic capital and expected loss calculation and the internal monitoring and reporting of credit risk. The relevant parameters include the probability of default, the loss-given-default and the maturity driving the regulatory risk-weight and the credit conversion factor as part of the regulatory exposure at default estimation. For most of Deutsche Bank’s internal rating systems more than seven years of historical information is available to assess these parameters. Deutsche Bank’s internal rating methodologies aim at point-in-time rather than a through-the-cycle rating.
The probability of default for customers is derived from Deutsche Bank’s internal rating systems. A probability of default is assigned to each relevant counterparty credit exposure as a function of a transparent and consistent 21-grade master rating scale for all of Deutsche Bank’s exposure. The probability of default used for RWA calculation is subject to the regulatory probability of default floor of 3 basis points.
A prerequisite for the development of rating methodologies and the determination of risk parameters is a proper definition, identification and recording of the default event of a customer. A default definition is applied in accordance with the requirements of Article 178 CRR as confirmed by the BaFin and ECB as part of the IRBA approval process. In 2021, modifications to Deutsche Bank’s definition of default reflecting EBA/RTS/2016/06 and EBA/GL/2016/07 were implemented after ECB approval.
The borrower ratings are derived on the grounds of internally developed rating models which specify consistent and distinct customer-relevant criteria and assign a rating grade based on a specific set of criteria as given for a certain customer. The set of criteria is generated from information sets relevant for the respective customer segments like general customer behavior, financial and external data. The methods in use range from statistical scoring models to expert-based models taking into account the relevant available quantitative and qualitative information. For the majority of exposures the statistical scoring or hybrid models combining both approaches are commonly used. Expert-based rating models, calibrated to internal default rates are partially applied for counterparts in the exposure classes “Central governments and central banks”, “Institutions” and “Corporates”. Quantitative rating methodologies are developed based on applicable statistical modeling techniques, such as logistic regression. In line with Article 174 CRR, these models are complemented by human judgment and oversight to review model-based assignments and are intended to ensure that the models are used appropriately. When Deutsche Bank assigns internal risk ratings, it allows the comparison with external risk ratings assigned to Deutsche Bank’s counterparties by the major international rating agencies, where possible, as Deutsche Bank’s internal rating scale has been designed to principally correspond to the external rating scales from rating agencies.
Ratings for central governments and central banks take into account economic, political and sociodemographic indicators, e.g. the political dynamics in a country. The model incorporates relevant aspects covered in the fields of empirical country risk analysis and early warning crisis models to arrive at an overall risk evaluation.
The majority of ratings for “Corporates” and “Institutions” combine quantitative analysis of financial information with qualitative assessments of, inter alia, industry trends, market position and management experience. Financial analysis has a specific focus on cash flow generation and the counterparty’s capability to service its debts, also in comparison to peers. Deutsche Bank supplements the analysis of financials by an internal forecast of the counterparty’s financial profile where deemed to be necessary. For purchased corporate receivables the corporate rating approach is applied. The exposure classes “Central governments”, “Institutions” and “Corporates” hold customer segments which often only have few observed occurrences of defaults, so-called “low default portfolios”. For low-default portfolios, a larger amount of expert judgment enters the rating and related probability of default assignment than for other segments. Such ratings are subject to rigorous reviews by Deutsche Bank’s Asset Quality Review team.
Ratings for SME clients are based on automated sub-ratings for e.g. financial aspects and behaviour on their bank account. Specialized lending is managed by specific credit risk management teams, e.g. for real estate, ship finance or leveraged transactions. Following the individual characteristic of the underlying credit transactions Deutsche Bank have developed bespoke scorecards where appropriate to derive credit ratings.
94
|
Deutsche Bank |
||
|
Pillar 3 Report as of December 31, 2024 |
||
In Deutsche Bank’s retail business, creditworthiness checks and counterparty ratings are generally derived by utilizing an automated decision engine. The decision engine incorporates quantitative aspects (i.e., financial figures), behavioral aspects, credit bureau information (such as SCHUFA in Germany) and general customer data. These input factors are used by the decision engine to determine the creditworthiness of the borrower and, after consideration of collateral, the expected loss. The established rating procedures in Deutsche Bank’s retail business are based on multivariate statistical methods.
They are used to support Deutsche Bank’s individual credit decisions for the retail portfolio as well as to continuously monitor it in an automated fashion. In case elevated risks are identified as part to this monitoring process or new regulatory requirements apply, credit ratings are reviewed.
Although different rating methodologies are applied to the various customer segments in order to properly reflect customer-specific characteristics, they all adhere to the same risk management principles. Credit process policies provide guidance on the classification of customers into the various rating systems.
Drivers for differences between probability of default and actual default rates are described in the section on Article 452 (h).
Deutsche Bank applies internally estimated loss-given-default factors as part of the advanced IRBA capital requirement calculation as approved by the ECB. Loss-given-default is defined as the likely loss intensity in case of a counterparty default. It provides an estimation of the exposure that cannot be recovered in a default event and therefore captures the severity of a loss. Conceptually, loss-given-default estimates are independent of a customer’s probability of default. The loss-given-default models ensure that the main drivers for losses (i.e. different levels and quality of collateralization, customer or product types or seniority of facility) are reflected in specific loss-given-default factors. Deutsche Bank’s loss-given-default parameters are derived from statistical models based on empirical realized loss-given-defaults. In some portfolios, loss-given-default parameters incorporate further available information in addition to empirical loss-given-defaults, in particular for low-default portfolios.
Loss-given-default estimates used for regulatory purposes are estimated to be appropriate for an economic downturn.
As part of the application of the advanced IRBA specific credit conversion factors are applied in order to calculate an exposure at default value. Conceptually the exposure at default is defined as the expected amount of the credit exposure to a counterparty at the time of its default. For advanced IRBA calculation purposes general principles as defined in Article 166 CRR are applied to determine the exposure at default of a transaction. In instances, however, where a transaction involves an unused limit, a percentage share of this unused limit is added to the outstanding amount in order to appropriately reflect the expected outstanding amount in case of a counterparty default. This reflects the assumption that for commitments the utilization at the time of default might be higher than the current utilization. When a transaction involves an additional contingent component (i.e., guarantees) a further percentage share (usage factor) is applied as part of the credit conversion factor model in order to estimate the amount of guarantees drawn in case of default. Where allowed under the advanced IRBA, the credit conversion factors are internally estimated. The calibrations of such parameters are based on statistical analysis of internal historical data and consider customer and product type specifics. As part of the approval process, the ECB assessed Deutsche Bank’s credit conversion factor models and stated their appropriateness for use in the process of regulatory capital requirement calculations.
The exposure at default for Deutsche Bank’s derivatives and securities financing transactions (“SFT”) portfolios are primarily calculated based on the IMM approach as described in the section “Counterparty credit risk” of this report.
Foundation Internal Ratings Based Approach
The foundation IRBA is an approach available under the regulatory framework for credit risk allowing institutions to make use of their internal rating methodologies while using pre-defined regulatory values for all other risk parameters. Parameters subject to internal estimates include the probability of default while the loss-given-default and the credit conversion factor are defined in the regulatory framework.
A probability of default is assigned to each relevant counterparty credit exposure as a function of a transparent and consistent rating master scale. The borrower ratings assigned are derived on the grounds of internally developed rating models which specify consistent and distinct customer-relevant criteria and assign a rating grade based on a specific set of criteria as given for a certain customer following the approaches as outlined for Deutsche Bank’s Advanced IRBA rating systems. Currently the former Postbank rating systems Factoring and Special Rating are reported under the foundation IRBA. For the latter, regulatory risk weights are applied using the so-called ‘supervisory slotting criteria’ approach as defined by Article 153 (5) CRR.
For the foundation IRBA the same default definition is applied as for Advanced IRBA in accordance with the requirements of Article 178 CRR as confirmed by the BaFin and ECB as part of its IRBA approval process.
95
|
Deutsche Bank |
||
|
Pillar 3 Report as of December 31, 2024 |
||
Assignment to regulatory exposure classes
The advanced and foundation IRBA requires differentiating a bank’s credit portfolio into various regulatory defined exposure classes. The relevant regulatory exposure class for each exposure is identified by considering factors like customer-specific characteristics, the rating system used as well as certain materiality thresholds which are regulatory defined.
The simple risk-weight approach according to Article 155 (2) CRR is used for Deutsche Bank’s investments in equity positions. It distinguishes between exposure in equities which are non-exchange traded but sufficiently diversified, exchange-traded and other non-exchange-traded and then uses the regulatory-defined risk weights of 190%, 290% or 370%, respectively. This includes exposures attracting a risk weight of 250% according to Article 48 (4) for significant investments in the CET 1 instruments of financial sector entities which are subject to the threshold exemptions as outlined in Article 48 CRR. Exposures which are assigned to the exposure class “other non-credit obligation assets” receive an IRBA risk weight of 0% in case of cash positions and a risk weight of 100% for all other cases.
For collective investment undertakings a “look through”-approach is applied, where applicable, and the risk weighs are derived based on the underlying positions. In case a look-through approach cannot be applied the fall-back position is to use a risk weight of 1,250%.
Quantitative information on the use of the IRB approach
Foundation IRB exposure
Article 452 (g) (i-v) CRR
The following series of tables details Deutsche Bank´s foundation internal rating based (FIRB) exposures distributed on its internal rating scale for all relevant regulatory exposure classes. The tables exclude the counterparty credit risk position from derivatives and securities financing transactions which are presented separately in the section “Counterparty credit risk” in this report.
The tables show the on-balance sheet as well as the off-balance sheet exposure with their corresponding exposure-weighted credit conversion factors. All undrawn commitment exposure values shown below are assigned to the exposure class of the borrower and not to the exposure class of the counterparty providing Deutsche Bank credit protection.
In addition, the tables provide the exposure post credit risk mitigation (CRM) and credit conversion factor (CCF), where exposures covered by guarantees or credit derivatives are assigned to the protection seller. The exposure post CCF & CRM is presented in conjunction with exposures-weighted average PD, LGD, maturity as well as the RWA and the average risk weight. The tables provide the defaulted exposure separately. Further details in the tables are number of obligors, regulatory expected loss and provisions comprising specific risk adjustments.
96
|
Deutsche Bank |
||
|
Pillar 3 Report as of December 31, 2024 |
||
EU CR6 – FIRB approach – Credit risk exposures by exposure class and PD range
|
|
Dec 31, 2024 |
|||||||||||||||||||||||
|
in € m. |
a |
b |
c |
d |
e |
f |
g |
h |
i |
j |
k |
l |
||||||||||||
|
(unless stated otherwise) |
On-balance sheet exposures |
Off-balance-sheet exposures pre-CCF |
Exposure weighted average CCF |
Exposure post CCF and post CRM |
Exposure weighted average PD (%) |
Number of |
Exposure weighted average LGD (%) |
Exposure weighted average maturity |
Risk weighted exposure amount after supporting factors |
Density of risk weighted exposure amount |
Expected |
Value |
||||||||||||
|
Central governments |
||||||||||||||||||||||||
|
0.00 to <0.15 |
0 |
0 |
0 |
0 |
0 |
0 |
0 |
0 |
0 |
0 |
0 |
0 |
||||||||||||
|
0.00 to <0.10 |
0 |
0 |
0 |
0 |
0 |
0 |
0 |
0 |
0 |
0 |
0 |
0 |
||||||||||||
|
0.10 to <0.15 |
0 |
0 |
0 |
0 |
0 |
0 |
0 |
0 |
0 |
0 |
0 |
0 |
||||||||||||
|
0.15 to <0.25 |
0 |
0 |
0 |
0 |
0 |
0 |
0 |
0 |
0 |
0 |
0 |
0 |
||||||||||||
|
0.25 to <0.50 |
0 |
0 |
0 |
0 |
0 |
0 |
0 |
0 |
0 |
0 |
0 |
0 |
||||||||||||
|
0.50 to <0.75 |
0 |
0 |
0 |
0 |
0 |
0 |
0 |
0 |
0 |
0 |
0 |
0 |
||||||||||||
|
0.75 to <2.50 |
0 |
0 |
0 |
0 |
0 |
0 |
0 |
0 |
0 |
0 |
0 |
0 |
||||||||||||
|
0.75 to <1.75 |
0 |
0 |
0 |
0 |
0 |
0 |
0 |
0 |
0 |
0 |
0 |
0 |
||||||||||||
|
1.75 to <2.5 |
0 |
0 |
0 |
0 |
0 |
0 |
0 |
0 |
0 |
0 |
0 |
0 |
||||||||||||
|
2.50 to <10.00 |
0 |
0 |
0 |
0 |
0 |
0 |
0 |
0 |
0 |
0 |
0 |
0 |
||||||||||||
|
2.50 to <5 |
0 |
0 |
0 |
0 |
0 |
0 |
0 |
0 |
0 |
0 |
0 |
0 |
||||||||||||
|
5 to <10 |
0 |
0 |
0 |
0 |
0 |
0 |
0 |
0 |
0 |
0 |
0 |
0 |
||||||||||||
|
10.00 to <100.00 |
0 |
0 |
0 |
0 |
0 |
0 |
0 |
0 |
0 |
0 |
0 |
0 |
||||||||||||
|
10 to <20 |
0 |
0 |
0 |
0 |
0 |
0 |
0 |
0 |
0 |
0 |
0 |
0 |
||||||||||||
|
20 to <30 |
0 |
0 |
0 |
0 |
0 |
0 |
0 |
0 |
0 |
0 |
0 |
0 |
||||||||||||
|
30.00 to <100.00 |
0 |
0 |
0 |
0 |
0 |
0 |
0 |
0 |
0 |
0 |
0 |
0 |
||||||||||||
|
100.00 (Default) |
0 |
0 |
0 |
0 |
0 |
0 |
0 |
0 |
0 |
0 |
0 |
0 |
||||||||||||
|
Sub-total |
0 |
0 |
0 |
0 |
0 |
0 |
0 |
0 |
0 |
0 |
0 |
0 |
||||||||||||
|
Institutions |
||||||||||||||||||||||||
|
0.00 to <0.15 |
2 |
8 |
0 |
2 |
0.05 |
0.0 |
17.41 |
2.5 |
0 |
9.40 |
0 |
0 |
||||||||||||
|
0.00 to <0.10 |
2 |
7 |
0 |
2 |
0.05 |
0.0 |
17.54 |
2.5 |
0 |
9.22 |
0 |
0 |
||||||||||||
|
0.10 to <0.15 |
0 |
0 |
0 |
0 |
0.11 |
0.0 |
15.66 |
2.5 |
0 |
11.67 |
0 |
0 |
||||||||||||
|
0.15 to <0.25 |
37 |
123 |
0 |
37 |
0.19 |
0.0 |
11.96 |
2.5 |
5 |
12.03 |
0 |
0 |
||||||||||||
|
0.25 to <0.50 |
0 |
0 |
0 |
0 |
0 |
0.0 |
0 |
0 |
0 |
0 |
0 |
0 |
||||||||||||
|
0.50 to <0.75 |
1 |
1 |
0 |
1 |
0.54 |
0.0 |
53.62 |
2.5 |
1 |
90.79 |
0 |
0 |
||||||||||||
|
0.75 to <2.50 |
0 |
0 |
0 |
0 |
0.97 |
0.0 |
24.99 |
2.5 |
0 |
53.85 |
0 |
0 |
||||||||||||
|
0.75 to <1.75 |
0 |
0 |
0 |
0 |
0.97 |
0.0 |
24.99 |
2.5 |
0 |
53.85 |
0 |
0 |
||||||||||||
|
1.75 to <2.5 |
0 |
0 |
0 |
0 |
0 |
0 |
0 |
0 |
0 |
0 |
0 |
0 |
||||||||||||
|
2.50 to <10.00 |
0 |
0 |
0 |
0 |
0 |
0 |
0 |
0 |
0 |
0 |
0 |
0 |
||||||||||||
|
2.50 to <5 |
0 |
0 |
0 |
0 |
0 |
0 |
0 |
0 |
0 |
0 |
0 |
0 |
||||||||||||
|
5 to <10 |
0 |
0 |
0 |
0 |
0 |
0 |
0 |
0 |
0 |
0 |
0 |
0 |
||||||||||||
|
10.00 to <100.00 |
0 |
0 |
0 |
0 |
0 |
0 |
0 |
0 |
0 |
0 |
0 |
0 |
||||||||||||
|
10 to <20 |
0 |
0 |
0 |
0 |
0 |
0 |
0 |
0 |
0 |
0 |
0 |
0 |
||||||||||||
|
20 to <30 |
0 |
0 |
0 |
0 |
0 |
0 |
0 |
0 |
0 |
0 |
0 |
0 |
||||||||||||
|
30.00 to <100.00 |
0 |
0 |
0 |
0 |
0 |
0 |
0 |
0 |
0 |
0 |
0 |
0 |
||||||||||||
|
100.00 (Default) |
0 |
0 |
0 |
0 |
0 |
0 |
0 |
0 |
0 |
0 |
0 |
0 |
||||||||||||
|
Sub-total |
40 |
132 |
0 |
40 |
0.19 |
0.0 |
12.87 |
2.5 |
5 |
13.11 |
0 |
0 |
||||||||||||
97
|
Deutsche Bank |
||
|
Pillar 3 Report as of December 31, 2024 |
||
|
|
Dec 31, 2024 |
|||||||||||||||||||||||
|
in € m. |
a |
b |
c |
d |
e |
f |
g |
h |
i |
j |
k |
l |
||||||||||||
|
(unless stated otherwise) |
On-balance sheet exposures |
Off-balance-sheet exposures pre-CCF |
Exposure weighted average CCF |
Exposure post CCF and post CRM |
Exposure weighted average PD (%) |
Number of |
Exposure weighted average LGD (%) |
Exposure weighted average maturity |
Risk weighted exposure amount after supporting factors |
Density of risk weighted exposure amount |
Expected |
Value |
||||||||||||
|
Corporates |
||||||||||||||||||||||||
|
0.00 to <0.15 |
1,476 |
1,991 |
0 |
1,476 |
0.11 |
1.2 |
11.64 |
2.5 |
133 |
8.98 |
0 |
0 |
||||||||||||
|
0.00 to <0.10 |
408 |
930 |
0 |
408 |
0.07 |
0.6 |
11.83 |
2.5 |
29 |
7.05 |
0 |
0 |
||||||||||||
|
0.10 to <0.15 |
1,068 |
1,062 |
0 |
1,068 |
0.12 |
0.6 |
11.57 |
2.5 |
104 |
9.72 |
0 |
0 |
||||||||||||
|
0.15 to <0.25 |
1,107 |
1,733 |
0 |
1,107 |
0.19 |
0.9 |
11.66 |
2.5 |
138 |
12.46 |
0 |
0 |
||||||||||||
|
0.25 to <0.50 |
1,546 |
1,994 |
0 |
1,546 |
0.33 |
1.2 |
11.55 |
2.5 |
245 |
15.82 |
1 |
0 |
||||||||||||
|
0.50 to <0.75 |
480 |
905 |
0 |
480 |
0.57 |
0.7 |
11.95 |
2.5 |
99 |
20.66 |
0 |
0 |
||||||||||||
|
0.75 to <2.50 |
777 |
946 |
0 |
777 |
1.38 |
1.0 |
11.75 |
2.5 |
213 |
27.37 |
1 |
0 |
||||||||||||
|
0.75 to <1.75 |
574 |
591 |
0 |
574 |
1.05 |
0.8 |
11.77 |
2.5 |
147 |
25.58 |
1 |
0 |
||||||||||||
|
1.75 to <2.5 |
203 |
355 |
0 |
203 |
2.33 |
0.3 |
11.70 |
2.5 |
66 |
32.46 |
1 |
0 |
||||||||||||
|
2.50 to <10.00 |
100 |
101 |
0 |
100 |
4.38 |
0.2 |
12.46 |
2.5 |
41 |
41.45 |
1 |
0 |
||||||||||||
|
2.50 to <5 |
77 |
69 |
0 |
77 |
3.79 |
0.1 |
12.11 |
2.5 |
30 |
38.71 |
0 |
0 |
||||||||||||
|
5 to <10 |
23 |
32 |
0 |
23 |
6.37 |
0.1 |
13.61 |
2.5 |
12 |
50.57 |
0 |
0 |
||||||||||||
|
10.00 to <100.00 |
233 |
117 |
0 |
233 |
28.76 |
0.1 |
11.49 |
2.5 |
156 |
66.87 |
11 |
1 |
||||||||||||
|
10 to <20 |
0 |
10 |
0 |
0 |
13.79 |
0.0 |
16.88 |
2.5 |
0 |
84.59 |
0 |
0 |
||||||||||||
|
20 to <30 |
218 |
101 |
0 |
218 |
28.11 |
0.0 |
11.48 |
2.5 |
146 |
66.91 |
11 |
1 |
||||||||||||
|
30.00 to <100.00 |
15 |
6 |
0 |
15 |
38.53 |
0.0 |
11.61 |
2.5 |
10 |
66.13 |
1 |
0 |
||||||||||||
|
100.00 (Default) |
7 |
1 |
0 |
7 |
100.00 |
0.0 |
62.25 |
2.5 |
0 |
0 |
4 |
0 |
||||||||||||
|
Sub-total |
5,724 |
7,788 |
0 |
5,724 |
1.75 |
5.4 |
11.73 |
2.5 |
1,024 |
17.89 |
19 |
3 |
||||||||||||
|
|
||||||||||||||||||||||||
|
of which: |
||||||||||||||||||||||||
|
SMEs |
||||||||||||||||||||||||
|
0.00 to <0.15 |
28 |
50 |
0 |
28 |
0.09 |
0.3 |
16.92 |
2.5 |
3 |
9.18 |
0 |
0 |
||||||||||||
|
0.00 to <0.10 |
15 |
31 |
0 |
15 |
0.05 |
0.2 |
17.26 |
2.5 |
1 |
7.09 |
0 |
0 |
||||||||||||
|
0.10 to <0.15 |
13 |
19 |
0 |
13 |
0.13 |
0.1 |
16.54 |
2.5 |
2 |
11.54 |
0 |
0 |
||||||||||||
|
0.15 to <0.25 |
21 |
38 |
0 |
21 |
0.22 |
0.2 |
17.95 |
2.5 |
4 |
18.12 |
0 |
0 |
||||||||||||
|
0.25 to <0.50 |
17 |
24 |
0 |
17 |
0.40 |
0.1 |
13.08 |
2.5 |
2 |
14.43 |
0 |
0 |
||||||||||||
|
0.50 to <0.75 |
27 |
37 |
0 |
27 |
0.59 |
0.2 |
17.78 |
2.5 |
8 |
28.18 |
0 |
0 |
||||||||||||
|
0.75 to <2.50 |
96 |
115 |
0 |
96 |
1.94 |
0.3 |
13.06 |
2.5 |
29 |
29.95 |
0 |
0 |
||||||||||||
|
0.75 to <1.75 |
35 |
28 |
0 |
35 |
1.22 |
0.2 |
14.62 |
2.5 |
10 |
28.03 |
0 |
0 |
||||||||||||
|
1.75 to <2.5 |
60 |
87 |
0 |
60 |
2.36 |
0.1 |
12.15 |
2.5 |
19 |
31.08 |
0 |
0 |
||||||||||||
|
2.50 to <10.00 |
23 |
20 |
0 |
23 |
4.17 |
0.1 |
14.88 |
2.5 |
10 |
44.11 |
0 |
0 |
||||||||||||
|
2.50 to <5 |
18 |
13 |
0 |
18 |
3.71 |
0.1 |
13.61 |
2.5 |
7 |
38.57 |
0 |
0 |
||||||||||||
|
5 to <10 |
5 |
7 |
0 |
5 |
5.84 |
0.0 |
19.51 |
2.5 |
3 |
64.18 |
0 |
0 |
||||||||||||
|
10.00 to <100.00 |
167 |
60 |
0 |
167 |
28.23 |
0.0 |
11.49 |
2.5 |
112 |
67.13 |
5 |
0 |
||||||||||||
|
10 to <20 |
0 |
10 |
0 |
0 |
13.79 |
0.0 |
16.88 |
2.5 |
0 |
84.59 |
0 |
0 |
||||||||||||
|
20 to <30 |
167 |
49 |
0 |
167 |
28.24 |
0.0 |
11.48 |
2.5 |
112 |
67.06 |
5 |
0 |
||||||||||||
|
30.00 to <100.00 |
0 |
1 |
0 |
0 |
32.87 |
0.0 |
20.69 |
2.5 |
0 |
120.19 |
0 |
0 |
||||||||||||
|
100.00 (Default) |
0 |
0 |
0 |
0 |
100.00 |
0.0 |
57.85 |
2.5 |
0 |
0 |
0 |
0 |
||||||||||||
|
Sub-total |
379 |
343 |
0 |
379 |
13.30 |
1.3 |
13.38 |
2.5 |
168 |
44.19 |
6 |
1 |
||||||||||||
98
|
Deutsche Bank |
||
|
Pillar 3 Report as of December 31, 2024 |
||
|
|
Dec 31, 2024 |
|||||||||||||||||||||||
|
in € m. |
a |
b |
c |
d |
e |
f |
g |
h |
i |
j |
k |
l |
||||||||||||
|
(unless stated otherwise) |
On-balance sheet exposures |
Off-balance-sheet exposures pre-CCF |
Exposure weighted average CCF |
Exposure post CCF and post CRM |
Exposure weighted average PD (%) |
Number of |
Exposure weighted average LGD (%) |
Exposure weighted average maturity |
Risk weighted exposure amount after supporting factors |
Density of risk weighted exposure amount |
Expected |
Value |
||||||||||||
|
Other |
||||||||||||||||||||||||
|
0.00 to <0.15 |
1,448 |
1,942 |
0 |
1,448 |
0.11 |
0.9 |
11.54 |
2.5 |
130 |
8.98 |
0 |
0 |
||||||||||||
|
0.00 to <0.10 |
393 |
898 |
0 |
393 |
0.07 |
0.4 |
11.62 |
2.5 |
28 |
7.05 |
0 |
0 |
||||||||||||
|
0.10 to <0.15 |
1,055 |
1,043 |
0 |
1,055 |
0.12 |
0.5 |
11.51 |
2.5 |
102 |
9.70 |
0 |
0 |
||||||||||||
|
0.15 to <0.25 |
1,087 |
1,695 |
0 |
1,087 |
0.19 |
0.7 |
11.54 |
2.5 |
134 |
12.35 |
0 |
0 |
||||||||||||
|
0.25 to <0.50 |
1,529 |
1,971 |
0 |
1,529 |
0.33 |
1.1 |
11.53 |
2.5 |
242 |
15.84 |
1 |
0 |
||||||||||||
|
0.50 to <0.75 |
452 |
868 |
0 |
452 |
0.56 |
0.5 |
11.60 |
2.5 |
91 |
20.21 |
0 |
0 |
||||||||||||
|
0.75 to <2.50 |
681 |
831 |
0 |
681 |
1.30 |
0.7 |
11.57 |
2.5 |
184 |
27.01 |
1 |
0 |
||||||||||||
|
0.75 to <1.75 |
539 |
563 |
0 |
539 |
1.04 |
0.6 |
11.59 |
2.5 |
137 |
25.42 |
1 |
0 |
||||||||||||
|
1.75 to <2.5 |
142 |
268 |
0 |
142 |
2.32 |
0.1 |
11.51 |
2.5 |
47 |
33.04 |
0 |
0 |
||||||||||||
|
2.50 to <10.00 |
77 |
81 |
0 |
77 |
4.45 |
0.1 |
11.74 |
2.5 |
31 |
40.66 |
0 |
0 |
||||||||||||
|
2.50 to <5 |
59 |
56 |
0 |
59 |
3.81 |
0.1 |
11.66 |
2.5 |
23 |
38.75 |
0 |
0 |
||||||||||||
|
5 to <10 |
18 |
25 |
0 |
18 |
6.52 |
0.0 |
12.00 |
2.5 |
8 |
46.87 |
0 |
0 |
||||||||||||
|
10.00 to <100.00 |
65 |
57 |
0 |
65 |
30.10 |
0.0 |
11.48 |
2.5 |
43 |
66.21 |
6 |
1 |
||||||||||||
|
10 to <20 |
0 |
0 |
0 |
0 |
0 |
0.0 |
0 |
0 |
0 |
0 |
0 |
0 |
||||||||||||
|
20 to <30 |
51 |
51 |
0 |
51 |
27.68 |
0.0 |
11.48 |
2.5 |
34 |
66.43 |
5 |
0 |
||||||||||||
|
30.00 to <100.00 |
14 |
5 |
0 |
14 |
38.61 |
0.0 |
11.50 |
2.5 |
9 |
65.44 |
1 |
0 |
||||||||||||
|
100.00 (Default) |
7 |
0 |
0 |
7 |
100.00 |
0.0 |
62.31 |
2.5 |
0 |
0 |
4 |
0 |
||||||||||||
|
Sub-total |
5,345 |
7,444 |
0 |
5,345 |
0.93 |
4.0 |
11.61 |
2.5 |
856 |
16.02 |
13 |
2 |
||||||||||||
|
All exposure classes |
||||||||||||||||||||||||
|
Total |
5,765 |
7,920 |
0 |
5,765 |
1.74 |
5.4 |
11.74 |
2.5 |
1,029 |
17.85 |
19 |
3 |
||||||||||||
99
|
Deutsche Bank |
||
|
Pillar 3 Report as of December 31, 2024 |
||
|
|
Jun 30, 2024 |
|||||||||||||||||||||||
|
in € m. |
a |
b |
c |
d |
e |
f |
g |
h |
i |
j |
k |
l |
||||||||||||
|
(unless stated otherwise) |
On-balance sheet exposures |
Off-balance-sheet exposures pre-CCF |
Exposure weighted average CCF |
Exposure post CCF and post CRM |
Exposure weighted average PD (%) |
Number of |
Exposure weighted average LGD (%) |
Exposure weighted average maturity |
Risk weighted exposure amount after supporting factors |
Density of risk weighted exposure amount |
Expected |
Value |
||||||||||||
|
Central governments |
||||||||||||||||||||||||
|
0.00 to <0.15 |
0 |
0 |
0 |
0 |
0.04 |
0.0 |
12.23 |
2.5 |
0 |
4.86 |
0 |
0 |
||||||||||||
|
0.00 to <0.10 |
0 |
0 |
0 |
0 |
0.04 |
0.0 |
12.23 |
2.5 |
0 |
4.86 |
0 |
0 |
||||||||||||
|
0.10 to <0.15 |
0 |
0 |
0 |
0 |
0 |
0 |
0 |
0 |
0 |
0 |
0 |
0 |
||||||||||||
|
0.15 to <0.25 |
0 |
0 |
0 |
0 |
0 |
0 |
0 |
0 |
0 |
0 |
0 |
0 |
||||||||||||
|
0.25 to <0.50 |
0 |
0 |
0 |
0 |
0 |
0 |
0 |
0 |
0 |
0 |
0 |
0 |
||||||||||||
|
0.50 to <0.75 |
0 |
0 |
0 |
0 |
0.69 |
0.0 |
53.62 |
2.5 |
0 |
101.10 |
0 |
0 |
||||||||||||
|
0.75 to <2.50 |
0 |
0 |
0 |
0 |
0 |
0 |
0 |
0 |
0 |
0 |
0 |
0 |
||||||||||||
|
0.75 to <1.75 |
0 |
0 |
0 |
0 |
0 |
0 |
0 |
0 |
0 |
0 |
0 |
0 |
||||||||||||
|
1.75 to <2.5 |
0 |
0 |
0 |
0 |
0 |
0 |
0 |
0 |
0 |
0 |
0 |
0 |
||||||||||||
|
2.50 to <10.00 |
0 |
0 |
0 |
0 |
0 |
0 |
0 |
0 |
0 |
0 |
0 |
0 |
||||||||||||
|
2.50 to <5 |
0 |
0 |
0 |
0 |
0 |
0 |
0 |
0 |
0 |
0 |
0 |
0 |
||||||||||||
|
5 to <10 |
0 |
0 |
0 |
0 |
0 |
0 |
0 |
0 |
0 |
0 |
0 |
0 |
||||||||||||
|
10.00 to <100.00 |
0 |
0 |
0 |
0 |
0 |
0.0 |
0 |
0 |
0 |
0 |
0 |
0 |
||||||||||||
|
10 to <20 |
0 |
0 |
0 |
0 |
0 |
0 |
0 |
0 |
0 |
0 |
0 |
0 |
||||||||||||
|
20 to <30 |
0 |
0 |
0 |
0 |
0 |
0.0 |
0 |
0 |
0 |
0 |
0 |
0 |
||||||||||||
|
30.00 to <100.00 |
0 |
0 |
0 |
0 |
0 |
0 |
0 |
0 |
0 |
0 |
0 |
0 |
||||||||||||
|
100.00 (Default) |
0 |
0 |
0 |
0 |
0 |
0 |
0 |
0 |
0 |
0 |
0 |
0 |
||||||||||||
|
Sub-total |
0 |
0 |
0 |
0 |
0.46 |
0.0 |
38.75 |
2.5 |
0 |
66.52 |
0 |
0 |
||||||||||||
|
Institutions |
||||||||||||||||||||||||
|
0.00 to <0.15 |
2 |
12 |
0 |
2 |
0.08 |
0.0 |
11.59 |
2.5 |
0 |
8.61 |
0 |
0 |
||||||||||||
|
0.00 to <0.10 |
1 |
10 |
0 |
1 |
0.06 |
0.0 |
11.62 |
2.5 |
0 |
7.45 |
0 |
0 |
||||||||||||
|
0.10 to <0.15 |
0 |
2 |
0 |
0 |
0.14 |
0.0 |
11.48 |
2.5 |
0 |
12.93 |
0 |
0 |
||||||||||||
|
0.15 to <0.25 |
33 |
60 |
0 |
33 |
0.19 |
0.0 |
11.50 |
2.5 |
4 |
11.45 |
0 |
0 |
||||||||||||
|
0.25 to <0.50 |
0 |
1 |
0 |
0 |
0.38 |
0.0 |
17.95 |
2.5 |
0 |
25.87 |
0 |
0 |
||||||||||||
|
0.50 to <0.75 |
0 |
0 |
0 |
0 |
0.50 |
0.0 |
97.54 |
2.5 |
0 |
160.21 |
0 |
0 |
||||||||||||
|
0.75 to <2.50 |
0 |
0 |
0 |
0 |
1.23 |
0.0 |
16.88 |
2.5 |
0 |
39.41 |
0 |
0 |
||||||||||||
|
0.75 to <1.75 |
0 |
0 |
0 |
0 |
1.23 |
0.0 |
16.88 |
2.5 |
0 |
39.41 |
0 |
0 |
||||||||||||
|
1.75 to <2.5 |
0 |
0 |
0 |
0 |
0 |
0.0 |
0 |
0 |
0 |
0 |
0 |
0 |
||||||||||||
|
2.50 to <10.00 |
0 |
0 |
0 |
0 |
0 |
0 |
0 |
0 |
0 |
0 |
0 |
0 |
||||||||||||
|
2.50 to <5 |
0 |
0 |
0 |
0 |
0 |
0 |
0 |
0 |
0 |
0 |
0 |
0 |
||||||||||||
|
5 to <10 |
0 |
0 |
0 |
0 |
0 |
0 |
0 |
0 |
0 |
0 |
0 |
0 |
||||||||||||
|
10.00 to <100.00 |
0 |
0 |
0 |
0 |
0 |
0 |
0 |
0 |
0 |
0 |
0 |
0 |
||||||||||||
|
10 to <20 |
0 |
0 |
0 |
0 |
0 |
0 |
0 |
0 |
0 |
0 |
0 |
0 |
||||||||||||
|
20 to <30 |
0 |
0 |
0 |
0 |
0 |
0 |
0 |
0 |
0 |
0 |
0 |
0 |
||||||||||||
|
30.00 to <100.00 |
0 |
0 |
0 |
0 |
0 |
0 |
0 |
0 |
0 |
0 |
0 |
0 |
||||||||||||
|
100.00 (Default) |
0 |
0 |
0 |
0 |
0 |
0 |
0 |
0 |
0 |
0 |
0 |
0 |
||||||||||||
|
Sub-total |
34 |
72 |
0 |
34 |
0.18 |
0.0 |
11.52 |
2.5 |
4 |
11.35 |
0 |
0 |
||||||||||||
100
|
Deutsche Bank |
||
|
Pillar 3 Report as of December 31, 2024 |
||
|
|
Jun 30, 2024 |
|||||||||||||||||||||||
|
in € m. |
a |
b |
c |
d |
e |
f |
g |
h |
i |
j |
k |
l |
||||||||||||
|
(unless stated otherwise) |
On-balance sheet exposures |
Off-balance-sheet exposures pre-CCF |
Exposure weighted average CCF |
Exposure post CCF and post CRM |
Exposure weighted average PD (%) |
Number of |
Exposure weighted average LGD (%) |
Exposure weighted average maturity |
Risk weighted exposure amount after supporting factors |
Density of risk weighted exposure amount |
Expected |
Value |
||||||||||||
|
Corporates |
||||||||||||||||||||||||
|
0.00 to <0.15 |
1,511 |
2,000 |
0.05 |
1,512 |
0.10 |
1.6 |
11.96 |
2.5 |
138 |
9.10 |
0 |
0 |
||||||||||||
|
0.00 to <0.10 |
580 |
956 |
0.01 |
581 |
0.07 |
1.3 |
12.31 |
2.5 |
42 |
7.20 |
0 |
0 |
||||||||||||
|
0.10 to <0.15 |
931 |
1,044 |
0.08 |
931 |
0.12 |
0.4 |
11.74 |
2.5 |
96 |
10.29 |
0 |
0 |
||||||||||||
|
0.15 to <0.25 |
1,245 |
1,850 |
0 |
1,245 |
0.19 |
1.4 |
12.62 |
2.5 |
166 |
13.35 |
0 |
0 |
||||||||||||
|
0.25 to <0.50 |
1,032 |
2,117 |
0 |
1,032 |
0.32 |
2.6 |
14.07 |
2.5 |
197 |
19.08 |
0 |
0 |
||||||||||||
|
0.50 to <0.75 |
755 |
1,176 |
0.04 |
755 |
0.53 |
1.4 |
12.87 |
2.5 |
163 |
21.65 |
1 |
0 |
||||||||||||
|
0.75 to <2.50 |
684 |
1,195 |
0.02 |
685 |
1.43 |
2.1 |
14.73 |
2.5 |
240 |
35.11 |
2 |
0 |
||||||||||||
|
0.75 to <1.75 |
430 |
781 |
0.03 |
431 |
1.03 |
1.2 |
14.56 |
2.5 |
135 |
31.34 |
1 |
0 |
||||||||||||
|
1.75 to <2.5 |
254 |
414 |
0 |
254 |
2.10 |
0.9 |
15.01 |
2.5 |
105 |
41.51 |
1 |
0 |
||||||||||||
|
2.50 to <10.00 |
201 |
251 |
0 |
201 |
4.24 |
1.0 |
14.27 |
2.5 |
95 |
47.04 |
1 |
0 |
||||||||||||
|
2.50 to <5 |
169 |
227 |
0 |
169 |
3.83 |
1.0 |
14.79 |
2.5 |
80 |
47.52 |
1 |
0 |
||||||||||||
|
5 to <10 |
32 |
23 |
0 |
32 |
6.41 |
0.0 |
11.49 |
2.5 |
14 |
44.52 |
0 |
0 |
||||||||||||
|
10.00 to <100.00 |
130 |
170 |
0 |
130 |
20.72 |
0.4 |
24.77 |
2.5 |
185 |
142.52 |
9 |
1 |
||||||||||||
|
10 to <20 |
47 |
19 |
0 |
47 |
17.27 |
0.0 |
11.48 |
2.5 |
38 |
81.39 |
4 |
0 |
||||||||||||
|
20 to <30 |
73 |
136 |
0 |
73 |
20.00 |
0.3 |
35.23 |
2.5 |
141 |
193.43 |
5 |
1 |
||||||||||||
|
30.00 to <100.00 |
11 |
15 |
0 |
11 |
40.90 |
0.0 |
11.51 |
2.5 |
7 |
61.93 |
0 |
0 |
||||||||||||
|
100.00 (Default) |
4 |
1 |
0 |
4 |
100.00 |
0.0 |
34.52 |
2.5 |
0 |
0 |
1 |
1 |
||||||||||||
|
Sub-total |
5,562 |
8,759 |
0.02 |
5,564 |
1.08 |
10.5 |
13.36 |
2.5 |
1,184 |
21.28 |
15 |
3 |
||||||||||||
|
|
||||||||||||||||||||||||
|
of which: |
||||||||||||||||||||||||
|
SMEs |
||||||||||||||||||||||||
|
0.00 to <0.15 |
5 |
19 |
0 |
5 |
0.07 |
0.1 |
39.95 |
2.5 |
1 |
17.46 |
0 |
0 |
||||||||||||
|
0.00 to <0.10 |
4 |
16 |
0 |
4 |
0.07 |
0.1 |
45.91 |
2.5 |
1 |
19.86 |
0 |
0 |
||||||||||||
|
0.10 to <0.15 |
1 |
4 |
0 |
1 |
0.10 |
0.0 |
12.90 |
2.5 |
0 |
6.59 |
0 |
0 |
||||||||||||
|
0.15 to <0.25 |
5 |
15 |
0 |
5 |
0.17 |
0.1 |
22.29 |
2.5 |
1 |
14.21 |
0 |
0 |
||||||||||||
|
0.25 to <0.50 |
13 |
26 |
0 |
13 |
0.35 |
0.2 |
13.35 |
2.5 |
2 |
12.55 |
0 |
0 |
||||||||||||
|
0.50 to <0.75 |
19 |
28 |
0 |
19 |
0.66 |
0.1 |
17.62 |
2.5 |
4 |
23.44 |
0 |
0 |
||||||||||||
|
0.75 to <2.50 |
27 |
47 |
0 |
27 |
1.56 |
0.1 |
12.81 |
2.5 |
7 |
27.35 |
0 |
0 |
||||||||||||
|
0.75 to <1.75 |
16 |
24 |
0 |
16 |
1.19 |
0.1 |
12.31 |
2.5 |
3 |
19.77 |
0 |
0 |
||||||||||||
|
1.75 to <2.5 |
11 |
23 |
0 |
11 |
2.11 |
0.1 |
13.53 |
2.5 |
4 |
38.35 |
0 |
0 |
||||||||||||
|
2.50 to <10.00 |
10 |
25 |
0 |
10 |
3.84 |
0.1 |
14.99 |
2.5 |
3 |
33.30 |
0 |
0 |
||||||||||||
|
2.50 to <5 |
10 |
25 |
0 |
10 |
3.80 |
0.1 |
15.01 |
2.5 |
3 |
33.28 |
0 |
0 |
||||||||||||
|
5 to <10 |
0 |
1 |
0 |
0 |
6.93 |
0.0 |
13.13 |
2.5 |
0 |
34.80 |
0 |
0 |
||||||||||||
|
10.00 to <100.00 |
6 |
11 |
0 |
6 |
25.85 |
0.0 |
35.78 |
2.5 |
9 |
144.34 |
0 |
0 |
||||||||||||
|
10 to <20 |
0 |
0 |
0 |
0 |
15.16 |
0.0 |
16.88 |
2.5 |
0 |
60.44 |
0 |
0 |
||||||||||||
|
20 to <30 |
4 |
10 |
0 |
4 |
20.00 |
0.0 |
44.99 |
2.5 |
8 |
181.21 |
0 |
0 |
||||||||||||
|
30.00 to <100.00 |
2 |
1 |
0 |
2 |
41.33 |
0.0 |
11.54 |
2.5 |
1 |
47.29 |
0 |
0 |
||||||||||||
|
100.00 (Default) |
1 |
0 |
0 |
1 |
100.00 |
0.0 |
21.79 |
2.5 |
0 |
0 |
0 |
0 |
||||||||||||
|
Sub-total |
86 |
171 |
0 |
86 |
3.77 |
0.7 |
18.06 |
2.5 |
27 |
31.49 |
1 |
0 |
||||||||||||
101
|
Deutsche Bank |
||
|
Pillar 3 Report as of December 31, 2024 |
||
|
|
Jun 30, 2024 |
|||||||||||||||||||||||
|
in € m. |
a |
b |
c |
d |
e |
f |
g |
h |
i |
j |
k |
l |
||||||||||||
|
(unless stated otherwise) |
On-balance sheet exposures |
Off-balance-sheet exposures pre-CCF |
Exposure weighted average CCF |
Exposure post CCF and post CRM |
Exposure weighted average PD (%) |
Number of |
Exposure weighted average LGD (%) |
Exposure weighted average maturity |
Risk weighted exposure amount after supporting factors |
Density of risk weighted exposure amount |
Expected |
Value |
||||||||||||
|
Other |
||||||||||||||||||||||||
|
0.00 to <0.15 |
1,506 |
1,980 |
0.05 |
1,507 |
0.10 |
1.5 |
11.87 |
2.5 |
137 |
9.08 |
0 |
0 |
||||||||||||
|
0.00 to <0.10 |
576 |
940 |
0.01 |
576 |
0.07 |
1.2 |
12.07 |
2.5 |
41 |
7.11 |
0 |
0 |
||||||||||||
|
0.10 to <0.15 |
930 |
1,040 |
0.09 |
931 |
0.12 |
0.4 |
11.74 |
2.5 |
96 |
10.29 |
0 |
0 |
||||||||||||
|
0.15 to <0.25 |
1,240 |
1,835 |
0 |
1,240 |
0.19 |
1.3 |
12.58 |
2.5 |
166 |
13.35 |
0 |
0 |
||||||||||||
|
0.25 to <0.50 |
1,020 |
2,091 |
0 |
1,020 |
0.32 |
2.4 |
14.08 |
2.5 |
195 |
19.16 |
0 |
0 |
||||||||||||
|
0.50 to <0.75 |
736 |
1,149 |
0.05 |
737 |
0.53 |
1.3 |
12.75 |
2.5 |
159 |
21.60 |
1 |
0 |
||||||||||||
|
0.75 to <2.50 |
657 |
1,148 |
0.02 |
657 |
1.42 |
2.0 |
14.81 |
2.5 |
233 |
35.43 |
1 |
0 |
||||||||||||
|
0.75 to <1.75 |
414 |
757 |
0.03 |
415 |
1.03 |
1.2 |
14.65 |
2.5 |
132 |
31.79 |
1 |
0 |
||||||||||||
|
1.75 to <2.5 |
243 |
391 |
0 |
243 |
2.10 |
0.8 |
15.08 |
2.5 |
101 |
41.65 |
1 |
0 |
||||||||||||
|
2.50 to <10.00 |
191 |
225 |
0 |
191 |
4.26 |
0.9 |
14.23 |
2.5 |
91 |
47.76 |
1 |
0 |
||||||||||||
|
2.50 to <5 |
159 |
202 |
0 |
159 |
3.83 |
0.9 |
14.77 |
2.5 |
77 |
48.39 |
1 |
0 |
||||||||||||
|
5 to <10 |
32 |
23 |
0 |
32 |
6.41 |
0.0 |
11.48 |
2.5 |
14 |
44.57 |
0 |
0 |
||||||||||||
|
10.00 to <100.00 |
124 |
159 |
0 |
124 |
20.47 |
0.3 |
24.24 |
2.5 |
176 |
142.43 |
9 |
1 |
||||||||||||
|
10 to <20 |
47 |
19 |
0 |
47 |
17.27 |
0.0 |
11.48 |
2.5 |
38 |
81.39 |
4 |
0 |
||||||||||||
|
20 to <30 |
68 |
126 |
0 |
68 |
20.00 |
0.3 |
34.61 |
2.5 |
133 |
194.20 |
5 |
1 |
||||||||||||
|
30.00 to <100.00 |
9 |
14 |
0 |
9 |
40.82 |
0.0 |
11.51 |
2.5 |
6 |
64.62 |
0 |
0 |
||||||||||||
|
100.00 (Default) |
3 |
1 |
0 |
3 |
100.00 |
0.0 |
37.30 |
2.5 |
0 |
0 |
1 |
0 |
||||||||||||
|
Sub-total |
5,477 |
8,588 |
0.02 |
5,478 |
1.04 |
9.9 |
13.29 |
2.5 |
1,157 |
21.12 |
14 |
2 |
||||||||||||
|
All exposure classes |
||||||||||||||||||||||||
|
Total |
5,597 |
8,832 |
0.02 |
5,599 |
1.08 |
10.6 |
13.35 |
2.5 |
1,188 |
21.22 |
15 |
3 |
||||||||||||
102
|
Deutsche Bank |
||
|
Pillar 3 Report as of December 31, 2024 |
||
Advanced IRB exposure
Article 452 (g) (i-v) CRR
The following series of tables details Deutsche Bank´s advanced internal rating based (AIRB) exposures distributed on its internal rating scale for all relevant regulatory exposure classes. The tables exclude the counterparty credit risk position from derivatives and securities financing transactions which are presented separately in the section “Counterparty credit risk” in this report.
The tables show the on-balance sheet as well as the off-balance sheet exposure with their corresponding exposure-weighted credit conversion factors. All undrawn commitment exposure values shown below are assigned to the exposure class of the borrower and not to the exposure class of the counterparty providing Deutsche Bank credit protection.
In addition, the tables provide the exposure post CRM and CCF, where exposures covered by guarantees or credit derivatives are assigned to the protection seller.
The exposure post CCF and CRM is presented in conjunction with exposures-weighted average PD, LGD, maturity as well as the RWA and the average risk weight. The effect of double default, as far as applicable to exposures outside of former Postbank, is considered in the average risk weight. It implies that for a guaranteed exposure a loss only occurs if the primary obligor and the guarantor fail to meet their obligations at the same time. The tables provide the defaulted exposure separately, where Deutsche Bank applies an LGD estimate already incorporating potential unexpected losses in the loss rate estimate as required by Article 181 (1) (h) CRR.
Further details in the tables are number of obligors, regulatory expected loss and provisions comprising specific risk adjustments.
103
|
Deutsche Bank |
||
|
Pillar 3 Report as of December 31, 2024 |
||
EU CR6 – AIRB approach – Credit risk exposures by exposure class and PD range
|
|
Dec 31, 2024 |
|||||||||||||||||||||||
|
in € m. |
a |
b |
c |
d |
e |
f |
g |
h |
i |
j |
k |
l |
||||||||||||
|
(unless stated otherwise) |
On-balance sheet exposures |
Off-balance-sheet exposures pre-CCF |
Exposure weighted average CCF |
Exposure post CCF and post CRM |
Exposure weighted average PD (%) |
Number of |
Exposure weighted average LGD (%) |
Exposure weighted average maturity |
Risk weighted exposure amount after supporting factors |
Density of risk weighted exposure amount |
Expected |
Value |
||||||||||||
|
Central governments |
||||||||||||||||||||||||
|
0.00 to <0.15 |
114,118 |
455 |
34.06 |
126,605 |
0 |
0.1 |
65.18 |
1.4 |
2,093 |
1.65 |
3 |
0 |
||||||||||||
|
0.00 to <0.10 |
113,964 |
455 |
34.06 |
125,917 |
0 |
0.1 |
65.18 |
1.4 |
1,638 |
1.30 |
2 |
0 |
||||||||||||
|
0.10 to <0.15 |
154 |
0 |
20.00 |
688 |
0.14 |
0.0 |
66.56 |
3.9 |
455 |
66.07 |
1 |
0 |
||||||||||||
|
0.15 to <0.25 |
1,090 |
159 |
34.62 |
980 |
0.23 |
0.0 |
66.36 |
1.1 |
521 |
53.15 |
1 |
0 |
||||||||||||
|
0.25 to <0.50 |
1,569 |
304 |
40.13 |
1,412 |
0.39 |
0.0 |
66.56 |
1.0 |
1,002 |
70.91 |
4 |
0 |
||||||||||||
|
0.50 to <0.75 |
743 |
38 |
20.61 |
300 |
0.64 |
0.0 |
69.72 |
2.1 |
259 |
86.06 |
1 |
0 |
||||||||||||
|
0.75 to <2.50 |
6,226 |
810 |
39.64 |
5,081 |
1.68 |
0.0 |
95.32 |
4.5 |
11,690 |
230.07 |
5 |
2 |
||||||||||||
|
0.75 to <1.75 |
631 |
289 |
38.65 |
561 |
1.07 |
0.0 |
66.56 |
0.5 |
514 |
91.67 |
3 |
0 |
||||||||||||
|
1.75 to <2.5 |
5,594 |
521 |
40.19 |
4,520 |
1.76 |
0.0 |
98.89 |
5.0 |
11,176 |
247.23 |
1 |
2 |
||||||||||||
|
2.50 to <10.00 |
2,377 |
794 |
37.21 |
706 |
6.06 |
0.0 |
65.09 |
3.6 |
398 |
56.41 |
4 |
6 |
||||||||||||
|
2.50 to <5 |
1,501 |
582 |
37.09 |
427 |
4.82 |
0.0 |
64.17 |
3.9 |
213 |
50.00 |
2 |
4 |
||||||||||||
|
5 to <10 |
876 |
212 |
37.56 |
280 |
7.95 |
0.0 |
66.48 |
3.1 |
185 |
66.18 |
3 |
2 |
||||||||||||
|
10.00 to <100.00 |
812 |
75 |
40.21 |
601 |
18.06 |
0.0 |
62.79 |
0.7 |
1,819 |
302.60 |
69 |
10 |
||||||||||||
|
10 to <20 |
471 |
75 |
40.21 |
433 |
13.01 |
0.0 |
61.31 |
0.9 |
1,214 |
280.51 |
35 |
1 |
||||||||||||
|
20 to <30 |
0 |
0 |
0 |
0 |
0 |
0.0 |
0 |
0 |
0 |
0 |
0 |
0 |
||||||||||||
|
30.00 to <100.00 |
341 |
0 |
20.00 |
169 |
31.01 |
0.0 |
66.56 |
0.1 |
606 |
359.28 |
35 |
9 |
||||||||||||
|
100.00 (Default) |
675 |
222 |
44.85 |
174 |
100.00 |
0.0 |
98.26 |
3.8 |
73 |
42.21 |
157 |
35 |
||||||||||||
|
Sub-total |
127,610 |
2,857 |
38.02 |
135,860 |
0.31 |
0.2 |
66.37 |
1.5 |
17,855 |
13.14 |
245 |
55 |
||||||||||||
|
Institutions |
||||||||||||||||||||||||
|
0.00 to <0.15 |
9,085 |
7,671 |
32.92 |
13,834 |
0.07 |
0.4 |
51.26 |
1.1 |
1,717 |
12.41 |
3 |
1 |
||||||||||||
|
0.00 to <0.10 |
6,871 |
6,852 |
32.73 |
11,305 |
0.06 |
0.3 |
56.73 |
1.2 |
1,376 |
12.17 |
2 |
0 |
||||||||||||
|
0.10 to <0.15 |
2,214 |
819 |
34.49 |
2,529 |
0.12 |
0.1 |
26.81 |
1.0 |
341 |
13.48 |
1 |
1 |
||||||||||||
|
0.15 to <0.25 |
246 |
357 |
23.80 |
342 |
0.17 |
0.1 |
24.36 |
2.0 |
87 |
25.51 |
0 |
0 |
||||||||||||
|
0.25 to <0.50 |
874 |
990 |
28.97 |
1,143 |
0.36 |
0.1 |
28.53 |
1.1 |
389 |
34.05 |
1 |
1 |
||||||||||||
|
0.50 to <0.75 |
3 |
3 |
81.17 |
5 |
0.68 |
0.0 |
31.83 |
2.6 |
3 |
59.63 |
0 |
0 |
||||||||||||
|
0.75 to <2.50 |
1,891 |
545 |
24.71 |
1,092 |
1.24 |
0.1 |
38.00 |
1.5 |
987 |
90.35 |
7 |
1 |
||||||||||||
|
0.75 to <1.75 |
1,284 |
466 |
25.42 |
934 |
1.10 |
0.1 |
36.81 |
1.4 |
803 |
86.01 |
4 |
0 |
||||||||||||
|
1.75 to <2.5 |
607 |
79 |
20.53 |
158 |
2.09 |
0.0 |
45.03 |
2.1 |
183 |
116.04 |
2 |
0 |
||||||||||||
|
2.50 to <10.00 |
98 |
22 |
29.25 |
77 |
3.57 |
0.0 |
31.01 |
1.0 |
64 |
83.90 |
1 |
0 |
||||||||||||
|
2.50 to <5 |
94 |
11 |
38.15 |
72 |
3.37 |
0.0 |
32.04 |
1.0 |
62 |
85.51 |
1 |
0 |
||||||||||||
|
5 to <10 |
4 |
11 |
20.18 |
5 |
6.68 |
0.0 |
14.75 |
1.3 |
3 |
58.45 |
0 |
0 |
||||||||||||
|
10.00 to <100.00 |
5 |
4 |
20.58 |
2 |
15.41 |
0.0 |
24.56 |
0.1 |
2 |
116.81 |
0 |
0 |
||||||||||||
|
10 to <20 |
5 |
4 |
20.58 |
2 |
15.41 |
0.0 |
24.56 |
0.1 |
2 |
116.80 |
0 |
0 |
||||||||||||
|
20 to <30 |
0 |
0 |
0 |
0 |
29.88 |
0.0 |
61.90 |
0 |
0 |
331.93 |
0 |
0 |
||||||||||||
|
30.00 to <100.00 |
0 |
0 |
100.00 |
0 |
100.00 |
0.0 |
0 |
0.8 |
0 |
0 |
0 |
0 |
||||||||||||
|
100.00 (Default) |
48 |
1 |
40.21 |
1 |
100.00 |
0.0 |
92.34 |
2.4 |
2 |
183.58 |
1 |
0 |
||||||||||||
|
Sub-total |
12,249 |
9,594 |
31.71 |
16,495 |
0.19 |
0.7 |
48.15 |
1.2 |
3,251 |
19.71 |
13 |
3 |
||||||||||||
104
|
Deutsche Bank |
||
|
Pillar 3 Report as of December 31, 2024 |
||
|
|
Dec 31, 2024 |
|||||||||||||||||||||||
|
in € m. |
a |
b |
c |
d |
e |
f |
g |
h |
i |
j |
k |
l |
||||||||||||
|
(unless stated otherwise) |
On-balance sheet exposures |
Off-balance-sheet exposures pre-CCF |
Exposure weighted average CCF |
Exposure post CCF and post CRM |
Exposure weighted average PD (%) |
Number of |
Exposure weighted average LGD (%) |
Exposure weighted average maturity |
Risk weighted exposure amount after supporting factors |
Density of risk weighted exposure amount |
Expected |
Value |
||||||||||||
|
Corporates |
||||||||||||||||||||||||
|
0.00 to <0.15 |
53,621 |
113,170 |
34.93 |
102,258 |
0.08 |
13.8 |
30.21 |
1.9 |
17,641 |
17.25 |
28 |
111 |
||||||||||||
|
0.00 to <0.10 |
33,736 |
70,281 |
33.99 |
63,383 |
0.06 |
9.2 |
30.63 |
2.0 |
9,470 |
14.94 |
13 |
103 |
||||||||||||
|
0.10 to <0.15 |
19,885 |
42,889 |
36.47 |
38,874 |
0.12 |
4.6 |
29.52 |
1.9 |
8,171 |
21.02 |
15 |
7 |
||||||||||||
|
0.15 to <0.25 |
22,498 |
45,487 |
34.72 |
37,744 |
0.19 |
6.3 |
27.84 |
1.9 |
9,302 |
24.65 |
20 |
10 |
||||||||||||
|
0.25 to <0.50 |
34,455 |
35,325 |
34.74 |
43,818 |
0.35 |
8.5 |
29.28 |
2.2 |
16,900 |
38.57 |
49 |
26 |
||||||||||||
|
0.50 to <0.75 |
20,992 |
19,293 |
32.42 |
25,161 |
0.59 |
4.6 |
26.84 |
2.3 |
11,033 |
43.85 |
41 |
26 |
||||||||||||
|
0.75 to <2.50 |
57,917 |
78,729 |
15.02 |
64,215 |
1.43 |
8.0 |
24.99 |
2.4 |
33,002 |
51.39 |
224 |
122 |
||||||||||||
|
0.75 to <1.75 |
42,389 |
21,440 |
38.15 |
46,516 |
1.16 |
5.9 |
22.85 |
2.5 |
21,979 |
47.25 |
127 |
69 |
||||||||||||
|
1.75 to <2.5 |
15,528 |
57,289 |
6.37 |
17,699 |
2.13 |
2.1 |
30.59 |
2.2 |
11,023 |
62.28 |
96 |
53 |
||||||||||||
|
2.50 to <10.00 |
23,350 |
10,976 |
38.46 |
25,297 |
4.44 |
2.5 |
20.73 |
2.1 |
15,130 |
59.81 |
240 |
165 |
||||||||||||
|
2.50 to <5 |
15,808 |
6,872 |
39.48 |
17,512 |
3.41 |
1.6 |
19.99 |
2.1 |
9,561 |
54.60 |
120 |
78 |
||||||||||||
|
5 to <10 |
7,541 |
4,103 |
36.75 |
7,785 |
6.76 |
0.9 |
22.39 |
2.0 |
5,569 |
71.54 |
120 |
87 |
||||||||||||
|
10.00 to <100.00 |
4,028 |
132,496 |
1.59 |
4,763 |
40.19 |
0.9 |
40.09 |
2.1 |
3,150 |
66.12 |
144 |
72 |
||||||||||||
|
10 to <20 |
3,168 |
1,796 |
39.96 |
2,755 |
12.50 |
0.3 |
20.03 |
2.5 |
2,525 |
91.64 |
72 |
45 |
||||||||||||
|
20 to <30 |
278 |
136 |
24.85 |
239 |
24.14 |
0.1 |
25.32 |
1.7 |
244 |
102.09 |
12 |
5 |
||||||||||||
|
30.00 to <100.00 |
583 |
130,564 |
1.04 |
1,769 |
85.50 |
0.5 |
73.34 |
1.6 |
380 |
21.50 |
60 |
22 |
||||||||||||
|
100.00 (Default) |
12,704 |
2,094 |
44.57 |
12,979 |
99.74 |
2.5 |
51.13 |
2.0 |
7,747 |
59.69 |
5,698 |
4,181 |
||||||||||||
|
Sub-total |
229,565 |
437,570 |
21.24 |
316,235 |
5.49 |
46.9 |
28.72 |
2.1 |
113,904 |
36.02 |
6,444 |
4,712 |
||||||||||||
|
|
||||||||||||||||||||||||
|
of which: |
||||||||||||||||||||||||
|
SMEs |
||||||||||||||||||||||||
|
0.00 to <0.15 |
5,008 |
2,205 |
38.83 |
6,675 |
0.08 |
4.3 |
32.27 |
2.7 |
1,010 |
15.13 |
2 |
1 |
||||||||||||
|
0.00 to <0.10 |
3,127 |
1,382 |
36.54 |
4,300 |
0.05 |
2.4 |
35.00 |
2.8 |
618 |
14.37 |
1 |
1 |
||||||||||||
|
0.10 to <0.15 |
1,882 |
823 |
42.68 |
2,375 |
0.12 |
1.9 |
27.35 |
2.7 |
392 |
16.51 |
1 |
0 |
||||||||||||
|
0.15 to <0.25 |
2,859 |
1,676 |
40.50 |
3,490 |
0.21 |
2.7 |
30.67 |
2.6 |
839 |
24.03 |
2 |
1 |
||||||||||||
|
0.25 to <0.50 |
3,706 |
1,849 |
41.19 |
4,400 |
0.36 |
2.8 |
30.97 |
2.3 |
1,295 |
29.44 |
5 |
3 |
||||||||||||
|
0.50 to <0.75 |
2,296 |
877 |
40.11 |
2,543 |
0.63 |
1.9 |
30.72 |
2.7 |
993 |
39.06 |
5 |
2 |
||||||||||||
|
0.75 to <2.50 |
4,571 |
2,442 |
47.27 |
5,394 |
1.34 |
2.7 |
30.06 |
2.6 |
2,566 |
47.58 |
23 |
16 |
||||||||||||
|
0.75 to <1.75 |
3,459 |
1,789 |
47.49 |
4,066 |
1.12 |
1.8 |
26.83 |
2.7 |
1,651 |
40.62 |
12 |
8 |
||||||||||||
|
1.75 to <2.5 |
1,112 |
652 |
46.68 |
1,328 |
2.02 |
1.0 |
39.95 |
2.2 |
915 |
68.88 |
10 |
7 |
||||||||||||
|
2.50 to <10.00 |
1,599 |
556 |
47.84 |
1,654 |
4.75 |
1.0 |
31.87 |
2.0 |
1,112 |
67.26 |
25 |
14 |
||||||||||||
|
2.50 to <5 |
985 |
340 |
53.96 |
988 |
3.43 |
0.6 |
30.69 |
2.2 |
580 |
58.70 |
10 |
8 |
||||||||||||
|
5 to <10 |
613 |
216 |
38.20 |
665 |
6.72 |
0.4 |
33.62 |
1.8 |
532 |
79.99 |
15 |
7 |
||||||||||||
|
10.00 to <100.00 |
274 |
97 |
42.55 |
218 |
19.76 |
0.2 |
36.45 |
2.9 |
289 |
132.87 |
18 |
9 |
||||||||||||
|
10 to <20 |
203 |
75 |
42.19 |
150 |
13.80 |
0.1 |
32.02 |
3.0 |
164 |
109.32 |
7 |
4 |
||||||||||||
|
20 to <30 |
14 |
5 |
36.04 |
15 |
23.64 |
0.0 |
45.39 |
1.2 |
23 |
159.53 |
2 |
1 |
||||||||||||
|
30.00 to <100.00 |
57 |
17 |
46.12 |
53 |
35.74 |
0.1 |
46.63 |
3.0 |
101 |
192.78 |
9 |
5 |
||||||||||||
|
100.00 (Default) |
1,564 |
76 |
40.28 |
1,515 |
100.00 |
0.7 |
63.04 |
1.5 |
547 |
36.10 |
902 |
720 |
||||||||||||
|
Sub-total |
21,877 |
9,778 |
42.34 |
25,888 |
6.77 |
16.5 |
33.03 |
2.5 |
8,652 |
33.42 |
981 |
765 |
||||||||||||
105
|
Deutsche Bank |
||
|
Pillar 3 Report as of December 31, 2024 |
||
|
|
Dec 31, 2024 |
|||||||||||||||||||||||
|
in € m. |
a |
b |
c |
d |
e |
f |
g |
h |
i |
j |
k |
l |
||||||||||||
|
(unless stated otherwise) |
On-balance sheet exposures |
Off-balance-sheet exposures pre-CCF |
Exposure weighted average CCF |
Exposure post CCF and post CRM |
Exposure weighted average PD (%) |
Number of |
Exposure weighted average LGD (%) |
Exposure weighted average maturity |
Risk weighted exposure amount after supporting factors |
Density of risk weighted exposure amount |
Expected |
Value |
||||||||||||
|
Specialized Lending |
||||||||||||||||||||||||
|
0.00 to <0.15 |
1,467 |
6 |
77.33 |
1,471 |
0.11 |
0.0 |
11.06 |
2.3 |
105 |
7.14 |
0 |
0 |
||||||||||||
|
0.00 to <0.10 |
257 |
4 |
88.27 |
261 |
0.09 |
0.0 |
13.90 |
2.3 |
16 |
6.33 |
0 |
0 |
||||||||||||
|
0.10 to <0.15 |
1,210 |
1 |
40.21 |
1,211 |
0.12 |
0.0 |
10.45 |
2.3 |
88 |
7.31 |
0 |
0 |
||||||||||||
|
0.15 to <0.25 |
1,392 |
169 |
43.99 |
1,467 |
0.18 |
0.1 |
11.56 |
2.6 |
141 |
9.62 |
0 |
0 |
||||||||||||
|
0.25 to <0.50 |
7,974 |
604 |
52.01 |
8,197 |
0.38 |
0.2 |
13.37 |
2.5 |
1,464 |
17.86 |
4 |
3 |
||||||||||||
|
0.50 to <0.75 |
2,466 |
1,390 |
43.73 |
2,945 |
0.71 |
0.1 |
15.03 |
2.6 |
801 |
27.19 |
3 |
4 |
||||||||||||
|
0.75 to <2.50 |
19,229 |
2,595 |
43.35 |
19,713 |
1.54 |
0.5 |
15.10 |
2.3 |
5,947 |
30.17 |
45 |
23 |
||||||||||||
|
0.75 to <1.75 |
11,735 |
1,736 |
45.37 |
12,089 |
1.18 |
0.3 |
15.25 |
2.3 |
3,478 |
28.77 |
21 |
10 |
||||||||||||
|
1.75 to <2.5 |
7,494 |
859 |
39.28 |
7,624 |
2.12 |
0.2 |
14.87 |
2.1 |
2,469 |
32.39 |
24 |
13 |
||||||||||||
|
2.50 to <10.00 |
12,792 |
2,492 |
42.51 |
13,210 |
4.64 |
0.3 |
14.89 |
2.1 |
5,323 |
40.30 |
92 |
73 |
||||||||||||
|
2.50 to <5 |
8,219 |
1,416 |
44.21 |
8,630 |
3.49 |
0.2 |
14.54 |
2.1 |
3,216 |
37.27 |
44 |
29 |
||||||||||||
|
5 to <10 |
4,573 |
1,076 |
40.27 |
4,580 |
6.81 |
0.1 |
15.55 |
2.1 |
2,107 |
46.01 |
48 |
43 |
||||||||||||
|
10.00 to <100.00 |
895 |
95 |
67.37 |
902 |
26.77 |
0.0 |
14.16 |
2.5 |
528 |
58.53 |
35 |
9 |
||||||||||||
|
10 to <20 |
567 |
52 |
42.01 |
531 |
12.96 |
0.0 |
11.53 |
2.7 |
249 |
46.90 |
8 |
5 |
||||||||||||
|
20 to <30 |
129 |
2 |
50.33 |
130 |
21.40 |
0.0 |
18.70 |
1.3 |
116 |
89.31 |
5 |
1 |
||||||||||||
|
30.00 to <100.00 |
199 |
42 |
99.97 |
241 |
60.10 |
0.0 |
17.51 |
2.7 |
163 |
67.57 |
22 |
3 |
||||||||||||
|
100.00 (Default) |
4,679 |
221 |
42.11 |
4,634 |
99.26 |
0.1 |
41.78 |
2.4 |
2,993 |
64.59 |
1,601 |
1,227 |
||||||||||||
|
Sub-total |
50,893 |
7,572 |
44.14 |
52,537 |
11.07 |
1.3 |
16.90 |
2.3 |
17,302 |
32.93 |
1,781 |
1,339 |
||||||||||||
|
Other |
||||||||||||||||||||||||
|
0.00 to <0.15 |
47,146 |
110,959 |
34.85 |
94,111 |
0.08 |
9.5 |
30.36 |
1.9 |
16,526 |
17.56 |
26 |
110 |
||||||||||||
|
0.00 to <0.10 |
30,353 |
68,895 |
33.94 |
58,823 |
0.06 |
6.8 |
30.38 |
1.9 |
8,836 |
15.02 |
12 |
103 |
||||||||||||
|
0.10 to <0.15 |
16,793 |
42,064 |
36.35 |
35,289 |
0.12 |
2.6 |
30.32 |
1.8 |
7,690 |
21.79 |
14 |
7 |
||||||||||||
|
0.15 to <0.25 |
18,246 |
43,642 |
34.46 |
32,787 |
0.19 |
3.5 |
28.27 |
1.8 |
8,322 |
25.38 |
18 |
9 |
||||||||||||
|
0.25 to <0.50 |
22,775 |
32,872 |
34.06 |
31,222 |
0.35 |
5.4 |
33.22 |
2.1 |
14,141 |
45.29 |
39 |
20 |
||||||||||||
|
0.50 to <0.75 |
16,230 |
17,026 |
31.10 |
19,673 |
0.57 |
2.6 |
28.10 |
2.2 |
9,239 |
46.96 |
33 |
20 |
||||||||||||
|
0.75 to <2.50 |
34,117 |
73,692 |
12.96 |
39,109 |
1.38 |
4.8 |
29.27 |
2.4 |
24,488 |
62.62 |
156 |
83 |
||||||||||||
|
0.75 to <1.75 |
27,195 |
17,915 |
36.52 |
30,362 |
1.15 |
3.8 |
25.35 |
2.5 |
16,849 |
55.49 |
94 |
51 |
||||||||||||
|
1.75 to <2.5 |
6,923 |
55,777 |
5.39 |
8,747 |
2.16 |
1.0 |
42.88 |
2.2 |
7,639 |
87.34 |
62 |
32 |
||||||||||||
|
2.50 to <10.00 |
8,959 |
7,928 |
36.53 |
10,434 |
4.13 |
1.2 |
26.35 |
2.1 |
8,694 |
83.33 |
124 |
78 |
||||||||||||
|
2.50 to <5 |
6,604 |
5,117 |
37.21 |
7,894 |
3.31 |
0.8 |
24.60 |
2.2 |
5,764 |
73.02 |
67 |
41 |
||||||||||||
|
5 to <10 |
2,355 |
2,812 |
35.30 |
2,539 |
6.67 |
0.4 |
31.80 |
1.8 |
2,930 |
115.38 |
57 |
37 |
||||||||||||
|
10.00 to <100.00 |
2,859 |
132,303 |
1.52 |
3,644 |
44.73 |
0.6 |
46.73 |
2.0 |
2,332 |
64.01 |
91 |
54 |
||||||||||||
|
10 to <20 |
2,399 |
1,668 |
39.79 |
2,074 |
12.29 |
0.2 |
21.34 |
2.5 |
2,111 |
101.81 |
57 |
36 |
||||||||||||
|
20 to <30 |
134 |
130 |
24.10 |
95 |
27.97 |
0.0 |
31.28 |
2.3 |
105 |
110.73 |
5 |
3 |
||||||||||||
|
30.00 to <100.00 |
326 |
130,506 |
1.01 |
1,475 |
91.43 |
0.4 |
83.41 |
1.3 |
116 |
7.87 |
29 |
14 |
||||||||||||
|
100.00 (Default) |
6,462 |
1,797 |
45.05 |
6,830 |
100.00 |
1.6 |
54.83 |
1.9 |
4,207 |
61.60 |
3,195 |
2,235 |
||||||||||||
|
Sub-total |
156,795 |
420,220 |
20.34 |
237,810 |
4.12 |
29.1 |
30.86 |
2.0 |
87,951 |
36.98 |
3,682 |
2,608 |
||||||||||||
|
|
||||||||||||||||||||||||
106
|
Deutsche Bank |
||
|
Pillar 3 Report as of December 31, 2024 |
||
|
|
Dec 31, 2024 |
|||||||||||||||||||||||
|
in € m. |
a |
b |
c |
d |
e |
f |
g |
h |
i |
j |
k |
l |
||||||||||||
|
(unless stated otherwise) |
On-balance sheet exposures |
Off-balance-sheet exposures pre-CCF |
Exposure weighted average CCF |
Exposure post CCF and post CRM |
Exposure weighted average PD (%) |
Number of |
Exposure weighted average LGD (%) |
Exposure weighted average maturity |
Risk weighted exposure amount after supporting factors |
Density of risk weighted exposure amount |
Expected |
Value |
||||||||||||
|
Retail |
||||||||||||||||||||||||
|
0.00 to <0.15 |
42,486 |
15,379 |
45.79 |
49,947 |
0.09 |
2,539.2 |
24.94 |
0 |
2,357 |
4.72 |
11 |
4 |
||||||||||||
|
0.00 to <0.10 |
22,492 |
9,431 |
52.35 |
27,662 |
0.06 |
1,796.0 |
26.04 |
0 |
983 |
3.55 |
5 |
1 |
||||||||||||
|
0.10 to <0.15 |
19,994 |
5,948 |
35.38 |
22,286 |
0.12 |
743.1 |
23.57 |
0 |
1,374 |
6.17 |
6 |
2 |
||||||||||||
|
0.15 to <0.25 |
26,233 |
3,351 |
53.37 |
28,155 |
0.19 |
753.1 |
23.14 |
0 |
2,500 |
8.88 |
13 |
4 |
||||||||||||
|
0.25 to <0.50 |
40,310 |
3,167 |
59.20 |
42,474 |
0.37 |
973.6 |
23.86 |
0 |
6,412 |
15.10 |
38 |
13 |
||||||||||||
|
0.50 to <0.75 |
10,366 |
1,560 |
40.82 |
10,967 |
0.61 |
239.5 |
24.19 |
0 |
2,435 |
22.20 |
16 |
7 |
||||||||||||
|
0.75 to <2.50 |
47,463 |
3,774 |
38.35 |
49,586 |
1.39 |
1,593.3 |
29.44 |
0 |
20,206 |
40.75 |
210 |
91 |
||||||||||||
|
0.75 to <1.75 |
36,861 |
2,313 |
51.30 |
38,566 |
1.16 |
1,122.1 |
27.78 |
0 |
13,796 |
35.77 |
125 |
50 |
||||||||||||
|
1.75 to <2.5 |
10,602 |
1,461 |
17.84 |
11,019 |
2.18 |
471.2 |
35.26 |
0 |
6,410 |
58.17 |
86 |
40 |
||||||||||||
|
2.50 to <10.00 |
19,412 |
866 |
53.13 |
20,014 |
5.10 |
660.8 |
34.70 |
0 |
17,201 |
85.95 |
382 |
225 |
||||||||||||
|
2.50 to <5 |
12,010 |
532 |
58.03 |
12,405 |
3.79 |
379.2 |
33.24 |
0 |
10,007 |
80.67 |
180 |
99 |
||||||||||||
|
5 to <10 |
7,403 |
334 |
45.34 |
7,609 |
7.22 |
281.6 |
37.07 |
0 |
7,194 |
94.55 |
202 |
126 |
||||||||||||
|
10.00 to <100.00 |
5,212 |
6,816 |
1.18 |
5,277 |
24.88 |
221.5 |
36.63 |
0 |
6,992 |
132.49 |
471 |
263 |
||||||||||||
|
10 to <20 |
2,428 |
75 |
65.99 |
2,481 |
14.13 |
135.4 |
39.18 |
0 |
2,991 |
120.55 |
138 |
81 |
||||||||||||
|
20 to <30 |
1,025 |
58 |
18.52 |
1,031 |
24.65 |
24.8 |
32.22 |
0 |
1,450 |
140.73 |
85 |
47 |
||||||||||||
|
30.00 to <100.00 |
1,759 |
6,683 |
0.31 |
1,766 |
40.11 |
61.3 |
35.64 |
0 |
2,550 |
144.45 |
248 |
135 |
||||||||||||
|
100.00 (Default) |
4,445 |
115 |
51.50 |
4,362 |
100.00 |
227.9 |
61.03 |
0 |
1,385 |
31.75 |
2,607 |
2,105 |
||||||||||||
|
Sub-total |
195,927 |
35,028 |
38.23 |
210,782 |
3.66 |
7,208.8 |
27.47 |
0 |
59,488 |
28.22 |
3,749 |
2,712 |
||||||||||||
|
of which: |
||||||||||||||||||||||||
|
Secured by real estate property SMEs |
||||||||||||||||||||||||
|
0.00 to <0.15 |
270 |
25 |
51.41 |
281 |
0.07 |
0.5 |
19.44 |
0 |
8 |
2.97 |
0 |
0 |
||||||||||||
|
0.00 to <0.10 |
188 |
18 |
52.15 |
198 |
0.05 |
0.4 |
19.89 |
0 |
5 |
2.47 |
0 |
0 |
||||||||||||
|
0.10 to <0.15 |
82 |
7 |
49.55 |
83 |
0.11 |
0.2 |
18.35 |
0 |
3 |
4.17 |
0 |
0 |
||||||||||||
|
0.15 to <0.25 |
187 |
14 |
49.72 |
194 |
0.20 |
0.3 |
22.99 |
0 |
15 |
7.77 |
0 |
0 |
||||||||||||
|
0.25 to <0.50 |
196 |
17 |
46.27 |
205 |
0.35 |
0.4 |
23.82 |
0 |
25 |
12.21 |
0 |
0 |
||||||||||||
|
0.50 to <0.75 |
71 |
6 |
46.24 |
74 |
0.60 |
0.2 |
24.75 |
0 |
13 |
17.93 |
0 |
0 |
||||||||||||
|
0.75 to <2.50 |
159 |
13 |
44.12 |
165 |
1.31 |
0.4 |
24.41 |
0 |
51 |
31.10 |
1 |
0 |
||||||||||||
|
0.75 to <1.75 |
129 |
6 |
45.79 |
132 |
1.11 |
0.3 |
22.47 |
0 |
34 |
25.56 |
0 |
0 |
||||||||||||
|
1.75 to <2.5 |
30 |
7 |
42.76 |
33 |
2.13 |
0.1 |
32.17 |
0 |
18 |
53.32 |
0 |
0 |
||||||||||||
|
2.50 to <10.00 |
60 |
5 |
50.47 |
63 |
4.31 |
0.1 |
27.00 |
0 |
42 |
67.42 |
1 |
0 |
||||||||||||
|
2.50 to <5 |
45 |
4 |
55.14 |
47 |
3.58 |
0.1 |
24.89 |
0 |
26 |
55.68 |
0 |
0 |
||||||||||||
|
5 to <10 |
15 |
1 |
34.09 |
16 |
6.47 |
0.1 |
33.23 |
0 |
16 |
102.00 |
0 |
0 |
||||||||||||
|
10.00 to <100.00 |
12 |
0 |
84.36 |
13 |
21.33 |
0.0 |
32.97 |
0 |
19 |
147.28 |
1 |
0 |
||||||||||||
|
10 to <20 |
7 |
0 |
92.98 |
7 |
14.46 |
0.0 |
26.70 |
0 |
8 |
111.61 |
0 |
0 |
||||||||||||
|
20 to <30 |
2 |
0 |
0 |
3 |
24.06 |
0.0 |
35.96 |
0 |
4 |
168.49 |
0 |
0 |
||||||||||||
|
30.00 to <100.00 |
3 |
0 |
46.95 |
3 |
33.06 |
0.0 |
43.30 |
0 |
7 |
202.81 |
0 |
0 |
||||||||||||
|
100.00 (Default) |
21 |
1 |
23.64 |
21 |
100.00 |
0.1 |
69.40 |
0 |
9 |
44.59 |
14 |
7 |
||||||||||||
|
Sub-total |
976 |
82 |
48.36 |
1,016 |
2.98 |
2.0 |
23.86 |
0 |
184 |
18.09 |
16 |
8 |
||||||||||||
107
|
Deutsche Bank |
||
|
Pillar 3 Report as of December 31, 2024 |
||
|
|
Dec 31, 2024 |
|||||||||||||||||||||||
|
in € m. |
a |
b |
c |
d |
e |
f |
g |
h |
i |
j |
k |
l |
||||||||||||
|
(unless stated otherwise) |
On-balance sheet exposures |
Off-balance-sheet exposures pre-CCF |
Exposure weighted average CCF |
Exposure post CCF and post CRM |
Exposure weighted average PD (%) |
Number of |
Exposure weighted average LGD (%) |
Exposure weighted average maturity |
Risk weighted exposure amount after supporting factors |
Density of risk weighted exposure amount |
Expected |
Value |
||||||||||||
|
Secured by real estate property non-SMEs |
||||||||||||||||||||||||
|
0.00 to <0.15 |
39,290 |
782 |
66.19 |
39,875 |
0.09 |
275.9 |
19.22 |
0 |
1,748 |
4.38 |
7 |
2 |
||||||||||||
|
0.00 to <0.10 |
21,077 |
478 |
61.60 |
21,389 |
0.06 |
150.2 |
19.29 |
0 |
720 |
3.37 |
3 |
1 |
||||||||||||
|
0.10 to <0.15 |
18,214 |
304 |
73.41 |
18,487 |
0.12 |
125.7 |
19.15 |
0 |
1,028 |
5.56 |
4 |
1 |
||||||||||||
|
0.15 to <0.25 |
24,392 |
380 |
74.61 |
24,752 |
0.19 |
164.6 |
19.25 |
0 |
1,975 |
7.98 |
9 |
3 |
||||||||||||
|
0.25 to <0.50 |
36,736 |
578 |
75.95 |
37,262 |
0.37 |
222.1 |
19.55 |
0 |
4,884 |
13.11 |
27 |
8 |
||||||||||||
|
0.50 to <0.75 |
8,626 |
108 |
91.75 |
8,730 |
0.61 |
46.2 |
20.06 |
0 |
1,675 |
19.19 |
11 |
4 |
||||||||||||
|
0.75 to <2.50 |
36,951 |
455 |
83.49 |
37,354 |
1.36 |
198.3 |
20.30 |
0 |
12,221 |
32.72 |
105 |
42 |
||||||||||||
|
0.75 to <1.75 |
30,025 |
378 |
83.50 |
30,361 |
1.17 |
164.1 |
20.10 |
0 |
9,013 |
29.69 |
73 |
27 |
||||||||||||
|
1.75 to <2.5 |
6,926 |
77 |
83.47 |
6,993 |
2.16 |
34.3 |
21.14 |
0 |
3,208 |
45.87 |
32 |
15 |
||||||||||||
|
2.50 to <10.00 |
13,342 |
228 |
88.08 |
13,544 |
5.08 |
83.4 |
21.59 |
0 |
10,957 |
80.90 |
172 |
117 |
||||||||||||
|
2.50 to <5 |
8,617 |
162 |
89.35 |
8,763 |
3.84 |
60.6 |
21.82 |
0 |
6,718 |
76.66 |
98 |
59 |
||||||||||||
|
5 to <10 |
4,725 |
65 |
84.92 |
4,781 |
7.35 |
22.8 |
21.16 |
0 |
4,239 |
88.67 |
74 |
58 |
||||||||||||
|
10.00 to <100.00 |
3,333 |
36 |
89.88 |
3,365 |
25.86 |
16.9 |
21.31 |
0 |
4,106 |
122.00 |
187 |
105 |
||||||||||||
|
10 to <20 |
1,382 |
18 |
86.58 |
1,397 |
14.11 |
6.8 |
20.99 |
0 |
1,593 |
114.05 |
41 |
28 |
||||||||||||
|
20 to <30 |
772 |
7 |
89.75 |
779 |
23.79 |
3.9 |
21.19 |
0 |
1,006 |
129.09 |
39 |
22 |
||||||||||||
|
30.00 to <100.00 |
1,179 |
11 |
95.42 |
1,189 |
41.03 |
6.1 |
21.75 |
0 |
1,506 |
126.69 |
106 |
55 |
||||||||||||
|
100.00 (Default) |
2,015 |
32 |
92.58 |
2,046 |
100.00 |
15.4 |
36.74 |
0 |
751 |
36.70 |
712 |
421 |
||||||||||||
|
Sub-total |
164,686 |
2,599 |
76.25 |
166,929 |
2.63 |
1,022.8 |
20.03 |
0 |
38,316 |
22.95 |
1,231 |
702 |
||||||||||||
|
Qualifying Revolving |
||||||||||||||||||||||||
|
0.00 to <0.15 |
54 |
8,535 |
57.16 |
5,165 |
0.07 |
1,985.6 |
54.32 |
0 |
137 |
2.65 |
2 |
1 |
||||||||||||
|
0.00 to <0.10 |
35 |
6,491 |
56.37 |
3,826 |
0.06 |
1,486.1 |
54.58 |
0 |
83 |
2.17 |
1 |
1 |
||||||||||||
|
0.10 to <0.15 |
20 |
2,044 |
59.68 |
1,339 |
0.12 |
499.5 |
53.57 |
0 |
54 |
4.01 |
1 |
0 |
||||||||||||
|
0.15 to <0.25 |
38 |
1,506 |
61.36 |
1,088 |
0.19 |
414.6 |
56.25 |
0 |
66 |
6.05 |
1 |
0 |
||||||||||||
|
0.25 to <0.50 |
117 |
1,102 |
59.32 |
1,030 |
0.35 |
397.9 |
62.38 |
0 |
116 |
11.27 |
2 |
1 |
||||||||||||
|
0.50 to <0.75 |
37 |
324 |
68.80 |
309 |
0.54 |
113.3 |
52.78 |
0 |
41 |
13.20 |
1 |
0 |
||||||||||||
|
0.75 to <2.50 |
249 |
605 |
60.90 |
968 |
1.37 |
467.3 |
65.12 |
0 |
317 |
32.75 |
9 |
3 |
||||||||||||
|
0.75 to <1.75 |
175 |
495 |
60.82 |
739 |
1.08 |
328.2 |
64.71 |
0 |
203 |
27.51 |
5 |
2 |
||||||||||||
|
1.75 to <2.5 |
74 |
110 |
61.28 |
228 |
2.30 |
139.1 |
66.42 |
0 |
114 |
49.72 |
3 |
1 |
||||||||||||
|
2.50 to <10.00 |
136 |
120 |
61.60 |
346 |
5.50 |
219.2 |
67.49 |
0 |
315 |
91.10 |
13 |
4 |
||||||||||||
|
2.50 to <5 |
65 |
70 |
62.02 |
175 |
3.80 |
109.6 |
66.24 |
0 |
124 |
70.68 |
4 |
2 |
||||||||||||
|
5 to <10 |
71 |
50 |
61.01 |
171 |
7.24 |
109.7 |
68.77 |
0 |
191 |
112.01 |
9 |
3 |
||||||||||||
|
10.00 to <100.00 |
119 |
40 |
67.02 |
183 |
23.40 |
109.2 |
61.07 |
0 |
307 |
167.56 |
27 |
12 |
||||||||||||
|
10 to <20 |
60 |
30 |
68.61 |
104 |
14.38 |
71.8 |
59.34 |
0 |
148 |
141.57 |
9 |
4 |
||||||||||||
|
20 to <30 |
11 |
2 |
53.01 |
19 |
27.70 |
7.3 |
73.88 |
0 |
42 |
228.69 |
4 |
1 |
||||||||||||
|
30.00 to <100.00 |
47 |
7 |
64.41 |
61 |
37.63 |
30.1 |
60.13 |
0 |
117 |
193.64 |
14 |
6 |
||||||||||||
|
100.00 (Default) |
150 |
6 |
58.03 |
159 |
100.00 |
100.0 |
80.43 |
0 |
132 |
82.94 |
124 |
122 |
||||||||||||
|
Sub-total |
900 |
12,238 |
58.44 |
9,248 |
2.66 |
3,807.2 |
57.60 |
0 |
1,431 |
15.47 |
178 |
143 |
||||||||||||
108
|
Deutsche Bank |
||
|
Pillar 3 Report as of December 31, 2024 |
||
|
|
Dec 31, 2024 |
|||||||||||||||||||||||
|
in € m. |
a |
b |
c |
d |
e |
f |
g |
h |
i |
j |
k |
l |
||||||||||||
|
(unless stated otherwise) |
On-balance sheet exposures |
Off-balance-sheet exposures pre-CCF |
Exposure weighted average CCF |
Exposure post CCF and post CRM |
Exposure weighted average PD (%) |
Number of |
Exposure weighted average LGD (%) |
Exposure weighted average maturity |
Risk weighted exposure amount after supporting factors |
Density of risk weighted exposure amount |
Expected |
Value |
||||||||||||
|
Other retail SMEs |
||||||||||||||||||||||||
|
0.00 to <0.15 |
1,080 |
3,700 |
13.08 |
1,514 |
0.10 |
24.5 |
31.08 |
0 |
114 |
7.56 |
0 |
0 |
||||||||||||
|
0.00 to <0.10 |
221 |
804 |
21.22 |
347 |
0.06 |
8.5 |
39.92 |
0 |
22 |
6.23 |
0 |
0 |
||||||||||||
|
0.10 to <0.15 |
859 |
2,896 |
10.82 |
1,167 |
0.11 |
16.0 |
28.45 |
0 |
93 |
7.96 |
0 |
0 |
||||||||||||
|
0.15 to <0.25 |
296 |
569 |
19.70 |
314 |
0.19 |
6.8 |
39.87 |
0 |
43 |
13.57 |
0 |
0 |
||||||||||||
|
0.25 to <0.50 |
369 |
310 |
30.52 |
321 |
0.36 |
6.1 |
48.15 |
0 |
75 |
23.30 |
1 |
0 |
||||||||||||
|
0.50 to <0.75 |
513 |
703 |
18.29 |
536 |
0.58 |
9.5 |
32.14 |
0 |
184 |
34.32 |
1 |
1 |
||||||||||||
|
0.75 to <2.50 |
702 |
775 |
15.94 |
645 |
1.43 |
11.2 |
42.96 |
0 |
229 |
35.47 |
4 |
2 |
||||||||||||
|
0.75 to <1.75 |
470 |
588 |
16.95 |
474 |
1.22 |
8.5 |
39.49 |
0 |
180 |
38.06 |
2 |
1 |
||||||||||||
|
1.75 to <2.5 |
231 |
186 |
12.72 |
171 |
2.02 |
2.7 |
52.56 |
0 |
49 |
28.31 |
2 |
1 |
||||||||||||
|
2.50 to <10.00 |
409 |
273 |
19.25 |
319 |
4.53 |
5.5 |
46.76 |
0 |
185 |
58.17 |
7 |
3 |
||||||||||||
|
2.50 to <5 |
212 |
145 |
19.61 |
169 |
3.15 |
2.7 |
46.00 |
0 |
92 |
54.53 |
2 |
1 |
||||||||||||
|
5 to <10 |
197 |
128 |
18.85 |
149 |
6.10 |
2.7 |
47.61 |
0 |
93 |
62.29 |
4 |
2 |
||||||||||||
|
10.00 to <100.00 |
126 |
57 |
9.58 |
74 |
22.80 |
1.4 |
55.29 |
0 |
74 |
99.47 |
9 |
3 |
||||||||||||
|
10 to <20 |
54 |
10 |
28.77 |
35 |
14.04 |
0.6 |
57.81 |
0 |
32 |
89.60 |
3 |
1 |
||||||||||||
|
20 to <30 |
32 |
40 |
1.56 |
19 |
25.14 |
0.4 |
44.30 |
0 |
16 |
87.79 |
2 |
1 |
||||||||||||
|
30.00 to <100.00 |
41 |
7 |
28.94 |
20 |
35.89 |
0.5 |
61.02 |
0 |
26 |
127.39 |
4 |
1 |
||||||||||||
|
100.00 (Default) |
284 |
36 |
19.77 |
177 |
100.00 |
2.3 |
87.85 |
0 |
66 |
37.22 |
147 |
141 |
||||||||||||
|
Sub-total |
3,779 |
6,423 |
15.69 |
3,900 |
5.74 |
67.3 |
39.62 |
0 |
970 |
24.87 |
169 |
151 |
||||||||||||
|
Other retail non-SMEs |
||||||||||||||||||||||||
|
0.00 to <0.15 |
1,791 |
2,336 |
49.16 |
3,112 |
0.08 |
655.4 |
46.91 |
0 |
350 |
11.25 |
1 |
1 |
||||||||||||
|
0.00 to <0.10 |
971 |
1,639 |
49.02 |
1,901 |
0.06 |
436.1 |
42.60 |
0 |
154 |
8.09 |
1 |
0 |
||||||||||||
|
0.10 to <0.15 |
820 |
696 |
49.48 |
1,211 |
0.12 |
219.4 |
53.66 |
0 |
196 |
16.23 |
1 |
0 |
||||||||||||
|
0.15 to <0.25 |
1,321 |
881 |
52.35 |
1,806 |
0.19 |
281.2 |
53.63 |
0 |
401 |
22.20 |
2 |
1 |
||||||||||||
|
0.25 to <0.50 |
2,892 |
1,159 |
58.62 |
3,656 |
0.39 |
495.2 |
54.81 |
0 |
1,313 |
35.91 |
8 |
3 |
||||||||||||
|
0.50 to <0.75 |
1,119 |
419 |
43.81 |
1,318 |
0.60 |
102.8 |
41.55 |
0 |
522 |
39.57 |
3 |
3 |
||||||||||||
|
0.75 to <2.50 |
9,402 |
1,925 |
29.57 |
10,454 |
1.51 |
1,067.0 |
58.07 |
0 |
7,388 |
70.67 |
92 |
43 |
||||||||||||
|
0.75 to <1.75 |
6,061 |
846 |
55.28 |
6,860 |
1.13 |
736.5 |
57.07 |
0 |
4,366 |
63.64 |
44 |
20 |
||||||||||||
|
1.75 to <2.5 |
3,341 |
1,080 |
9.43 |
3,594 |
2.24 |
330.5 |
59.97 |
0 |
3,022 |
84.10 |
48 |
23 |
||||||||||||
|
2.50 to <10.00 |
5,465 |
241 |
54.32 |
5,742 |
5.15 |
413.0 |
63.05 |
0 |
5,702 |
99.29 |
189 |
100 |
||||||||||||
|
2.50 to <5 |
3,071 |
151 |
59.51 |
3,251 |
3.71 |
239.1 |
61.70 |
0 |
3,047 |
93.74 |
75 |
38 |
||||||||||||
|
5 to <10 |
2,394 |
90 |
45.67 |
2,491 |
7.03 |
173.9 |
64.80 |
0 |
2,654 |
106.54 |
115 |
63 |
||||||||||||
|
10.00 to <100.00 |
1,621 |
6,684 |
0.24 |
1,641 |
23.14 |
123.7 |
64.52 |
0 |
2,486 |
151.45 |
248 |
143 |
||||||||||||
|
10 to <20 |
925 |
17 |
60.80 |
938 |
14.13 |
71.8 |
63.43 |
0 |
1,211 |
129.14 |
85 |
48 |
||||||||||||
|
20 to <30 |
208 |
9 |
26.95 |
211 |
27.49 |
17.0 |
68.10 |
0 |
381 |
180.24 |
40 |
22 |
||||||||||||
|
30.00 to <100.00 |
488 |
6,658 |
0.05 |
492 |
38.42 |
34.9 |
65.05 |
0 |
894 |
181.56 |
123 |
72 |
||||||||||||
|
100.00 (Default) |
1,974 |
41 |
46.70 |
1,959 |
100.00 |
132.2 |
82.30 |
0 |
427 |
21.79 |
1,611 |
1,414 |
||||||||||||
|
Sub-total |
25,585 |
13,687 |
23.44 |
29,688 |
9.50 |
3,270.6 |
58.41 |
0 |
18,587 |
62.61 |
2,155 |
1,708 |
||||||||||||
|
All exposure classes |
||||||||||||||||||||||||
|
Total |
565,351 |
485,048 |
22.77 |
679,372 |
3.76 |
7,256.7 |
36.33 |
1.9 |
194,498 |
28.63 |
10,451 |
7,482 |
||||||||||||
109
|
Deutsche Bank |
||
|
Pillar 3 Report as of December 31, 2024 |
||
|
|
Jun 30, 2024 |
|||||||||||||||||||||||
|
in € m. |
a |
b |
c |
d |
e |
f |
g |
h |
i |
j |
k |
l |
||||||||||||
|
(unless stated otherwise) |
On-balance sheet exposures |
Off-balance-sheet exposures pre-CCF |
Exposure weighted average CCF |
Exposure post CCF and post CRM |
Exposure weighted average PD (%) |
Number of |
Exposure weighted average LGD (%) |
Exposure weighted average maturity |
Risk weighted exposure amount after supporting factors |
Density of risk weighted exposure amount |
Expected |
Value |
||||||||||||
|
Central governments |
||||||||||||||||||||||||
|
0.00 to <0.15 |
103,440 |
356 |
29.71 |
117,371 |
0 |
0.1 |
65.08 |
1.6 |
1,814 |
1.55 |
3 |
0 |
||||||||||||
|
0.00 to <0.10 |
103,138 |
356 |
29.72 |
116,583 |
0 |
0.1 |
65.07 |
1.6 |
1,353 |
1.16 |
2 |
0 |
||||||||||||
|
0.10 to <0.15 |
302 |
0 |
20.00 |
788 |
0.14 |
0.0 |
66.56 |
3.4 |
460 |
58.37 |
1 |
0 |
||||||||||||
|
0.15 to <0.25 |
594 |
22 |
39.81 |
572 |
0.23 |
0.0 |
66.56 |
1.0 |
296 |
51.75 |
1 |
0 |
||||||||||||
|
0.25 to <0.50 |
1,146 |
0 |
19.11 |
921 |
0.39 |
0.0 |
67.13 |
1.6 |
784 |
85.13 |
2 |
0 |
||||||||||||
|
0.50 to <0.75 |
814 |
0 |
20.00 |
261 |
0.64 |
0.0 |
68.57 |
1.2 |
279 |
106.88 |
1 |
0 |
||||||||||||
|
0.75 to <2.50 |
5,795 |
750 |
40.06 |
4,760 |
1.76 |
0.0 |
98.13 |
4.8 |
11,620 |
244.13 |
3 |
1 |
||||||||||||
|
0.75 to <1.75 |
113 |
0 |
99.99 |
2 |
1.07 |
0.0 |
66.43 |
3.3 |
3 |
163.67 |
0 |
0 |
||||||||||||
|
1.75 to <2.5 |
5,681 |
750 |
40.06 |
4,758 |
1.76 |
0.0 |
98.14 |
4.8 |
11,617 |
244.16 |
3 |
1 |
||||||||||||
|
2.50 to <10.00 |
1,869 |
528 |
34.84 |
150 |
6.26 |
0.0 |
59.88 |
4.0 |
248 |
165.01 |
4 |
4 |
||||||||||||
|
2.50 to <5 |
1,186 |
273 |
34.87 |
81 |
4.82 |
0.0 |
56.26 |
3.5 |
128 |
157.81 |
1 |
2 |
||||||||||||
|
5 to <10 |
683 |
256 |
34.81 |
69 |
7.95 |
0.0 |
64.17 |
4.4 |
119 |
173.52 |
2 |
2 |
||||||||||||
|
10.00 to <100.00 |
1,252 |
0 |
20.00 |
988 |
15.63 |
0.0 |
60.47 |
1.0 |
2,826 |
286.01 |
94 |
7 |
||||||||||||
|
10 to <20 |
894 |
0 |
20.00 |
817 |
12.89 |
0.0 |
61.31 |
1.2 |
2,307 |
282.35 |
65 |
0 |
||||||||||||
|
20 to <30 |
43 |
0 |
0 |
43 |
22.01 |
0.0 |
26.72 |
0 |
59 |
137.14 |
3 |
0 |
||||||||||||
|
30.00 to <100.00 |
315 |
0 |
0 |
128 |
31.01 |
0.0 |
66.56 |
0.2 |
459 |
360.00 |
26 |
7 |
||||||||||||
|
100.00 (Default) |
777 |
221 |
40.21 |
205 |
100.00 |
0.0 |
97.49 |
3.8 |
89 |
43.55 |
178 |
42 |
||||||||||||
|
Sub-total |
115,686 |
1,877 |
36.64 |
125,228 |
0.37 |
0.2 |
66.37 |
1.7 |
17,956 |
14.34 |
286 |
55 |
||||||||||||
|
Institutions |
||||||||||||||||||||||||
|
0.00 to <0.15 |
8,444 |
6,953 |
32.56 |
13,535 |
0.06 |
0.4 |
53.43 |
1.2 |
1,662 |
12.28 |
2 |
1 |
||||||||||||
|
0.00 to <0.10 |
7,702 |
6,523 |
33.08 |
12,617 |
0.05 |
0.3 |
54.72 |
1.3 |
1,477 |
11.70 |
2 |
0 |
||||||||||||
|
0.10 to <0.15 |
742 |
430 |
24.72 |
917 |
0.12 |
0.1 |
35.72 |
0.5 |
185 |
20.20 |
0 |
0 |
||||||||||||
|
0.15 to <0.25 |
139 |
358 |
24.55 |
235 |
0.18 |
0.1 |
40.70 |
1.9 |
88 |
37.58 |
0 |
0 |
||||||||||||
|
0.25 to <0.50 |
470 |
616 |
33.10 |
666 |
0.40 |
0.1 |
40.88 |
1.5 |
363 |
54.55 |
1 |
0 |
||||||||||||
|
0.50 to <0.75 |
323 |
122 |
35.65 |
385 |
0.54 |
0.0 |
39.92 |
2.3 |
327 |
84.80 |
1 |
1 |
||||||||||||
|
0.75 to <2.50 |
3,566 |
1,028 |
29.48 |
3,303 |
1.77 |
0.1 |
24.12 |
1.6 |
1,638 |
49.58 |
14 |
2 |
||||||||||||
|
0.75 to <1.75 |
1,141 |
389 |
24.76 |
932 |
0.84 |
0.0 |
24.22 |
1.4 |
478 |
51.35 |
2 |
1 |
||||||||||||
|
1.75 to <2.5 |
2,425 |
640 |
32.35 |
2,372 |
2.14 |
0.0 |
24.08 |
1.7 |
1,159 |
48.88 |
11 |
1 |
||||||||||||
|
2.50 to <10.00 |
740 |
133 |
22.24 |
701 |
3.64 |
0.0 |
12.84 |
1.1 |
164 |
23.44 |
3 |
1 |
||||||||||||
|
2.50 to <5 |
740 |
128 |
22.33 |
701 |
3.64 |
0.0 |
12.81 |
1.1 |
164 |
23.33 |
3 |
1 |
||||||||||||
|
5 to <10 |
0 |
5 |
20.00 |
1 |
6.01 |
0.0 |
50.85 |
1.0 |
1 |
170.16 |
0 |
0 |
||||||||||||
|
10.00 to <100.00 |
12 |
34 |
20.16 |
16 |
16.19 |
0.0 |
30.62 |
0.4 |
27 |
169.96 |
1 |
0 |
||||||||||||
|
10 to <20 |
12 |
34 |
20.16 |
16 |
16.19 |
0.0 |
30.62 |
0.4 |
27 |
169.96 |
1 |
0 |
||||||||||||
|
20 to <30 |
0 |
0 |
0 |
0 |
0 |
0 |
0 |
0 |
0 |
0 |
0 |
0 |
||||||||||||
|
30.00 to <100.00 |
0 |
0 |
100.00 |
0 |
100.00 |
0.0 |
33.85 |
3.3 |
0 |
0 |
0 |
0 |
||||||||||||
|
100.00 (Default) |
12 |
0 |
0 |
12 |
18.40 |
0.0 |
35.19 |
5.0 |
11 |
90.71 |
1 |
1 |
||||||||||||
|
Sub-total |
13,706 |
9,245 |
31.79 |
18,854 |
0.54 |
0.7 |
45.87 |
1.3 |
4,281 |
22.70 |
23 |
6 |
||||||||||||
110
|
Deutsche Bank |
||
|
Pillar 3 Report as of December 31, 2024 |
||
|
|
Jun 30, 2024 |
|||||||||||||||||||||||
|
in € m. |
a |
b |
c |
d |
e |
f |
g |
h |
i |
j |
k |
l |
||||||||||||
|
(unless stated otherwise) |
On-balance sheet exposures |
Off-balance-sheet exposures pre-CCF |
Exposure weighted average CCF |
Exposure post CCF and post CRM |
Exposure weighted average PD (%) |
Number of |
Exposure weighted average LGD (%) |
Exposure weighted average maturity |
Risk weighted exposure amount after supporting factors |
Density of risk weighted exposure amount |
Expected |
Value |
||||||||||||
|
Corporates |
||||||||||||||||||||||||
|
0.00 to <0.15 |
51,849 |
101,347 |
36.79 |
96,294 |
0.07 |
11.9 |
31.26 |
2.0 |
16,754 |
17.40 |
28 |
16 |
||||||||||||
|
0.00 to <0.10 |
36,955 |
61,749 |
36.72 |
66,166 |
0.06 |
8.4 |
31.92 |
2.0 |
10,387 |
15.70 |
16 |
7 |
||||||||||||
|
0.10 to <0.15 |
14,895 |
39,599 |
36.89 |
30,128 |
0.12 |
3.5 |
29.78 |
1.9 |
6,367 |
21.14 |
12 |
9 |
||||||||||||
|
0.15 to <0.25 |
23,908 |
42,760 |
34.56 |
39,305 |
0.18 |
5.8 |
28.07 |
2.1 |
10,029 |
25.52 |
21 |
16 |
||||||||||||
|
0.25 to <0.50 |
42,116 |
34,560 |
35.44 |
50,856 |
0.35 |
9.7 |
25.42 |
2.3 |
17,407 |
34.23 |
50 |
29 |
||||||||||||
|
0.50 to <0.75 |
23,273 |
21,072 |
34.07 |
26,897 |
0.60 |
5.6 |
28.99 |
2.5 |
12,849 |
47.77 |
46 |
31 |
||||||||||||
|
0.75 to <2.50 |
54,060 |
31,710 |
39.08 |
60,614 |
1.44 |
8.9 |
26.09 |
2.5 |
31,447 |
51.88 |
226 |
154 |
||||||||||||
|
0.75 to <1.75 |
35,860 |
23,188 |
39.41 |
41,616 |
1.13 |
6.4 |
25.23 |
2.7 |
20,801 |
49.98 |
129 |
82 |
||||||||||||
|
1.75 to <2.5 |
18,200 |
8,522 |
38.19 |
18,998 |
2.12 |
2.5 |
27.99 |
2.2 |
10,646 |
56.04 |
97 |
71 |
||||||||||||
|
2.50 to <10.00 |
22,328 |
11,379 |
41.29 |
23,508 |
4.66 |
2.9 |
21.66 |
2.3 |
15,314 |
65.14 |
241 |
206 |
||||||||||||
|
2.50 to <5 |
14,721 |
7,414 |
42.44 |
15,808 |
3.55 |
2.0 |
21.68 |
2.4 |
9,650 |
61.04 |
123 |
100 |
||||||||||||
|
5 to <10 |
7,607 |
3,965 |
39.14 |
7,700 |
6.92 |
0.9 |
21.62 |
2.0 |
5,664 |
73.56 |
118 |
106 |
||||||||||||
|
10.00 to <100.00 |
3,859 |
44,628 |
2.33 |
3,510 |
18.01 |
0.9 |
25.04 |
2.5 |
3,773 |
107.50 |
150 |
88 |
||||||||||||
|
10 to <20 |
2,893 |
2,198 |
42.38 |
2,807 |
12.66 |
0.4 |
25.08 |
2.5 |
3,081 |
109.78 |
86 |
59 |
||||||||||||
|
20 to <30 |
466 |
332 |
23.59 |
316 |
25.80 |
0.1 |
27.34 |
1.9 |
462 |
146.50 |
22 |
16 |
||||||||||||
|
30.00 to <100.00 |
500 |
42,098 |
0.08 |
388 |
50.45 |
0.5 |
22.91 |
3.5 |
230 |
59.27 |
42 |
13 |
||||||||||||
|
100.00 (Default) |
12,261 |
1,644 |
42.64 |
12,158 |
99.74 |
2.5 |
48.76 |
2.0 |
7,145 |
58.77 |
5,190 |
3,818 |
||||||||||||
|
Sub-total |
233,653 |
289,100 |
31.24 |
313,143 |
4.86 |
48.3 |
28.61 |
2.2 |
114,719 |
36.63 |
5,952 |
4,358 |
||||||||||||
|
|
||||||||||||||||||||||||
|
of which: |
||||||||||||||||||||||||
|
SMEs |
||||||||||||||||||||||||
|
0.00 to <0.15 |
4,099 |
1,786 |
40.91 |
5,209 |
0.07 |
2.6 |
30.15 |
3.2 |
700 |
13.44 |
1 |
1 |
||||||||||||
|
0.00 to <0.10 |
2,944 |
1,263 |
43.35 |
3,804 |
0.05 |
1.5 |
29.61 |
3.3 |
433 |
11.38 |
1 |
0 |
||||||||||||
|
0.10 to <0.15 |
1,155 |
523 |
35.02 |
1,405 |
0.11 |
1.1 |
31.60 |
3.0 |
267 |
19.01 |
1 |
0 |
||||||||||||
|
0.15 to <0.25 |
1,961 |
1,389 |
38.14 |
2,461 |
0.20 |
2.1 |
32.53 |
3.0 |
642 |
26.11 |
2 |
1 |
||||||||||||
|
0.25 to <0.50 |
3,917 |
2,209 |
37.74 |
4,630 |
0.35 |
4.8 |
34.17 |
2.6 |
1,512 |
32.66 |
6 |
3 |
||||||||||||
|
0.50 to <0.75 |
2,015 |
1,178 |
44.37 |
2,333 |
0.63 |
2.1 |
39.75 |
2.5 |
1,121 |
48.06 |
6 |
3 |
||||||||||||
|
0.75 to <2.50 |
5,314 |
3,948 |
41.02 |
6,247 |
1.32 |
3.2 |
32.35 |
2.7 |
3,246 |
51.96 |
34 |
19 |
||||||||||||
|
0.75 to <1.75 |
3,965 |
2,951 |
41.73 |
4,801 |
1.08 |
2.0 |
29.46 |
2.8 |
2,200 |
45.82 |
22 |
9 |
||||||||||||
|
1.75 to <2.5 |
1,349 |
997 |
38.91 |
1,446 |
2.10 |
1.2 |
41.96 |
2.3 |
1,047 |
72.36 |
12 |
9 |
||||||||||||
|
2.50 to <10.00 |
1,995 |
975 |
43.52 |
1,884 |
4.79 |
1.4 |
35.59 |
2.1 |
1,432 |
76.00 |
31 |
23 |
||||||||||||
|
2.50 to <5 |
1,322 |
639 |
44.73 |
1,250 |
3.69 |
1.0 |
36.75 |
2.2 |
901 |
72.09 |
16 |
13 |
||||||||||||
|
5 to <10 |
674 |
336 |
41.22 |
634 |
6.97 |
0.5 |
33.30 |
1.9 |
531 |
83.70 |
15 |
11 |
||||||||||||
|
10.00 to <100.00 |
522 |
270 |
39.72 |
411 |
19.40 |
0.3 |
32.83 |
3.1 |
435 |
105.78 |
27 |
16 |
||||||||||||
|
10 to <20 |
308 |
249 |
37.62 |
274 |
12.66 |
0.2 |
29.62 |
2.9 |
256 |
93.35 |
10 |
7 |
||||||||||||
|
20 to <30 |
108 |
4 |
44.59 |
37 |
23.10 |
0.0 |
46.17 |
3.0 |
66 |
179.13 |
4 |
4 |
||||||||||||
|
30.00 to <100.00 |
106 |
17 |
69.93 |
100 |
36.39 |
0.1 |
36.63 |
3.7 |
113 |
112.59 |
13 |
5 |
||||||||||||
|
100.00 (Default) |
580 |
100 |
41.56 |
509 |
100.00 |
0.4 |
62.97 |
1.9 |
264 |
51.81 |
302 |
279 |
||||||||||||
|
Sub-total |
20,403 |
11,853 |
40.57 |
23,684 |
3.38 |
17.0 |
33.89 |
2.7 |
9,352 |
39.49 |
408 |
344 |
||||||||||||
111
|
Deutsche Bank |
||
|
Pillar 3 Report as of December 31, 2024 |
||
|
|
Jun 30, 2024 |
|||||||||||||||||||||||
|
in € m. |
a |
b |
c |
d |
e |
f |
g |
h |
i |
j |
k |
l |
||||||||||||
|
(unless stated otherwise) |
On-balance sheet exposures |
Off-balance-sheet exposures pre-CCF |
Exposure weighted average CCF |
Exposure post CCF and post CRM |
Exposure weighted average PD (%) |
Number of |
Exposure weighted average LGD (%) |
Exposure weighted average maturity |
Risk weighted exposure amount after supporting factors |
Density of risk weighted exposure amount |
Expected |
Value |
||||||||||||
|
Specialized Lending |
||||||||||||||||||||||||
|
0.00 to <0.15 |
1,582 |
121 |
73.19 |
1,670 |
0.11 |
0.0 |
10.40 |
2.9 |
180 |
10.76 |
0 |
0 |
||||||||||||
|
0.00 to <0.10 |
162 |
37 |
99.28 |
199 |
0.08 |
0.0 |
14.05 |
3.3 |
60 |
30.28 |
0 |
0 |
||||||||||||
|
0.10 to <0.15 |
1,419 |
84 |
61.62 |
1,471 |
0.12 |
0.0 |
9.91 |
2.8 |
119 |
8.12 |
0 |
0 |
||||||||||||
|
0.15 to <0.25 |
1,953 |
295 |
48.65 |
2,096 |
0.19 |
0.1 |
10.86 |
2.9 |
219 |
10.47 |
0 |
1 |
||||||||||||
|
0.25 to <0.50 |
7,217 |
810 |
70.77 |
7,624 |
0.40 |
0.2 |
12.82 |
2.4 |
1,289 |
16.90 |
4 |
3 |
||||||||||||
|
0.50 to <0.75 |
1,923 |
1,512 |
54.06 |
2,593 |
0.69 |
0.1 |
17.12 |
2.9 |
937 |
36.13 |
3 |
5 |
||||||||||||
|
0.75 to <2.50 |
17,150 |
2,886 |
55.83 |
18,213 |
1.55 |
0.5 |
14.37 |
2.2 |
5,070 |
27.83 |
43 |
37 |
||||||||||||
|
0.75 to <1.75 |
9,777 |
1,971 |
56.72 |
10,544 |
1.15 |
0.3 |
13.97 |
2.4 |
2,870 |
27.22 |
17 |
15 |
||||||||||||
|
1.75 to <2.5 |
7,373 |
915 |
53.91 |
7,669 |
2.11 |
0.2 |
14.92 |
2.1 |
2,199 |
28.68 |
26 |
22 |
||||||||||||
|
2.50 to <10.00 |
12,682 |
3,135 |
49.00 |
13,119 |
4.70 |
0.3 |
14.72 |
2.1 |
5,148 |
39.25 |
91 |
101 |
||||||||||||
|
2.50 to <5 |
8,050 |
2,330 |
50.06 |
8,605 |
3.48 |
0.2 |
14.41 |
2.2 |
3,071 |
35.69 |
43 |
38 |
||||||||||||
|
5 to <10 |
4,632 |
805 |
45.94 |
4,513 |
7.03 |
0.1 |
15.30 |
1.9 |
2,077 |
46.03 |
49 |
64 |
||||||||||||
|
10.00 to <100.00 |
589 |
80 |
66.70 |
642 |
23.89 |
0.0 |
9.13 |
2.7 |
210 |
32.66 |
16 |
6 |
||||||||||||
|
10 to <20 |
360 |
76 |
68.24 |
413 |
14.15 |
0.0 |
8.96 |
2.4 |
186 |
45.02 |
6 |
4 |
||||||||||||
|
20 to <30 |
61 |
2 |
50.33 |
62 |
22.45 |
0.0 |
3.55 |
2.7 |
10 |
16.57 |
1 |
0 |
||||||||||||
|
30.00 to <100.00 |
168 |
2 |
23.49 |
168 |
48.31 |
0.0 |
11.60 |
3.5 |
14 |
8.21 |
10 |
1 |
||||||||||||
|
100.00 (Default) |
4,889 |
238 |
42.16 |
4,925 |
99.37 |
0.1 |
38.16 |
2.2 |
3,480 |
70.66 |
1,562 |
1,146 |
||||||||||||
|
Sub-total |
47,984 |
9,079 |
54.25 |
50,883 |
11.79 |
1.4 |
16.33 |
2.3 |
16,533 |
32.49 |
1,720 |
1,299 |
||||||||||||
|
Other |
||||||||||||||||||||||||
|
0.00 to <0.15 |
46,169 |
99,440 |
36.67 |
89,415 |
0.07 |
9.3 |
31.71 |
1.9 |
15,874 |
17.75 |
27 |
16 |
||||||||||||
|
0.00 to <0.10 |
33,848 |
60,448 |
36.55 |
62,163 |
0.06 |
6.9 |
32.11 |
1.9 |
9,893 |
15.92 |
15 |
7 |
||||||||||||
|
0.10 to <0.15 |
12,321 |
38,992 |
36.86 |
27,252 |
0.12 |
2.4 |
30.76 |
1.8 |
5,981 |
21.95 |
12 |
9 |
||||||||||||
|
0.15 to <0.25 |
19,995 |
41,076 |
34.33 |
34,749 |
0.18 |
3.7 |
28.80 |
2.0 |
9,167 |
26.38 |
19 |
14 |
||||||||||||
|
0.25 to <0.50 |
30,982 |
31,541 |
34.38 |
38,603 |
0.34 |
4.7 |
26.86 |
2.2 |
14,607 |
37.84 |
41 |
23 |
||||||||||||
|
0.50 to <0.75 |
19,335 |
18,381 |
31.77 |
21,970 |
0.58 |
3.4 |
29.25 |
2.5 |
10,791 |
49.12 |
37 |
23 |
||||||||||||
|
0.75 to <2.50 |
31,596 |
24,876 |
36.83 |
36,154 |
1.41 |
5.3 |
30.92 |
2.6 |
23,131 |
63.98 |
149 |
98 |
||||||||||||
|
0.75 to <1.75 |
22,118 |
18,267 |
37.16 |
26,271 |
1.13 |
4.1 |
28.98 |
2.8 |
15,731 |
59.88 |
90 |
59 |
||||||||||||
|
1.75 to <2.5 |
9,478 |
6,610 |
35.90 |
9,882 |
2.14 |
1.1 |
36.10 |
2.3 |
7,400 |
74.88 |
59 |
40 |
||||||||||||
|
2.50 to <10.00 |
7,650 |
7,269 |
37.66 |
8,506 |
4.56 |
1.1 |
29.28 |
2.7 |
8,734 |
102.68 |
119 |
81 |
||||||||||||
|
2.50 to <5 |
5,350 |
4,445 |
38.11 |
5,953 |
3.63 |
0.8 |
29.02 |
2.8 |
5,678 |
95.38 |
64 |
50 |
||||||||||||
|
5 to <10 |
2,301 |
2,824 |
36.95 |
2,553 |
6.72 |
0.3 |
29.89 |
2.3 |
3,056 |
119.71 |
55 |
32 |
||||||||||||
|
10.00 to <100.00 |
2,748 |
44,278 |
1.99 |
2,456 |
16.24 |
0.6 |
27.90 |
2.4 |
3,129 |
127.36 |
107 |
67 |
||||||||||||
|
10 to <20 |
2,224 |
1,872 |
41.96 |
2,121 |
12.37 |
0.2 |
27.63 |
2.4 |
2,640 |
124.50 |
70 |
48 |
||||||||||||
|
20 to <30 |
297 |
327 |
23.20 |
217 |
27.22 |
0.1 |
30.88 |
1.5 |
386 |
177.82 |
18 |
12 |
||||||||||||
|
30.00 to <100.00 |
227 |
42,079 |
0.05 |
119 |
65.34 |
0.3 |
27.32 |
3.4 |
103 |
86.43 |
19 |
7 |
||||||||||||
|
100.00 (Default) |
6,792 |
1,307 |
42.81 |
6,724 |
100.00 |
1.9 |
55.45 |
1.8 |
3,401 |
50.59 |
3,326 |
2,393 |
||||||||||||
|
Sub-total |
165,266 |
268,168 |
30.05 |
238,576 |
3.52 |
30.0 |
30.70 |
2.2 |
88,834 |
37.23 |
3,824 |
2,715 |
||||||||||||
|
|
||||||||||||||||||||||||
112
|
Deutsche Bank |
||
|
Pillar 3 Report as of December 31, 2024 |
||
|
|
Jun 30, 2024 |
|||||||||||||||||||||||
|
in € m. |
a |
b |
c |
d |
e |
f |
g |
h |
i |
j |
k |
l |
||||||||||||
|
(unless stated otherwise) |
On-balance sheet exposures |
Off-balance-sheet exposures pre-CCF |
Exposure weighted average CCF |
Exposure post CCF and post CRM |
Exposure weighted average PD (%) |
Number of |
Exposure weighted average LGD (%) |
Exposure weighted average maturity |
Risk weighted exposure amount after supporting factors |
Density of risk weighted exposure amount |
Expected |
Value |
||||||||||||
|
Retail |
||||||||||||||||||||||||
|
0.00 to <0.15 |
43,693 |
15,436 |
54.45 |
52,029 |
0.08 |
2,552.6 |
24.66 |
0 |
2,646 |
5.09 |
14 |
4 |
||||||||||||
|
0.00 to <0.10 |
24,971 |
9,411 |
63.87 |
30,960 |
0.06 |
1,826.5 |
25.64 |
0 |
1,430 |
4.62 |
8 |
2 |
||||||||||||
|
0.10 to <0.15 |
18,722 |
6,025 |
39.74 |
21,069 |
0.12 |
726.1 |
23.22 |
0 |
1,215 |
5.77 |
6 |
2 |
||||||||||||
|
0.15 to <0.25 |
30,070 |
3,115 |
67.80 |
32,122 |
0.19 |
750.3 |
21.91 |
0 |
2,681 |
8.35 |
14 |
6 |
||||||||||||
|
0.25 to <0.50 |
40,722 |
3,361 |
64.94 |
42,834 |
0.36 |
807.6 |
23.57 |
0 |
6,231 |
14.55 |
37 |
16 |
||||||||||||
|
0.50 to <0.75 |
17,577 |
1,395 |
74.65 |
18,506 |
0.62 |
375.2 |
23.54 |
0 |
4,039 |
21.82 |
27 |
14 |
||||||||||||
|
0.75 to <2.50 |
39,836 |
3,715 |
64.09 |
41,964 |
1.36 |
1,607.9 |
31.67 |
0 |
18,697 |
44.55 |
214 |
106 |
||||||||||||
|
0.75 to <1.75 |
30,482 |
2,502 |
63.61 |
31,974 |
1.12 |
955.2 |
28.01 |
0 |
11,297 |
35.33 |
102 |
49 |
||||||||||||
|
1.75 to <2.5 |
9,354 |
1,213 |
65.10 |
9,990 |
2.12 |
652.8 |
43.40 |
0 |
7,400 |
74.07 |
112 |
57 |
||||||||||||
|
2.50 to <10.00 |
18,531 |
1,229 |
62.19 |
18,895 |
4.96 |
790.6 |
37.84 |
0 |
15,150 |
80.18 |
347 |
225 |
||||||||||||
|
2.50 to <5 |
11,793 |
982 |
60.27 |
12,100 |
3.76 |
537.5 |
38.65 |
0 |
8,897 |
73.53 |
172 |
102 |
||||||||||||
|
5 to <10 |
6,738 |
247 |
69.79 |
6,794 |
7.11 |
253.1 |
36.39 |
0 |
6,253 |
92.03 |
175 |
123 |
||||||||||||
|
10.00 to <100.00 |
5,722 |
177 |
79.19 |
5,696 |
23.70 |
265.9 |
37.87 |
0 |
7,350 |
129.04 |
494 |
301 |
||||||||||||
|
10 to <20 |
3,080 |
109 |
82.73 |
3,095 |
13.82 |
162.2 |
39.32 |
0 |
3,662 |
118.34 |
167 |
108 |
||||||||||||
|
20 to <30 |
573 |
22 |
52.40 |
543 |
24.93 |
24.7 |
39.90 |
0 |
759 |
139.75 |
54 |
33 |
||||||||||||
|
30.00 to <100.00 |
2,069 |
45 |
83.76 |
2,058 |
38.22 |
79.0 |
35.16 |
0 |
2,929 |
142.31 |
273 |
161 |
||||||||||||
|
100.00 (Default) |
4,392 |
100 |
65.20 |
4,038 |
100.01 |
241.5 |
62.26 |
0 |
1,295 |
32.06 |
2,236 |
2,010 |
||||||||||||
|
Sub-total |
200,543 |
28,528 |
59.91 |
216,084 |
3.36 |
7,391.6 |
27.50 |
0 |
58,087 |
26.88 |
3,382 |
2,682 |
||||||||||||
|
of which: |
||||||||||||||||||||||||
|
Secured by real estate property SMEs |
||||||||||||||||||||||||
|
0.00 to <0.15 |
2,670 |
201 |
62.09 |
2,789 |
0.08 |
13.0 |
18.46 |
0 |
88 |
3.17 |
0 |
0 |
||||||||||||
|
0.00 to <0.10 |
1,770 |
149 |
62.32 |
1,861 |
0.06 |
8.9 |
18.23 |
0 |
47 |
2.54 |
0 |
0 |
||||||||||||
|
0.10 to <0.15 |
900 |
52 |
61.43 |
928 |
0.11 |
4.1 |
18.93 |
0 |
41 |
4.41 |
0 |
0 |
||||||||||||
|
0.15 to <0.25 |
1,209 |
61 |
59.05 |
1,244 |
0.18 |
5.1 |
18.98 |
0 |
78 |
6.25 |
0 |
0 |
||||||||||||
|
0.25 to <0.50 |
2,329 |
90 |
63.02 |
2,383 |
0.37 |
9.8 |
19.82 |
0 |
265 |
11.14 |
2 |
1 |
||||||||||||
|
0.50 to <0.75 |
278 |
17 |
62.02 |
284 |
0.55 |
0.8 |
20.29 |
0 |
43 |
15.04 |
0 |
1 |
||||||||||||
|
0.75 to <2.50 |
2,096 |
68 |
64.23 |
2,130 |
1.28 |
7.7 |
20.02 |
0 |
554 |
26.00 |
5 |
5 |
||||||||||||
|
0.75 to <1.75 |
1,604 |
48 |
69.42 |
1,633 |
1.01 |
5.9 |
20.15 |
0 |
373 |
22.83 |
3 |
3 |
||||||||||||
|
1.75 to <2.5 |
492 |
20 |
52.08 |
497 |
2.17 |
1.8 |
19.62 |
0 |
181 |
36.41 |
2 |
2 |
||||||||||||
|
2.50 to <10.00 |
582 |
17 |
61.57 |
583 |
5.18 |
2.2 |
19.22 |
0 |
328 |
56.32 |
6 |
6 |
||||||||||||
|
2.50 to <5 |
337 |
11 |
60.26 |
336 |
3.64 |
1.2 |
19.01 |
0 |
159 |
47.20 |
2 |
2 |
||||||||||||
|
5 to <10 |
245 |
6 |
64.15 |
247 |
7.28 |
1.0 |
19.51 |
0 |
170 |
68.76 |
3 |
3 |
||||||||||||
|
10.00 to <100.00 |
156 |
3 |
78.60 |
155 |
25.28 |
0.6 |
20.59 |
0 |
161 |
104.14 |
8 |
5 |
||||||||||||
|
10 to <20 |
70 |
1 |
63.44 |
68 |
15.08 |
0.3 |
20.48 |
0 |
65 |
95.64 |
2 |
2 |
||||||||||||
|
20 to <30 |
34 |
0 |
78.44 |
34 |
26.51 |
0.1 |
20.20 |
0 |
36 |
106.32 |
2 |
1 |
||||||||||||
|
30.00 to <100.00 |
52 |
1 |
87.69 |
53 |
37.60 |
0.2 |
20.98 |
0 |
60 |
113.69 |
4 |
2 |
||||||||||||
|
100.00 (Default) |
119 |
0 |
76.62 |
119 |
100.00 |
0.5 |
28.94 |
0 |
59 |
49.72 |
33 |
27 |
||||||||||||
|
Sub-total |
9,438 |
455 |
62.27 |
9,687 |
2.38 |
39.8 |
19.47 |
0 |
1,576 |
16.27 |
55 |
45 |
||||||||||||
113
|
Deutsche Bank |
||
|
Pillar 3 Report as of December 31, 2024 |
||
|
|
Jun 30, 2024 |
|||||||||||||||||||||||
|
in € m. |
a |
b |
c |
d |
e |
f |
g |
h |
i |
j |
k |
l |
||||||||||||
|
(unless stated otherwise) |
On-balance sheet exposures |
Off-balance-sheet exposures pre-CCF |
Exposure weighted average CCF |
Exposure post CCF and post CRM |
Exposure weighted average PD (%) |
Number of |
Exposure weighted average LGD (%) |
Exposure weighted average maturity |
Risk weighted exposure amount after supporting factors |
Density of risk weighted exposure amount |
Expected |
Value |
||||||||||||
|
Secured by real estate property non-SMEs |
||||||||||||||||||||||||
|
0.00 to <0.15 |
38,313 |
887 |
67.09 |
38,908 |
0.09 |
270.6 |
18.16 |
0 |
1,663 |
4.27 |
9 |
2 |
||||||||||||
|
0.00 to <0.10 |
22,058 |
523 |
63.21 |
22,389 |
0.06 |
158.6 |
17.99 |
0 |
799 |
3.57 |
6 |
1 |
||||||||||||
|
0.10 to <0.15 |
16,254 |
364 |
72.67 |
16,519 |
0.12 |
112.0 |
18.39 |
0 |
864 |
5.23 |
4 |
1 |
||||||||||||
|
0.15 to <0.25 |
27,152 |
508 |
80.83 |
27,562 |
0.19 |
186.5 |
18.11 |
0 |
2,064 |
7.49 |
10 |
4 |
||||||||||||
|
0.25 to <0.50 |
35,320 |
582 |
76.35 |
35,761 |
0.36 |
206.3 |
19.24 |
0 |
4,519 |
12.64 |
25 |
11 |
||||||||||||
|
0.50 to <0.75 |
15,967 |
228 |
96.42 |
16,182 |
0.63 |
95.8 |
19.83 |
0 |
3,216 |
19.88 |
20 |
10 |
||||||||||||
|
0.75 to <2.50 |
27,604 |
556 |
84.22 |
28,060 |
1.29 |
187.7 |
19.78 |
0 |
9,659 |
34.42 |
97 |
51 |
||||||||||||
|
0.75 to <1.75 |
23,715 |
407 |
83.20 |
24,046 |
1.13 |
140.6 |
19.72 |
0 |
6,963 |
28.96 |
56 |
27 |
||||||||||||
|
1.75 to <2.5 |
3,889 |
150 |
87.01 |
4,014 |
2.25 |
47.1 |
20.14 |
0 |
2,696 |
67.17 |
41 |
24 |
||||||||||||
|
2.50 to <10.00 |
10,372 |
133 |
85.89 |
10,472 |
5.18 |
61.6 |
19.48 |
0 |
7,242 |
69.16 |
107 |
101 |
||||||||||||
|
2.50 to <5 |
6,244 |
81 |
89.53 |
6,308 |
3.89 |
38.7 |
19.18 |
0 |
3,740 |
59.30 |
47 |
41 |
||||||||||||
|
5 to <10 |
4,128 |
52 |
80.22 |
4,164 |
7.14 |
22.9 |
19.92 |
0 |
3,501 |
84.09 |
59 |
60 |
||||||||||||
|
10.00 to <100.00 |
3,282 |
50 |
91.14 |
3,314 |
24.92 |
18.0 |
20.52 |
0 |
3,883 |
117.19 |
170 |
113 |
||||||||||||
|
10 to <20 |
1,662 |
28 |
93.63 |
1,686 |
13.91 |
9.0 |
20.68 |
0 |
1,892 |
112.23 |
48 |
41 |
||||||||||||
|
20 to <30 |
286 |
1 |
76.79 |
283 |
24.47 |
1.9 |
18.41 |
0 |
327 |
115.42 |
13 |
8 |
||||||||||||
|
30.00 to <100.00 |
1,334 |
20 |
88.66 |
1,344 |
38.83 |
7.2 |
20.77 |
0 |
1,664 |
123.78 |
109 |
64 |
||||||||||||
|
100.00 (Default) |
1,612 |
23 |
93.52 |
1,630 |
100.00 |
13.2 |
28.31 |
0 |
584 |
35.82 |
444 |
327 |
||||||||||||
|
Sub-total |
159,622 |
2,967 |
78.18 |
161,887 |
2.27 |
1,039.7 |
19.07 |
0 |
32,830 |
20.28 |
881 |
620 |
||||||||||||
|
Qualifying Revolving |
||||||||||||||||||||||||
|
0.00 to <0.15 |
51 |
8,667 |
68.50 |
5,988 |
0.07 |
2,013.3 |
57.32 |
0 |
160 |
2.67 |
3 |
1 |
||||||||||||
|
0.00 to <0.10 |
31 |
6,611 |
68.37 |
4,551 |
0.06 |
1,512.1 |
58.08 |
0 |
101 |
2.23 |
2 |
1 |
||||||||||||
|
0.10 to <0.15 |
20 |
2,056 |
68.94 |
1,437 |
0.12 |
501.3 |
54.93 |
0 |
59 |
4.08 |
1 |
0 |
||||||||||||
|
0.15 to <0.25 |
34 |
1,485 |
72.55 |
1,111 |
0.19 |
408.8 |
57.26 |
0 |
68 |
6.11 |
1 |
0 |
||||||||||||
|
0.25 to <0.50 |
90 |
1,111 |
75.68 |
930 |
0.34 |
383.1 |
59.83 |
0 |
97 |
10.43 |
2 |
1 |
||||||||||||
|
0.50 to <0.75 |
42 |
332 |
87.00 |
331 |
0.54 |
125.2 |
54.25 |
0 |
45 |
13.60 |
1 |
0 |
||||||||||||
|
0.75 to <2.50 |
226 |
690 |
84.30 |
808 |
1.34 |
489.6 |
59.85 |
0 |
240 |
29.67 |
6 |
3 |
||||||||||||
|
0.75 to <1.75 |
154 |
558 |
83.75 |
622 |
1.06 |
337.6 |
59.62 |
0 |
156 |
25.09 |
4 |
2 |
||||||||||||
|
1.75 to <2.5 |
72 |
131 |
86.62 |
186 |
2.28 |
152.0 |
60.65 |
0 |
84 |
45.02 |
3 |
1 |
||||||||||||
|
2.50 to <10.00 |
122 |
135 |
90.45 |
244 |
5.24 |
237.3 |
60.62 |
0 |
193 |
79.33 |
8 |
4 |
||||||||||||
|
2.50 to <5 |
61 |
81 |
89.52 |
133 |
3.82 |
119.9 |
60.00 |
0 |
85 |
64.12 |
3 |
2 |
||||||||||||
|
5 to <10 |
61 |
54 |
91.83 |
110 |
6.96 |
117.4 |
61.38 |
0 |
108 |
97.71 |
5 |
3 |
||||||||||||
|
10.00 to <100.00 |
120 |
44 |
106.44 |
167 |
23.57 |
127.8 |
56.96 |
0 |
259 |
155.52 |
23 |
12 |
||||||||||||
|
10 to <20 |
57 |
34 |
107.90 |
94 |
14.01 |
81.1 |
55.10 |
0 |
121 |
129.15 |
7 |
4 |
||||||||||||
|
20 to <30 |
8 |
2 |
72.89 |
9 |
26.46 |
6.3 |
73.97 |
0 |
21 |
226.10 |
2 |
1 |
||||||||||||
|
30.00 to <100.00 |
54 |
9 |
106.74 |
64 |
37.16 |
40.4 |
57.17 |
0 |
117 |
183.73 |
14 |
7 |
||||||||||||
|
100.00 (Default) |
156 |
6 |
89.00 |
144 |
100.00 |
103.2 |
88.36 |
0 |
111 |
76.67 |
108 |
110 |
||||||||||||
|
Sub-total |
840 |
12,468 |
71.37 |
9,722 |
2.25 |
3,888.2 |
58.20 |
0 |
1,173 |
12.06 |
152 |
132 |
||||||||||||
114
|
Deutsche Bank |
||
|
Pillar 3 Report as of December 31, 2024 |
||
|
|
Jun 30, 2024 |
|||||||||||||||||||||||
|
in € m. |
a |
b |
c |
d |
e |
f |
g |
h |
i |
j |
k |
l |
||||||||||||
|
(unless stated otherwise) |
On-balance sheet exposures |
Off-balance-sheet exposures pre-CCF |
Exposure weighted average CCF |
Exposure post CCF and post CRM |
Exposure weighted average PD (%) |
Number of |
Exposure weighted average LGD (%) |
Exposure weighted average maturity |
Risk weighted exposure amount after supporting factors |
Density of risk weighted exposure amount |
Expected |
Value |
||||||||||||
|
Other retail SMEs |
||||||||||||||||||||||||
|
0.00 to <0.15 |
743 |
2,410 |
26.47 |
1,298 |
0.09 |
43.5 |
49.20 |
0 |
447 |
34.48 |
1 |
0 |
||||||||||||
|
0.00 to <0.10 |
335 |
788 |
46.94 |
657 |
0.06 |
26.5 |
56.08 |
0 |
378 |
57.59 |
0 |
0 |
||||||||||||
|
0.10 to <0.15 |
408 |
1,622 |
16.52 |
641 |
0.12 |
17.0 |
42.14 |
0 |
69 |
10.77 |
0 |
0 |
||||||||||||
|
0.15 to <0.25 |
311 |
365 |
41.49 |
406 |
0.19 |
11.0 |
59.76 |
0 |
81 |
19.97 |
0 |
0 |
||||||||||||
|
0.25 to <0.50 |
620 |
622 |
36.25 |
768 |
0.37 |
19.2 |
60.09 |
0 |
250 |
32.52 |
2 |
1 |
||||||||||||
|
0.50 to <0.75 |
262 |
261 |
48.71 |
274 |
0.60 |
5.6 |
61.14 |
0 |
106 |
38.59 |
1 |
0 |
||||||||||||
|
0.75 to <2.50 |
1,115 |
1,024 |
35.38 |
1,227 |
1.37 |
25.5 |
59.53 |
0 |
696 |
56.70 |
10 |
5 |
||||||||||||
|
0.75 to <1.75 |
658 |
698 |
35.22 |
807 |
1.06 |
17.3 |
59.44 |
0 |
432 |
53.59 |
5 |
2 |
||||||||||||
|
1.75 to <2.5 |
457 |
325 |
35.71 |
420 |
1.96 |
8.2 |
59.70 |
0 |
263 |
62.66 |
5 |
2 |
||||||||||||
|
2.50 to <10.00 |
831 |
442 |
32.70 |
615 |
4.53 |
13.8 |
59.34 |
0 |
432 |
70.13 |
16 |
8 |
||||||||||||
|
2.50 to <5 |
627 |
386 |
31.20 |
487 |
3.76 |
10.2 |
58.45 |
0 |
330 |
67.85 |
10 |
5 |
||||||||||||
|
5 to <10 |
204 |
56 |
42.93 |
129 |
7.45 |
3.6 |
62.73 |
0 |
101 |
78.75 |
6 |
4 |
||||||||||||
|
10.00 to <100.00 |
254 |
37 |
41.32 |
126 |
21.55 |
4.0 |
66.44 |
0 |
143 |
113.71 |
17 |
8 |
||||||||||||
|
10 to <20 |
124 |
23 |
44.09 |
66 |
13.56 |
2.0 |
65.77 |
0 |
64 |
96.03 |
6 |
3 |
||||||||||||
|
20 to <30 |
62 |
9 |
33.20 |
28 |
24.78 |
1.1 |
64.36 |
0 |
33 |
116.80 |
4 |
2 |
||||||||||||
|
30.00 to <100.00 |
68 |
5 |
44.10 |
31 |
35.57 |
0.9 |
69.71 |
0 |
46 |
148.33 |
7 |
4 |
||||||||||||
|
100.00 (Default) |
408 |
26 |
42.79 |
269 |
100.00 |
4.7 |
70.21 |
0 |
96 |
35.69 |
188 |
217 |
||||||||||||
|
Sub-total |
4,544 |
5,188 |
32.30 |
4,982 |
6.96 |
127.2 |
57.76 |
0 |
2,250 |
45.16 |
234 |
239 |
||||||||||||
|
Other retail non-SMEs |
||||||||||||||||||||||||
|
0.00 to <0.15 |
1,916 |
3,271 |
33.95 |
3,046 |
0.09 |
564.4 |
38.77 |
0 |
287 |
9.42 |
1 |
0 |
||||||||||||
|
0.00 to <0.10 |
776 |
1,340 |
52.07 |
1,502 |
0.06 |
368.4 |
37.34 |
0 |
104 |
6.94 |
0 |
0 |
||||||||||||
|
0.10 to <0.15 |
1,140 |
1,931 |
21.38 |
1,545 |
0.12 |
196.0 |
40.15 |
0 |
183 |
11.83 |
1 |
0 |
||||||||||||
|
0.15 to <0.25 |
1,365 |
696 |
62.74 |
1,799 |
0.19 |
245.5 |
51.80 |
0 |
390 |
21.70 |
2 |
1 |
||||||||||||
|
0.25 to <0.50 |
2,363 |
957 |
64.39 |
2,992 |
0.37 |
319.9 |
57.71 |
0 |
1,101 |
36.78 |
6 |
3 |
||||||||||||
|
0.50 to <0.75 |
1,028 |
557 |
70.93 |
1,435 |
0.60 |
190.8 |
51.83 |
0 |
629 |
43.82 |
4 |
2 |
||||||||||||
|
0.75 to <2.50 |
8,794 |
1,377 |
67.19 |
9,740 |
1.57 |
1,047.9 |
62.63 |
0 |
7,548 |
77.50 |
95 |
42 |
||||||||||||
|
0.75 to <1.75 |
4,350 |
791 |
64.03 |
4,866 |
1.12 |
565.0 |
62.35 |
0 |
3,373 |
69.30 |
34 |
15 |
||||||||||||
|
1.75 to <2.5 |
4,444 |
587 |
71.45 |
4,873 |
2.01 |
482.9 |
62.91 |
0 |
4,176 |
85.68 |
62 |
28 |
||||||||||||
|
2.50 to <10.00 |
6,625 |
502 |
74.30 |
6,981 |
4.65 |
529.6 |
64.24 |
0 |
6,955 |
99.62 |
211 |
106 |
||||||||||||
|
2.50 to <5 |
4,524 |
423 |
75.59 |
4,836 |
3.60 |
397.0 |
62.82 |
0 |
4,582 |
94.75 |
109 |
53 |
||||||||||||
|
5 to <10 |
2,101 |
79 |
67.38 |
2,145 |
7.02 |
132.6 |
67.45 |
0 |
2,373 |
110.62 |
102 |
53 |
||||||||||||
|
10.00 to <100.00 |
1,910 |
43 |
70.31 |
1,935 |
21.62 |
145.7 |
65.46 |
0 |
2,903 |
150.04 |
277 |
162 |
||||||||||||
|
10 to <20 |
1,167 |
24 |
71.92 |
1,181 |
13.63 |
85.9 |
64.28 |
0 |
1,521 |
128.76 |
104 |
58 |
||||||||||||
|
20 to <30 |
184 |
10 |
64.00 |
188 |
25.29 |
18.0 |
70.41 |
0 |
342 |
181.44 |
34 |
21 |
||||||||||||
|
30.00 to <100.00 |
560 |
10 |
72.58 |
566 |
37.08 |
41.8 |
66.29 |
0 |
1,041 |
184.00 |
139 |
83 |
||||||||||||
|
100.00 (Default) |
2,097 |
45 |
60.16 |
1,876 |
100.03 |
141.1 |
90.71 |
0 |
445 |
23.73 |
1,462 |
1,329 |
||||||||||||
|
Sub-total |
26,098 |
7,449 |
52.55 |
29,805 |
9.39 |
3,184.9 |
60.85 |
0 |
20,258 |
67.97 |
2,059 |
1,646 |
||||||||||||
|
All exposure classes |
||||||||||||||||||||||||
|
Total |
563,589 |
328,749 |
33.78 |
673,309 |
3.42 |
7,440.8 |
35.76 |
2.0 |
195,043 |
28.97 |
9,643 |
7,101 |
||||||||||||
115
|
Deutsche Bank |
||
|
Pillar 3 Report as of December 31, 2024 |
||
Total IRB exposure covered by credit derivatives
Article 453 (j) CRR
The table below presents the Group’s IRB exposures, split into FIRB and AIRB. The table shows the RWA by the relevant exposure classes prior and after the usage of CRM techniques in the form of credit derivatives, where the exposure is then assigned to the exposure class of the protection seller.
EU CR7 – IRB approach – Effect on the RWAs of credit derivatives used as CRM techniques
|
|
Dec 31, 2024 |
Jun 30, 2024 |
||||||||
|
a |
b |
a |
b |
|||||||
|
in € m. |
pre-credit derivatives RWA |
Actual RWA |
pre-credit derivatives RWA |
Actual RWA |
||||||
|
1 |
Exposures under FIRB |
|||||||||
|
2 |
Central governments and central banks |
0 |
0 |
0 |
0 |
|||||
|
3 |
Institutions |
5 |
5 |
4 |
4 |
|||||
|
3a |
Corporates |
1,336 |
1,336 |
1,526 |
1,526 |
|||||
|
of which: |
||||||||||
|
4 |
SMEs |
168 |
168 |
27 |
27 |
|||||
|
5 |
Specialized lending |
313 |
313 |
342 |
342 |
|||||
|
Others |
856 |
856 |
1,157 |
1,157 |
||||||
|
6a |
Sub-total FIRB |
1,342 |
1,342 |
1,530 |
1,530 |
|||||
|
7 |
Exposures under AIRB |
|||||||||
|
8 |
Central governments and central banks |
17,855 |
17,855 |
17,956 |
17,956 |
|||||
|
9 |
Institutions |
3,206 |
3,251 |
4,231 |
4,281 |
|||||
|
9a |
Corporates |
114,466 |
113,904 |
115,344 |
114,719 |
|||||
|
of which: |
||||||||||
|
10 |
SMEs |
8,652 |
8,652 |
9,352 |
9,352 |
|||||
|
11 |
Specialized lending |
17,302 |
17,302 |
16,533 |
16,533 |
|||||
|
Others |
88,513 |
87,951 |
89,458 |
88,834 |
||||||
|
12a |
Retail |
59,488 |
59,488 |
58,087 |
58,087 |
|||||
|
of which: |
||||||||||
|
13 |
Secured by real estate property SMEs |
184 |
184 |
1,576 |
1,576 |
|||||
|
14 |
Secured by real estate property non-SMEs |
38,316 |
38,316 |
32,830 |
32,830 |
|||||
|
15 |
Qualifying revolving |
1,431 |
1,431 |
1,173 |
1,173 |
|||||
|
16 |
Other retail SMEs |
970 |
970 |
2,250 |
2,250 |
|||||
|
17 |
Other retail non-SMEs |
18,587 |
18,587 |
20,258 |
20,258 |
|||||
|
19a |
Sub-total AIRB |
195,015 |
194,498 |
195,617 |
195,043 |
|||||
|
20 |
Total |
196,357 |
195,840 |
197,148 |
196,573 |
|||||
Deutsche Bank´s RWA for exposures under the IRB approach were € 195.8 billion as of December 31, 2024, in comparison to € 196.6 billion as of June 30, 2024. The decrease of € 0.7 billion was predominantly driven by a decrease in RWA within the Group’s AIRB for the exposure classes “Retail – Other retail non-SME”, “Retail – Secured by real estate property SMEs”, “Retail – Other retail SMEs”, “Institutions”, “Corporates – Other” and “Corporates – SMEs”. This decrease was partly offset by an increase within the Group’s AIRB for the exposure classes “Retail – Secured by real estate property non-SMEs” and “Corporates – Specialized lending”. RWA for corporate exposures mainly benefitted from the application of credit derivatives.
Total IRB exposure covered by the use of CRM techniques
Article 453 (g) CRR
The two tables below present the Group´s FIRB and AIRB exposures and the extent of the use of CRM techniques broken down by exposure classes. The CRM techniques are separately shown for funded credit protection and unfunded credit protection. For funded credit protection the table also presents a split between the part of exposures covered by other eligible collateral and the part of exposures covered by other funded credit protection. Additionally, the RWA without substitution effects (reduction effects only) and the RWA with substitution effects (both reduction and substitution effects) are shown.
116
|
Deutsche Bank |
||
|
Pillar 3 Report as of December 31, 2024 |
||
EU CR7-A – Foundation IRB approach – Extent of the use of CRM techniques
|
|
Dec 31, 2024 |
|||||||||||||||||||||||||||||
|
a |
b |
c |
d |
e |
f |
g |
h |
i |
j |
k |
l |
m |
n |
|||||||||||||||||
|
Credit risk mitigation techniques |
Credit risk Mitigation methods in the calculation of RWEAs |
|||||||||||||||||||||||||||||
|
Total exposures |
Funded credit protection (FCP) |
Unfunded credit protection (UFCP) |
RWA without substitution effects |
RWA with substitution effects |
||||||||||||||||||||||||||
|
Part of exposures covered by Financial Collaterals (%) |
Part of exposures covered by Other eligible collaterals (%) |
Part of exposures covered by Other funded credit protection (%) |
Part of exposures covered by Guarantees (%) |
Part of exposures covered by Credit Derivatives (%) |
||||||||||||||||||||||||||
|
in € m. (unless stated otherwise) |
Total |
of which: |
of which: |
of which: |
Total |
of which: |
of which: |
of which: |
||||||||||||||||||||||
|
1 |
Central governments and central banks |
0 |
0.00 |
0.00 |
0.00 |
0.00 |
0.00 |
0.00 |
0.00 |
0.00 |
0.00 |
0.00 |
0.00 |
0 |
0 |
|||||||||||||||
|
2 |
Institutions |
40 |
0.00 |
0.00 |
0.00 |
0.00 |
0.00 |
0.00 |
0.00 |
0.00 |
0.00 |
0.00 |
0.00 |
5 |
5 |
|||||||||||||||
|
3 |
Corporates |
6,213 |
0.00 |
5.36 |
5.36 |
0.00 |
0.00 |
0.00 |
0.00 |
0.00 |
0.00 |
0.00 |
0.00 |
1,336 |
1,336 |
|||||||||||||||
|
3 |
of which: |
|||||||||||||||||||||||||||||
|
3.1 |
SME |
379 |
0.00 |
0.00 |
0.00 |
0.00 |
0.00 |
0.00 |
0.00 |
0.00 |
0.00 |
0.00 |
0.00 |
168 |
168 |
|||||||||||||||
|
3.2 |
Specialized lending |
488 |
0.00 |
68.27 |
68.27 |
0.00 |
0.00 |
0.00 |
0.00 |
0.00 |
0.00 |
0.00 |
0.00 |
313 |
313 |
|||||||||||||||
|
3.3 |
Other |
5,345 |
0.00 |
0.00 |
0.00 |
0.00 |
0.00 |
0.00 |
0.00 |
0.00 |
0.00 |
0.00 |
0.00 |
856 |
856 |
|||||||||||||||
|
4 |
Total |
6,253 |
0.00 |
5.33 |
5.33 |
0.00 |
0.00 |
0.00 |
0.00 |
0.00 |
0.00 |
0.00 |
0.00 |
1,342 |
1,342 |
|||||||||||||||
117
|
Deutsche Bank |
||
|
Pillar 3 Report as of December 31, 2024 |
||
|
|
Jun 30, 2024 |
|||||||||||||||||||||||||||||
|
a |
b |
c |
d |
e |
f |
g |
h |
i |
j |
k |
l |
m |
n |
|||||||||||||||||
|
Credit risk mitigation techniques |
Credit risk Mitigation methods in the calculation of RWEAs |
|||||||||||||||||||||||||||||
|
Total exposures |
Funded credit protection (FCP) |
Unfunded credit protection (UFCP) |
RWA without substitution effects |
RWA with substitution effects |
||||||||||||||||||||||||||
|
Part of exposures covered by Financial Collaterals (%) |
Part of exposures covered by Other eligible collaterals (%) |
Part of exposures covered by Other funded credit protection (%) |
Part of exposures covered by Guarantees (%) |
Part of exposures covered by Credit Derivatives (%) |
||||||||||||||||||||||||||
|
in € m. (unless stated otherwise) |
Total |
of which: |
of which: |
of which: |
Total |
of which: |
of which: |
of which: |
||||||||||||||||||||||
|
1 |
Central governments and central banks |
0 |
0.00 |
0.00 |
0.00 |
0.00 |
0.00 |
0.00 |
0.00 |
0.00 |
0.00 |
0.00 |
0.00 |
0 |
0 |
|||||||||||||||
|
2 |
Institutions |
34 |
0.00 |
0.00 |
0.00 |
0.00 |
0.00 |
0.00 |
0.00 |
0.00 |
0.00 |
0.00 |
0.00 |
4 |
4 |
|||||||||||||||
|
3 |
Corporates |
6,057 |
0.00 |
4.47 |
4.47 |
0.00 |
0.00 |
0.00 |
0.00 |
0.00 |
0.00 |
0.00 |
0.00 |
1,526 |
1,526 |
|||||||||||||||
|
3 |
of which: |
|||||||||||||||||||||||||||||
|
3.1 |
SME |
86 |
0.00 |
0.00 |
0.00 |
0.00 |
0.00 |
0.00 |
0.00 |
0.00 |
0.00 |
0.00 |
0.00 |
27 |
27 |
|||||||||||||||
|
3.2 |
Specialized lending |
493 |
0.00 |
54.93 |
54.93 |
0.00 |
0.00 |
0.00 |
0.00 |
0.00 |
0.00 |
0.00 |
0.00 |
342 |
342 |
|||||||||||||||
|
3.3 |
Other |
5,478 |
0.00 |
0.00 |
0.00 |
0.00 |
0.00 |
0.00 |
0.00 |
0.00 |
0.00 |
0.00 |
0.00 |
1,157 |
1,157 |
|||||||||||||||
|
4 |
Total |
6,092 |
0.00 |
4.44 |
4.44 |
0.00 |
0.00 |
0.00 |
0.00 |
0.00 |
0.00 |
0.00 |
0.00 |
1,530 |
1,530 |
|||||||||||||||
118
|
Deutsche Bank |
||
|
Pillar 3 Report as of December 31, 2024 |
||
EU CR7-A – Advanced IRB approach – Extent of the use of CRM techniques
|
|
Dec 31, 2024 |
|||||||||||||||||||||||||||||
|
a |
b |
c |
d |
e |
f |
g |
h |
i |
j |
k |
l |
m |
n |
|||||||||||||||||
|
Credit risk mitigation techniques |
Credit risk Mitigation methods in the calculation of RWEAs |
|||||||||||||||||||||||||||||
|
Total exposures |
Funded credit protection (FCP) |
Unfunded credit protection (UFCP) |
RWA without substitution effects |
RWA with substitution effects |
||||||||||||||||||||||||||
|
Part of exposures covered by Financial Collaterals (%) |
Part of exposures covered by Other eligible collaterals (%) |
Part of exposures covered by Other funded credit protection (%) |
Part of exposures covered by Guarantees (%) |
Part of exposures covered by Credit Derivatives (%) |
||||||||||||||||||||||||||
|
in € m. (unless stated otherwise) |
Total |
of which: |
of which: |
of which: |
Total |
of which: |
of which: |
of which: |
||||||||||||||||||||||
|
1 |
Central governments and central banks |
135,860 |
0.01 |
0.00 |
0.00 |
0.00 |
0.00 |
0.00 |
0.00 |
0.00 |
0.00 |
0.00 |
0.00 |
19,086 |
17,855 |
|||||||||||||||
|
2 |
Institutions |
16,495 |
12.91 |
0.91 |
0.85 |
0.06 |
0.00 |
1.05 |
0.51 |
0.53 |
0.00 |
0.00 |
0.00 |
2,927 |
3,251 |
|||||||||||||||
|
3 |
Corporates |
316,235 |
16.49 |
22.92 |
19.38 |
1.02 |
2.51 |
1.32 |
1.03 |
0.29 |
0.00 |
0.63 |
0.00 |
113,419 |
113,904 |
|||||||||||||||
|
of which: |
||||||||||||||||||||||||||||||
|
3.1 |
SME |
25,888 |
14.66 |
34.57 |
30.32 |
0.19 |
4.06 |
0.14 |
0.10 |
0.05 |
0.00 |
4.73 |
0.00 |
8,449 |
8,652 |
|||||||||||||||
|
3.2 |
Specialized lending |
52,537 |
3.29 |
62.50 |
59.48 |
0.07 |
2.96 |
0.02 |
0.02 |
0.00 |
0.00 |
0.00 |
0.00 |
17,716 |
17,302 |
|||||||||||||||
|
3.3 |
Other |
237,810 |
19.61 |
12.90 |
9.33 |
1.32 |
2.25 |
1.73 |
1.36 |
0.37 |
0.00 |
0.33 |
0.00 |
87,254 |
87,951 |
|||||||||||||||
|
4 |
Retail |
210,782 |
2.77 |
70.12 |
69.93 |
0.18 |
0.01 |
0.24 |
0.00 |
0.24 |
0.00 |
0.60 |
0.00 |
59,468 |
59,488 |
|||||||||||||||
|
of which: |
||||||||||||||||||||||||||||||
|
4.1 |
Secured by real estate property SMEs |
1,016 |
2.06 |
65.02 |
64.86 |
0.08 |
0.07 |
0.31 |
0.00 |
0.31 |
0.00 |
14.47 |
0.00 |
184 |
184 |
|||||||||||||||
|
4.2 |
Secured by real estate property non-SMEs |
166,929 |
2.12 |
88.03 |
87.85 |
0.17 |
0.00 |
0.27 |
0.00 |
0.27 |
0.00 |
0.28 |
0.00 |
38,316 |
38,316 |
|||||||||||||||
|
4.3 |
Qualifying revolving |
9,248 |
0.39 |
0.05 |
0.00 |
0.05 |
0.00 |
0.00 |
0.00 |
0.00 |
0.00 |
0.01 |
0.00 |
1,431 |
1,431 |
|||||||||||||||
|
4.4 |
Other retail SMEs |
3,900 |
2.69 |
0.41 |
0.07 |
0.19 |
0.15 |
0.02 |
0.00 |
0.02 |
0.00 |
8.33 |
0.00 |
967 |
970 |
|||||||||||||||
|
4.5 |
Other retail non-SMEs |
29,688 |
7.20 |
0.59 |
0.28 |
0.28 |
0.03 |
0.18 |
0.01 |
0.17 |
0.00 |
1.11 |
0.00 |
18,570 |
18,587 |
|||||||||||||||
|
5 |
Total |
679,372 |
8.85 |
32.44 |
30.74 |
0.53 |
1.17 |
0.71 |
0.49 |
0.22 |
0.00 |
0.48 |
0.00 |
194,900 |
194,498 |
|||||||||||||||
119
|
Deutsche Bank |
||
|
Pillar 3 Report as of December 31, 2024 |
||
|
|
Jun 30, 2024 |
|||||||||||||||||||||||||||||
|
a |
b |
c |
d |
e |
f |
g |
h |
i |
j |
k |
l |
m |
n |
|||||||||||||||||
|
Credit risk mitigation techniques |
Credit risk Mitigation methods in the calculation of RWEAs |
|||||||||||||||||||||||||||||
|
Total exposures |
Funded credit protection (FCP) |
Unfunded credit protection (UFCP) |
RWA without substitution effects |
RWA with substitution effects |
||||||||||||||||||||||||||
|
Part of exposures covered by Financial Collaterals (%) |
Part of exposures covered by Other eligible collaterals (%) |
Part of exposures covered by Other funded credit protection (%) |
Part of exposures covered by Guarantees (%) |
Part of exposures covered by Credit Derivatives (%) |
||||||||||||||||||||||||||
|
in € m. (unless stated otherwise) |
Total |
of which: |
of which: |
of which: |
Total |
of which: |
of which: |
of which: |
||||||||||||||||||||||
|
1 |
Central governments and central banks |
125,228 |
0.01 |
0.00 |
0.00 |
0.00 |
0.00 |
0.04 |
0.04 |
0.00 |
0.00 |
0.00 |
0.00 |
19,269 |
17,956 |
|||||||||||||||
|
2 |
Institutions |
18,854 |
15.11 |
1.32 |
0.62 |
0.00 |
0.70 |
0.58 |
0.58 |
0.00 |
0.00 |
0.00 |
0.00 |
3,961 |
4,281 |
|||||||||||||||
|
3 |
Corporates |
314,224 |
16.08 |
23.78 |
19.99 |
1.12 |
2.67 |
1.16 |
0.86 |
0.30 |
0.00 |
0.47 |
0.00 |
114,275 |
114,719 |
|||||||||||||||
|
of which: |
||||||||||||||||||||||||||||||
|
3.1 |
SME |
23,684 |
11.01 |
29.65 |
25.71 |
0.21 |
3.73 |
0.22 |
0.12 |
0.10 |
0.00 |
4.52 |
0.00 |
9,459 |
9,352 |
|||||||||||||||
|
3.2 |
Specialized lending |
50,883 |
3.15 |
68.63 |
63.15 |
0.00 |
5.48 |
0.04 |
0.04 |
0.00 |
0.00 |
0.00 |
0.00 |
16,918 |
16,533 |
|||||||||||||||
|
3.3 |
Other |
239,657 |
19.32 |
13.68 |
10.26 |
1.44 |
1.97 |
1.50 |
1.11 |
0.39 |
0.00 |
0.17 |
0.00 |
87,897 |
88,834 |
|||||||||||||||
|
4 |
Retail |
216,084 |
2.83 |
66.93 |
66.74 |
0.18 |
0.01 |
0.27 |
0.00 |
0.26 |
0.00 |
0.38 |
0.00 |
57,967 |
58,087 |
|||||||||||||||
|
of which: |
||||||||||||||||||||||||||||||
|
4.1 |
Secured by real estate property SMEs |
9,687 |
1.81 |
77.76 |
77.40 |
0.34 |
0.02 |
1.11 |
0.00 |
1.11 |
0.00 |
2.24 |
0.00 |
1,586 |
1,576 |
|||||||||||||||
|
4.2 |
Secured by real estate property non-SMEs |
161,887 |
2.49 |
84.54 |
84.38 |
0.16 |
0.00 |
0.25 |
0.00 |
0.25 |
0.00 |
0.12 |
0.00 |
32,857 |
32,830 |
|||||||||||||||
|
4.3 |
Qualifying revolving |
9,722 |
0.56 |
0.03 |
0.00 |
0.03 |
0.00 |
0.00 |
0.00 |
0.00 |
0.00 |
0.01 |
0.00 |
1,173 |
1,173 |
|||||||||||||||
|
4.4 |
Other retail SMEs |
4,982 |
4.24 |
2.13 |
0.16 |
1.65 |
0.32 |
0.66 |
0.00 |
0.66 |
0.00 |
6.02 |
0.00 |
2,166 |
2,250 |
|||||||||||||||
|
4.5 |
Other retail non-SMEs |
29,805 |
5.49 |
0.39 |
0.33 |
0.05 |
0.00 |
0.10 |
0.01 |
0.09 |
0.00 |
0.40 |
0.00 |
20,186 |
20,258 |
|||||||||||||||
|
5 |
Total |
674,390 |
8.82 |
32.56 |
30.72 |
0.58 |
1.27 |
0.65 |
0.43 |
0.22 |
0.00 |
0.34 |
0.00 |
195,473 |
195,043 |
|||||||||||||||
120
|
Deutsche Bank |
||
|
Pillar 3 Report as of December 31, 2024 |
||
Development of credit risk RWA
Article 438 (h) CRR
The following table provides an analysis of key drivers for RWA movements observed for credit risk, excluding counterparty credit risk, covered in the IRB approaches in the current and previous reporting period.
EU CR8 – RWA flow statement of credit risk exposures under the IRB approach
|
|
Three months ended Dec 31, 2024 |
Three months ended Sep 30, 2024 |
|||||
|
a |
a |
||||||
|
in € m. |
RWA |
RWA |
|||||
|
1 |
Risk weighted exposure amount as at the end of the previous reporting period |
191,250 |
194,023 |
||||
|
2 |
Asset size |
(2,944) |
(1,366) |
||||
|
3 |
Asset quality |
(1,442) |
(2,130) |
||||
|
4 |
Model updates |
(190) |
3,605 |
||||
|
5 |
Methodology and policy |
3,676 |
501 |
||||
|
6 |
Acquisitions and disposals |
0 |
0 |
||||
|
7 |
Foreign exchange movements |
4,006 |
(3,383) |
||||
|
8 |
Other |
0 |
0 |
||||
|
9 |
Risk weighted exposure amount as at the end of the reporting period |
194,355 |
191,250 |
||||
Organic changes in the Group’s portfolio size and composition are considered in the category “Asset size”. The category “Asset quality” represents the effects from portfolio rating migrations, loss given default, model parameter recalibrations as well as collateral coverage and netting activities. “Model updates” include model refinements and further roll out of advanced internal models. RWA movements resulting from externally, regulatory-driven changes, e.g., applying new regulations, are considered in the “Methodology and policy” section. “Acquisition and disposals” is related to significant exposure movements which can be clearly assigned to acquisition or disposal related activities. Changes that cannot be attributed to the above categories are reflected in the category “other”.
RWA for credit risk exposures under the IRB approach increased by € 3.1 billion or 1.6% since September 30, 2024, mainly resulting from the categories “Foreign exchange movements” and “Methodology and policy”, partly offset by categories “Asset size”, “Asset quality” and “Model updates”. The increase in category “Methodology and policy” is mainly driven by impacts from the introduction of new models due to regulatory changes, partly offset by impacts from the remediation of regulatory obligations. The mentioned increases were partly offset by a decrease in category “Asset size”, mainly reflecting the impact of a new synthetic securitization within the Private Bank and reduced exposures in Corporate & Other. Additionally, the decrease in category “Asset quality” is primarily driven by capital efficiency measures, partly offset by counterparty rating deteriorations. Furthermore, the decrease in category “Model updates” is primarily due to updated margin of conservatism applied on a key model input.
Model validation results
Article 452 (h) CRR
Foundation IRBA – Model validation results
Only for one portfolio at DB Private Bank the foundation IRBA approach is still applied. Respective model parameter was validated as appropriately conservative.
The below table EU CR9 aims at providing backtesting information for probabilities of default in comparing the PD used in the foundation IRB capital calculations with the effective obligors’ default rates presented on a five year average by regulatory exposure classes. The conceptual design as well as the structural limitations to be considered are described in the introduction of the advanced IRB backtesting table further down below in this report.
121
|
Deutsche Bank |
||
|
Pillar 3 Report as of December 31, 2024 |
||
EU CR9 IRB backtesting of PD per exposure class for Foundation IRBA
|
|
Dec 31, 2024 |
|||||||||||
|
a/b |
c |
d |
e |
f |
g |
h |
||||||
|
Number of obligors at the end of previous year |
Observed average default rate (%) |
Exposures weighted average PD (%) |
Average PD (%) |
Average |
||||||||
|
Exposure class/ |
Total |
Of which number of obligors which defaulted in the year |
||||||||||
|
Central governments |
||||||||||||
|
0.00 to <0.15 |
2 |
0 |
0.00% |
0.00% |
0.04% |
0.00% |
||||||
|
0.00 to <0.10 |
2 |
0 |
0.00% |
0.00% |
0.04% |
0.00% |
||||||
|
0.10 to <0.15 |
0 |
0 |
0.00% |
0.00% |
0.00% |
0.00% |
||||||
|
0.15 to <0.25 |
1 |
0 |
0.00% |
0.00% |
0.18% |
0.00% |
||||||
|
0.25 to <0.50 |
0 |
0 |
0.00% |
0.00% |
0.00% |
0.00% |
||||||
|
0.50 to <0.75 |
0 |
0 |
0.00% |
0.00% |
0.00% |
0.00% |
||||||
|
0.75 to <2.50 |
0 |
0 |
0.00% |
0.00% |
0.00% |
0.00% |
||||||
|
0.75 to <1.75 |
0 |
0 |
0.00% |
0.00% |
0.00% |
0.00% |
||||||
|
1.75 to <2.5 |
0 |
0 |
0.00% |
0.00% |
0.00% |
0.00% |
||||||
|
2.50 to <10.00 |
0 |
0 |
0.00% |
0.00% |
0.00% |
0.00% |
||||||
|
2.5 to <5 |
0 |
0 |
0.00% |
0.00% |
0.00% |
0.00% |
||||||
|
5 to <10 |
0 |
0 |
0.00% |
0.00% |
0.00% |
0.00% |
||||||
|
10.00 to <100.00 |
0 |
0 |
0.00% |
0.00% |
0.00% |
0.00% |
||||||
|
10 to <20 |
0 |
0 |
0.00% |
0.00% |
0.00% |
0.00% |
||||||
|
20 to <30 |
0 |
0 |
0.00% |
0.00% |
0.00% |
0.00% |
||||||
|
30.00 to <100.00 |
0 |
0 |
0.00% |
0.00% |
0.00% |
0.00% |
||||||
|
100.00 (Default) |
0 |
0 |
N/M |
0.00% |
100.00% |
N/M |
||||||
|
Sub-total |
3 |
0 |
0.00% |
0.00% |
0.09% |
0.00% |
||||||
|
Institutions |
||||||||||||
|
0.00 to <0.15 |
23 |
0 |
0.00% |
0.05% |
0.07% |
0.00% |
||||||
|
0.00 to <0.10 |
19 |
0 |
0.00% |
0.05% |
0.05% |
0.00% |
||||||
|
0.10 to <0.15 |
4 |
0 |
0.00% |
0.11% |
0.13% |
0.00% |
||||||
|
0.15 to <0.25 |
6 |
0 |
0.00% |
0.19% |
0.16% |
0.00% |
||||||
|
0.25 to <0.50 |
2 |
0 |
0.00% |
0.00% |
0.32% |
0.00% |
||||||
|
0.50 to <0.75 |
4 |
0 |
0.00% |
0.54% |
0.68% |
0.00% |
||||||
|
0.75 to <2.50 |
0 |
0 |
0.00% |
0.97% |
0.00% |
0.00% |
||||||
|
0.75 to <1.75 |
0 |
0 |
0.00% |
0.97% |
0.00% |
0.00% |
||||||
|
1.75 to <2.5 |
0 |
0 |
0.00% |
0.00% |
0.00% |
0.00% |
||||||
|
2.50 to <10.00 |
0 |
0 |
0.00% |
0.00% |
0.00% |
0.00% |
||||||
|
2.5 to <5 |
0 |
0 |
0.00% |
0.00% |
0.00% |
0.00% |
||||||
|
5 to <10 |
0 |
0 |
0.00% |
0.00% |
0.00% |
0.00% |
||||||
|
10.00 to <100.00 |
0 |
0 |
0.00% |
0.00% |
0.00% |
0.00% |
||||||
|
10 to <20 |
0 |
0 |
0.00% |
0.00% |
0.00% |
0.00% |
||||||
|
20 to <30 |
0 |
0 |
0.00% |
0.00% |
0.00% |
0.00% |
||||||
|
30.00 to <100.00 |
0 |
0 |
0.00% |
0.00% |
0.00% |
0.00% |
||||||
|
100.00 (Default) |
0 |
0 |
N/M |
0.00% |
100.00% |
N/M |
||||||
|
Sub-total |
35 |
0 |
0.00% |
0.19% |
0.17% |
0.00% |
||||||
|
Corporates |
||||||||||||
|
0.00 to <0.15 |
1,666 |
2 |
0.12% |
0.11% |
0.06% |
0.09% |
||||||
|
0.00 to <0.10 |
1,380 |
2 |
0.14% |
0.07% |
0.05% |
0.07% |
||||||
|
0.10 to <0.15 |
286 |
0 |
0.00% |
0.12% |
0.12% |
0.12% |
||||||
|
0.15 to <0.25 |
1,644 |
0 |
0.00% |
0.19% |
0.17% |
0.10% |
||||||
|
0.25 to <0.50 |
1,741 |
4 |
0.23% |
0.33% |
0.36% |
0.23% |
||||||
|
0.50 to <0.75 |
1,065 |
2 |
0.19% |
0.57% |
0.63% |
0.31% |
||||||
|
0.75 to <2.50 |
1,418 |
20 |
1.41% |
1.38% |
1.54% |
1.18% |
||||||
|
0.75 to <1.75 |
839 |
12 |
1.43% |
1.05% |
1.16% |
1.22% |
||||||
|
1.75 to <2.5 |
579 |
8 |
1.38% |
2.33% |
2.09% |
1.04% |
||||||
|
2.50 to <10.00 |
418 |
9 |
2.15% |
4.38% |
3.96% |
2.57% |
||||||
|
2.5 to <5 |
390 |
8 |
2.05% |
3.79% |
3.77% |
2.71% |
||||||
|
5 to <10 |
28 |
1 |
3.57% |
6.37% |
6.54% |
2.01% |
||||||
|
10.00 to <100.00 |
48 |
3 |
6.25% |
28.76% |
23.10% |
10.81% |
||||||
|
10 to <20 |
13 |
0 |
0.00% |
13.79% |
14.13% |
5.01% |
||||||
|
20 to <30 |
24 |
2 |
8.33% |
28.11% |
20.01% |
10.77% |
||||||
|
30.00 to <100.00 |
11 |
1 |
9.09% |
38.53% |
40.47% |
5.40% |
||||||
|
100.00 (Default) |
49 |
0 |
N/M |
100.00% |
100.00% |
N/M |
||||||
|
Sub-total |
8,049 |
40 |
0.50% |
1.75% |
1.43% |
1.58% |
||||||
|
of which: |
||||||||||||
|
SMEs |
||||||||||||
122
|
Deutsche Bank |
||
|
Pillar 3 Report as of December 31, 2024 |
||
|
|
Dec 31, 2024 |
|||||||||||
|
a/b |
c |
d |
e |
f |
g |
h |
||||||
|
Number of obligors at the end of previous year |
Observed average default rate (%) |
Exposures weighted average PD (%) |
Average PD (%) |
Average |
||||||||
|
Exposure class/ |
Total |
Of which number of obligors which defaulted in the year |
||||||||||
|
0.00 to <0.15 |
83 |
0 |
0.00% |
0.09% |
0.06% |
0.00% |
||||||
|
0.00 to <0.10 |
69 |
0 |
0.00% |
0.05% |
0.05% |
0.00% |
||||||
|
0.10 to <0.15 |
14 |
0 |
0.00% |
0.13% |
0.11% |
0.00% |
||||||
|
0.15 to <0.25 |
67 |
0 |
0.00% |
0.22% |
0.16% |
0.00% |
||||||
|
0.25 to <0.50 |
133 |
1 |
0.75% |
0.40% |
0.36% |
0.54% |
||||||
|
0.50 to <0.75 |
55 |
0 |
0.00% |
0.59% |
0.69% |
1.20% |
||||||
|
0.75 to <2.50 |
120 |
2 |
1.67% |
1.94% |
1.70% |
1.72% |
||||||
|
0.75 to <1.75 |
55 |
1 |
1.82% |
1.22% |
1.21% |
2.55% |
||||||
|
1.75 to <2.5 |
65 |
1 |
1.54% |
2.36% |
2.11% |
0.31% |
||||||
|
2.50 to <10.00 |
53 |
3 |
5.66% |
4.17% |
4.05% |
5.92% |
||||||
|
2.5 to <5 |
47 |
2 |
4.26% |
3.71% |
3.70% |
5.76% |
||||||
|
5 to <10 |
6 |
1 |
16.67% |
5.84% |
6.79% |
6.67% |
||||||
|
10.00 to <100.00 |
8 |
0 |
0.00% |
28.23% |
24.12% |
3.20% |
||||||
|
10 to <20 |
5 |
0 |
0.00% |
13.79% |
16.90% |
15.67% |
||||||
|
20 to <30 |
0 |
0 |
0.00% |
28.24% |
0.00% |
1.43% |
||||||
|
30.00 to <100.00 |
3 |
0 |
0.00% |
32.87% |
36.16% |
6.25% |
||||||
|
100.00 (Default) |
7 |
0 |
N/M |
100.00% |
100.00% |
N/M |
||||||
|
Sub-total |
526 |
6 |
1.14% |
13.30% |
2.69% |
1.83% |
||||||
|
Specialized lending |
||||||||||||
|
0.00 to <0.15 |
0 |
0 |
0.00% |
0.00% |
0.00% |
0.00% |
||||||
|
0.00 to <0.10 |
0 |
0 |
0.00% |
0.00% |
0.00% |
0.00% |
||||||
|
0.10 to <0.15 |
0 |
0 |
0.00% |
0.00% |
0.00% |
0.00% |
||||||
|
0.15 to <0.25 |
0 |
0 |
0.00% |
0.00% |
0.00% |
0.00% |
||||||
|
0.25 to <0.50 |
0 |
0 |
0.00% |
0.00% |
0.00% |
0.00% |
||||||
|
0.50 to <0.75 |
0 |
0 |
0.00% |
0.00% |
0.00% |
0.00% |
||||||
|
0.75 to <2.50 |
0 |
0 |
0.00% |
0.00% |
0.00% |
0.00% |
||||||
|
0.75 to <1.75 |
0 |
0 |
0.00% |
0.00% |
0.00% |
0.00% |
||||||
|
1.75 to <2.5 |
0 |
0 |
0.00% |
0.00% |
0.00% |
0.00% |
||||||
|
2.50 to <10.00 |
0 |
0 |
0.00% |
0.00% |
0.00% |
0.00% |
||||||
|
2.5 to <5 |
0 |
0 |
0.00% |
0.00% |
0.00% |
0.00% |
||||||
|
5 to <10 |
0 |
0 |
0.00% |
0.00% |
0.00% |
0.00% |
||||||
|
10.00 to <100.00 |
0 |
0 |
0.00% |
0.00% |
0.00% |
0.00% |
||||||
|
10 to <20 |
0 |
0 |
0.00% |
0.00% |
0.00% |
0.00% |
||||||
|
20 to <30 |
0 |
0 |
0.00% |
0.00% |
0.00% |
0.00% |
||||||
|
30.00 to <100.00 |
0 |
0 |
0.00% |
0.00% |
0.00% |
0.00% |
||||||
|
100.00 (Default) |
0 |
0 |
N/M |
0.00% |
0.00% |
N/M |
||||||
|
Sub-total |
0 |
0 |
0.00% |
0.00% |
0.00% |
0.00% |
||||||
|
Other |
||||||||||||
|
0.00 to <0.15 |
1,583 |
2 |
0.13% |
0.11% |
0.06% |
0.09% |
||||||
|
0.00 to <0.10 |
1,311 |
2 |
0.15% |
0.07% |
0.05% |
0.08% |
||||||
|
0.10 to <0.15 |
272 |
0 |
0.00% |
0.12% |
0.12% |
0.12% |
||||||
|
0.15 to <0.25 |
1,577 |
0 |
0.00% |
0.19% |
0.17% |
0.11% |
||||||
|
0.25 to <0.50 |
1,608 |
3 |
0.19% |
0.33% |
0.36% |
0.21% |
||||||
|
0.50 to <0.75 |
1,010 |
2 |
0.20% |
0.56% |
0.62% |
0.29% |
||||||
|
0.75 to <2.50 |
1,298 |
18 |
1.39% |
1.30% |
1.52% |
1.18% |
||||||
|
0.75 to <1.75 |
784 |
11 |
1.40% |
1.04% |
1.16% |
1.17% |
||||||
|
1.75 to <2.5 |
514 |
7 |
1.36% |
2.32% |
2.08% |
1.33% |
||||||
|
2.50 to <10.00 |
365 |
6 |
1.64% |
4.45% |
3.95% |
2.15% |
||||||
|
2.5 to <5 |
343 |
6 |
1.75% |
3.81% |
3.79% |
2.46% |
||||||
|
5 to <10 |
22 |
0 |
0.00% |
6.52% |
6.48% |
0.76% |
||||||
|
10.00 to <100.00 |
40 |
3 |
7.50% |
30.10% |
22.90% |
10.95% |
||||||
|
10 to <20 |
8 |
0 |
0.00% |
0.00% |
12.40% |
2.58% |
||||||
|
20 to <30 |
24 |
2 |
8.33% |
27.68% |
20.01% |
10.88% |
||||||
|
30.00 to <100.00 |
8 |
1 |
12.50% |
38.61% |
42.08% |
3.13% |
||||||
|
100.00 (Default) |
42 |
0 |
N/M |
100.00% |
100.00% |
N/M |
||||||
|
Sub-total |
7,523 |
34 |
0.45% |
0.93% |
1.34% |
1.57% |
||||||
|
Total |
8,087 |
40 |
0.49% |
1.74% |
1.42% |
1.83% |
||||||
123
|
Deutsche Bank |
||
|
Pillar 3 Report as of December 31, 2024 |
||
|
|
Dec 31, 2023 |
|||||||||||
|
a/b |
c |
d |
e |
f |
g |
h |
||||||
|
Number of obligors at the end of previous year |
Observed average default rate (%) |
Exposures weighted average PD (%) |
Average PD (%) |
Average |
||||||||
|
Exposure class/ |
Total |
Of which number of obligors which defaulted in the year |
||||||||||
|
Central governments |
||||||||||||
|
0.00 to <0.15 |
0 |
0 |
0.00% |
0.05% |
0.00% |
0.00% |
||||||
|
0.00 to <0.10 |
0 |
0 |
0.00% |
0.05% |
0.00% |
0.00% |
||||||
|
0.10 to <0.15 |
0 |
0 |
0.00% |
0.00% |
0.00% |
0.00% |
||||||
|
0.15 to <0.25 |
2 |
0 |
0.00% |
0.00% |
0.23% |
0.00% |
||||||
|
0.25 to <0.50 |
0 |
0 |
0.00% |
0.38% |
0.00% |
0.00% |
||||||
|
0.50 to <0.75 |
0 |
0 |
0.00% |
0.00% |
0.00% |
0.00% |
||||||
|
0.75 to <2.50 |
0 |
0 |
0.00% |
0.00% |
0.00% |
0.00% |
||||||
|
0.75 to <1.75 |
0 |
0 |
0.00% |
0.00% |
0.00% |
0.00% |
||||||
|
1.75 to <2.5 |
0 |
0 |
0.00% |
0.00% |
0.00% |
0.00% |
||||||
|
2.50 to <10.00 |
0 |
0 |
0.00% |
0.00% |
0.00% |
0.00% |
||||||
|
2.5 to <5 |
0 |
0 |
0.00% |
0.00% |
0.00% |
0.00% |
||||||
|
5 to <10 |
0 |
0 |
0.00% |
0.00% |
0.00% |
0.00% |
||||||
|
10.00 to <100.00 |
0 |
0 |
0.00% |
0.00% |
0.00% |
0.00% |
||||||
|
10 to <20 |
0 |
0 |
0.00% |
0.00% |
0.00% |
0.00% |
||||||
|
20 to <30 |
0 |
0 |
0.00% |
0.00% |
0.00% |
0.00% |
||||||
|
30.00 to <100.00 |
0 |
0 |
0.00% |
0.00% |
0.00% |
0.00% |
||||||
|
100.00 (Default) |
0 |
0 |
N/M |
0.00% |
100.00% |
N/M |
||||||
|
Sub-total |
2 |
0 |
0.00% |
0.11% |
0.23% |
0.00% |
||||||
|
Institutions |
||||||||||||
|
0.00 to <0.15 |
15 |
0 |
0.00% |
0.06% |
0.06% |
0.00% |
||||||
|
0.00 to <0.10 |
13 |
0 |
0.00% |
0.05% |
0.05% |
0.00% |
||||||
|
0.10 to <0.15 |
2 |
0 |
0.00% |
0.13% |
0.11% |
0.00% |
||||||
|
0.15 to <0.25 |
4 |
0 |
0.00% |
0.19% |
0.15% |
0.00% |
||||||
|
0.25 to <0.50 |
2 |
0 |
0.00% |
0.28% |
0.38% |
0.00% |
||||||
|
0.50 to <0.75 |
2 |
0 |
0.00% |
0.66% |
0.63% |
0.00% |
||||||
|
0.75 to <2.50 |
0 |
0 |
0.00% |
0.00% |
0.00% |
0.00% |
||||||
|
0.75 to <1.75 |
0 |
0 |
0.00% |
0.00% |
0.00% |
0.00% |
||||||
|
1.75 to <2.5 |
0 |
0 |
0.00% |
0.00% |
0.00% |
0.00% |
||||||
|
2.50 to <10.00 |
0 |
0 |
0.00% |
0.00% |
0.00% |
0.00% |
||||||
|
2.5 to <5 |
0 |
0 |
0.00% |
0.00% |
0.00% |
0.00% |
||||||
|
5 to <10 |
0 |
0 |
0.00% |
0.00% |
0.00% |
0.00% |
||||||
|
10.00 to <100.00 |
14 |
0 |
0.00% |
0.00% |
20.00% |
0.00% |
||||||
|
10 to <20 |
0 |
0 |
0.00% |
0.00% |
0.00% |
0.00% |
||||||
|
20 to <30 |
14 |
0 |
0.00% |
0.00% |
20.00% |
0.00% |
||||||
|
30.00 to <100.00 |
0 |
0 |
0.00% |
0.00% |
0.00% |
0.00% |
||||||
|
100.00 (Default) |
0 |
0 |
N/M |
0.00% |
100.00% |
N/M |
||||||
|
Sub-total |
37 |
0 |
0.00% |
0.18% |
7.66% |
0.00% |
||||||
|
Corporates |
||||||||||||
|
0.00 to <0.15 |
815 |
1 |
0.12% |
0.09% |
0.08% |
0.12% |
||||||
|
0.00 to <0.10 |
557 |
1 |
0.18% |
0.07% |
0.07% |
0.10% |
||||||
|
0.10 to <0.15 |
258 |
0 |
0.00% |
0.12% |
0.11% |
0.12% |
||||||
|
0.15 to <0.25 |
1,909 |
1 |
0.05% |
0.19% |
0.21% |
0.18% |
||||||
|
0.25 to <0.50 |
2,417 |
5 |
0.21% |
0.32% |
0.37% |
0.24% |
||||||
|
0.50 to <0.75 |
1,490 |
8 |
0.54% |
0.55% |
0.67% |
0.32% |
||||||
|
0.75 to <2.50 |
877 |
14 |
1.60% |
1.33% |
1.32% |
1.20% |
||||||
|
0.75 to <1.75 |
738 |
12 |
1.63% |
1.05% |
1.18% |
1.04% |
||||||
|
1.75 to <2.5 |
139 |
2 |
1.44% |
2.12% |
2.07% |
1.91% |
||||||
|
2.50 to <10.00 |
144 |
8 |
5.56% |
5.14% |
4.49% |
2.92% |
||||||
|
2.5 to <5 |
106 |
8 |
7.55% |
3.82% |
3.51% |
3.55% |
||||||
|
5 to <10 |
38 |
0 |
0.00% |
6.30% |
7.21% |
1.30% |
||||||
|
10.00 to <100.00 |
1,869 |
823 |
44.03% |
21.38% |
20.14% |
9.79% |
||||||
|
10 to <20 |
12 |
0 |
0.00% |
12.87% |
13.16% |
5.01% |
||||||
|
20 to <30 |
1,848 |
823 |
44.53% |
20.01% |
20.07% |
9.39% |
||||||
|
30.00 to <100.00 |
9 |
0 |
0.00% |
40.61% |
44.51% |
3.13% |
||||||
|
100.00 (Default) |
4,818 |
0 |
N/M |
100.00% |
100.00% |
N/M |
||||||
|
Sub-total |
14,339 |
860 |
6.00% |
0.72% |
36.52% |
1.56% |
||||||
|
of which: |
||||||||||||
|
SMEs |
||||||||||||
124
|
Deutsche Bank |
||
|
Pillar 3 Report as of December 31, 2024 |
||
|
|
Dec 31, 2023 |
|||||||||||
|
a/b |
c |
d |
e |
f |
g |
h |
||||||
|
Number of obligors at the end of previous year |
Observed average default rate (%) |
Exposures weighted average PD (%) |
Average PD (%) |
Average |
||||||||
|
Exposure class/ |
Total |
Of which number of obligors which defaulted in the year |
||||||||||
|
0.00 to <0.15 |
51 |
0 |
0.00% |
0.07% |
0.08% |
0.00% |
||||||
|
0.00 to <0.10 |
28 |
0 |
0.00% |
0.04% |
0.06% |
0.00% |
||||||
|
0.10 to <0.15 |
23 |
0 |
0.00% |
0.10% |
0.11% |
0.00% |
||||||
|
0.15 to <0.25 |
83 |
0 |
0.00% |
0.16% |
0.19% |
0.00% |
||||||
|
0.25 to <0.50 |
139 |
0 |
0.00% |
0.38% |
0.37% |
0.39% |
||||||
|
0.50 to <0.75 |
109 |
0 |
0.00% |
0.65% |
0.70% |
1.20% |
||||||
|
0.75 to <2.50 |
80 |
1 |
1.25% |
1.30% |
1.50% |
2.22% |
||||||
|
0.75 to <1.75 |
51 |
1 |
1.96% |
1.01% |
1.20% |
2.18% |
||||||
|
1.75 to <2.5 |
29 |
0 |
0.00% |
2.22% |
2.03% |
2.50% |
||||||
|
2.50 to <10.00 |
38 |
1 |
2.63% |
4.35% |
4.48% |
9.79% |
||||||
|
2.5 to <5 |
27 |
1 |
3.70% |
3.84% |
3.40% |
14.91% |
||||||
|
5 to <10 |
11 |
0 |
0.00% |
6.83% |
7.12% |
3.33% |
||||||
|
10.00 to <100.00 |
47 |
1 |
2.13% |
18.01% |
20.95% |
3.20% |
||||||
|
10 to <20 |
4 |
0 |
0.00% |
17.31% |
13.92% |
15.67% |
||||||
|
20 to <30 |
40 |
1 |
2.50% |
0.00% |
20.54% |
1.14% |
||||||
|
30.00 to <100.00 |
3 |
0 |
0.00% |
36.16% |
35.81% |
8.33% |
||||||
|
100.00 (Default) |
11 |
0 |
N/M |
100.00% |
100.00% |
N/M |
||||||
|
Sub-total |
558 |
3 |
0.54% |
1.79% |
4.52% |
1.85% |
||||||
|
Specialized lending |
||||||||||||
|
0.00 to <0.15 |
0 |
0 |
0.00% |
0.00% |
0.00% |
0.00% |
||||||
|
0.00 to <0.10 |
0 |
0 |
0.00% |
0.00% |
0.00% |
0.00% |
||||||
|
0.10 to <0.15 |
0 |
0 |
0.00% |
0.00% |
0.00% |
0.00% |
||||||
|
0.15 to <0.25 |
0 |
0 |
0.00% |
0.00% |
0.00% |
0.00% |
||||||
|
0.25 to <0.50 |
0 |
0 |
0.00% |
0.00% |
0.00% |
0.00% |
||||||
|
0.50 to <0.75 |
0 |
0 |
0.00% |
0.00% |
0.00% |
0.00% |
||||||
|
0.75 to <2.50 |
0 |
0 |
0.00% |
0.00% |
0.00% |
0.00% |
||||||
|
0.75 to <1.75 |
0 |
0 |
0.00% |
0.00% |
0.00% |
0.00% |
||||||
|
1.75 to <2.5 |
0 |
0 |
0.00% |
0.00% |
0.00% |
0.00% |
||||||
|
2.50 to <10.00 |
0 |
0 |
0.00% |
0.00% |
0.00% |
0.00% |
||||||
|
2.5 to <5 |
0 |
0 |
0.00% |
0.00% |
0.00% |
0.00% |
||||||
|
5 to <10 |
0 |
0 |
0.00% |
0.00% |
0.00% |
0.00% |
||||||
|
10.00 to <100.00 |
0 |
0 |
0.00% |
0.00% |
0.00% |
0.00% |
||||||
|
10 to <20 |
0 |
0 |
0.00% |
0.00% |
0.00% |
0.00% |
||||||
|
20 to <30 |
0 |
0 |
0.00% |
0.00% |
0.00% |
0.00% |
||||||
|
30.00 to <100.00 |
0 |
0 |
0.00% |
0.00% |
0.00% |
0.00% |
||||||
|
100.00 (Default) |
0 |
0 |
N/M |
0.00% |
0.00% |
N/M |
||||||
|
Sub-total |
0 |
0 |
0.00% |
0.00% |
0.00% |
0.00% |
||||||
|
Other |
||||||||||||
|
0.00 to <0.15 |
765 |
1 |
0.13% |
0.09% |
0.09% |
0.12% |
||||||
|
0.00 to <0.10 |
530 |
1 |
0.19% |
0.07% |
0.07% |
0.11% |
||||||
|
0.10 to <0.15 |
235 |
0 |
0.00% |
0.12% |
0.11% |
0.12% |
||||||
|
0.15 to <0.25 |
1,826 |
1 |
0.05% |
0.19% |
0.21% |
0.18% |
||||||
|
0.25 to <0.50 |
2,278 |
5 |
0.22% |
0.32% |
0.37% |
0.23% |
||||||
|
0.50 to <0.75 |
1,381 |
8 |
0.58% |
0.55% |
0.67% |
0.30% |
||||||
|
0.75 to <2.50 |
797 |
13 |
1.63% |
1.34% |
1.30% |
1.18% |
||||||
|
0.75 to <1.75 |
687 |
11 |
1.60% |
1.05% |
1.18% |
1.00% |
||||||
|
1.75 to <2.5 |
110 |
2 |
1.82% |
2.11% |
2.09% |
2.10% |
||||||
|
2.50 to <10.00 |
106 |
7 |
6.60% |
5.19% |
4.49% |
2.43% |
||||||
|
2.5 to <5 |
79 |
7 |
8.86% |
3.82% |
3.55% |
3.08% |
||||||
|
5 to <10 |
27 |
0 |
0.00% |
6.29% |
7.24% |
0.76% |
||||||
|
10.00 to <100.00 |
1,822 |
822 |
45.12% |
21.74% |
20.12% |
9.70% |
||||||
|
10 to <20 |
8 |
0 |
0.00% |
11.52% |
12.77% |
2.58% |
||||||
|
20 to <30 |
1,808 |
822 |
45.46% |
20.01% |
20.06% |
9.53% |
||||||
|
30.00 to <100.00 |
6 |
0 |
0.00% |
40.68% |
48.86% |
0.00% |
||||||
|
100.00 (Default) |
4,807 |
0 |
N/M |
100.00% |
100.00% |
N/M |
||||||
|
Sub-total |
13,782 |
857 |
6.22% |
0.70% |
37.81% |
1.55% |
||||||
|
Total |
14,378 |
860 |
5.98% |
0.71% |
36.44% |
1.81% |
||||||
125
|
Deutsche Bank |
||
|
Pillar 3 Report as of December 31, 2024 |
||
Advanced IRBA – Model validation results
The validation reviews conducted in 2024 for advanced IRBA credit models led to the assessments shown below. The model definition is aligned with DB’s IRBA model map as reported to ECB on a quarterly basis. The assessment categories follow the ECB validation reporting requirements where following definitions apply:
|
– |
Adequate with no deficiencies: |
No deficiencies detected by the validation function, i.e. no follow-up needed. |
|
– |
Adequate with minor deficiencies: |
Minor deficiencies detected that do not lead to any significant bias of risk estimates. |
|
– |
Major deficiencies identified: |
Identified deficiencies indicate a significant bias of risk parameter estimates, such |
|
– |
Severe deficiencies identified: |
Identified deficiencies indicate a severe bias of risk parameter estimates, such as a |
Validation results for risk parameters used in advanced IRBA credit models
|
|
2024 |
|||||||||||
|
PD |
LGD |
EAD |
||||||||||
|
Count |
EAD in % |
Count |
EAD in % |
Count |
EAD in % |
|||||||
|
Adequate with no deficiencies |
2 |
2.2 |
2 |
4.7 |
1 |
96.5 |
||||||
|
Adequate with minor deficiencies |
22 |
86.5 |
13 |
95.3 |
4 |
3.5 |
||||||
|
Major deficiencies identified |
5 |
11.1 |
0 |
0.0 |
0 |
0.0 |
||||||
|
Severe deficiencies |
1 |
0.1 |
0 |
0.0 |
0 |
0.0 |
||||||
|
Total |
30 |
100.0 |
15 |
100.0 |
5 |
100.0 |
||||||
|
|
2023 |
|||||||||||
|
PD |
LGD |
EAD |
||||||||||
|
Count |
EAD in % |
Count |
EAD in % |
Count |
EAD in % |
|||||||
|
Adequate with no deficiencies |
11 |
10.9 |
12 |
44.6 |
0 |
0.0 |
||||||
|
Adequate with minor deficiencies |
10 |
37.2 |
18 |
55.2 |
5 |
100.0 |
||||||
|
Major deficiencies identified |
12 |
50.7 |
1 |
0.2 |
0 |
0.0 |
||||||
|
Severe deficiencies |
2 |
1.2 |
0 |
0.0 |
0 |
0.0 |
||||||
|
Total |
35 |
100.0 |
31 |
100.0 |
5 |
100.0 |
||||||
For models not validated as ‘adequate with no deficiencies’ the identified weaknesses were raised as validation findings. The breakdown for PD, LGD and EAD is showing the number of respective models as well as their relative EAD as of December 31, 2024 and December 31, 2023, respectively.
The validations during 2024 detected some major or severe deficiencies which were already materially mitigated by end of 2024. The validation resulting in assessment with severe deficiencies affect legacy PD model PBC Poland with low materiality. The successor model addresses the shortcomings; go-live was December 2024.
The drop in count of models from 2023 to 2024 is due to change in model granularity. Especially for LGD models, introduction of EBA guideline compliant models led to combination of several of the previous models.
The below table EU CR9 aims at providing backtesting information for probabilities of default (PD). It compares the PD used in the advanced IRB capital calculations with the effective obligors’ default rates presented on a five-year average by regulatory exposure classes. It has to be noted that the below table reflects credit risk as well as counterparty credit risk information simultaneously for the average historical annual default rate. The other metrics in the table contain credit risk information only since 2024, to align the table to the implementing technical standards. Moreover, some limitations have to be considered when comparing the below backtesting results with the above presented PD model validation results: Whilst in line with the bank’s internal procedures, model validation is conducted on the level of the rating model and the model validation results provided above reflect this practice, for the below presentation by regulatory exposure classes the underlying ratings models have been assigned subsequently to the relevant regulatory exposure class. This different way of aggregation applied for the below backtesting information may result in some bias for the below backtesting results in contrast to the above model validation results.
126
|
Deutsche Bank |
||
|
Pillar 3 Report as of December 31, 2024 |
||
EU CR9 IRB backtesting of PD per exposure class for Advanced IRBA
|
|
Dec 31, 2024 |
|||||||||||
|
a/b |
c |
d |
e |
f |
g |
h |
||||||
|
Number of obligors at the end of previous year |
Observed average default rate (%) |
Exposures weighted average PD (%) |
Average PD (%) |
Average |
||||||||
|
Exposure class/ |
Total |
Of which number of obligors which defaulted in the year |
||||||||||
|
Central governments |
||||||||||||
|
0.00 to <0.15 |
79 |
0 |
0.00% |
0.00% |
0.05% |
0.00% |
||||||
|
0.00 to <0.10 |
66 |
0 |
0.00% |
0.00% |
0.03% |
0.00% |
||||||
|
0.10 to <0.15 |
13 |
0 |
0.00% |
0.14% |
0.13% |
0.00% |
||||||
|
0.15 to <0.25 |
8 |
0 |
0.00% |
0.23% |
0.21% |
0.00% |
||||||
|
0.25 to <0.50 |
17 |
0 |
0.00% |
0.39% |
0.34% |
0.00% |
||||||
|
0.50 to <0.75 |
16 |
0 |
0.00% |
0.64% |
0.59% |
0.00% |
||||||
|
0.75 to <2.50 |
25 |
0 |
0.00% |
1.68% |
1.28% |
0.00% |
||||||
|
0.75 to <1.75 |
16 |
0 |
0.00% |
1.07% |
1.01% |
0.00% |
||||||
|
1.75 to <2.5 |
9 |
0 |
0.00% |
1.76% |
1.76% |
0.00% |
||||||
|
2.50 to <10.00 |
31 |
0 |
0.00% |
6.06% |
5.60% |
7.75% |
||||||
|
2.5 to <5 |
19 |
0 |
0.00% |
4.82% |
4.20% |
6.56% |
||||||
|
5 to <10 |
12 |
0 |
0.00% |
7.95% |
7.82% |
9.76% |
||||||
|
10.00 to <100.00 |
10 |
0 |
0.00% |
18.06% |
28.24% |
3.33% |
||||||
|
10 to <20 |
5 |
0 |
0.00% |
13.01% |
12.11% |
4.00% |
||||||
|
20 to <30 |
1 |
0 |
0.00% |
0.00% |
22.01% |
0.00% |
||||||
|
30.00 to <100.00 |
4 |
0 |
0.00% |
31.01% |
49.97% |
0.00% |
||||||
|
100.00 (Default) |
7 |
0 |
N/M |
100.00% |
100.00% |
N/M |
||||||
|
Sub-total |
193 |
0 |
0.00% |
0.31% |
6.26% |
1.04% |
||||||
|
Institutions |
||||||||||||
|
0.00 to <0.15 |
373 |
0 |
0.00% |
0.07% |
0.07% |
0.08% |
||||||
|
0.00 to <0.10 |
292 |
0 |
0.00% |
0.06% |
0.06% |
0.05% |
||||||
|
0.10 to <0.15 |
81 |
0 |
0.00% |
0.12% |
0.13% |
0.22% |
||||||
|
0.15 to <0.25 |
75 |
0 |
0.00% |
0.17% |
0.21% |
0.34% |
||||||
|
0.25 to <0.50 |
84 |
0 |
0.00% |
0.36% |
0.38% |
0.13% |
||||||
|
0.50 to <0.75 |
44 |
0 |
0.00% |
0.68% |
0.61% |
0.00% |
||||||
|
0.75 to <2.50 |
54 |
0 |
0.00% |
1.24% |
1.39% |
0.54% |
||||||
|
0.75 to <1.75 |
30 |
0 |
0.00% |
1.10% |
1.03% |
0.00% |
||||||
|
1.75 to <2.5 |
24 |
0 |
0.00% |
2.09% |
1.84% |
1.34% |
||||||
|
2.50 to <10.00 |
35 |
0 |
0.00% |
3.57% |
3.85% |
0.50% |
||||||
|
2.5 to <5 |
31 |
0 |
0.00% |
3.37% |
3.42% |
0.74% |
||||||
|
5 to <10 |
4 |
0 |
0.00% |
6.68% |
7.20% |
0.00% |
||||||
|
10.00 to <100.00 |
9 |
0 |
0.00% |
15.41% |
25.68% |
1.05% |
||||||
|
10 to <20 |
7 |
0 |
0.00% |
15.41% |
12.97% |
1.25% |
||||||
|
20 to <30 |
0 |
0 |
0.00% |
29.88% |
0.00% |
0.00% |
||||||
|
30.00 to <100.00 |
2 |
0 |
0.00% |
100.00% |
70.16% |
0.00% |
||||||
|
100.00 (Default) |
4 |
0 |
N/M |
100.00% |
100.00% |
N/M |
||||||
|
Sub-total |
678 |
0 |
0.00% |
0.19% |
1.39% |
0.19% |
||||||
|
Corporates |
||||||||||||
|
0.00 to <0.15 |
10,913 |
28 |
0.26% |
0.08% |
0.07% |
0.13% |
||||||
|
0.00 to <0.10 |
7,301 |
24 |
0.33% |
0.06% |
0.05% |
0.13% |
||||||
|
0.10 to <0.15 |
3,612 |
4 |
0.11% |
0.12% |
0.12% |
0.14% |
||||||
|
0.15 to <0.25 |
6,290 |
22 |
0.35% |
0.19% |
0.18% |
0.20% |
||||||
|
0.25 to <0.50 |
9,750 |
42 |
0.43% |
0.35% |
0.35% |
0.30% |
||||||
|
0.50 to <0.75 |
5,268 |
46 |
0.87% |
0.59% |
0.62% |
0.60% |
||||||
|
0.75 to <2.50 |
8,619 |
181 |
2.10% |
1.43% |
1.40% |
1.39% |
||||||
|
0.75 to <1.75 |
6,021 |
88 |
1.46% |
1.16% |
1.12% |
0.93% |
||||||
|
1.75 to <2.5 |
2,598 |
93 |
3.58% |
2.13% |
2.04% |
2.08% |
||||||
|
2.50 to <10.00 |
3,013 |
176 |
5.84% |
4.44% |
4.74% |
3.61% |
||||||
|
2.5 to <5 |
2,050 |
91 |
4.44% |
3.41% |
3.65% |
2.99% |
||||||
|
5 to <10 |
963 |
85 |
8.83% |
6.76% |
7.08% |
5.11% |
||||||
|
10.00 to <100.00 |
656 |
62 |
9.45% |
40.19% |
23.78% |
9.20% |
||||||
|
10 to <20 |
315 |
31 |
9.84% |
12.50% |
13.43% |
8.93% |
||||||
|
20 to <30 |
107 |
8 |
7.48% |
24.14% |
24.00% |
8.56% |
||||||
|
30.00 to <100.00 |
234 |
23 |
9.83% |
85.50% |
37.62% |
10.52% |
||||||
|
100.00 (Default) |
2,609 |
0 |
N/M |
99.74% |
100.00% |
N/M |
||||||
|
Sub-total |
47,118 |
557 |
1.18% |
5.49% |
6.61% |
0.76% |
||||||
|
|
||||||||||||
|
of which: |
||||||||||||
127
|
Deutsche Bank |
||
|
Pillar 3 Report as of December 31, 2024 |
||
|
|
Dec 31, 2024 |
|||||||||||
|
a/b |
c |
d |
e |
f |
g |
h |
||||||
|
Number of obligors at the end of previous year |
Observed average default rate (%) |
Exposures weighted average PD (%) |
Average PD (%) |
Average |
||||||||
|
Exposure class/ |
Total |
Of which number of obligors which defaulted in the year |
||||||||||
|
SMEs |
||||||||||||
|
0.00 to <0.15 |
2,904 |
3 |
0.10% |
0.08% |
0.08% |
0.07% |
||||||
|
0.00 to <0.10 |
1,660 |
1 |
0.06% |
0.05% |
0.06% |
0.03% |
||||||
|
0.10 to <0.15 |
1,244 |
2 |
0.16% |
0.12% |
0.11% |
0.15% |
||||||
|
0.15 to <0.25 |
2,290 |
7 |
0.31% |
0.21% |
0.17% |
0.14% |
||||||
|
0.25 to <0.50 |
4,909 |
15 |
0.31% |
0.36% |
0.36% |
0.31% |
||||||
|
0.50 to <0.75 |
2,019 |
7 |
0.35% |
0.63% |
0.70% |
0.40% |
||||||
|
0.75 to <2.50 |
3,276 |
56 |
1.71% |
1.34% |
1.47% |
1.34% |
||||||
|
0.75 to <1.75 |
2,070 |
29 |
1.40% |
1.12% |
1.17% |
1.02% |
||||||
|
1.75 to <2.5 |
1,206 |
27 |
2.24% |
2.02% |
1.99% |
1.98% |
||||||
|
2.50 to <10.00 |
1,511 |
98 |
6.49% |
4.75% |
4.75% |
3.70% |
||||||
|
2.5 to <5 |
1,024 |
54 |
5.27% |
3.43% |
3.63% |
3.04% |
||||||
|
5 to <10 |
487 |
44 |
9.03% |
6.72% |
7.11% |
5.43% |
||||||
|
10.00 to <100.00 |
300 |
42 |
14.00% |
19.76% |
24.22% |
11.10% |
||||||
|
10 to <20 |
130 |
21 |
16.15% |
13.80% |
13.70% |
9.85% |
||||||
|
20 to <30 |
53 |
5 |
9.43% |
23.64% |
23.38% |
9.65% |
||||||
|
30.00 to <100.00 |
117 |
16 |
13.68% |
35.74% |
36.30% |
16.29% |
||||||
|
100.00 (Default) |
427 |
0 |
N/M |
100.00% |
100.00% |
N/M |
||||||
|
Sub-total |
17,636 |
228 |
1.29% |
6.77% |
3.73% |
0.84% |
||||||
|
Specialized lending |
||||||||||||
|
0.00 to <0.15 |
43 |
0 |
0.00% |
0.11% |
0.12% |
0.16% |
||||||
|
0.00 to <0.10 |
4 |
0 |
0.00% |
0.09% |
0.06% |
0.27% |
||||||
|
0.10 to <0.15 |
39 |
0 |
0.00% |
0.12% |
0.12% |
0.00% |
||||||
|
0.15 to <0.25 |
65 |
0 |
0.00% |
0.18% |
0.18% |
0.20% |
||||||
|
0.25 to <0.50 |
232 |
2 |
0.86% |
0.38% |
0.37% |
0.51% |
||||||
|
0.50 to <0.75 |
153 |
1 |
0.65% |
0.71% |
0.69% |
1.14% |
||||||
|
0.75 to <2.50 |
369 |
4 |
1.08% |
1.54% |
1.54% |
1.78% |
||||||
|
0.75 to <1.75 |
231 |
2 |
0.87% |
1.18% |
1.28% |
1.23% |
||||||
|
1.75 to <2.5 |
138 |
2 |
1.45% |
2.12% |
1.97% |
2.26% |
||||||
|
2.50 to <10.00 |
326 |
20 |
6.13% |
4.64% |
4.37% |
3.80% |
||||||
|
2.5 to <5 |
232 |
10 |
4.31% |
3.49% |
3.45% |
3.22% |
||||||
|
5 to <10 |
94 |
10 |
10.64% |
6.81% |
6.64% |
5.11% |
||||||
|
10.00 to <100.00 |
31 |
4 |
12.90% |
26.77% |
24.42% |
9.36% |
||||||
|
10 to <20 |
18 |
0 |
0.00% |
12.96% |
13.42% |
7.60% |
||||||
|
20 to <30 |
4 |
0 |
0.00% |
21.40% |
25.82% |
4.35% |
||||||
|
30.00 to <100.00 |
9 |
4 |
44.44% |
60.10% |
45.80% |
14.60% |
||||||
|
100.00 (Default) |
119 |
0 |
N/M |
99.26% |
100.00% |
N/M |
||||||
|
Sub-total |
1,338 |
31 |
2.32% |
11.07% |
11.11% |
2.36% |
||||||
|
Other |
||||||||||||
|
0.00 to <0.15 |
7,994 |
25 |
0.31% |
0.08% |
0.07% |
0.15% |
||||||
|
0.00 to <0.10 |
5,661 |
23 |
0.41% |
0.06% |
0.05% |
0.16% |
||||||
|
0.10 to <0.15 |
2,333 |
2 |
0.09% |
0.12% |
0.12% |
0.17% |
||||||
|
0.15 to <0.25 |
3,942 |
15 |
0.38% |
0.19% |
0.19% |
0.23% |
||||||
|
0.25 to <0.50 |
4,616 |
25 |
0.54% |
0.35% |
0.34% |
0.35% |
||||||
|
0.50 to <0.75 |
3,100 |
38 |
1.23% |
0.57% |
0.56% |
0.66% |
||||||
|
0.75 to <2.50 |
4,995 |
121 |
2.42% |
1.38% |
1.34% |
1.29% |
||||||
|
0.75 to <1.75 |
3,735 |
57 |
1.53% |
1.15% |
1.08% |
0.85% |
||||||
|
1.75 to <2.5 |
1,260 |
64 |
5.08% |
2.16% |
2.10% |
2.25% |
||||||
|
2.50 to <10.00 |
1,187 |
58 |
4.89% |
4.13% |
4.82% |
3.36% |
||||||
|
2.5 to <5 |
805 |
27 |
3.35% |
3.31% |
3.72% |
2.74% |
||||||
|
5 to <10 |
382 |
31 |
8.12% |
6.67% |
7.14% |
4.88% |
||||||
|
10.00 to <100.00 |
325 |
16 |
4.92% |
44.73% |
23.31% |
7.39% |
||||||
|
10 to <20 |
167 |
10 |
5.99% |
12.29% |
13.22% |
7.61% |
||||||
|
20 to <30 |
50 |
3 |
6.00% |
27.97% |
24.50% |
8.48% |
||||||
|
30.00 to <100.00 |
108 |
3 |
2.78% |
91.43% |
38.36% |
6.23% |
||||||
|
100.00 (Default) |
2,063 |
0 |
N/M |
100.00% |
100.00% |
N/M |
||||||
|
Sub-total |
28,222 |
298 |
1.06% |
4.12% |
8.18% |
0.66% |
||||||
|
|
||||||||||||
128
|
Deutsche Bank |
||
|
Pillar 3 Report as of December 31, 2024 |
||
|
|
Dec 31, 2024 |
|||||||||||
|
a/b |
c |
d |
e |
f |
g |
h |
||||||
|
Number of obligors at the end of previous year |
Observed average default rate (%) |
Exposures weighted average PD (%) |
Average PD (%) |
Average |
||||||||
|
Exposure class/ |
Total |
Of which number of obligors which defaulted in the year |
||||||||||
|
Retail |
||||||||||||
|
0.00 to <0.15 |
2,727,822 |
1,510 |
0.06% |
0.09% |
0.07% |
0.05% |
||||||
|
0.00 to <0.10 |
1,970,231 |
724 |
0.04% |
0.06% |
0.06% |
0.04% |
||||||
|
0.10 to <0.15 |
757,591 |
786 |
0.10% |
0.12% |
0.12% |
0.09% |
||||||
|
0.15 to <0.25 |
769,901 |
1,343 |
0.17% |
0.19% |
0.19% |
0.15% |
||||||
|
0.25 to <0.50 |
826,200 |
3,033 |
0.37% |
0.37% |
0.35% |
0.32% |
||||||
|
0.50 to <0.75 |
377,664 |
1,693 |
0.45% |
0.61% |
0.59% |
0.48% |
||||||
|
0.75 to <2.50 |
1,577,492 |
23,343 |
1.48% |
1.39% |
1.46% |
1.19% |
||||||
|
0.75 to <1.75 |
943,574 |
10,158 |
1.08% |
1.16% |
1.09% |
0.91% |
||||||
|
1.75 to <2.5 |
633,918 |
13,185 |
2.08% |
2.18% |
2.02% |
1.57% |
||||||
|
2.50 to <10.00 |
799,886 |
44,643 |
5.58% |
5.10% |
4.72% |
4.15% |
||||||
|
2.5 to <5 |
537,015 |
19,642 |
3.66% |
3.79% |
3.63% |
3.14% |
||||||
|
5 to <10 |
262,871 |
25,001 |
9.51% |
7.22% |
6.94% |
6.35% |
||||||
|
10.00 to <100.00 |
260,871 |
57,587 |
22.07% |
24.88% |
20.84% |
21.35% |
||||||
|
10 to <20 |
168,141 |
21,074 |
12.53% |
14.13% |
13.53% |
12.64% |
||||||
|
20 to <30 |
21,739 |
5,778 |
26.58% |
24.65% |
25.06% |
21.29% |
||||||
|
30.00 to <100.00 |
70,991 |
30,735 |
43.29% |
40.11% |
36.85% |
43.32% |
||||||
|
100.00 (Default) |
229,116 |
0 |
N/M |
100.00% |
100.00% |
N/M |
||||||
|
Sub-total |
7,568,952 |
133,152 |
1.76% |
3.66% |
4.66% |
1.33% |
||||||
|
of which: |
||||||||||||
|
Secured by real estate |
||||||||||||
|
0.00 to <0.15 |
14,625 |
8 |
0.05% |
0.07% |
0.07% |
0.06% |
||||||
|
0.00 to <0.10 |
10,230 |
3 |
0.03% |
0.05% |
0.06% |
0.05% |
||||||
|
0.10 to <0.15 |
4,395 |
5 |
0.11% |
0.11% |
0.11% |
0.08% |
||||||
|
0.15 to <0.25 |
5,202 |
16 |
0.31% |
0.20% |
0.17% |
0.17% |
||||||
|
0.25 to <0.50 |
9,459 |
29 |
0.31% |
0.35% |
0.36% |
0.22% |
||||||
|
0.50 to <0.75 |
720 |
3 |
0.42% |
0.60% |
0.55% |
0.43% |
||||||
|
0.75 to <2.50 |
7,411 |
77 |
1.04% |
1.31% |
1.26% |
0.75% |
||||||
|
0.75 to <1.75 |
5,761 |
56 |
0.97% |
1.11% |
1.00% |
0.61% |
||||||
|
1.75 to <2.5 |
1,650 |
21 |
1.27% |
2.13% |
2.14% |
1.12% |
||||||
|
2.50 to <10.00 |
2,097 |
116 |
5.53% |
4.31% |
5.20% |
3.40% |
||||||
|
2.5 to <5 |
1,143 |
39 |
3.41% |
3.58% |
3.61% |
2.40% |
||||||
|
5 to <10 |
954 |
77 |
8.07% |
6.47% |
7.12% |
5.59% |
||||||
|
10.00 to <100.00 |
555 |
133 |
23.96% |
21.33% |
24.83% |
20.06% |
||||||
|
10 to <20 |
243 |
37 |
15.23% |
14.46% |
14.90% |
12.43% |
||||||
|
20 to <30 |
130 |
26 |
20.00% |
24.06% |
26.25% |
17.70% |
||||||
|
30.00 to <100.00 |
182 |
70 |
38.46% |
33.06% |
37.06% |
37.73% |
||||||
|
100.00 (Default) |
454 |
0 |
N/M |
100.00% |
100.00% |
N/M |
||||||
|
Sub-total |
40,523 |
382 |
0.94% |
2.98% |
2.10% |
0.69% |
||||||
|
Secured by real estate |
||||||||||||
|
0.00 to <0.15 |
306,931 |
628 |
0.20% |
0.09% |
0.08% |
0.13% |
||||||
|
0.00 to <0.10 |
181,894 |
276 |
0.15% |
0.06% |
0.06% |
0.10% |
||||||
|
0.10 to <0.15 |
125,037 |
352 |
0.28% |
0.12% |
0.12% |
0.20% |
||||||
|
0.15 to <0.25 |
201,984 |
619 |
0.31% |
0.19% |
0.19% |
0.23% |
||||||
|
0.25 to <0.50 |
222,342 |
722 |
0.32% |
0.37% |
0.36% |
0.28% |
||||||
|
0.50 to <0.75 |
95,284 |
465 |
0.49% |
0.61% |
0.62% |
0.39% |
||||||
|
0.75 to <2.50 |
193,152 |
1,462 |
0.76% |
1.36% |
1.40% |
0.66% |
||||||
|
0.75 to <1.75 |
145,108 |
940 |
0.65% |
1.17% |
1.11% |
0.55% |
||||||
|
1.75 to <2.5 |
48,044 |
522 |
1.09% |
2.16% |
2.28% |
0.90% |
||||||
|
2.50 to <10.00 |
61,930 |
1,817 |
2.93% |
5.08% |
5.05% |
2.45% |
||||||
|
2.5 to <5 |
39,603 |
787 |
1.99% |
3.84% |
3.85% |
1.77% |
||||||
|
5 to <10 |
22,327 |
1,030 |
4.61% |
7.35% |
7.17% |
3.84% |
||||||
|
10.00 to <100.00 |
19,446 |
4,382 |
22.53% |
25.86% |
25.30% |
16.60% |
||||||
|
10 to <20 |
9,408 |
1,025 |
10.89% |
14.11% |
14.08% |
8.92% |
||||||
|
20 to <30 |
2,032 |
330 |
16.24% |
23.79% |
24.37% |
16.89% |
||||||
|
30.00 to <100.00 |
8,006 |
3,027 |
37.81% |
41.03% |
38.73% |
35.77% |
||||||
|
100.00 (Default) |
11,849 |
0 |
N/M |
100.00% |
100.00% |
N/M |
||||||
|
Sub-total |
1,112,918 |
10,095 |
0.91% |
2.63% |
2.21% |
0.76% |
||||||
|
|
||||||||||||
129
|
Deutsche Bank |
||
|
Pillar 3 Report as of December 31, 2024 |
||
|
|
Dec 31, 2024 |
|||||||||||
|
a/b |
c |
d |
e |
f |
g |
h |
||||||
|
Number of obligors at the end of previous year |
Observed average default rate (%) |
Exposures weighted average PD (%) |
Average PD (%) |
Average |
||||||||
|
Exposure class/ |
Total |
Of which number of obligors which defaulted in the year |
||||||||||
|
Qualifying revolving |
||||||||||||
|
0.00 to <0.15 |
2,104,925 |
704 |
0.03% |
0.07% |
0.07% |
0.04% |
||||||
|
0.00 to <0.10 |
1,597,880 |
395 |
0.02% |
0.06% |
0.06% |
0.03% |
||||||
|
0.10 to <0.15 |
507,045 |
309 |
0.06% |
0.12% |
0.12% |
0.07% |
||||||
|
0.15 to <0.25 |
405,516 |
490 |
0.12% |
0.19% |
0.19% |
0.11% |
||||||
|
0.25 to <0.50 |
378,313 |
1,463 |
0.39% |
0.35% |
0.34% |
0.33% |
||||||
|
0.50 to <0.75 |
126,087 |
720 |
0.57% |
0.54% |
0.54% |
0.62% |
||||||
|
0.75 to <2.50 |
470,170 |
10,853 |
2.31% |
1.37% |
1.43% |
1.73% |
||||||
|
0.75 to <1.75 |
326,972 |
5,061 |
1.55% |
1.08% |
1.08% |
1.30% |
||||||
|
1.75 to <2.5 |
143,198 |
5,792 |
4.04% |
2.30% |
2.23% |
2.62% |
||||||
|
2.50 to <10.00 |
247,789 |
25,321 |
10.22% |
5.50% |
5.33% |
5.99% |
||||||
|
2.5 to <5 |
120,970 |
7,568 |
6.26% |
3.80% |
3.78% |
4.46% |
||||||
|
5 to <10 |
126,819 |
17,753 |
14.00% |
7.24% |
6.81% |
7.88% |
||||||
|
10.00 to <100.00 |
123,969 |
28,560 |
23.04% |
23.40% |
20.56% |
19.74% |
||||||
|
10 to <20 |
84,561 |
13,420 |
15.87% |
14.38% |
13.58% |
12.84% |
||||||
|
20 to <30 |
5,200 |
1,614 |
31.04% |
27.70% |
26.32% |
20.11% |
||||||
|
30.00 to <100.00 |
34,208 |
13,526 |
39.54% |
37.63% |
36.95% |
38.06% |
||||||
|
100.00 (Default) |
96,632 |
0 |
N/M |
100.00% |
100.00% |
N/M |
||||||
|
Sub-total |
3,953,401 |
68,111 |
1.72% |
2.66% |
3.70% |
0.90% |
||||||
|
Other - SME |
||||||||||||
|
0.00 to <0.15 |
49,721 |
69 |
0.14% |
0.10% |
0.08% |
0.08% |
||||||
|
0.00 to <0.10 |
31,587 |
23 |
0.07% |
0.06% |
0.06% |
0.05% |
||||||
|
0.10 to <0.15 |
18,134 |
46 |
0.25% |
0.11% |
0.12% |
0.11% |
||||||
|
0.15 to <0.25 |
13,121 |
46 |
0.35% |
0.19% |
0.18% |
0.17% |
||||||
|
0.25 to <0.50 |
18,915 |
86 |
0.45% |
0.36% |
0.38% |
0.26% |
||||||
|
0.50 to <0.75 |
5,995 |
46 |
0.77% |
0.58% |
0.60% |
0.49% |
||||||
|
0.75 to <2.50 |
24,589 |
363 |
1.48% |
1.43% |
1.33% |
1.15% |
||||||
|
0.75 to <1.75 |
16,906 |
218 |
1.29% |
1.22% |
1.03% |
0.92% |
||||||
|
1.75 to <2.5 |
7,683 |
145 |
1.89% |
2.02% |
2.00% |
1.57% |
||||||
|
2.50 to <10.00 |
12,567 |
510 |
4.06% |
4.53% |
4.87% |
3.33% |
||||||
|
2.5 to <5 |
9,000 |
274 |
3.04% |
3.15% |
3.81% |
2.65% |
||||||
|
5 to <10 |
3,567 |
236 |
6.62% |
6.10% |
7.56% |
4.90% |
||||||
|
10.00 to <100.00 |
3,836 |
817 |
21.30% |
22.80% |
21.60% |
18.93% |
||||||
|
10 to <20 |
1,868 |
205 |
10.97% |
14.04% |
13.49% |
9.70% |
||||||
|
20 to <30 |
962 |
173 |
17.98% |
25.14% |
24.17% |
16.05% |
||||||
|
30.00 to <100.00 |
1,006 |
439 |
43.64% |
35.89% |
34.18% |
38.21% |
||||||
|
100.00 (Default) |
4,220 |
0 |
N/M |
100.00% |
100.00% |
N/M |
||||||
|
Sub-total |
132,964 |
1,937 |
1.46% |
5.74% |
4.63% |
1.04% |
||||||
|
Other - Non-SME |
||||||||||||
|
0.00 to <0.15 |
654,917 |
383 |
0.06% |
0.08% |
0.08% |
0.05% |
||||||
|
0.00 to <0.10 |
441,592 |
193 |
0.04% |
0.06% |
0.06% |
0.04% |
||||||
|
0.10 to <0.15 |
213,325 |
190 |
0.09% |
0.12% |
0.12% |
0.09% |
||||||
|
0.15 to <0.25 |
250,805 |
367 |
0.15% |
0.19% |
0.19% |
0.17% |
||||||
|
0.25 to <0.50 |
328,331 |
1,231 |
0.37% |
0.39% |
0.36% |
0.34% |
||||||
|
0.50 to <0.75 |
193,619 |
730 |
0.38% |
0.60% |
0.59% |
0.48% |
||||||
|
0.75 to <2.50 |
1,033,582 |
12,763 |
1.23% |
1.51% |
1.48% |
1.12% |
||||||
|
0.75 to <1.75 |
561,112 |
5,192 |
0.93% |
1.13% |
1.09% |
0.85% |
||||||
|
1.75 to <2.5 |
472,470 |
7,571 |
1.60% |
2.24% |
1.95% |
1.40% |
||||||
|
2.50 to <10.00 |
527,509 |
19,430 |
3.68% |
5.15% |
4.43% |
3.71% |
||||||
|
2.5 to <5 |
395,301 |
12,023 |
3.04% |
3.71% |
3.56% |
2.98% |
||||||
|
5 to <10 |
132,208 |
7,407 |
5.60% |
7.03% |
7.03% |
5.65% |
||||||
|
10.00 to <100.00 |
141,919 |
30,278 |
21.33% |
23.14% |
21.04% |
22.97% |
||||||
|
10 to <20 |
87,768 |
7,972 |
9.08% |
14.13% |
13.54% |
13.34% |
||||||
|
20 to <30 |
15,749 |
4,272 |
27.13% |
27.49% |
24.95% |
22.60% |
||||||
|
30.00 to <100.00 |
38,402 |
18,034 |
46.96% |
38.42% |
36.59% |
47.35% |
||||||
|
100.00 (Default) |
134,317 |
0 |
N/M |
100.00% |
100.00% |
N/M |
||||||
|
Sub-total |
3,264,999 |
65,182 |
2.00% |
9.50% |
6.32% |
2.11% |
||||||
|
Total |
7,616,696 |
133,705 |
1.76% |
3.76% |
4.67% |
1.31% |
||||||
130
|
Deutsche Bank |
||
|
Pillar 3 Report as of December 31, 2024 |
||
|
|
Dec 31, 2023 |
|||||||||||
|
a/b |
c |
d |
e |
f |
g |
h |
||||||
|
Number of obligors at the end of previous year |
Observed average default rate (%) |
Exposures weighted average PD (%) |
Average PD (%) |
Average |
||||||||
|
Exposure class/ |
Total |
Of which number of obligors which defaulted in the year |
||||||||||
|
Central governments |
||||||||||||
|
0.00 to <0.15 |
144 |
0 |
0.00% |
0.00% |
0.04% |
0.00% |
||||||
|
0.00 to <0.10 |
131 |
0 |
0.00% |
0.00% |
0.03% |
0.00% |
||||||
|
0.10 to <0.15 |
13 |
0 |
0.00% |
0.13% |
0.13% |
0.00% |
||||||
|
0.15 to <0.25 |
19 |
0 |
0.00% |
0.23% |
0.22% |
0.00% |
||||||
|
0.25 to <0.50 |
19 |
0 |
0.00% |
0.39% |
0.34% |
0.00% |
||||||
|
0.50 to <0.75 |
20 |
0 |
0.00% |
0.64% |
0.60% |
0.00% |
||||||
|
0.75 to <2.50 |
25 |
0 |
0.00% |
1.76% |
1.44% |
0.00% |
||||||
|
0.75 to <1.75 |
12 |
0 |
0.00% |
1.07% |
1.03% |
0.00% |
||||||
|
1.75 to <2.5 |
13 |
0 |
0.00% |
1.76% |
1.82% |
0.00% |
||||||
|
2.50 to <10.00 |
31 |
1 |
3.23% |
4.54% |
5.80% |
7.75% |
||||||
|
2.5 to <5 |
17 |
0 |
0.00% |
3.55% |
4.10% |
6.56% |
||||||
|
5 to <10 |
14 |
1 |
7.14% |
7.95% |
7.87% |
9.76% |
||||||
|
10.00 to <100.00 |
5 |
0 |
0.00% |
16.07% |
14.81% |
3.33% |
||||||
|
10 to <20 |
4 |
0 |
0.00% |
12.87% |
13.01% |
4.00% |
||||||
|
20 to <30 |
1 |
0 |
0.00% |
22.01% |
22.01% |
0.00% |
||||||
|
30.00 to <100.00 |
0 |
0 |
0.00% |
31.01% |
0.00% |
0.00% |
||||||
|
100.00 (Default) |
10 |
0 |
N/M |
100.00% |
100.00% |
N/M |
||||||
|
Sub-total |
273 |
1 |
0.37% |
0.24% |
4.83% |
1.04% |
||||||
|
Institutions |
||||||||||||
|
0.00 to <0.15 |
471 |
1 |
0.21% |
0.05% |
0.07% |
0.08% |
||||||
|
0.00 to <0.10 |
443 |
1 |
0.23% |
0.05% |
0.06% |
0.05% |
||||||
|
0.10 to <0.15 |
28 |
0 |
0.00% |
0.13% |
0.13% |
0.22% |
||||||
|
0.15 to <0.25 |
90 |
0 |
0.00% |
0.20% |
0.17% |
0.34% |
||||||
|
0.25 to <0.50 |
160 |
1 |
0.63% |
0.34% |
0.34% |
0.13% |
||||||
|
0.50 to <0.75 |
60 |
0 |
0.00% |
0.63% |
0.66% |
0.00% |
||||||
|
0.75 to <2.50 |
83 |
0 |
0.00% |
1.43% |
1.55% |
0.54% |
||||||
|
0.75 to <1.75 |
38 |
0 |
0.00% |
1.10% |
1.13% |
0.00% |
||||||
|
1.75 to <2.5 |
45 |
0 |
0.00% |
1.76% |
1.91% |
1.34% |
||||||
|
2.50 to <10.00 |
46 |
0 |
0.00% |
2.96% |
4.43% |
0.50% |
||||||
|
2.5 to <5 |
27 |
0 |
0.00% |
2.94% |
3.25% |
0.74% |
||||||
|
5 to <10 |
19 |
0 |
0.00% |
6.55% |
6.12% |
0.00% |
||||||
|
10.00 to <100.00 |
9 |
0 |
0.00% |
10.99% |
13.87% |
1.05% |
||||||
|
10 to <20 |
9 |
0 |
0.00% |
10.98% |
13.87% |
1.25% |
||||||
|
20 to <30 |
0 |
0 |
0.00% |
0.00% |
0.00% |
0.00% |
||||||
|
30.00 to <100.00 |
0 |
0 |
0.00% |
40.32% |
0.00% |
0.00% |
||||||
|
100.00 (Default) |
9 |
0 |
N/M |
100.00% |
100.00% |
N/M |
||||||
|
Sub-total |
928 |
2 |
0.22% |
0.88% |
1.61% |
0.21% |
||||||
|
Corporates |
||||||||||||
|
0.00 to <0.15 |
20,192 |
30 |
0.15% |
0.07% |
0.06% |
0.07% |
||||||
|
0.00 to <0.10 |
16,939 |
23 |
0.14% |
0.06% |
0.05% |
0.05% |
||||||
|
0.10 to <0.15 |
3,253 |
7 |
0.22% |
0.12% |
0.12% |
0.13% |
||||||
|
0.15 to <0.25 |
5,901 |
14 |
0.24% |
0.19% |
0.18% |
0.15% |
||||||
|
0.25 to <0.50 |
9,827 |
38 |
0.39% |
0.36% |
0.35% |
0.22% |
||||||
|
0.50 to <0.75 |
5,289 |
42 |
0.79% |
0.60% |
0.65% |
0.50% |
||||||
|
0.75 to <2.50 |
8,171 |
110 |
1.35% |
1.45% |
1.43% |
1.15% |
||||||
|
0.75 to <1.75 |
5,082 |
47 |
0.92% |
1.12% |
1.12% |
0.84% |
||||||
|
1.75 to <2.5 |
3,089 |
63 |
2.04% |
1.98% |
1.92% |
1.64% |
||||||
|
2.50 to <10.00 |
3,886 |
167 |
4.30% |
4.65% |
4.59% |
3.12% |
||||||
|
2.5 to <5 |
2,762 |
109 |
3.95% |
3.52% |
3.57% |
2.76% |
||||||
|
5 to <10 |
1,124 |
58 |
5.16% |
6.93% |
7.10% |
4.13% |
||||||
|
10.00 to <100.00 |
631 |
57 |
9.03% |
17.79% |
22.24% |
8.85% |
||||||
|
10 to <20 |
296 |
32 |
10.81% |
13.61% |
13.47% |
8.94% |
||||||
|
20 to <30 |
136 |
10 |
7.35% |
24.11% |
22.61% |
7.83% |
||||||
|
30.00 to <100.00 |
199 |
15 |
7.54% |
40.40% |
35.01% |
10.05% |
||||||
|
100.00 (Default) |
2,966 |
0 |
N/M |
100.00% |
100.00% |
N/M |
||||||
|
Sub-total |
56,863 |
458 |
0.81% |
4.59% |
6.14% |
0.64% |
||||||
|
of which: |
||||||||||||
|
SMEs |
||||||||||||
131
|
Deutsche Bank |
||
|
Pillar 3 Report as of December 31, 2024 |
||
|
|
Dec 31, 2023 |
|||||||||||
|
a/b |
c |
d |
e |
f |
g |
h |
||||||
|
Number of obligors at the end of previous year |
Observed average default rate (%) |
Exposures weighted average PD (%) |
Average PD (%) |
Average |
||||||||
|
Exposure class/ |
Total |
Of which number of obligors which defaulted in the year |
||||||||||
|
0.00 to <0.15 |
5,058 |
6 |
0.12% |
0.07% |
0.08% |
0.05% |
||||||
|
0.00 to <0.10 |
3,286 |
1 |
0.03% |
0.05% |
0.06% |
0.02% |
||||||
|
0.10 to <0.15 |
1,772 |
5 |
0.28% |
0.12% |
0.11% |
0.13% |
||||||
|
0.15 to <0.25 |
2,514 |
5 |
0.20% |
0.20% |
0.17% |
0.09% |
||||||
|
0.25 to <0.50 |
4,254 |
13 |
0.31% |
0.36% |
0.35% |
0.26% |
||||||
|
0.50 to <0.75 |
1,911 |
15 |
0.78% |
0.65% |
0.70% |
0.42% |
||||||
|
0.75 to <2.50 |
2,767 |
49 |
1.77% |
1.37% |
1.47% |
1.22% |
||||||
|
0.75 to <1.75 |
1,630 |
21 |
1.29% |
1.08% |
1.15% |
0.91% |
||||||
|
1.75 to <2.5 |
1,137 |
28 |
2.46% |
2.03% |
1.93% |
1.81% |
||||||
|
2.50 to <10.00 |
1,356 |
54 |
3.98% |
4.85% |
4.62% |
3.27% |
||||||
|
2.5 to <5 |
938 |
29 |
3.09% |
3.67% |
3.56% |
2.80% |
||||||
|
5 to <10 |
418 |
25 |
5.98% |
7.13% |
7.00% |
4.75% |
||||||
|
10.00 to <100.00 |
294 |
28 |
9.52% |
20.40% |
23.16% |
10.03% |
||||||
|
10 to <20 |
121 |
12 |
9.92% |
14.77% |
13.63% |
8.92% |
||||||
|
20 to <30 |
67 |
6 |
8.96% |
23.29% |
22.49% |
8.76% |
||||||
|
30.00 to <100.00 |
106 |
10 |
9.43% |
33.84% |
34.47% |
15.14% |
||||||
|
100.00 (Default) |
1,852 |
0 |
N/M |
100.00% |
100.00% |
N/M |
||||||
|
Sub-total |
20,006 |
170 |
0.85% |
3.75% |
10.30% |
0.71% |
||||||
|
Specialized lending |
||||||||||||
|
0.00 to <0.15 |
91 |
0 |
0.00% |
0.11% |
0.10% |
0.16% |
||||||
|
0.00 to <0.10 |
45 |
0 |
0.00% |
0.06% |
0.07% |
0.27% |
||||||
|
0.10 to <0.15 |
46 |
0 |
0.00% |
0.12% |
0.13% |
0.00% |
||||||
|
0.15 to <0.25 |
100 |
1 |
1.00% |
0.18% |
0.20% |
0.20% |
||||||
|
0.25 to <0.50 |
132 |
1 |
0.76% |
0.37% |
0.39% |
0.34% |
||||||
|
0.50 to <0.75 |
170 |
3 |
1.76% |
0.68% |
0.66% |
1.01% |
||||||
|
0.75 to <2.50 |
306 |
8 |
2.61% |
1.57% |
1.52% |
1.56% |
||||||
|
0.75 to <1.75 |
143 |
2 |
1.40% |
1.22% |
1.11% |
1.06% |
||||||
|
1.75 to <2.5 |
163 |
6 |
3.68% |
1.97% |
1.87% |
1.97% |
||||||
|
2.50 to <10.00 |
426 |
21 |
4.93% |
4.43% |
5.08% |
2.87% |
||||||
|
2.5 to <5 |
272 |
13 |
4.78% |
3.46% |
3.56% |
2.46% |
||||||
|
5 to <10 |
154 |
8 |
5.19% |
6.85% |
7.76% |
3.72% |
||||||
|
10.00 to <100.00 |
37 |
2 |
5.41% |
16.59% |
18.89% |
7.14% |
||||||
|
10 to <20 |
23 |
1 |
4.35% |
13.29% |
12.95% |
7.82% |
||||||
|
20 to <30 |
7 |
0 |
0.00% |
25.87% |
22.01% |
4.64% |
||||||
|
30.00 to <100.00 |
7 |
1 |
14.29% |
49.19% |
35.29% |
7.71% |
||||||
|
100.00 (Default) |
124 |
0 |
N/M |
100.00% |
100.00% |
N/M |
||||||
|
Sub-total |
1,386 |
36 |
2.60% |
10.95% |
11.49% |
2.13% |
||||||
|
Other |
||||||||||||
|
0.00 to <0.15 |
15,075 |
24 |
0.16% |
0.07% |
0.06% |
0.09% |
||||||
|
0.00 to <0.10 |
13,634 |
22 |
0.16% |
0.06% |
0.05% |
0.08% |
||||||
|
0.10 to <0.15 |
1,441 |
2 |
0.14% |
0.12% |
0.13% |
0.16% |
||||||
|
0.15 to <0.25 |
3,293 |
8 |
0.24% |
0.19% |
0.19% |
0.20% |
||||||
|
0.25 to <0.50 |
5,451 |
24 |
0.44% |
0.35% |
0.35% |
0.27% |
||||||
|
0.50 to <0.75 |
3,212 |
24 |
0.75% |
0.58% |
0.62% |
0.51% |
||||||
|
0.75 to <2.50 |
5,112 |
53 |
1.04% |
1.41% |
1.40% |
1.06% |
||||||
|
0.75 to <1.75 |
3,312 |
24 |
0.72% |
1.09% |
1.11% |
0.77% |
||||||
|
1.75 to <2.5 |
1,800 |
29 |
1.61% |
1.97% |
1.92% |
1.53% |
||||||
|
2.50 to <10.00 |
2,113 |
93 |
4.40% |
4.85% |
4.47% |
3.02% |
||||||
|
2.5 to <5 |
1,558 |
68 |
4.36% |
3.56% |
3.57% |
2.70% |
||||||
|
5 to <10 |
555 |
25 |
4.50% |
6.96% |
6.99% |
3.89% |
||||||
|
10.00 to <100.00 |
300 |
27 |
9.00% |
18.36% |
21.74% |
8.34% |
||||||
|
10 to <20 |
152 |
19 |
12.50% |
13.76% |
13.43% |
9.00% |
||||||
|
20 to <30 |
62 |
4 |
6.45% |
23.54% |
22.82% |
8.25% |
||||||
|
30.00 to <100.00 |
86 |
4 |
4.65% |
38.36% |
35.66% |
7.11% |
||||||
|
100.00 (Default) |
990 |
0 |
N/M |
100.00% |
100.00% |
N/M |
||||||
|
Sub-total |
35,546 |
253 |
0.71% |
3.36% |
3.59% |
0.55% |
||||||
|
|
||||||||||||
132
|
Deutsche Bank |
||
|
Pillar 3 Report as of December 31, 2024 |
||
|
|
Dec 31, 2023 |
|||||||||||
|
a/b |
c |
d |
e |
f |
g |
h |
||||||
|
Number of obligors at the end of previous year |
Observed average default rate (%) |
Exposures weighted average PD (%) |
Average PD (%) |
Average |
||||||||
|
Exposure class/ |
Total |
Of which number of obligors which defaulted in the year |
||||||||||
|
Retail |
||||||||||||
|
0.00 to <0.15 |
2,713,145 |
1,066 |
0.04% |
0.08% |
0.07% |
0.04% |
||||||
|
0.00 to <0.10 |
2,092,951 |
544 |
0.03% |
0.06% |
0.05% |
0.03% |
||||||
|
0.10 to <0.15 |
620,194 |
522 |
0.08% |
0.12% |
0.11% |
0.08% |
||||||
|
0.15 to <0.25 |
958,865 |
1,487 |
0.16% |
0.19% |
0.19% |
0.13% |
||||||
|
0.25 to <0.50 |
791,486 |
3,126 |
0.39% |
0.36% |
0.37% |
0.28% |
||||||
|
0.50 to <0.75 |
487,966 |
2,657 |
0.54% |
0.62% |
0.68% |
0.44% |
||||||
|
0.75 to <2.50 |
1,340,151 |
18,225 |
1.36% |
1.42% |
1.45% |
1.04% |
||||||
|
0.75 to <1.75 |
759,902 |
8,545 |
1.12% |
1.12% |
1.10% |
0.80% |
||||||
|
1.75 to <2.5 |
580,249 |
9,680 |
1.67% |
2.47% |
1.91% |
1.34% |
||||||
|
2.50 to <10.00 |
716,175 |
29,119 |
4.07% |
4.89% |
4.65% |
3.59% |
||||||
|
2.5 to <5 |
509,282 |
16,069 |
3.16% |
3.81% |
3.57% |
2.90% |
||||||
|
5 to <10 |
206,893 |
13,050 |
6.31% |
7.08% |
7.32% |
5.26% |
||||||
|
10.00 to <100.00 |
141,144 |
29,993 |
21.25% |
27.18% |
20.97% |
20.13% |
||||||
|
10 to <20 |
74,892 |
7,931 |
10.59% |
13.95% |
13.33% |
12.27% |
||||||
|
20 to <30 |
31,830 |
6,484 |
20.37% |
24.73% |
22.16% |
18.82% |
||||||
|
30.00 to <100.00 |
34,422 |
15,578 |
45.26% |
38.44% |
36.49% |
40.93% |
||||||
|
100.00 (Default) |
181,696 |
0 |
N/M |
100.00% |
100.00% |
N/M |
||||||
|
Sub-total |
7,330,628 |
85,673 |
1.17% |
3.17% |
3.74% |
1.15% |
||||||
|
of which: |
||||||||||||
|
Secured by real estate |
||||||||||||
|
0.00 to <0.15 |
15,827 |
14 |
0.09% |
0.08% |
0.07% |
0.05% |
||||||
|
0.00 to <0.10 |
11,364 |
7 |
0.06% |
0.06% |
0.06% |
0.06% |
||||||
|
0.10 to <0.15 |
4,463 |
7 |
0.16% |
0.11% |
0.11% |
0.06% |
||||||
|
0.15 to <0.25 |
5,208 |
10 |
0.19% |
0.18% |
0.17% |
0.12% |
||||||
|
0.25 to <0.50 |
8,477 |
32 |
0.38% |
0.36% |
0.36% |
0.18% |
||||||
|
0.50 to <0.75 |
671 |
7 |
1.04% |
0.54% |
0.58% |
0.40% |
||||||
|
0.75 to <2.50 |
5,362 |
62 |
1.16% |
1.27% |
1.23% |
0.62% |
||||||
|
0.75 to <1.75 |
4,262 |
38 |
0.89% |
1.01% |
1.00% |
0.49% |
||||||
|
1.75 to <2.5 |
1,100 |
24 |
2.18% |
2.15% |
2.12% |
0.97% |
||||||
|
2.50 to <10.00 |
1,313 |
60 |
4.57% |
5.20% |
5.09% |
2.67% |
||||||
|
2.5 to <5 |
771 |
26 |
3.37% |
3.62% |
3.62% |
2.03% |
||||||
|
5 to <10 |
542 |
34 |
6.27% |
7.14% |
7.17% |
4.69% |
||||||
|
10.00 to <100.00 |
300 |
76 |
25.33% |
24.48% |
21.88% |
18.19% |
||||||
|
10 to <20 |
164 |
35 |
21.34% |
14.71% |
14.66% |
10.46% |
||||||
|
20 to <30 |
71 |
18 |
25.35% |
26.36% |
25.41% |
16.03% |
||||||
|
30.00 to <100.00 |
65 |
23 |
35.38% |
37.20% |
36.25% |
36.94% |
||||||
|
100.00 (Default) |
376 |
0 |
N/M |
100.00% |
100.00% |
N/M |
||||||
|
Sub-total |
37,534 |
261 |
0.70% |
2.17% |
1.68% |
0.62% |
||||||
|
Secured by real estate |
||||||||||||
|
0.00 to <0.15 |
281,381 |
328 |
0.12% |
0.08% |
0.08% |
0.11% |
||||||
|
0.00 to <0.10 |
175,538 |
138 |
0.08% |
0.06% |
0.06% |
0.08% |
||||||
|
0.10 to <0.15 |
105,843 |
190 |
0.18% |
0.12% |
0.11% |
0.17% |
||||||
|
0.15 to <0.25 |
193,759 |
478 |
0.25% |
0.19% |
0.19% |
0.19% |
||||||
|
0.25 to <0.50 |
246,008 |
812 |
0.33% |
0.36% |
0.37% |
0.25% |
||||||
|
0.50 to <0.75 |
182,726 |
1,005 |
0.55% |
0.62% |
0.69% |
0.34% |
||||||
|
0.75 to <2.50 |
196,214 |
1,345 |
0.69% |
1.38% |
1.36% |
0.60% |
||||||
|
0.75 to <1.75 |
148,683 |
890 |
0.60% |
1.13% |
1.13% |
0.50% |
||||||
|
1.75 to <2.5 |
47,531 |
455 |
0.96% |
3.11% |
2.05% |
0.79% |
||||||
|
2.50 to <10.00 |
52,193 |
1,401 |
2.68% |
4.98% |
5.11% |
2.15% |
||||||
|
2.5 to <5 |
32,356 |
573 |
1.77% |
3.92% |
3.75% |
1.65% |
||||||
|
5 to <10 |
19,837 |
828 |
4.17% |
7.12% |
7.34% |
3.25% |
||||||
|
10.00 to <100.00 |
13,974 |
2,116 |
15.14% |
34.75% |
21.24% |
14.49% |
||||||
|
10 to <20 |
7,948 |
628 |
7.90% |
16.68% |
13.46% |
8.58% |
||||||
|
20 to <30 |
2,666 |
451 |
16.92% |
24.29% |
22.66% |
15.95% |
||||||
|
30.00 to <100.00 |
3,360 |
1,037 |
30.86% |
39.08% |
38.49% |
32.20% |
||||||
|
100.00 (Default) |
11,606 |
0 |
N/M |
100.00% |
100.00% |
N/M |
||||||
|
Sub-total |
1,177,861 |
7,485 |
0.64% |
2.01% |
1.93% |
0.68% |
||||||
|
|
||||||||||||
133
|
Deutsche Bank |
||
|
Pillar 3 Report as of December 31, 2024 |
||
|
|
Dec 31, 2023 |
|||||||||||
|
a/b |
c |
d |
e |
f |
g |
h |
||||||
|
Number of obligors at the end of previous year |
Observed average default rate (%) |
Exposures weighted average PD (%) |
Average PD (%) |
Average |
||||||||
|
Exposure class/ |
Total |
Of which number of obligors which defaulted in the year |
||||||||||
|
Qualifying revolving |
||||||||||||
|
0.00 to <0.15 |
2,126,717 |
618 |
0.03% |
0.07% |
0.06% |
0.03% |
||||||
|
0.00 to <0.10 |
1,710,459 |
358 |
0.02% |
0.05% |
0.05% |
0.03% |
||||||
|
0.10 to <0.15 |
416,258 |
260 |
0.06% |
0.12% |
0.11% |
0.07% |
||||||
|
0.15 to <0.25 |
622,435 |
840 |
0.13% |
0.19% |
0.19% |
0.09% |
||||||
|
0.25 to <0.50 |
344,034 |
1,608 |
0.47% |
0.34% |
0.37% |
0.27% |
||||||
|
0.50 to <0.75 |
142,172 |
1,020 |
0.72% |
0.54% |
0.68% |
0.53% |
||||||
|
0.75 to <2.50 |
344,242 |
9,291 |
2.70% |
1.35% |
1.43% |
1.34% |
||||||
|
0.75 to <1.75 |
224,683 |
4,653 |
2.07% |
1.06% |
1.09% |
1.04% |
||||||
|
1.75 to <2.5 |
119,559 |
4,638 |
3.88% |
2.27% |
2.07% |
1.91% |
||||||
|
2.50 to <10.00 |
166,086 |
11,929 |
7.18% |
5.27% |
5.17% |
4.25% |
||||||
|
2.5 to <5 |
95,472 |
5,788 |
6.06% |
3.82% |
3.66% |
3.49% |
||||||
|
5 to <10 |
70,614 |
6,141 |
8.70% |
6.94% |
7.22% |
5.41% |
||||||
|
10.00 to <100.00 |
44,562 |
9,239 |
20.73% |
23.41% |
21.45% |
16.29% |
||||||
|
10 to <20 |
23,429 |
2,656 |
11.34% |
14.08% |
13.48% |
10.33% |
||||||
|
20 to <30 |
9,877 |
1,943 |
19.67% |
26.41% |
22.27% |
15.11% |
||||||
|
30.00 to <100.00 |
11,256 |
4,640 |
41.22% |
37.11% |
37.33% |
32.79% |
||||||
|
100.00 (Default) |
51,798 |
0 |
N/M |
100.00% |
100.00% |
N/M |
||||||
|
Sub-total |
3,842,046 |
34,545 |
0.90% |
2.58% |
2.07% |
0.59% |
||||||
|
Other - SME |
||||||||||||
|
0.00 to <0.15 |
46,827 |
42 |
0.09% |
0.09% |
0.08% |
0.05% |
||||||
|
0.00 to <0.10 |
28,736 |
18 |
0.06% |
0.06% |
0.05% |
0.05% |
||||||
|
0.10 to <0.15 |
18,091 |
24 |
0.13% |
0.12% |
0.11% |
0.06% |
||||||
|
0.15 to <0.25 |
15,705 |
32 |
0.20% |
0.19% |
0.20% |
0.11% |
||||||
|
0.25 to <0.50 |
22,510 |
74 |
0.33% |
0.37% |
0.37% |
0.19% |
||||||
|
0.50 to <0.75 |
10,377 |
55 |
0.53% |
0.60% |
0.65% |
0.39% |
||||||
|
0.75 to <2.50 |
17,990 |
261 |
1.45% |
1.36% |
1.33% |
1.01% |
||||||
|
0.75 to <1.75 |
12,142 |
139 |
1.14% |
1.05% |
1.06% |
0.79% |
||||||
|
1.75 to <2.5 |
5,848 |
122 |
2.09% |
1.96% |
1.88% |
1.40% |
||||||
|
2.50 to <10.00 |
10,486 |
374 |
3.57% |
4.69% |
4.82% |
3.01% |
||||||
|
2.5 to <5 |
7,596 |
204 |
2.69% |
3.71% |
3.74% |
2.47% |
||||||
|
5 to <10 |
2,890 |
170 |
5.88% |
7.60% |
7.65% |
4.29% |
||||||
|
10.00 to <100.00 |
2,587 |
502 |
19.40% |
21.15% |
20.64% |
17.85% |
||||||
|
10 to <20 |
1,261 |
135 |
10.71% |
13.70% |
13.27% |
9.10% |
||||||
|
20 to <30 |
643 |
113 |
17.57% |
24.75% |
22.59% |
15.34% |
||||||
|
30.00 to <100.00 |
683 |
254 |
37.19% |
35.26% |
32.40% |
36.34% |
||||||
|
100.00 (Default) |
3,565 |
0 |
N/M |
100.00% |
100.00% |
N/M |
||||||
|
Sub-total |
130,047 |
1,340 |
1.03% |
6.22% |
3.89% |
0.88% |
||||||
|
Other - Non-SME |
||||||||||||
|
0.00 to <0.15 |
628,453 |
277 |
0.04% |
0.08% |
0.07% |
0.05% |
||||||
|
0.00 to <0.10 |
459,652 |
139 |
0.03% |
0.05% |
0.06% |
0.03% |
||||||
|
0.10 to <0.15 |
168,801 |
138 |
0.08% |
0.12% |
0.11% |
0.09% |
||||||
|
0.15 to <0.25 |
281,064 |
437 |
0.16% |
0.19% |
0.19% |
0.17% |
||||||
|
0.25 to <0.50 |
310,135 |
1,122 |
0.36% |
0.37% |
0.38% |
0.33% |
||||||
|
0.50 to <0.75 |
221,841 |
1,039 |
0.47% |
0.60% |
0.66% |
0.50% |
||||||
|
0.75 to <2.50 |
932,198 |
9,299 |
1.00% |
1.59% |
1.47% |
1.06% |
||||||
|
0.75 to <1.75 |
474,535 |
3,874 |
0.82% |
1.13% |
1.09% |
0.82% |
||||||
|
1.75 to <2.5 |
457,663 |
5,425 |
1.19% |
2.05% |
1.87% |
1.31% |
||||||
|
2.50 to <10.00 |
556,349 |
18,424 |
3.31% |
4.72% |
4.51% |
3.68% |
||||||
|
2.5 to <5 |
414,489 |
10,821 |
2.61% |
3.65% |
3.54% |
2.97% |
||||||
|
5 to <10 |
141,860 |
7,603 |
5.36% |
6.98% |
7.35% |
5.79% |
||||||
|
10.00 to <100.00 |
100,587 |
22,248 |
22.12% |
20.94% |
20.84% |
22.76% |
||||||
|
10 to <20 |
53,047 |
5,655 |
10.66% |
13.55% |
13.28% |
14.45% |
||||||
|
20 to <30 |
23,176 |
4,831 |
20.84% |
25.14% |
22.09% |
20.46% |
||||||
|
30.00 to <100.00 |
24,364 |
11,762 |
48.28% |
37.22% |
36.12% |
45.84% |
||||||
|
100.00 (Default) |
129,765 |
0 |
N/M |
100.00% |
100.00% |
N/M |
||||||
|
Sub-total |
3,160,392 |
52,846 |
1.67% |
9.59% |
6.11% |
2.10% |
||||||
|
Total |
7,388,216 |
86,128 |
1.17% |
3.18% |
3.76% |
1.15% |
||||||
The vast majority of the bank’s exposures facing non-sovereign counterparties (institutions, corporates and retail) is calculated based on the IRB (above 95 % coverage within internal models). The total number of obligors with short-term contracts at the disclosure date for foundation and advanced approach is 6.2 million with the majority of customers in the exposure class “retail - qualifying revolving and other retail non-SMEs”.
134
|
Deutsche Bank |
||
|
Pillar 3 Report as of December 31, 2024 |
||
Specialized lending and equity exposures in the banking book
Article 438 (e) CRR
The table below summarizes the foundation approach exposure for specialized lending where a former Postbank portfolio is part of the “income-producing real estate and high volatility commercial real estate” slotting category. Deutsche Bank does not treat any further exposures under the slotting approach as they are covered under the AIRB. Consequently, Deutsche Bank does not disclose tables for “Project finance”, “Object finance” and “Commodities finance”. For the calculation of minimum capital requirements regulatory risk weights are applied where potential risk mitigating factors are already considered in the assignment of the risk weight. The table presents the on- and off-balance-sheet exposures, the EAD and RWA as well as the associated regulatory expected losses.
EU CR10.02 – Specialized lending: Income-producing real estate and high volatility commercial real estate (Slotting approach)
|
in € m. |
Dec 31, 2024 |
|||||||||||||
|
Specialized lending |
a |
b |
c |
d |
e |
f |
||||||||
|
Regulatory categories |
Remaining maturity |
On-balance |
Off-balance |
Risk weight |
Exposure |
RWA |
Expected |
|||||||
|
Category 1 |
Less than 2.5 years |
137 |
2 |
50% |
139 |
70 |
0 |
|||||||
|
Equal to or more than 2.5 years |
287 |
0 |
70% |
287 |
201 |
1 |
||||||||
|
Category 2 |
Less than 2.5 years |
58 |
7 |
70% |
63 |
44 |
0 |
|||||||
|
Equal to or more than 2.5 years |
8 |
0 |
90% |
8 |
7 |
0 |
||||||||
|
Category 3 |
Less than 2.5 years |
0 |
0 |
115% |
0 |
0 |
0 |
|||||||
|
Equal to or more than 2.5 years |
0 |
0 |
115% |
0 |
0 |
0 |
||||||||
|
Category 4 |
Less than 2.5 years |
0 |
0 |
250% |
0 |
0 |
0 |
|||||||
|
Equal to or more than 2.5 years |
0 |
0 |
250% |
0 |
0 |
0 |
||||||||
|
Category 5 |
Less than 2.5 years |
3 |
3 |
– |
3 |
0 |
2 |
|||||||
|
Equal to or more than 2.5 years |
0 |
1 |
– |
0 |
0 |
0 |
||||||||
|
Total |
Less than 2.5 years |
199 |
11 |
– |
206 |
114 |
2 |
|||||||
|
Equal to or more than 2.5 years |
296 |
1 |
– |
296 |
209 |
1 |
||||||||
|
in € m. |
Jun 30, 2024 |
|||||||||||||
|
Specialized lending |
a |
b |
c |
d |
e |
f |
||||||||
|
Regulatory categories |
Remaining maturity |
On-balance |
Off-balance |
Risk weight |
Exposure |
RWA |
Expected |
|||||||
|
Category 1 |
Less than 2.5 years |
66 |
2 |
50% |
69 |
34 |
0 |
|||||||
|
Equal to or more than 2.5 years |
311 |
0 |
70% |
311 |
218 |
1 |
||||||||
|
Category 2 |
Less than 2.5 years |
55 |
8 |
70% |
61 |
43 |
0 |
|||||||
|
Equal to or more than 2.5 years |
62 |
0 |
90% |
62 |
56 |
0 |
||||||||
|
Category 3 |
Less than 2.5 years |
0 |
0 |
115% |
0 |
0 |
0 |
|||||||
|
Equal to or more than 2.5 years |
0 |
0 |
115% |
0 |
0 |
0 |
||||||||
|
Category 4 |
Less than 2.5 years |
0 |
0 |
250% |
0 |
0 |
0 |
|||||||
|
Equal to or more than 2.5 years |
0 |
0 |
250% |
0 |
0 |
0 |
||||||||
|
Category 5 |
Less than 2.5 years |
2 |
0 |
– |
2 |
0 |
1 |
|||||||
|
Equal to or more than 2.5 years |
0 |
0 |
– |
0 |
0 |
0 |
||||||||
|
Total |
Less than 2.5 years |
123 |
11 |
– |
131 |
77 |
1 |
|||||||
|
Equal to or more than 2.5 years |
373 |
0 |
– |
373 |
273 |
2 |
||||||||
As part of the advanced IRBA Deutsche Bank uses supervisory defined risk weights according to the simple risk weight approach for the Group’s equity positions. The table below presents the on- and off-balance-sheet exposures, the EAD, RWA and capital requirements for the categories of equity exposures as set out in Article 155 (2) CRR. For all these positions no credit risk mitigation techniques have been applied.
135
|
Deutsche Bank |
||
|
Pillar 3 Report as of December 31, 2024 |
||
EU CR10.05 – Equity exposures under the simple risk-weighted approach
|
in € m. |
Dec 31, 2024 |
|||||||||||||
|
Equities under the simple risk-weighted approach |
a |
b |
c |
d |
e |
f |
||||||||
|
Categories |
On-balance |
Off-balance |
Risk weight |
Exposure |
RWA |
Capital |
||||||||
|
Private equity exposures sufficiently diversified |
1,609 |
4 |
190% |
1,613 |
3,066 |
13 |
||||||||
|
Exchange-traded equity exposures |
116 |
2,222 |
290% |
2,338 |
6,779 |
19 |
||||||||
|
All other equity exposures |
166 |
7 |
370% |
173 |
641 |
4 |
||||||||
|
Total |
1,891 |
2,233 |
– |
4,124 |
10,485 |
36 |
||||||||
|
in € m. |
Jun 30, 2024 |
|||||||||||||
|
Equities under the simple risk-weighted approach |
a |
b |
c |
d |
e |
f |
||||||||
|
Categories |
On-balance |
Off-balance |
Risk weight |
Exposure |
RWA |
Capital |
||||||||
|
Private equity exposures sufficiently diversified |
1,630 |
4 |
190% |
1,634 |
3,105 |
13 |
||||||||
|
Exchange-traded equity exposures |
138 |
2,054 |
290% |
2,192 |
6,356 |
18 |
||||||||
|
All other equity exposures |
176 |
10 |
370% |
186 |
689 |
4 |
||||||||
|
Total |
1,944 |
2,068 |
– |
4,012 |
10,150 |
35 |
||||||||
Deutsche Bank´s RWA for equity exposures under the simple risk-weighted approach were € 10.5 billion as of December 31, 2024, in comparison to € 10.2 billion as of June 30, 2024. The increase of € 0.3 billion was predominantly driven by the category exchange-traded equity exposures which reflects increased equity positions in guaranteed funds.
136
|
Deutsche Bank |
||
|
Pillar 3 Report as of December 31, 2024 |
||
Counterparty credit risk (CCR)
Internal capital and credit limits for counterparty credit risk exposures
Article 439 (a) CRR (EU CCRA)
Counterparty credit exposure (CCR) arises from business activities in derivatives and securities financing transactions (SFT) and is the risk that the counterparty to a transaction may default before completing the satisfactory settlement of the transaction. The exposure to CCR is calculated by using the internal model method (IMM) and the standardized approach for counterparty credit risk (SA-CCR) for derivatives and the financial collateral comprehensive method for SFT respectively.
As the replacement values of derivatives portfolios fluctuate with movements in market rates and with changes in the transactions in the portfolios, the potential future replacement costs of the portfolios are estimated over their lifetimes or, in case of collateralized portfolios, over appropriate unwind periods. The potential future exposure is measured against a limit set for the counterparty for this type of transactions.
Limits for CCR exposures are established based on the principles for assigning credit limits as described in the sections "General qualitative information on credit risk" and “General qualitative information on credit risk mitigation”. For the purpose of limit setting, CCR exposures are also considered in the context of the overall credit exposure to the obligor and the group of borrowers under the one obligor principle.
The potential future exposure analysis is supplemented with stress tests to estimate the immediate impact of extreme market events on the exposures (such as event risk in the Emerging Markets portfolio).
For the majority of derivative counterparty exposures as well as for SFT (excluding former Postbank, now part of Deutsche Bank AG, exposures), the internal model method is used in accordance with Article 283 et seq. CRR. In this respect SFT encompass repurchase transactions, securities or commodities lending and borrowing as well as margin lending transactions. By applying this approach, the EAD calculations are based on a Monte Carlo simulation of the transactions’ future market values. Within this simulation process, interest and foreign exchange rates, credit spreads, equity and commodity prices are modeled by stochastic processes and each derivative and securities financing transaction is revalued at each point of a pre-defined time grid. As a result of this process, a distribution of future market values for each transaction at each time grid point is generated. From these distributions, by considering the appropriate netting and collateral agreements, the exposure measures potential future exposure, average expected exposure, expected positive exposure and effective expected positive exposure are derived.
The potential future exposure measure which Deutsche Bank uses is generally given by a time profile of simulated positive market values of each counterparty’s derivatives portfolio, for which netting and collateralization are considered. For limit monitoring the 95th quantile of the resulting distribution of market values is employed, internally referred to as potential future exposure. The average exposure profiles generated by the same calculation process are used to derive the so-called average expected exposure measure, which Deutsche Bank uses to reflect expected future replacement costs within the credit risk economic capital, and the expected positive exposure measure driving Deutsche Bank´s regulatory capital requirements. While average expected exposure and expected positive exposure are generally calculated with respect to a time horizon of one year, the potential future exposure is measured over the entire lifetime of a transaction or netting set for uncollateralized portfolios and over an appropriate unwind period for collateralized portfolios, respectively. The aforementioned calculation process is employed to derive stressed exposure results for input into the credit portfolio stress testing.
The potential future exposure profile of each counterparty is compared daily to the potential future exposure limit profile set by the respective credit officer. Potential future exposure limits are an integral part of the overall counterparty credit exposure management in line with other limit types. Breaches of potential future exposure limits at any one profile time point are highlighted for action within the credit risk management process. The expected positive exposure is an input to the Pillar 1 capital requirement, whereas average expected exposure feeds as a loan equivalent into the Group’s credit portfolio model (economic capital, applied under Pillar 2) where it is combined with all other credit exposure to a counterparty.
Collateral and credit reserves for counterparty credit risk
Article 439 (b) CRR (EU CCRA)
To reduce the credit risk resulting from OTC derivative transactions, where clearing via a central counterparty is not available, Deutsche Bank regularly seeks the execution of standard master agreements (such as master agreements for derivatives published by the International Swaps and Derivatives Association, Inc. (ISDA) or the German Master Agreement for Financial Derivative Transactions) with the counterparties. A master agreement allows for the close-out netting of rights and obligations arising under derivative transactions that have been entered into under such a master agreement upon the counterparty’s default, resulting in a single net claim owed by or to the counterparty. For certain parts of the derivatives business (e.g., foreign exchange transactions), Deutsche Bank also enters into master agreements under which payment netting applies with respect to transactions covered by such master agreements, reducing settlement risk. The risk measurement and risk assessment processes apply close-out netting only to the extent it is believed that the master agreement is legally valid and enforceable in all relevant jurisdictions.
137
|
Deutsche Bank |
||
|
Pillar 3 Report as of December 31, 2024 |
||
ISDA Master Agreements are generally accompanied by credit support annexes (CSAs) to master agreements in order to further reduce the derivatives-related credit risk. These annexes generally provide risk mitigation through periodic, usually daily, margining of the covered exposure. The CSAs also provide for the right to terminate the related derivative transactions upon the counterparty’s failure to honor a margin call. As with netting, when Deutsche Bank believes the annex is enforceable, it is reflected in the exposure measurement.
Deutsche Bank also establishes counterparty credit valuation adjustments (CVA) for OTC derivative transactions to cover expected credit losses. The adjustment amount is determined by assessing the potential credit exposure to a given counterparty and taking into account any collateral held, the effect of any relevant netting arrangements, expected loss given default and the credit risk, based on available market information, including CDS spreads.
Management of wrong-way risk exposures
Article 439 (c) CRR (EU CCRA)
Wrong-way risk occurs when exposure to a counterparty is adversely correlated with the credit quality of that counterparty. In compliance with Article 291(2) and (4) CRR Deutsche Bank has a monthly process to monitor several layers of wrong-way risk (specific wrong-way risk, general explicit wrong-way risk at country/industry/region levels and general implicit wrong-way risk), whereby relevant exposures arising from transactions subject to wrong-way risk are automatically selected and presented for comment to the responsible credit officer. A wrong-way risk report is then sent to credit risk senior management on a monthly basis. In addition, the bank utilizes its established process for calibrating its own alpha factor (as defined in Article 284 (9) CRR) to estimate the overall wrong-way risk in the bank’s derivatives and securities financing transactions portfolio.
Collateral in the event of a rating downgrade
Article 439 (d) CRR (EU CCRA)
Certain CSAs to master agreements provide for rating-dependent triggers, where additional collateral must be pledged if a party’s rating is downgraded. The Group also enters into master agreements that provide for an additional termination event upon a party’s rating downgrade. These downgrade provisions in CSAs and master agreements usually apply to both parties but in some agreements may apply only to Deutsche Bank. The Group analyzes and monitors its potential contingent payment obligations resulting from a rating downgrade in the bank’s stress testing and liquidity coverage ratio approach for liquidity risk on an ongoing basis.
The following table presents the amount needed to meet collateral requirements from contractual obligations in the event of a one- or two-notch downgrade by rating agencies for all currencies.
Contractual Obligations
|
|
Dec 31, 2024 |
Dec 31, 2023 |
||||||
|
in € m. |
One-notch |
Two-notch |
One-notch |
Two-notch |
||||
|
Contractual derivatives funding or margin requirements |
182 |
309 |
402 |
526 |
||||
|
Other contractual funding or margin requirements |
0 |
0 |
0 |
0 |
||||
Estimate of alpha factor
Article 439 (k) CRR
Under the internal model method (IMM) approach the exposure value is calculated as the product of the effective expected positive exposure and a multiplier ‘alpha’ (α). The scaling factor alpha is applied in order to correct for correlations between counterparties, concentration risk, and to account for the level of volatility/correlation that might coincide with a downturn. Deutsche Bank received regulatory approval to use its own calibrated alpha factor. For its regulatory capital calculation, however, a regulatory minimum level of 1.25 needs to be applied.
138
|
Deutsche Bank |
||
|
Pillar 3 Report as of December 31, 2024 |
||
CCR exposures by model approach and development
Article 439 (f, g, k) CRR
The following table shows the methods used for calculating the regulatory requirements for CCR exposure including the main parameters for each method. Exposures relevant for CVA charges and exposures cleared through a central counterparty are presented separately in table EU CCR2 and EU CCR8, respectively. Deutsche Bank does not make use of the original exposure method for derivatives nor the financial collateral simple method for SFTs. Deutsche Bank also uses the new SA-CCR to calculate the exposure at default for derivatives. This approach still consists of a replacement cost and a potential future exposure but also considers a multiplier. The multiplier differentiates between margined and non-margined trades and recognizes netting and hedging benefits as well as collateralization. Under the IMM only the effective expected positive exposure and the exposure at default are presented. For the calculation of CCR RWA the higher of the stressed effective expected positive exposure and the unstressed effective expected positive exposure is taken into consideration. The simulation process of future market values in the internal model also includes the impact from regulatory netting and collateralization across all asset classes.
EU CCR1 – Analysis of CCR exposure by approach
|
|
Dec 31, 2024 |
|||||||||||||||||
|
a |
b |
c |
d |
e |
f |
g |
h |
|||||||||||
|
in € m. |
Replacement cost (RC) |
Potential future exposure (PFE) |
EEPE |
Alpha used for computing regulatory exposure value |
Exposure value pre-CRM |
Exposure value post-CRM |
Exposure value |
RWA |
||||||||||
|
EU1 |
EU - Original Exposure Method (for derivatives) |
0 |
0 |
– |
1.4 |
0 |
0 |
0 |
0 |
|||||||||
|
EU2 |
EU - Simplified SA-CCR (for derivatives) |
0 |
0 |
– |
1.4 |
0 |
0 |
0 |
0 |
|||||||||
|
1 |
SA-CCR (for derivatives) |
2,117 |
1,246 |
– |
1.4 |
5,836 |
4,708 |
4,708 |
1,209 |
|||||||||
|
2 |
IMM (for derivatives and SFTs) |
– |
– |
51,813 |
1.25 |
894,941 |
64,767 |
64,586 |
15,189 |
|||||||||
|
of which: |
||||||||||||||||||
|
2a |
Securities financing transactions netting sets |
– |
– |
22,481 |
– |
790,790 |
28,101 |
28,101 |
2,246 |
|||||||||
|
2b |
Derivatives and long settlement transactions netting sets |
– |
– |
29,332 |
– |
104,151 |
36,665 |
36,485 |
12,943 |
|||||||||
|
2c |
from Contractual cross-product netting sets |
– |
– |
0 |
– |
0 |
0 |
0 |
0 |
|||||||||
|
3 |
Financial collateral simple method (for SFTs) |
– |
– |
– |
– |
0 |
0 |
0 |
0 |
|||||||||
|
4 |
Financial collateral comprehensive method (for SFTs) |
– |
– |
– |
– |
37,598 |
22,216 |
22,216 |
2,160 |
|||||||||
|
5 |
VaR for SFTs |
– |
– |
– |
– |
0 |
0 |
0 |
0 |
|||||||||
|
6 |
Total |
– |
– |
– |
– |
938,375 |
91,690 |
91,510 |
18,558 |
|||||||||
139
|
Deutsche Bank |
||
|
Pillar 3 Report as of December 31, 2024 |
||
|
|
Jun 30, 2024 |
|||||||||||||||||
|
a |
b |
c |
d |
e |
f |
g |
h |
|||||||||||
|
in € m. |
Replacement cost (RC) |
Potential future exposure (PFE) |
EEPE |
Alpha used for computing regulatory exposure value |
Exposure value pre-CRM |
Exposure value post-CRM |
Exposure value |
RWA |
||||||||||
|
EU1 |
EU - Original Exposure Method (for derivatives) |
0 |
0 |
– |
1.4 |
0 |
0 |
0 |
0 |
|||||||||
|
EU2 |
EU - Simplified SA-CCR (for derivatives) |
0 |
0 |
– |
1.4 |
0 |
0 |
0 |
0 |
|||||||||
|
1 |
SA-CCR (for derivatives) |
1,688 |
1,075 |
– |
1.4 |
5,156 |
3,868 |
3,868 |
1,081 |
|||||||||
|
2 |
IMM (for derivatives and SFTs) |
– |
– |
46,289 |
1.25 |
711,486 |
57,862 |
57,695 |
13,901 |
|||||||||
|
of which: |
||||||||||||||||||
|
2a |
Securities financing transactions netting sets |
– |
– |
20,932 |
– |
617,055 |
26,165 |
26,165 |
1,959 |
|||||||||
|
2b |
Derivatives and long settlement transactions netting sets |
– |
– |
25,357 |
– |
94,430 |
31,697 |
31,530 |
11,942 |
|||||||||
|
2c |
from Contractual cross-product netting sets |
– |
– |
0 |
– |
0 |
0 |
0 |
0 |
|||||||||
|
3 |
Financial collateral simple method (for SFTs) |
– |
– |
– |
– |
0 |
0 |
0 |
0 |
|||||||||
|
4 |
Financial collateral comprehensive method (for SFTs) |
– |
– |
– |
– |
65,394 |
34,832 |
34,832 |
2,400 |
|||||||||
|
5 |
VaR for SFTs |
– |
– |
– |
– |
0 |
0 |
0 |
0 |
|||||||||
|
6 |
Total |
– |
– |
– |
– |
782,035 |
96,562 |
96,396 |
17,382 |
|||||||||
The size of Deutsche Bank´s on- and off-balance-sheet derivative business was € 622.4 billion as of December 31, 2024 (€ 503.8 billion as of June 30, 2024), which represents around 45% of its total assets.
Deutsche Bank´s CCR RWA stands at € 18.6 billion as of December 31, 2024, reflecting an increase of € 1.2 billion from June 30, 2024. The increase reflects predominantly higher exposures for derivatives and SFTs under IMM as well as derivatives under SA-CCR, partly offset by decreased exposures for SFTs under financial collateral comprehensive method.
CCR exposures development
Article 438 (h) CRR
The following table provides an analysis of key drivers for RWA movements observed for counterparty credit risk exposures calculated under the internal model method (IMM) in the current and previous reporting period.
EU CCR7 – RWA flow statement of counterparty credit risk exposures under the internal model method
|
|
Three months ended Dec 31, 2024 |
Three months ended Sep 30, 2024 |
|||||
|
a |
a |
||||||
|
in € m. |
RWA |
RWA |
|||||
|
1 |
Counterparty credit risk RWA under the IMM opening balance |
16,199 |
14,635 |
||||
|
2 |
Asset size |
(694) |
1,629 |
||||
|
3 |
Credit quality of counterparties |
(133) |
150 |
||||
|
4 |
Model updates (IMM only) |
0 |
0 |
||||
|
5 |
Methodology and policy (IMM only) |
0 |
0 |
||||
|
6 |
Acquisitions and disposals |
0 |
0 |
||||
|
7 |
Foreign exchange movements |
618 |
(215) |
||||
|
8 |
Other |
0 |
0 |
||||
|
9 |
Counterparty credit risk RWA under the IMM closing balance |
15,991 |
16,199 |
||||
Organic changes in portfolio size and composition are considered in the category “Asset size”. The category “Credit quality of counterparties” represents the effects from portfolio rating migrations, loss given default, model parameter recalibrations as well as collateral coverage and netting activities. “Model updates (IMM only)” include model refinements and further roll out of advanced internal models. RWA movements resulting from externally, regulatory-driven changes, e.g., applying new regulations, are considered in the “methodology and policy (IMM only)” category. “Acquisition and disposals” is relating to significant exposure movements which can be clearly assigned to acquisition or disposal related activities. Changes that cannot be attributed to the above categories are reflected in the category “other”.
140
|
Deutsche Bank |
||
|
Pillar 3 Report as of December 31, 2024 |
||
RWA for counterparty credit risk exposures under the IMM decreased by € 0.2 billion or 1.3% since September 30, 2024, primarily driven by the category “Asset size”, reflecting a change in the derivative portfolio with reduced risk weights, which more than compensated the increase in exposures. The decrease in RWA for derivatives was partly offset by increased exposures for SFTs. Additionally, category “credit quality of counterparties” decreased due to improved counterparty ratings. The mentioned decreases were partly offset by an increase in category “Foreign exchange movements”.
CCR CVA capital charge
Article 439 (h) CRR
The table below provides a breakdown of the credit valuation adjustment (CVA) RWA into advanced and standardized approaches. In addition, the incremental contributions from the VaR and stressed VaR components are highlighted. Deutsche Bank calculates the majority of the CVA based on internal model as approved by the competent supervisory authority, which is consistent with the advanced method, driving the reported CVA RWA of € 3.4 billion (97%), whilst the standardized method covers only € 93 million (3%) of the total CVA RWA. The stressed VaR component is the main driver of advanced CVA RWA, which results from the stressed period volatilities considered.
EU CCR2 – CVA capital charge
|
|
Dec 31, 2024 |
Jun 30, 2024 |
||||||||
|
a |
b |
a |
b |
|||||||
|
in € m. |
Exposure value |
RWA |
Exposure value |
RWA |
||||||
|
1 |
Total portfolios subject to the Advanced Method |
65,356 |
3,338 |
66,416 |
3,868 |
|||||
|
2 |
(i) VaR component (including the 3× multiplier) |
0 |
471 |
0 |
313 |
|||||
|
3 |
(ii) Stressed VaR component (including the 3× multiplier) |
0 |
2,867 |
0 |
3,555 |
|||||
|
4 |
Transactions subject to the Standardised method |
562 |
93 |
49 |
15 |
|||||
|
EU4 |
Transactions subject to the Alternative approach (Based on the Original Exposure Method) |
0 |
0 |
0 |
0 |
|||||
|
5 |
Total transactions subject to own funds requirements for CVA risk |
65,918 |
3,431 |
66,465 |
3,883 |
|||||
CCR exposures to central counterparties
Article 439 (i) CRR
The table below presents an overview of Deutsche Bank´s exposures and RWA to central counterparties arising from transactions, margins and contributions to default funds. As of December 31, 2024, Deutsche Bank mainly reported exposures to qualifying central counterparties (QCCP) as defined in Article 4 (88) CRR.
EU CCR8 – Exposures to CCPs
|
|
Dec 31, 2024 |
Jun 30, 2024 |
||||||||
|
a |
b |
a |
b |
|||||||
|
in € m. |
Exposure value |
RWA |
Exposure value |
RWA |
||||||
|
1 |
Exposures to QCCPs (total) |
- |
1,006 |
- |
831 |
|||||
|
2 |
Exposures for trades at QCCPs (excluding initial margin and default fund contributions) |
11,791 |
236 |
8,105 |
162 |
|||||
|
of which: |
||||||||||
|
3 |
(i) OTC derivatives |
5,962 |
119 |
4,326 |
87 |
|||||
|
4 |
(ii) Exchange-traded derivatives |
3,633 |
73 |
1,647 |
33 |
|||||
|
5 |
(iii) Securities financing transactions |
2,196 |
44 |
2,132 |
43 |
|||||
|
6 |
(iv) Netting sets where cross-product netting has been approved |
0 |
0 |
0 |
0 |
|||||
|
7 |
Segregated initial margin |
9,377 |
- |
8,933 |
- |
|||||
|
8 |
Non-segregated initial margin |
4,767 |
95 |
2,751 |
55 |
|||||
|
9 |
Pre-funded default fund contributions |
2,106 |
674 |
1,474 |
614 |
|||||
|
10 |
Unfunded default fund contributions |
2,936 |
0 |
2,135 |
0 |
|||||
|
|
|
- |
3,525 |
- |
2,614 |
|||||
|
12 |
Exposures for trades at non-QCCPs (excluding initial margin and default fund contributions) |
506 |
506 |
571 |
586 |
|||||
|
of which: |
||||||||||
|
13 |
(i) OTC derivatives |
445 |
445 |
471 |
471 |
|||||
|
14 |
(ii) Exchange-traded derivatives |
1 |
1 |
2 |
2 |
|||||
|
15 |
(iii) Securities financing transactions |
59 |
59 |
98 |
112 |
|||||
|
16 |
(iv) Netting sets where cross-product netting has been approved |
0 |
0 |
0 |
0 |
|||||
|
17 |
Segregated initial margin |
0 |
- |
0 |
- |
|||||
|
18 |
Non-segregated initial margin |
0 |
0 |
0 |
0 |
|||||
|
19 |
Prefunded default fund contributions |
42 |
521 |
28 |
341 |
|||||
|
20 |
Unfunded default fund contributions |
200 |
2,499 |
135 |
1,687 |
|||||
141
|
Deutsche Bank |
||
|
Pillar 3 Report as of December 31, 2024 |
||
Deutsche Bank´s RWA for central counterparties were € 4.5 billion as of December 31, 2024, reflecting an increase of € 1.1 billion from June 30, 2024. The increase was predominantly driven by increased exposures to non-QCCPs.
CCR exposures in the standardized approach
Article 444 (e) CRR
The following table provides the counterparty credit risk exposures in the standardized approach broken down by risk weights and regulatory exposure classes. This table excludes risk weighted exposure amounts derived from own funds requirements for CVA risk but includes exposures cleared through a CCP.
EU CCR3 – Standardized approach – CCR exposures by regulatory portfolio and risk
|
|
Dec 31, 2024 |
|||||||||||||||
|
in € m. |
Risk Weight |
|||||||||||||||
|
a |
b |
c |
d |
e |
f |
g |
||||||||||
|
Exposure classes |
0% |
2% |
4% |
10% |
20% |
50% |
70% |
|||||||||
|
1 |
Central governments or central banks |
3,680 |
597 |
0 |
0 |
0 |
0 |
0 |
||||||||
|
2 |
Regional governments or local authorities |
133 |
0 |
0 |
0 |
2 |
0 |
0 |
||||||||
|
3 |
Public sector entities |
218 |
0 |
0 |
0 |
0 |
0 |
0 |
||||||||
|
4 |
Multilateral development banks |
615 |
0 |
0 |
0 |
0 |
0 |
0 |
||||||||
|
5 |
International organizations |
0 |
0 |
0 |
0 |
0 |
0 |
0 |
||||||||
|
6 |
Institutions |
22 |
15,962 |
1 |
0 |
2 |
12 |
0 |
||||||||
|
7 |
Corporates |
154 |
0 |
0 |
0 |
0 |
5 |
0 |
||||||||
|
8 |
Retail |
0 |
0 |
0 |
0 |
0 |
0 |
0 |
||||||||
|
9 |
Institutions and corporates with a short-term credit assessment |
0 |
0 |
0 |
0 |
0 |
0 |
0 |
||||||||
|
10 |
Other items |
0 |
0 |
0 |
0 |
0 |
0 |
0 |
||||||||
|
11 |
Total |
4,822 |
16,558 |
1 |
0 |
4 |
18 |
0 |
||||||||
|
|
Dec 31, 2024 |
|||||||||||
|
in € m. |
Risk Weight |
|||||||||||
|
h |
i |
j |
k |
l |
||||||||
|
Exposure classes |
75% |
100% |
150% |
Others |
Total |
|||||||
|
1 |
Central governments or central banks |
0 |
0 |
0 |
0 |
4,276 |
||||||
|
2 |
Regional governments or local authorities |
0 |
0 |
0 |
0 |
135 |
||||||
|
3 |
Public sector entities |
0 |
0 |
0 |
0 |
218 |
||||||
|
4 |
Multilateral development banks |
0 |
0 |
0 |
0 |
615 |
||||||
|
5 |
International organizations |
0 |
0 |
0 |
0 |
0 |
||||||
|
6 |
Institutions |
0 |
0 |
0 |
0 |
16,000 |
||||||
|
7 |
Corporates |
0 |
1,719 |
1 |
0 |
1,879 |
||||||
|
8 |
Retail |
5 |
0 |
0 |
0 |
5 |
||||||
|
9 |
Institutions and corporates with a short-term credit assessment |
0 |
0 |
0 |
0 |
0 |
||||||
|
10 |
Other items |
0 |
4 |
7 |
0 |
11 |
||||||
|
11 |
Total |
5 |
1,723 |
8 |
0 |
23,139 |
||||||
|
|
Jun 30, 2024 |
|||||||||||||||
|
in € m. |
Risk Weight |
|||||||||||||||
|
a |
b |
c |
d |
e |
f |
g |
||||||||||
|
Exposure classes |
0% |
2% |
4% |
10% |
20% |
50% |
70% |
|||||||||
|
1 |
Central governments or central banks |
2,644 |
0 |
0 |
0 |
0 |
0 |
0 |
||||||||
|
2 |
Regional governments or local authorities |
118 |
0 |
0 |
0 |
0 |
0 |
0 |
||||||||
|
3 |
Public sector entities |
297 |
0 |
0 |
0 |
0 |
0 |
0 |
||||||||
|
4 |
Multilateral development banks |
420 |
0 |
0 |
0 |
0 |
0 |
0 |
||||||||
|
5 |
International organizations |
0 |
0 |
0 |
0 |
0 |
0 |
0 |
||||||||
|
6 |
Institutions |
7 |
10,856 |
2 |
0 |
40 |
0 |
0 |
||||||||
|
7 |
Corporates |
62 |
0 |
0 |
0 |
118 |
1 |
0 |
||||||||
|
8 |
Retail |
0 |
0 |
0 |
0 |
0 |
0 |
0 |
||||||||
|
9 |
Institutions and corporates with a short-term credit assessment |
0 |
0 |
0 |
0 |
0 |
0 |
0 |
||||||||
|
10 |
Other items |
0 |
0 |
0 |
0 |
0 |
0 |
0 |
||||||||
|
11 |
Total |
3,549 |
10,856 |
2 |
0 |
158 |
1 |
0 |
||||||||
142
|
Deutsche Bank |
||
|
Pillar 3 Report as of December 31, 2024 |
||
|
|
Jun 30, 2024 |
|||||||||||
|
in € m. |
Risk Weight |
|||||||||||
|
h |
i |
j |
k |
l |
||||||||
|
Exposure classes |
75% |
100% |
150% |
Others |
Total |
|||||||
|
1 |
Central governments or central banks |
0 |
0 |
0 |
0 |
2,644 |
||||||
|
2 |
Regional governments or local authorities |
0 |
0 |
0 |
0 |
118 |
||||||
|
3 |
Public sector entities |
0 |
0 |
0 |
0 |
297 |
||||||
|
4 |
Multilateral development banks |
0 |
0 |
0 |
0 |
420 |
||||||
|
5 |
International organizations |
0 |
0 |
0 |
0 |
0 |
||||||
|
6 |
Institutions |
0 |
0 |
0 |
0 |
10,905 |
||||||
|
7 |
Corporates |
0 |
939 |
32 |
0 |
1,152 |
||||||
|
8 |
Retail |
1 |
0 |
0 |
0 |
1 |
||||||
|
9 |
Institutions and corporates with a short-term credit assessment |
0 |
0 |
0 |
0 |
0 |
||||||
|
10 |
Other items |
0 |
0 |
3 |
0 |
3 |
||||||
|
11 |
Total |
1 |
939 |
35 |
0 |
15,541 |
||||||
CCR exposures within the foundation IRBA
Article 452 (g) CRR
The following tables disclose Deutsche Bank´s foundation IRBA counterparty credit risk exposures, i.e., derivatives and securities financing transactions, distributed on its internal rating scale for exposure classes central governments and central banks, institutions as well as corporates with its relevant subcategories. CVA charges or exposures cleared through a CCP are excluded.
Deutsche Bank discloses the exposure after CCF and CRM, where exposures covered by guarantees or credit derivatives are assigned to the protection seller.
The exposure after CCF and CRM is presented in conjunction with exposures-weighted average PD, RWAs, the average risk weight and the number of obligors. In addition, it provides the average LGD and average maturity, which is regulatory pre-defined in the foundation IRB. The tables provide the defaulted exposure separately.
143
|
Deutsche Bank |
||
|
Pillar 3 Report as of December 31, 2024 |
||
EU CCR4 – FIRB approach – CCR exposures by portfolio and PD scale
|
in € m. |
Dec 31, 2024 |
|||||||||||||
|
(unless stated otherwise) |
a |
b |
c |
d |
e |
f |
g |
|||||||
|
Exposure class/ |
Exposure value |
Average PD |
Number of |
Average LGD |
Average maturity |
RWA |
Density of risk weighted exposure amounts |
|||||||
|
Central governments |
||||||||||||||
|
0.00 to <0.15 |
0 |
0 |
0 |
0 |
0 |
0 |
0 |
|||||||
|
0.15 to <0.25 |
0 |
0 |
0 |
0 |
0 |
0 |
0 |
|||||||
|
0.25 to <0.50 |
0 |
0 |
0 |
0 |
0 |
0 |
0 |
|||||||
|
0.50 to <0.75 |
0 |
0 |
0 |
0 |
0 |
0 |
0 |
|||||||
|
0.75 to <2.50 |
0 |
0 |
0 |
0 |
0 |
0 |
0 |
|||||||
|
2.50 to <10.00 |
0 |
0 |
0 |
0 |
0 |
0 |
0 |
|||||||
|
10.00 to <100.00 |
0 |
0 |
0 |
0 |
0 |
0 |
0 |
|||||||
|
100.00 (Default) |
0 |
0 |
0 |
0 |
0 |
0 |
0 |
|||||||
|
Sub-total |
0 |
0 |
0 |
0 |
0 |
0 |
0 |
|||||||
|
Institutions |
||||||||||||||
|
0.00 to <0.15 |
0 |
0 |
0 |
0 |
0 |
0 |
0 |
|||||||
|
0.15 to <0.25 |
0 |
0 |
0 |
0 |
0 |
0 |
0 |
|||||||
|
0.25 to <0.50 |
0 |
0 |
0 |
0 |
0 |
0 |
0 |
|||||||
|
0.50 to <0.75 |
0 |
0 |
0 |
0 |
0 |
0 |
0 |
|||||||
|
0.75 to <2.50 |
0 |
0 |
0 |
0 |
0 |
0 |
0 |
|||||||
|
2.50 to <10.00 |
0 |
0 |
0 |
0 |
0 |
0 |
0 |
|||||||
|
10.00 to <100.00 |
0 |
0 |
0 |
0 |
0 |
0 |
0 |
|||||||
|
100.00 (Default) |
0 |
0 |
0 |
0 |
0 |
0 |
0 |
|||||||
|
Sub-total |
0 |
0 |
0 |
0 |
0 |
0 |
0 |
|||||||
|
Corporates |
||||||||||||||
|
0.00 to <0.15 |
0 |
0 |
0 |
0 |
0 |
0 |
0 |
|||||||
|
0.15 to <0.25 |
0 |
0 |
0 |
0 |
0 |
0 |
0 |
|||||||
|
0.25 to <0.50 |
0 |
0.38 |
0.0 |
45.00 |
2.5 |
0 |
70.00 |
|||||||
|
0.50 to <0.75 |
13 |
0.69 |
0.0 |
45.00 |
2.5 |
9 |
69.85 |
|||||||
|
0.75 to <2.50 |
1 |
1.23 |
0.0 |
45.00 |
2.5 |
1 |
90.00 |
|||||||
|
2.50 to <10.00 |
0 |
0 |
0 |
0 |
0 |
0 |
0 |
|||||||
|
10.00 to <100.00 |
0 |
100.00 |
0.0 |
45.00 |
2.5 |
0 |
0 |
|||||||
|
100.00 (Default) |
0 |
0 |
0 |
0 |
0 |
0 |
0 |
|||||||
|
Sub-total |
14 |
0.72 |
0.0 |
45.00 |
2.5 |
10 |
71.10 |
|||||||
|
of which: |
||||||||||||||
|
SMEs |
||||||||||||||
|
0.00 to <0.15 |
0 |
0 |
0 |
0 |
0 |
0 |
0 |
|||||||
|
0.15 to <0.25 |
0 |
0 |
0 |
0 |
0 |
0 |
0 |
|||||||
|
0.25 to <0.50 |
0 |
0 |
0 |
0 |
0 |
0 |
0 |
|||||||
|
0.50 to <0.75 |
0 |
0 |
0 |
0 |
0 |
0 |
0 |
|||||||
|
0.75 to <2.50 |
0 |
0 |
0 |
0 |
0 |
0 |
0 |
|||||||
|
2.50 to <10.00 |
0 |
0 |
0 |
0 |
0 |
0 |
0 |
|||||||
|
10.00 to <100.00 |
0 |
0 |
0 |
0 |
0 |
0 |
0 |
|||||||
|
100.00 (Default) |
0 |
0 |
0 |
0 |
0 |
0 |
0 |
|||||||
|
Sub-total |
0 |
0 |
0 |
0 |
0 |
0 |
0 |
|||||||
|
Specialized Lending |
||||||||||||||
|
0.00 to <0.15 |
0 |
0 |
0 |
0 |
0 |
0 |
0 |
|||||||
|
0.15 to <0.25 |
0 |
0 |
0 |
0 |
0 |
0 |
0 |
|||||||
|
0.25 to <0.50 |
0 |
0.38 |
0.0 |
45.00 |
2.5 |
0 |
70.00 |
|||||||
|
0.50 to <0.75 |
13 |
0.69 |
0.0 |
45.00 |
2.5 |
9 |
69.85 |
|||||||
|
0.75 to <2.50 |
1 |
1.23 |
0.0 |
45.00 |
2.5 |
1 |
90.00 |
|||||||
|
2.50 to <10.00 |
0 |
0 |
0 |
0 |
0 |
0 |
0 |
|||||||
|
10.00 to <100.00 |
0 |
100.00 |
0.0 |
45.00 |
2.5 |
0 |
0 |
|||||||
|
100.00 (Default) |
0 |
0 |
0 |
0 |
0 |
0 |
0 |
|||||||
|
Sub-total |
14 |
0.72 |
0.0 |
45.00 |
2.5 |
10 |
71.10 |
|||||||
|
Other |
||||||||||||||
|
0.00 to <0.15 |
0 |
0 |
0 |
0 |
0 |
0 |
0 |
|||||||
|
0.15 to <0.25 |
0 |
0 |
0 |
0 |
0 |
0 |
0 |
|||||||
|
0.25 to <0.50 |
0 |
0 |
0 |
0 |
0 |
0 |
0 |
|||||||
|
0.50 to <0.75 |
0 |
0 |
0 |
0 |
0 |
0 |
0 |
|||||||
|
0.75 to <2.50 |
0 |
0 |
0 |
0 |
0 |
0 |
0 |
|||||||
|
2.50 to <10.00 |
0 |
0 |
0 |
0 |
0 |
0 |
0 |
|||||||
|
10.00 to <100.00 |
0 |
0 |
0 |
0 |
0 |
0 |
0 |
|||||||
|
100.00 (Default) |
0 |
0 |
0 |
0 |
0 |
0 |
0 |
|||||||
|
Sub-total |
0 |
0 |
0 |
0 |
0 |
0 |
0 |
|||||||
|
Total |
14 |
0.72 |
0.0 |
45.00 |
2.5 |
10 |
71.10 |
|||||||
144
|
Deutsche Bank |
||
|
Pillar 3 Report as of December 31, 2024 |
||
|
in € m. |
Jun 30, 2024 |
|||||||||||||
|
(unless stated otherwise) |
a |
b |
c |
d |
e |
f |
g |
|||||||
|
Exposure class/ |
Exposure value |
Average PD |
Number of |
Average LGD |
Average maturity |
RWA |
Density of risk weighted exposure amounts |
|||||||
|
Central governments |
||||||||||||||
|
0.00 to <0.15 |
0 |
0 |
0 |
0 |
0 |
0 |
0 |
|||||||
|
0.15 to <0.25 |
0 |
0 |
0 |
0 |
0 |
0 |
0 |
|||||||
|
0.25 to <0.50 |
0 |
0 |
0 |
0 |
0 |
0 |
0 |
|||||||
|
0.50 to <0.75 |
0 |
0 |
0 |
0 |
0 |
0 |
0 |
|||||||
|
0.75 to <2.50 |
0 |
0 |
0 |
0 |
0 |
0 |
0 |
|||||||
|
2.50 to <10.00 |
0 |
0 |
0 |
0 |
0 |
0 |
0 |
|||||||
|
10.00 to <100.00 |
0 |
0 |
0 |
0 |
0 |
0 |
0 |
|||||||
|
100.00 (Default) |
0 |
0 |
0 |
0 |
0 |
0 |
0 |
|||||||
|
Sub-total |
0 |
0 |
0 |
0 |
0 |
0 |
0 |
|||||||
|
Institutions |
||||||||||||||
|
0.00 to <0.15 |
0 |
0 |
0 |
0 |
0 |
0 |
0 |
|||||||
|
0.15 to <0.25 |
0 |
0 |
0 |
0 |
0 |
0 |
0 |
|||||||
|
0.25 to <0.50 |
0 |
0 |
0 |
0 |
0 |
0 |
0 |
|||||||
|
0.50 to <0.75 |
0 |
0 |
0 |
0 |
0 |
0 |
0 |
|||||||
|
0.75 to <2.50 |
0 |
0 |
0 |
0 |
0 |
0 |
0 |
|||||||
|
2.50 to <10.00 |
0 |
0 |
0 |
0 |
0 |
0 |
0 |
|||||||
|
10.00 to <100.00 |
0 |
0 |
0 |
0 |
0 |
0 |
0 |
|||||||
|
100.00 (Default) |
0 |
0 |
0 |
0 |
0 |
0 |
0 |
|||||||
|
Sub-total |
0 |
0 |
0 |
0 |
0 |
0 |
0 |
|||||||
|
Corporates |
||||||||||||||
|
0.00 to <0.15 |
0 |
0 |
0 |
0 |
0 |
0 |
0 |
|||||||
|
0.15 to <0.25 |
0 |
0 |
0 |
0 |
0 |
0 |
0 |
|||||||
|
0.25 to <0.50 |
0 |
0.38 |
0.0 |
45.00 |
2.5 |
0 |
70.00 |
|||||||
|
0.50 to <0.75 |
10 |
0.69 |
0.0 |
45.00 |
2.5 |
7 |
69.76 |
|||||||
|
0.75 to <2.50 |
1 |
1.23 |
0.0 |
45.00 |
2.5 |
1 |
90.00 |
|||||||
|
2.50 to <10.00 |
0 |
0 |
0 |
0 |
0 |
0 |
0 |
|||||||
|
10.00 to <100.00 |
0 |
0 |
0 |
0 |
0 |
0 |
0 |
|||||||
|
100.00 (Default) |
0 |
0 |
0 |
0 |
0 |
0 |
0 |
|||||||
|
Sub-total¹ |
11 |
0.72 |
0.0 |
45.00 |
2.5 |
8 |
71.04 |
|||||||
|
of which: |
||||||||||||||
|
SMEs |
||||||||||||||
|
0.00 to <0.15 |
0 |
0 |
0 |
0 |
0 |
0 |
0 |
|||||||
|
0.15 to <0.25 |
0 |
0 |
0 |
0 |
0 |
0 |
0 |
|||||||
|
0.25 to <0.50 |
0 |
0 |
0 |
0 |
0 |
0 |
0 |
|||||||
|
0.50 to <0.75 |
0 |
0 |
0 |
0 |
0 |
0 |
0 |
|||||||
|
0.75 to <2.50 |
0 |
0 |
0 |
0 |
0 |
0 |
0 |
|||||||
|
2.50 to <10.00 |
0 |
0 |
0 |
0 |
0 |
0 |
0 |
|||||||
|
10.00 to <100.00 |
0 |
0 |
0 |
0 |
0 |
0 |
0 |
|||||||
|
100.00 (Default) |
0 |
0 |
0 |
0 |
0 |
0 |
0 |
|||||||
|
Sub-total |
0 |
0 |
0 |
0 |
0 |
0 |
0 |
|||||||
|
Specialized Lending |
||||||||||||||
|
0.00 to <0.15 |
0 |
0 |
0 |
0 |
0 |
0 |
0 |
|||||||
|
0.15 to <0.25 |
0 |
0 |
0 |
0 |
0 |
0 |
0 |
|||||||
|
0.25 to <0.50 |
0 |
0.38 |
0.0 |
45.00 |
2.5 |
0 |
70.00 |
|||||||
|
0.50 to <0.75 |
10 |
0.69 |
0.0 |
45.00 |
2.5 |
7 |
69.76 |
|||||||
|
0.75 to <2.50 |
1 |
1.23 |
0.0 |
45.00 |
2.5 |
1 |
90.00 |
|||||||
|
2.50 to <10.00 |
0 |
0 |
0 |
0 |
0 |
0 |
0 |
|||||||
|
10.00 to <100.00 |
0 |
0 |
0 |
0 |
0 |
0 |
0 |
|||||||
|
100.00 (Default) |
0 |
0 |
0 |
0 |
0 |
0 |
0 |
|||||||
|
Sub-total¹ |
11 |
0.72 |
0.0 |
45.00 |
2.5 |
8 |
71.04 |
|||||||
|
Other |
||||||||||||||
|
0.00 to <0.15 |
0 |
0 |
0 |
0 |
0 |
0 |
0 |
|||||||
|
0.15 to <0.25 |
0 |
0 |
0 |
0 |
0 |
0 |
0 |
|||||||
|
0.25 to <0.50 |
0 |
0 |
0 |
0 |
0 |
0 |
0 |
|||||||
|
0.50 to <0.75 |
0 |
0 |
0 |
0 |
0 |
0 |
0 |
|||||||
|
0.75 to <2.50 |
0 |
0 |
0 |
0 |
0 |
0 |
0 |
|||||||
|
2.50 to <10.00 |
0 |
0 |
0 |
0 |
0 |
0 |
0 |
|||||||
|
10.00 to <100.00 |
0 |
0 |
0 |
0 |
0 |
0 |
0 |
|||||||
|
100.00 (Default) |
0 |
0 |
0 |
0 |
0 |
0 |
0 |
|||||||
|
Sub-total |
0 |
0 |
0 |
0 |
0 |
0 |
0 |
|||||||
|
Total |
11 |
0.72 |
0.0 |
45.00 |
2.5 |
8 |
71.04 |
|||||||
145
|
Deutsche Bank |
||
|
Pillar 3 Report as of December 31, 2024 |
||
CCR exposures within the advanced IRBA
Article 452 (g) CRR
The following tables disclose Deutsche Bank´s advanced IRBA counterparty credit risk exposures, i.e. derivatives and securities financing transactions, distributed on its internal rating scale for exposure classes central governments and central banks, institutions as well as corporates and retail with its relevant subcategories. CVA charges or exposures cleared through a CCP are excluded.
Deutsche Bank discloses the exposure after CCF and CRM, where exposures covered by guarantees or credit derivatives are assigned to the protection seller.
The exposure after CCF and CRM is presented in conjunction with exposure-weighted average PD, LGD, and maturity as well as the RWA, the average risk weight (RW) and the number of obligors. The effect of double default, as far as applicable to exposures outside of former Postbank, is considered in the average RW. It implies that for a guaranteed exposure a loss only occurs if the primary obligor and the guarantor fail to meet their obligations at the same time. The tables provide the defaulted exposure separately, where Deutsche Bank applies an LGD estimate already incorporating potential unexpected losses in the loss rate estimate as required by Article 181 (1)(h) CRR.
146
|
Deutsche Bank |
||
|
Pillar 3 Report as of December 31, 2024 |
||
EU CCR4 – AIRB approach – CCR exposures by portfolio and PD scale
|
|
Dec 31, 2024 |
|||||||||||||
|
in € m. |
a |
b |
c |
d |
e |
f |
g |
|||||||
|
Exposure class/ |
Exposure value |
Average PD |
Number of |
Average LGD |
Average maturity |
RWA |
Density of risk weighted exposure amounts |
|||||||
|
Central governments |
||||||||||||||
|
0.00 to <0.15 |
9,750 |
0.01 |
0.1 |
56.46 |
0.8 |
139 |
1.43 |
|||||||
|
0.15 to <0.25 |
315 |
0.22 |
0.0 |
53.88 |
1.5 |
182 |
57.78 |
|||||||
|
0.25 to <0.50 |
111 |
0.36 |
0.0 |
58.32 |
4.0 |
118 |
105.97 |
|||||||
|
0.50 to <0.75 |
4 |
0.64 |
0.0 |
66.56 |
1.0 |
4 |
93.72 |
|||||||
|
0.75 to <2.50 |
53 |
1.48 |
0.0 |
66.56 |
2.3 |
85 |
160.29 |
|||||||
|
2.50 to <10.00 |
75 |
3.72 |
0.0 |
41.25 |
4.8 |
119 |
160.11 |
|||||||
|
10.00 to <100.00 |
165 |
13.49 |
0.0 |
27.49 |
1.0 |
213 |
129.03 |
|||||||
|
100.00 (Default) |
0 |
0 |
0 |
0 |
0 |
0 |
0 |
|||||||
|
Sub-total |
10,473 |
0.27 |
0.1 |
55.89 |
0.9 |
860 |
8.21 |
|||||||
|
Institutions |
||||||||||||||
|
0.00 to <0.15 |
12,823 |
0.05 |
0.3 |
45.23 |
1.1 |
2,255 |
17.59 |
|||||||
|
0.15 to <0.25 |
906 |
0.17 |
0.1 |
45.60 |
0.7 |
304 |
33.53 |
|||||||
|
0.25 to <0.50 |
365 |
0.36 |
0.1 |
32.04 |
1.5 |
187 |
51.10 |
|||||||
|
0.50 to <0.75 |
58 |
0.64 |
0.0 |
63.36 |
0.1 |
43 |
73.81 |
|||||||
|
0.75 to <2.50 |
1,823 |
0.82 |
0.0 |
22.83 |
1.0 |
905 |
49.61 |
|||||||
|
2.50 to <10.00 |
5 |
3.49 |
0.0 |
50.87 |
0.9 |
7 |
148.50 |
|||||||
|
10.00 to <100.00 |
0 |
0 |
0 |
0 |
0 |
0 |
0 |
|||||||
|
100.00 (Default) |
0 |
0 |
0 |
0 |
0 |
0 |
0 |
|||||||
|
Sub-total |
15,980 |
1.29 |
0.5 |
44.22 |
1.0 |
3,701 |
23.16 |
|||||||
|
Corporates |
||||||||||||||
|
0.00 to <0.15 |
41,296 |
0.05 |
6.4 |
19.38 |
0.9 |
3,046 |
7.38 |
|||||||
|
0.15 to <0.25 |
5,108 |
0.19 |
1.1 |
33.80 |
2.6 |
1,902 |
37.23 |
|||||||
|
0.25 to <0.50 |
4,878 |
0.35 |
1.4 |
41.94 |
1.8 |
2,838 |
58.18 |
|||||||
|
0.50 to <0.75 |
2,838 |
0.61 |
1.1 |
37.39 |
1.3 |
1,712 |
60.32 |
|||||||
|
0.75 to <2.50 |
3,047 |
1.25 |
1.4 |
35.65 |
1.9 |
2,009 |
65.94 |
|||||||
|
2.50 to <10.00 |
1,081 |
7.33 |
0.3 |
18.91 |
1.6 |
709 |
65.58 |
|||||||
|
10.00 to <100.00 |
525 |
63.00 |
0.1 |
40.50 |
2.6 |
511 |
97.39 |
|||||||
|
100.00 (Default) |
184 |
100.00 |
0.1 |
52.73 |
2.3 |
153 |
82.97 |
|||||||
|
Sub-total |
58,957 |
1.16 |
11.8 |
23.90 |
1.2 |
12,880 |
21.85 |
|||||||
|
of which: |
||||||||||||||
|
SMEs |
||||||||||||||
|
0.00 to <0.15 |
756 |
0.06 |
0.2 |
35.61 |
1.9 |
65 |
8.65 |
|||||||
|
0.15 to <0.25 |
31 |
0.20 |
0.1 |
26.79 |
3.0 |
7 |
22.87 |
|||||||
|
0.25 to <0.50 |
111 |
0.39 |
0.2 |
37.60 |
1.5 |
41 |
36.78 |
|||||||
|
0.50 to <0.75 |
270 |
0.64 |
0.1 |
32.13 |
0.8 |
99 |
36.78 |
|||||||
|
0.75 to <2.50 |
491 |
1.43 |
0.2 |
25.54 |
1.4 |
210 |
42.68 |
|||||||
|
2.50 to <10.00 |
25 |
3.16 |
0.1 |
62.46 |
6.3 |
32 |
128.38 |
|||||||
|
10.00 to <100.00 |
36 |
97.01 |
0.0 |
30.71 |
1.5 |
14 |
38.88 |
|||||||
|
100.00 (Default) |
7 |
100.00 |
0.0 |
58.70 |
3.8 |
5 |
78.59 |
|||||||
|
Sub-total |
1,726 |
2.99 |
1.1 |
36.82 |
1.6 |
473 |
27.41 |
|||||||
|
Specialized Lending |
||||||||||||||
|
0.00 to <0.15 |
4 |
0.10 |
0.0 |
17.28 |
2.3 |
0 |
8.55 |
|||||||
|
0.15 to <0.25 |
0 |
0.18 |
0.0 |
68.58 |
1.8 |
0 |
43.37 |
|||||||
|
0.25 to <0.50 |
71 |
0.42 |
0.0 |
21.96 |
2.4 |
24 |
33.44 |
|||||||
|
0.50 to <0.75 |
62 |
0.71 |
0.0 |
15.46 |
3.6 |
22 |
35.03 |
|||||||
|
0.75 to <2.50 |
214 |
1.50 |
0.1 |
18.01 |
2.6 |
84 |
39.35 |
|||||||
|
2.50 to <10.00 |
164 |
6.57 |
0.1 |
18.72 |
3.8 |
119 |
72.70 |
|||||||
|
10.00 to <100.00 |
19 |
44.53 |
0.0 |
15.61 |
3.6 |
14 |
75.63 |
|||||||
|
100.00 (Default) |
57 |
100.00 |
0.0 |
83.29 |
4.1 |
27 |
48.11 |
|||||||
|
Sub-total |
591 |
13.53 |
0.2 |
24.65 |
3.2 |
291 |
49.23 |
|||||||
|
Other |
||||||||||||||
|
0.00 to <0.15 |
40,536 |
0.05 |
6.2 |
19.08 |
0.8 |
2,981 |
7.35 |
|||||||
|
0.15 to <0.25 |
5,076 |
0.19 |
0.9 |
33.84 |
2.6 |
1,894 |
37.32 |
|||||||
|
0.25 to <0.50 |
4,696 |
0.35 |
1.2 |
42.34 |
1.8 |
2,773 |
59.06 |
|||||||
|
0.50 to <0.75 |
2,506 |
0.61 |
0.9 |
38.50 |
1.3 |
1,591 |
63.49 |
|||||||
|
0.75 to <2.50 |
2,342 |
1.19 |
1.0 |
39.38 |
1.9 |
1,716 |
73.24 |
|||||||
|
2.50 to <10.00 |
892 |
7.58 |
0.2 |
17.73 |
1.1 |
558 |
62.53 |
|||||||
|
10.00 to <100.00 |
471 |
61.16 |
0.0 |
42.21 |
2.7 |
483 |
102.66 |
|||||||
|
100.00 (Default) |
121 |
100.00 |
0.0 |
37.97 |
1.4 |
120 |
99.68 |
|||||||
|
Sub-total |
56,640 |
0.97 |
10.5 |
23.50 |
1.2 |
12,116 |
21.39 |
|||||||
|
Retail |
||||||||||||||
147
|
Deutsche Bank |
||
|
Pillar 3 Report as of December 31, 2024 |
||
|
|
Dec 31, 2024 |
|||||||||||||
|
in € m. |
a |
b |
c |
d |
e |
f |
g |
|||||||
|
Exposure class/ |
Exposure value |
Average PD |
Number of |
Average LGD |
Average maturity |
RWA |
Density of risk weighted exposure amounts |
|||||||
|
0.00 to <0.15 |
5 |
0.06 |
0.2 |
18.20 |
- |
0 |
3.37 |
|||||||
|
0.15 to <0.25 |
1 |
0.21 |
0.1 |
46.57 |
- |
0 |
19.56 |
|||||||
|
0.25 to <0.50 |
2 |
0.37 |
0.1 |
36.10 |
- |
0 |
22.21 |
|||||||
|
0.50 to <0.75 |
1 |
0.57 |
0.0 |
43.29 |
- |
0 |
34.31 |
|||||||
|
0.75 to <2.50 |
1 |
1.30 |
0.1 |
43.35 |
- |
1 |
47.84 |
|||||||
|
2.50 to <10.00 |
0 |
4.05 |
0.0 |
59.60 |
- |
0 |
73.17 |
|||||||
|
10.00 to <100.00 |
0 |
11.24 |
0.0 |
43.42 |
- |
0 |
80.39 |
|||||||
|
100.00 (Default) |
0 |
100.00 |
0.0 |
84.48 |
- |
0 |
95.23 |
|||||||
|
Sub-total |
11 |
1.75 |
0.4 |
32.53 |
- |
2 |
20.55 |
|||||||
|
of which: |
||||||||||||||
|
Secured by real estate property SMEs |
||||||||||||||
|
0.00 to <0.15 |
0 |
0 |
0 |
0 |
- |
0 |
0 |
|||||||
|
0.15 to <0.25 |
0 |
0 |
0 |
0 |
- |
0 |
0 |
|||||||
|
0.25 to <0.50 |
0 |
0 |
0 |
0 |
- |
0 |
0 |
|||||||
|
0.50 to <0.75 |
0 |
0 |
0 |
0 |
- |
0 |
0 |
|||||||
|
0.75 to <2.50 |
0 |
0 |
0 |
0 |
- |
0 |
0 |
|||||||
|
2.50 to <10.00 |
0 |
0 |
0 |
0 |
- |
0 |
0 |
|||||||
|
10.00 to <100.00 |
0 |
0 |
0 |
0 |
- |
0 |
0 |
|||||||
|
100.00 (Default) |
0 |
0 |
0 |
0 |
- |
0 |
0 |
|||||||
|
Sub-total |
0 |
0 |
0 |
0 |
- |
0 |
0 |
|||||||
|
Secured by real estate property non-SMEs |
||||||||||||||
|
0.00 to <0.15 |
0 |
0 |
0 |
0 |
- |
0 |
0 |
|||||||
|
0.15 to <0.25 |
0 |
0 |
0 |
0 |
- |
0 |
0 |
|||||||
|
0.25 to <0.50 |
0 |
0 |
0 |
0 |
- |
0 |
0 |
|||||||
|
0.50 to <0.75 |
0 |
0 |
0 |
0 |
- |
0 |
0 |
|||||||
|
0.75 to <2.50 |
0 |
0 |
0 |
0 |
- |
0 |
0 |
|||||||
|
2.50 to <10.00 |
0 |
0 |
0 |
0 |
- |
0 |
0 |
|||||||
|
10.00 to <100.00 |
0 |
0 |
0 |
0 |
- |
0 |
0 |
|||||||
|
100.00 (Default) |
0 |
0 |
0 |
0 |
- |
0 |
0 |
|||||||
|
Sub-total |
0 |
0 |
0 |
0 |
- |
0 |
0 |
|||||||
|
Qualifying Revolving |
||||||||||||||
|
0.00 to <0.15 |
0 |
0 |
0 |
0 |
- |
0 |
0 |
|||||||
|
0.15 to <0.25 |
0 |
0 |
0 |
0 |
- |
0 |
0 |
|||||||
|
0.25 to <0.50 |
0 |
0 |
0 |
0 |
- |
0 |
0 |
|||||||
|
0.50 to <0.75 |
0 |
0 |
0 |
0 |
- |
0 |
0 |
|||||||
|
0.75 to <2.50 |
0 |
0 |
0 |
0 |
- |
0 |
0 |
|||||||
|
2.50 to <10.00 |
0 |
0 |
0 |
0 |
- |
0 |
0 |
|||||||
|
10.00 to <100.00 |
0 |
0 |
0 |
0 |
- |
0 |
0 |
|||||||
|
100.00 (Default) |
0 |
0 |
0 |
0 |
- |
0 |
0 |
|||||||
|
Sub-total |
0 |
0 |
0 |
0 |
- |
0 |
0 |
|||||||
|
Other retail SMEs |
||||||||||||||
|
0.00 to <0.15 |
1 |
0.06 |
0.0 |
36.33 |
- |
0 |
5.97 |
|||||||
|
0.15 to <0.25 |
0 |
0.20 |
0.0 |
48.62 |
- |
0 |
17.43 |
|||||||
|
0.25 to <0.50 |
1 |
0.37 |
0.0 |
54.04 |
- |
0 |
28.41 |
|||||||
|
0.50 to <0.75 |
0 |
0.69 |
0.0 |
64.11 |
- |
0 |
44.14 |
|||||||
|
0.75 to <2.50 |
0 |
1.25 |
0.0 |
50.19 |
- |
0 |
45.24 |
|||||||
|
2.50 to <10.00 |
0 |
4.07 |
0.0 |
65.08 |
- |
0 |
75.55 |
|||||||
|
10.00 to <100.00 |
0 |
13.95 |
0.0 |
61.36 |
- |
0 |
94.54 |
|||||||
|
100.00 (Default) |
0 |
100.00 |
0.0 |
99.60 |
- |
0 |
81.08 |
|||||||
|
Sub-total |
2 |
5.46 |
0.1 |
52.38 |
- |
1 |
32.02 |
|||||||
|
Other retail non-SMEs |
||||||||||||||
|
0.00 to <0.15 |
4 |
0.06 |
0.2 |
15.84 |
- |
0 |
3.03 |
|||||||
148
|
Deutsche Bank |
||
|
Pillar 3 Report as of December 31, 2024 |
||
|
|
Dec 31, 2024 |
|||||||||||||
|
in € m. |
a |
b |
c |
d |
e |
f |
g |
|||||||
|
Exposure class/ |
Exposure value |
Average PD |
Number of |
Average LGD |
Average maturity |
RWA |
Density of risk weighted exposure amounts |
|||||||
|
0.15 to <0.25 |
1 |
0.21 |
0.0 |
45.41 |
- |
0 |
20.76 |
|||||||
|
0.25 to <0.50 |
1 |
0.38 |
0.1 |
29.50 |
- |
0 |
19.93 |
|||||||
|
0.50 to <0.75 |
1 |
0.55 |
0.0 |
40.00 |
- |
0 |
32.76 |
|||||||
|
0.75 to <2.50 |
1 |
1.31 |
0.1 |
41.34 |
- |
0 |
48.60 |
|||||||
|
2.50 to <10.00 |
0 |
3.96 |
0.0 |
43.19 |
- |
0 |
66.05 |
|||||||
|
10.00 to <100.00 |
0 |
11.24 |
0.0 |
43.42 |
- |
0 |
80.38 |
|||||||
|
100.00 (Default) |
0 |
100.00 |
0.0 |
17.20 |
- |
0 |
158.21 |
|||||||
|
Sub-total |
8 |
0.71 |
0.4 |
26.91 |
- |
1 |
17.29 |
|||||||
|
Total (all exposure classes) |
85,421 |
1.07 |
12.8 |
31.63 |
1.1 |
17,443 |
20.42 |
|||||||
149
|
Deutsche Bank |
||
|
Pillar 3 Report as of December 31, 2024 |
||
|
|
Jun 30, 2024 |
|||||||||||||
|
in € m. |
a |
b |
c |
d |
e |
f |
g |
|||||||
|
Exposure class/ |
Exposure value |
Average PD |
Number of |
Average LGD |
Average maturity |
RWA |
Average RW |
|||||||
|
Central governments |
||||||||||||||
|
0.00 to <0.15 |
12,332 |
0.01 |
0.1 |
52.12 |
0.6 |
185 |
1.50 |
|||||||
|
0.15 to <0.25 |
128 |
0.20 |
0.0 |
50.71 |
2.7 |
105 |
82.53 |
|||||||
|
0.25 to <0.50 |
127 |
0.38 |
0.0 |
59.47 |
4.1 |
138 |
108.91 |
|||||||
|
0.50 to <0.75 |
7 |
0.64 |
0.0 |
66.56 |
1.2 |
7 |
96.29 |
|||||||
|
0.75 to <2.50 |
106 |
1.76 |
0.0 |
66.56 |
1.5 |
162 |
152.66 |
|||||||
|
2.50 to <10.00 |
691 |
4.70 |
0.0 |
15.89 |
0.8 |
349 |
50.50 |
|||||||
|
10.00 to <100.00 |
136 |
22.01 |
0.0 |
30.26 |
1.0 |
208 |
152.80 |
|||||||
|
100.00 (Default) |
0 |
0 |
0 |
0 |
0 |
0 |
0 |
|||||||
|
Sub-total |
13,528 |
0.49 |
0.1 |
50.23 |
0.7 |
1,155 |
8.54 |
|||||||
|
|
||||||||||||||
|
Institutions |
||||||||||||||
|
0.00 to <0.15 |
13,613 |
0.06 |
0.3 |
31.79 |
0.9 |
1,900 |
13.96 |
|||||||
|
0.15 to <0.25 |
1,289 |
0.18 |
0.1 |
40.49 |
0.9 |
446 |
34.62 |
|||||||
|
0.25 to <0.50 |
331 |
0.34 |
0.1 |
39.61 |
1.7 |
171 |
51.67 |
|||||||
|
0.50 to <0.75 |
1,063 |
0.64 |
0.0 |
15.42 |
1.0 |
369 |
34.74 |
|||||||
|
0.75 to <2.50 |
352 |
1.51 |
0.0 |
15.99 |
0.6 |
251 |
71.49 |
|||||||
|
2.50 to <10.00 |
12 |
3.45 |
0.0 |
36.03 |
2.3 |
12 |
95.07 |
|||||||
|
10.00 to <100.00 |
0 |
0 |
0 |
0 |
0 |
0 |
0 |
|||||||
|
100.00 (Default) |
0 |
0 |
0 |
0 |
0 |
0 |
0 |
|||||||
|
Sub-total |
16,659 |
0.14 |
0.5 |
31.24 |
0.9 |
3,150 |
18.91 |
|||||||
|
|
||||||||||||||
|
Corporates |
||||||||||||||
|
0.00 to <0.15 |
44,794 |
0.04 |
6.7 |
16.56 |
0.8 |
2,488 |
5.55 |
|||||||
|
0.15 to <0.25 |
4,532 |
0.19 |
1.1 |
38.39 |
2.7 |
1,953 |
43.09 |
|||||||
|
0.25 to <0.50 |
4,102 |
0.35 |
1.4 |
38.63 |
2.0 |
2,301 |
56.10 |
|||||||
|
0.50 to <0.75 |
3,699 |
0.61 |
1.2 |
33.34 |
1.5 |
2,218 |
59.95 |
|||||||
|
0.75 to <2.50 |
3,065 |
1.39 |
1.4 |
35.09 |
1.9 |
2,311 |
75.39 |
|||||||
|
2.50 to <10.00 |
1,606 |
5.67 |
0.4 |
19.46 |
1.6 |
997 |
62.07 |
|||||||
|
10.00 to <100.00 |
237 |
27.86 |
0.1 |
36.61 |
2.2 |
347 |
146.33 |
|||||||
|
100.00 (Default) |
31 |
100.00 |
0.0 |
39.51 |
3.4 |
31 |
98.79 |
|||||||
|
Sub-total |
62,068 |
0.46 |
12.3 |
21.59 |
1.1 |
12,646 |
20.37 |
|||||||
|
of which: |
|
|||||||||||||
|
SMEs |
||||||||||||||
|
0.00 to <0.15 |
5,942 |
0.04 |
0.2 |
12.06 |
0.2 |
93 |
1.57 |
|||||||
|
0.15 to <0.25 |
94 |
0.21 |
0.1 |
44.72 |
1.1 |
25 |
26.31 |
|||||||
|
0.25 to <0.50 |
187 |
0.36 |
0.2 |
65.37 |
1.0 |
94 |
50.43 |
|||||||
|
0.50 to <0.75 |
429 |
0.64 |
0.2 |
33.53 |
0.4 |
158 |
36.87 |
|||||||
|
0.75 to <2.50 |
376 |
1.55 |
0.3 |
48.26 |
1.7 |
187 |
49.65 |
|||||||
|
2.50 to <10.00 |
90 |
5.70 |
0.1 |
45.20 |
1.1 |
115 |
128.07 |
|||||||
|
10.00 to <100.00 |
1 |
83.15 |
0.0 |
78.97 |
1.4 |
0 |
48.27 |
|||||||
|
100.00 (Default) |
4 |
100.00 |
0.0 |
48.32 |
1.3 |
6 |
150.48 |
|||||||
|
Sub-total |
7,122 |
0.30 |
1.1 |
17.54 |
0.4 |
678 |
9.53 |
|||||||
|
Specialized Lending |
||||||||||||||
|
0.00 to <0.15 |
5 |
0.09 |
0.0 |
17.78 |
3.0 |
1 |
9.81 |
|||||||
|
0.15 to <0.25 |
5 |
0.24 |
0.0 |
18.30 |
2.8 |
1 |
21.64 |
|||||||
|
0.25 to <0.50 |
48 |
0.45 |
0.0 |
19.60 |
3.5 |
17 |
35.87 |
|||||||
|
0.50 to <0.75 |
40 |
0.68 |
0.0 |
16.05 |
4.1 |
16 |
38.77 |
|||||||
|
0.75 to <2.50 |
251 |
1.44 |
0.1 |
14.14 |
3.1 |
78 |
30.97 |
|||||||
|
2.50 to <10.00 |
183 |
5.47 |
0.1 |
34.71 |
4.0 |
194 |
106.10 |
|||||||
|
10.00 to <100.00 |
9 |
53.86 |
0.0 |
16.80 |
4.9 |
8 |
86.37 |
|||||||
|
100.00 (Default) |
12 |
100.00 |
0.0 |
17.78 |
5.0 |
7 |
59.22 |
|||||||
|
Sub-total |
552 |
5.60 |
0.2 |
21.76 |
3.6 |
321 |
58.09 |
|||||||
|
Other |
||||||||||||||
|
0.00 to <0.15 |
38,847 |
0.05 |
6.5 |
17.24 |
0.9 |
2,394 |
6.16 |
|||||||
|
0.15 to <0.25 |
4,433 |
0.19 |
1.0 |
38.28 |
2.8 |
1,927 |
43.47 |
|||||||
|
0.25 to <0.50 |
3,868 |
0.35 |
1.1 |
37.58 |
2.1 |
2,190 |
56.62 |
|||||||
|
0.50 to <0.75 |
3,230 |
0.60 |
1.0 |
33.53 |
1.7 |
2,044 |
63.28 |
|||||||
|
0.75 to <2.50 |
2,439 |
1.36 |
1.1 |
35.22 |
1.8 |
2,047 |
83.92 |
|||||||
|
2.50 to <10.00 |
1,333 |
5.70 |
0.2 |
15.64 |
1.3 |
687 |
51.57 |
|||||||
|
10.00 to <100.00 |
228 |
26.70 |
0.0 |
37.28 |
2.1 |
339 |
148.95 |
|||||||
|
100.00 (Default) |
15 |
100.00 |
0.0 |
54.21 |
2.8 |
18 |
116.21 |
|||||||
|
Sub-total |
54,394 |
0.43 |
11.0 |
22.12 |
1.2 |
11,647 |
21.41 |
|||||||
|
|
||||||||||||||
150
|
Deutsche Bank |
||
|
Pillar 3 Report as of December 31, 2024 |
||
|
|
Jun 30, 2024 |
|||||||||||||
|
in € m. |
a |
b |
c |
d |
e |
f |
g |
|||||||
|
Exposure class/ |
Exposure value |
Average PD |
Number of |
Average LGD |
Average maturity |
RWA |
Average RW |
|||||||
|
Retail |
||||||||||||||
|
0.00 to <0.15 |
5 |
0.08 |
0.2 |
18.34 |
- |
0 |
4.22 |
|||||||
|
0.15 to <0.25 |
1 |
0.19 |
0.1 |
27.80 |
- |
0 |
11.25 |
|||||||
|
0.25 to <0.50 |
2 |
0.35 |
0.1 |
49.37 |
- |
0 |
29.85 |
|||||||
|
0.50 to <0.75 |
2 |
0.56 |
0.1 |
49.62 |
- |
1 |
36.26 |
|||||||
|
0.75 to <2.50 |
4 |
1.47 |
0.1 |
68.70 |
- |
3 |
73.82 |
|||||||
|
2.50 to <10.00 |
1 |
4.90 |
0.0 |
79.58 |
- |
1 |
102.31 |
|||||||
|
10.00 to <100.00 |
0 |
35.33 |
0.0 |
80.44 |
- |
0 |
89.36 |
|||||||
|
100.00 (Default) |
0 |
100.00 |
0.0 |
16.50 |
- |
1 |
206.25 |
|||||||
|
Sub-total |
15 |
4.18 |
0.6 |
43.88 |
- |
6 |
42.39 |
|||||||
|
of which: |
|
|||||||||||||
|
Secured by real estate property SMEs |
||||||||||||||
|
0.00 to <0.15 |
0 |
0 |
0 |
0 |
- |
0 |
0 |
|||||||
|
0.15 to <0.25 |
0 |
0 |
0 |
0 |
- |
0 |
0 |
|||||||
|
0.25 to <0.50 |
0 |
0 |
0 |
0 |
- |
0 |
0 |
|||||||
|
0.50 to <0.75 |
0 |
0 |
0 |
0 |
- |
0 |
0 |
|||||||
|
0.75 to <2.50 |
0 |
0 |
0 |
0 |
- |
0 |
0 |
|||||||
|
2.50 to <10.00 |
0 |
0 |
0 |
0 |
- |
0 |
0 |
|||||||
|
10.00 to <100.00 |
0 |
0 |
0 |
0 |
- |
0 |
0 |
|||||||
|
100.00 (Default) |
0 |
0 |
0 |
0 |
- |
0 |
0 |
|||||||
|
Sub-total |
0 |
0 |
0 |
0 |
- |
0 |
0 |
|||||||
|
Secured by real estate property non-SMEs |
||||||||||||||
|
0.00 to <0.15 |
0 |
0 |
0 |
0 |
- |
0 |
0 |
|||||||
|
0.15 to <0.25 |
0 |
0 |
0 |
0 |
- |
0 |
0 |
|||||||
|
0.25 to <0.50 |
0 |
0 |
0 |
0 |
- |
0 |
0 |
|||||||
|
0.50 to <0.75 |
0 |
0 |
0 |
0 |
- |
0 |
0 |
|||||||
|
0.75 to <2.50 |
0 |
0 |
0 |
0 |
- |
0 |
0 |
|||||||
|
2.50 to <10.00 |
0 |
0 |
0 |
0 |
- |
0 |
0 |
|||||||
|
10.00 to <100.00 |
0 |
0 |
0 |
0 |
- |
0 |
0 |
|||||||
|
100.00 (Default) |
0 |
0 |
0 |
0 |
- |
0 |
0 |
|||||||
|
Sub-total |
0 |
0 |
0 |
0 |
- |
0 |
0 |
|||||||
|
Qualifying Revolving |
||||||||||||||
|
0.00 to <0.15 |
0 |
0 |
0 |
0 |
- |
0 |
0 |
|||||||
|
0.15 to <0.25 |
0 |
0 |
0 |
0 |
- |
0 |
0 |
|||||||
|
0.25 to <0.50 |
0 |
0 |
0 |
0 |
- |
0 |
0 |
|||||||
|
0.50 to <0.75 |
0 |
0 |
0 |
0 |
- |
0 |
0 |
|||||||
|
0.75 to <2.50 |
0 |
0 |
0 |
0 |
- |
0 |
0 |
|||||||
|
2.50 to <10.00 |
0 |
0 |
0 |
0 |
- |
0 |
0 |
|||||||
|
10.00 to <100.00 |
0 |
0 |
0 |
0 |
- |
0 |
0 |
|||||||
|
100.00 (Default) |
0 |
0 |
0 |
0 |
- |
0 |
0 |
|||||||
|
Sub-total |
0 |
0 |
0 |
0 |
- |
0 |
0 |
|||||||
|
Other retail SMEs |
||||||||||||||
|
0.00 to <0.15 |
0 |
0.07 |
0.0 |
32.60 |
- |
0 |
5.53 |
|||||||
|
0.15 to <0.25 |
0 |
0.19 |
0.0 |
37.12 |
- |
0 |
11.57 |
|||||||
|
0.25 to <0.50 |
0 |
0.38 |
0.0 |
68.84 |
- |
0 |
34.08 |
|||||||
|
0.50 to <0.75 |
1 |
0.59 |
0.0 |
64.66 |
- |
0 |
41.66 |
|||||||
|
0.75 to <2.50 |
2 |
1.48 |
0.0 |
76.83 |
- |
1 |
74.31 |
|||||||
|
2.50 to <10.00 |
1 |
4.49 |
0.0 |
82.48 |
- |
1 |
96.68 |
|||||||
|
10.00 to <100.00 |
0 |
36.72 |
0.0 |
82.45 |
- |
0 |
89.69 |
|||||||
|
100.00 (Default) |
0 |
100.00 |
0.0 |
16.50 |
- |
1 |
206.25 |
|||||||
|
Sub-total |
4 |
12.97 |
0.1 |
68.91 |
- |
4 |
82.04 |
|||||||
|
Other retail non-SMEs |
||||||||||||||
|
0.00 to <0.15 |
5 |
0.08 |
0.2 |
17.94 |
- |
0 |
4.19 |
|||||||
|
0.15 to <0.25 |
1 |
0.19 |
0.0 |
27.35 |
- |
0 |
11.24 |
|||||||
|
0.25 to <0.50 |
1 |
0.34 |
0.1 |
46.03 |
- |
0 |
29.12 |
|||||||
|
0.50 to <0.75 |
1 |
0.54 |
0.0 |
40.69 |
- |
0 |
33.06 |
|||||||
|
0.75 to <2.50 |
2 |
1.46 |
0.1 |
60.74 |
- |
1 |
73.34 |
|||||||
|
2.50 to <10.00 |
0 |
5.91 |
0.0 |
72.36 |
- |
0 |
116.25 |
|||||||
|
10.00 to <100.00 |
0 |
11.16 |
0.0 |
45.20 |
- |
0 |
83.63 |
|||||||
|
100.00 (Default) |
0 |
100.00 |
0.0 |
5.00 |
- |
0 |
62.50 |
|||||||
|
Sub-total |
11 |
0.61 |
0.4 |
33.72 |
- |
3 |
26.30 |
|||||||
|
|
||||||||||||||
|
Total (all exposure classes) |
92,270 |
0.41 |
13.4 |
27.54 |
1.0 |
16,957 |
18.38 |
|||||||
151
|
Deutsche Bank |
||
|
Pillar 3 Report as of December 31, 2024 |
||
CCR exposures after credit risk mitigation
Article 439 (e) CRR
The following table presents information on Deutsche Bank´s counterparty credit risk (CCR) exposure and the composition of collateral used in both derivatives transactions and securities financing transactions (SFTs).
Table EU CCR5 discloses a breakdown of all types of collateral posted or received to support or reduce CCR exposures related to derivatives and SFTs. For SFTs, collateral (received or posted) refers to the security leg of the transaction as well as initial and variation margin.
EU CCR5 – Composition of collateral for exposures to CCR
|
|
Dec 31, 2024 |
|||||||||||||||||
|
a |
b |
c |
d |
e |
f |
g |
h |
|||||||||||
|
Collateral used in derivative transactions |
Collateral used in SFTs |
|||||||||||||||||
|
Fair value of collateral received |
Fair value of posted collateral |
Fair value of collateral received |
Fair value of posted collateral |
|||||||||||||||
|
in € m. |
Segregated |
Unsegregated |
Segregated |
Unsegregated |
Segregated |
Unsegregated |
Segregated |
Unsegregated |
||||||||||
|
1 |
Cash – domestic currency |
2,511 |
30,187 |
2,409 |
25,793 |
0 |
0 |
0 |
0 |
|||||||||
|
2 |
Cash – other currencies |
6,658 |
40,097 |
69 |
2,485 |
0 |
1 |
0 |
0 |
|||||||||
|
3 |
Domestic sovereign debt |
110 |
233 |
0 |
1,772 |
46 |
25,767 |
44 |
25,959 |
|||||||||
|
4 |
Other Sovereign debt |
0 |
0 |
0 |
25 |
1,344 |
350,283 |
1,617 |
298,903 |
|||||||||
|
5 |
Government agency debt |
0 |
0 |
0 |
0 |
1 |
2,913 |
0 |
4,762 |
|||||||||
|
6 |
Corporate bonds |
2,476 |
23,989 |
220 |
4,802 |
517 |
62,984 |
71 |
29,605 |
|||||||||
|
7 |
Equity securities |
83 |
1,696 |
0 |
0 |
0 |
541 |
0 |
9,334 |
|||||||||
|
8 |
Other collateral |
242 |
4,884 |
7,356 |
33,921 |
757 |
78,092 |
458 |
40,735 |
|||||||||
|
9 |
Total |
12,080 |
101,086 |
10,054 |
68,799 |
2,665 |
520,580 |
2,191 |
409,298 |
|||||||||
|
|
Jun 30, 2024¹ |
|||||||||||||||||
|
a |
b |
c |
d |
e |
f |
g |
h |
|||||||||||
|
Collateral used in derivative transactions |
Collateral used in SFTs |
|||||||||||||||||
|
Fair value of collateral received |
Fair value of posted collateral |
Fair value of collateral received |
Fair value of posted collateral |
|||||||||||||||
|
in € m. |
Segregated |
Unsegregated |
Segregated |
Unsegregated |
Segregated |
Unsegregated |
Segregated |
Unsegregated |
||||||||||
|
1 |
Cash – domestic currency |
2,569 |
29,363 |
3 |
26,140 |
0 |
1 |
0 |
22 |
|||||||||
|
2 |
Cash – other currencies |
5,780 |
35,849 |
14 |
24,252 |
0 |
5 |
0 |
2 |
|||||||||
|
3 |
Domestic sovereign debt |
101 |
176 |
0 |
1,520 |
40 |
22,998 |
45 |
23,617 |
|||||||||
|
4 |
Other Sovereign debt |
0 |
0 |
0 |
3 |
901 |
278,912 |
1,423 |
258,667 |
|||||||||
|
5 |
Government agency debt |
0 |
0 |
0 |
0 |
0 |
5,369 |
0 |
1,932 |
|||||||||
|
6 |
Corporate bonds |
2,924 |
22,266 |
200 |
4,047 |
397 |
49,948 |
68 |
27,341 |
|||||||||
|
7 |
Equity securities |
0 |
1,654 |
0 |
0 |
0 |
440 |
0 |
7,424 |
|||||||||
|
8 |
Other collateral |
507 |
3,181 |
9,326 |
6,938 |
484 |
66,093 |
358 |
28,902 |
|||||||||
|
9 |
Total |
11,880 |
92,489 |
9,543 |
62,901 |
1,822 |
423,766 |
1,894 |
347,906 |
|||||||||
1 Comparatives aligned to current presentation
Credit derivatives exposures
Article 439 (j) CRR
The table below discloses the exposure of the credit derivative transactions split into protection bought and sold, as well as a split into product types.
EU CCR6 – Credit derivatives exposures
|
|
Dec 31, 2024 |
Jun 30, 2024 |
|||||||||
|
a |
b |
a |
b |
||||||||
|
in € m. |
Protection bought |
Protection sold |
Protection bought |
Protection sold |
|||||||
|
Notionals |
|||||||||||
|
1 |
Single-name credit default swaps |
154,957 |
140,009 |
148,605 |
134,597 |
||||||
|
2 |
Index credit default swaps |
441,517 |
432,502 |
438,182 |
431,115 |
||||||
|
3 |
Total return swaps |
28,445 |
3,884 |
27,894 |
4,817 |
||||||
|
4 |
Credit options |
26,748 |
24,107 |
32,073 |
26,278 |
||||||
|
5 |
Other credit derivatives |
0 |
0 |
0 |
0 |
||||||
|
6 |
Total notionals |
651,668 |
600,502 |
646,754 |
596,808 |
||||||
|
Fair values |
|||||||||||
|
7 |
Positive fair value (asset) |
3,249 |
12,226 |
3,117 |
11,026 |
||||||
|
8 |
Negative fair value (liability) |
(12,312) |
(1,971) |
(11,013) |
(2,139) |
||||||
152
|
Deutsche Bank |
||
|
Pillar 3 Report as of December 31, 2024 |
||
Deutsche Bank´s total notionals for credit derivative exposures were € 1,252.2 billion as of December 31, 2024, an increase of € 8.6 billion from June 30, 2024, which was predominately driven by single-name credit default swaps and index credit default swaps, partly offset by credit options.
Exposure to securitization positions
Objectives in relation to securitization activity
Article 449 (a) CRR (EU SECA)
Deutsche Bank engages in various business activities that use securitization structures. The main purposes are to provide investor clients with access to risk and returns related to specific portfolios of assets, to provide borrowing clients with access to funding and to manage its own credit risk exposure. In order to achieve its business objectives, Deutsche Bank acts as originator, sponsor and investor in the securitization markets.
Article 4(1)(61) CRR defines which types of transactions and positions must be classified as securitization transactions and securitization positions for regulatory reporting.
Securitization transactions are defined as transactions in which the credit risk of a securitized portfolio is divided into at least two securitization tranches and where the payments to the holders of the tranches depend on the performance of the securitized portfolio. The different tranches are in a subordinate relationship that determines the order and the amount of payments or losses assigned to the holders of the tranches (waterfall). Loss allocations to a junior tranche will not already lead to a termination of the entire securitization transaction, i.e., senior tranches survive loss allocations to subordinate tranches.
Securitization positions can be acquired in various forms including investments in securitization tranches, and derivative transactions for hedging interest rate and currency risks in the securitization trust.
In the banking book, Deutsche Bank acts as originator, sponsor and investor. As an originator the Group uses securitizations primarily as a strategy to reduce credit risk, mainly through the Strategic Corporate Lending. Strategic Corporate Lending uses, among other means, synthetic securitizations to manage the credit risk of loans and lending-related commitments of the Institutional Corporate Credit portfolio (primarily unsecured, investment grade corporates), Leveraged Debt Capital Markets portfolio (primarily secured, non-investment grade corporates) and the Corporate Bank Cash Lending MidCap portfolio, primarily domiciled in Germany and the Netherlands. In addition, the Corporate Bank, through the Global Transaction Banking division, also manages some of its risk on trade finance exposures separately through synthetic securitizations. For all of the above portfolios, the credit risk is predominantly transferred to counterparties through synthetic securitizations, which may be in form of a simple transparent and standardized securitization (Article 18 of Regulation (EU) 2017/2402)), principally through the issuance of credit linked notes providing first loss protection.
Additionally, on a limited basis Deutsche Bank has entered into securitization transactions as part of an active liquidity risk management strategy. These transactions do not transfer credit risk and are therefore not included in the quantitative part of this section.
Within its existing role as sponsor, the Group continues to establish and manage securitization schemes in which special purpose entities purchase exposures from third-party entities on behalf of investors. In these transactions, the Group has substantial influence on the selection of the purchased exposures and ultimate composition of the securitized portfolios.
Furthermore, Deutsche Bank acts as an investor in third party securitizations through the purchase of tranches from third party-issued securitizations including simple transparent and standardized securitizations , or by providing liquidity, credit support or other form of financing. Additionally, the Group assists third party securitizations by providing derivatives related to securitization structures. These include currency, interest rate and credit derivatives.
Primary recourse for securitization exposures lies with the underlying assets. The related risk is mitigated by credit enhancement typically in the form of overcollateralization, subordination, reserve accounts, excess interest, or other support arrangements. Additional protection features include performance triggers, financial covenants and events of default stipulated in the legal documentation which, when breached, provide for the acceleration of repayment, rights of foreclosure and/or other remediation.
The initial due diligence for new banking book exposures usually includes any or all of the following: (a) the review and negotiation of financing terms, the relevant documents, which may include term sheets, servicer reports or other historical performance data, third-party assessment reports such as rating agency analysis (if externally rated), etc., (b) modeling of base and downside scenarios through asset-class specific cash-flow models, (c) originator and servicer reviews to assess the robustness of the originators and servicer’s underwriting’s standards, processes and financial strength. The result of this due diligence is summarized in a credit and rating review which requires approval by appropriate level of credit authority, depending on the size of exposure and internal rating assigned.
153
|
Deutsche Bank |
||
|
Pillar 3 Report as of December 31, 2024 |
||
In compliance with the regulatory requirements for risk retention, due diligence and monitoring according to the applicable regulatory requirements is part of the Group’s initial and ongoing credit review process and the relevant data is gathered for reporting purposes with the support of the IT systems used for the credit review and financial reporting process.
Ongoing regular performance reviews include checks of the periodic servicer reports against any performance triggers/covenants in the loan documentation, as well as the overall performance trend in the context of economic, geographic, sector and servicer developments.
For lending-related commitments an internal rating review is required at least annually. Significant negative or positive changes in asset performance can trigger an earlier review date. Full credit reviews are also required annually, or, for highly rated exposures, every other year. Furthermore, there is a separate, usually quarterly, watch list process for exposures identified to be at a higher risk of loss, which requires a separate assessment of asset and servicer performance. It includes a review of the exposure strategy and identifies next steps to be taken to mitigate loss potential.
Evaluation of operational risk is another important component of risk management for securitization, focusing on the various types of protections of a securitization as defined in the legal documentation (i.e., perfection of security interest, segregation of payment flows, and rights to audit). The evaluation for each securitization is performed by a dedicated team who engages third-party auditors, determines audit scopes, and reviews the results of such external audits. The results of these risk reviews and assessments complement the credit and rating review process performed by Credit Risk Management.
In the trading book, Deutsche Bank acts as originator, sponsor and investor. In the role of investor, its main objective is to serve as a market maker in the secondary market. The market making function consists of providing liquidity for its customers and providing two way markets (buy and sell) to generate flow trading revenues. In the role of originator, the Group finances loans to be securitized, predominantly in the commercial real estate business. Trading book activities where the Group has the role of a sponsor (excluding activities derived from multi-seller originator transactions) as described above are minimal.
Its Market Risk Management Governance Framework applies to all securitization positions held within the trading book. The Risk Governance Framework applied to securitization includes policies and procedures with respect to new product approvals, new transaction approvals, risk models and measurements, as well as inventory management systems and trade entry. All securitization positions held within the trading book are captured, reported and limited within the Risk Governance Framework at the global, regional and product levels. Any changes in credit and market risks are also reported.
The limit structure includes value-at-risk and product specific thresholds. Asset class market value limits are based on seniority/rating and liquidity, where lower rated positions or positions in less liquid asset class are given a lower trading threshold. The limit monitoring system captures exposures and flags any threshold breaches. Market Risk Management approval is required for any trades over the limit or threshold.
The Market Risk Management Governance Framework also captures issuer (credit) risk for securitization positions in the trading book. MRM’s process manages concentration risks and sets thresholds at the position level. The limit structure is based on asset class and rating where less liquid positions and those with lower ratings are assigned lower trading thresholds. When the limit monitoring system captures positions that exceed their respective market value thresholds on a global basis, MRM approval is required. Further due diligence is performed on positions that require trade approval. This includes analyzing the credit performance of the security and evaluating risks of the trade. In addition, collateral level stress testing and performance monitoring is incorporated into the risk management process.
In compliance with Article 5 of Regulation (EU) 2017/2402, pre-trade due diligence is performed on all relevant positions. It is the responsibility of the respective trading desk to perform the pre-trade due diligence and then record the appropriate data records at trade execution to indicate whether relevant due diligence items have been performed. The pre-trade due diligence items include confirmations of deal structural features, performance monitoring of the underlying portfolio, and any related retention disclosures.
Product Control group within Finance then reviews trade inputs for errors or flag changes, distributes regulatory control reports and serves as the subject matter escalation contact. Upon validation of flag changes or trading desk errors, the Product Control group within Finance will then communicate and action the changes accordingly. Further pre-trade due diligence is performed by Market Risk Management for CRR, as applicable for relevant positions exceeding predefined limits (process as described above).
Assets originated or acquired with the intent to securitize follow the general approach for the assignment to the regulatory banking or trading book. Further details are described in chapter “Trading book allocation and prudent valuation”, section “Allocation of positions to the regulatory trading book” in this report.
154
|
Deutsche Bank |
||
|
Pillar 3 Report as of December 31, 2024 |
||
Nature of other risks in securitized assets
Article 449 (b) CRR (EU SECA)
Overall, the securitization positions are exposed to the performance of diverse asset classes, including primarily corporate senior secured loans or unsecured debt, consumer debt such as auto loans or student loans, as well as residential or commercial first and second lien mortgages. Deutsche Bank is active across the entire capital structure with an emphasis on the more senior tranches. The subset of re-securitization is predominantly backed by securitizations with corporate obligations in the underlying pools. However, the subset of re-securitization is not part of an active investment strategy anymore and is only representing a very marginal part of the overall securitization portfolio.
The Group’s securitization desks trade assets across all capital structures, from senior bonds with large subordination to first loss subordinate tranches. Securitization positions consist mostly of residential mortgage backed securities and commercial mortgage backed securities backed by first and second lien loans, collateralized loan obligations backed by corporate senior secured loans and unsecured debt and consumer asset backed securities, backed by secured and unsecured credit.
Similar to other fixed income and credit assets, securitized trading volume is linked to global growth and geopolitical events which affect liquidity and can lead to lower trading volumes, as observed during the crisis. Current and proposed changes to regulation and uncertainty over final implementation may lead to increased volatility and decreased liquidity/trading volumes across securitized products. Other potential risks that exist in securitized assets are prepayment, default, loss severity and servicer performance. Note that trading book assets are marked-to-market and the previous mentioned risks are reflected in the position’s price. Securitization activities have an impact on Deutsche Bank’s liquidity activity. For example, the Group enters into securitization transactions as part of an active liquidity risk management strategy. However, the Group also faces risk of potential drawdown under the revolving commitments provided under certain securitization facilities. This liquidity risk is monitored by its Treasury department and is included in its liquidity planning and regular stress testing.
RWA calculation approaches for securitization positions
Article 449 (c) CRR (EU SECA)
The approach for the calculation of the regulatory capital requirements for banking book and trading book securitization positions is prescribed by the CRR.
The securitization framework determines the regulatory capital requirements for the credit risk of banking book securitizations pursuant to Articles 242 to 270e CRR and distinguishes between the Securitization Internal Ratings-Based Approach (SEC‑IRBA), the Securitization Standardized Approach (SEC-SA) and the Securitization External Ratings-Based Approach (SEC‑ERBA). These rules also provide a specific framework for Simple, Transparent and Standardized (STS) securitizations, which are defined in Regulation (EU) 2017/2402 and are subject to a beneficial capital treatment in the CRR.
The SEC-IRBA is applied for securitization positions, where at least 95% of the securitized portfolio is in scope of an IRBA rating model and where sufficient information in relation to the securitized portfolio is available to calculate the risk-weighted exposure amounts under the IRB approach. Note that the ECB may preclude the application of the SEC-IRBA on a case-by-case basis as per Article 258 CRR. Currently, there are no securitization positions for which the ECB has precluded the application of the SEC-IRBA.
In general, the SEC-SA must be applied to all re-securitizations and for all securitizations for which the SEC-IRBA must not or cannot be applied, but the information required to apply the SEC-SA is available. Note, however, that instead of the SEC‑SA, the SEC-ERBA must be applied for securitization positions with at least one eligible external rating or where a rating might be inferred:
– Where the application of the SEC-SA would result in a risk weight higher than 25 %, or
– Where, for positions not qualifying as positions in an STS securitization, the application of the SEC-ERBA would result in a risk weight higher than 75 %, or
– For securitization transactions backed by pools of auto loans, auto leases and equipment leases.
Where the SEC-SA may not be used, the SEC-ERBA must be applied for securitization positions with at least one eligible external rating or where an external rating can be inferred. External ratings must satisfy certain eligibility criteria for being used in the risk weight calculation. If more than one eligible rating is available for a specific securitization position, the relevant external rating is determined as the second best eligible rating in accordance with the provisions set forth in Article 270d CRR.
Deutsche Bank does not make use of the option provided in Article 254 (3) CRR to consistently apply the SEC-ERBA instead of the SEC‑SA for all securitization positions for which an eligible external rating is available or for positions for which such a rating can be inferred.
In addition to the above approaches to determine capital requirements, Article 267 CRR specifies a risk weight cap for senior securitization positions based on the average risk weight of the securitized portfolio. Article 268 CRR provides a maximum capital requirement for all securitization positions of a specific securitization transaction based on the capital requirement applicable to the securitized portfolio.
155
|
Deutsche Bank |
||
|
Pillar 3 Report as of December 31, 2024 |
||
Based on Article 254 (5) CRR, an Internal Assessment Approach may be applied for unrated positions in ABCP programs. As the Group ceased the use of ABCP programs in 2015, there are no securitizations positions subject to the Internal Assessment Approach as of December 31, 2024.
As of December 31, 2024, the whole portfolio has been assessed based on the new securitization framework, due to the decommissioning of the grandfathered securitization framework already by beginning of 2020. Approved rating agencies include Standard & Poor’s, Moody’s, Fitch Ratings, DBRS Morningstar and Kroll.
More than half of the total banking book securitization exposure was subject to SEC-IRBA. This approach was predominantly used to assess positions backed by corporate loans, auto-related receivables and commercial and residential real estate loans. The risk weight of securitization positions subject to the SEC-IRBA is determined based on a formula, which takes as input the capital requirement of the securitized portfolio and the seniority of the securitization position in the waterfall, amongst others. When applying the SEC-IRBA, Deutsche Bank estimates the risk parameters PD and LGD for the assets included in the securitized portfolio, by using internally developed rating systems approved for such assets. The rating systems are based on historical default and loss information from comparable assets. The risk parameters PD and LGD are derived on risk pool level.
The approach SEC-SA was used in most cases where SEC-IRBA was not applicable, and it was used for positions backed by a variety of asset classes including corporate loans, real estate loans and diverse ABS positions such as backed by aircraft leasing, credit card loans and consumer loans. The approach SEC-ERBA was only applied to a minority of securitization exposures. The great majority of securitization positions with an eligible external or inferred external credit assessment were securitization positions held as investor backed by residential mortgages. The rest of the securitization exposures were treated by getting assigned a risk weight of 1,250 % as none of the other approaches qualified.
Calculation of regulatory capital requirements for trading book securitizations
Overall, the regulatory capital requirements for the market risk of trading book securitizations consist of a general and specific market risk component. The capital requirement for the general market risk of trading book securitization positions is determined as the sum of (i) the value-at-risk based capital requirement for market risk and (ii) the stressed value-at-risk based capital requirement for market risk. The capital requirement for specific market risk is principally calculated based on the market risk standardized approach pursuant to Article 337 CRR. For this, the market risk standardized approach risk weight for trading book securitization positions is calculated by using the same methodologies, which apply to banking book securitization positions. The market risk standardized approach based capital requirement for specific risk is determined as the sum of the capital requirements for all net long and all net short securitization positions. The securitization positions included in the market risk standardized approach calculations for specific risk are additionally included in the value-at-risk and stressed value-at-risk calculations for general risk.
Trading book securitizations subject to MRSA treatment include various asset classes differentiated by the respective underlying collateral types:
– Residential mortgage backed securities (RMBS)
– Commercial mortgage backed securities (CMBS)
– Collateralized loan obligations (CLO)
– Collateralized debt obligations (CDO)
– Asset backed securities (incl. credit cards, auto loans and leases, student loans, equipment loans and leases, dealer floorplan loans, etc.)
They also include synthetic credit derivatives and commonly-traded indices based on the above listed instruments.
Please refer to section “Characteristics of the market risk models” of this Pillar 3 report for general information on the Group’s market risk quantification approaches.
Principally all the same methods for assessing the own funds requirements for securitizations, which are used in the non-trading book, are also available in the trading book. The predominantly used method for assessing risk-weighted assets in the trading book was the SEC-ERBA. To a lesser extent the SEC-SA was used. The method SEC-IRBA was only used for a minority of exposure. Another minor part of the exposure values were assigned directly a risk-weight of 1,250 % as no other approach qualified.
156
|
Deutsche Bank |
||
|
Pillar 3 Report as of December 31, 2024 |
||
SSPE-related activities
Article 449 (d+f) CRR (EU SECA)
Where Deutsche Bank acts as originator and uses a securitization special purpose entity (SSPE) for transferring securitized assets it occasionally retains exposure to the securitization special purpose entities. The types of exposure to the securitization special purpose entities were either liquidity facilities or derivatives, and in that case foremost interest rate swaps.
Deutsche Bank occasionally uses securitization special purpose entities to securitize third-party exposures where the Group acts as sponsor. In certain cases Deutsche Bank also retains some of the securitized exposures. Most of these positions are secured by mortgages on residential properties. The Group also retains occasionally exposures to securitization special purpose entities where it acts as sponsor. The exposure types of such positions were liquidity facilities or derivative positions.
As of December 31, 2024, the portion of retained exposures to securitization special purpose entities is only a very minor part of all retained positions where Deutsche Bank was originator or sponsor.
When Deutsche Bank acts as originator or sponsor of a securitization transaction, it sells securitization tranches (or arranges for such sale through mandated market making institutions) solely on an “execution only” basis and only to sophisticated operative corporate clients that rely on their own risk assessment. In the ordinary course of business, the Group does not offer such tranches to operative corporate clients to which, at the same time, the Group offers investment advisory services.
Deutsche Bank’s business division Asset Management provides asset management services to undertakings for collective investments, including mutual funds and alternative investment funds, and private individuals offering access to traditional and alternative investments across all major asset classes, including securitization positions. As of December 31, 2024 only a small minority of those positions consisted of tranches in securitization transactions where Deutsche Bank acted as originator or sponsor.
Deutsche Bank generally does not provide securitization related services to securitization special purpose entities which are out of its regulatory scope of consolidation and for which the Group claims risk transfer or where the Group acts as sponsor.
For the purpose of regulatory reporting and as of December 31, 2024, there were no securitization special purpose entities, which were in Deutsche Bank’s regulatory scope of consolidation.
Article 449 (e) CRR
Deutsche Bank has not provided any implicit support to its securitization vehicles. In consequence, as of December 31, 2024 there was no need to report any positions according to article 250 3. CRR.
Accounting policies for securitizations
Article 449 (g) CRR (EU SECA)
The most relevant accounting policies for the securitization programs originated by the Group, and where it holds assets purchased with the intent to securitize, are “Principles of consolidation”, “Financial assets”, “Financial liabilities” and “Derecognition of financial assets and liabilities” below.
For measurement and quantification of both banking and trading book securitizations of Deutsche Bank, please refer to section Banking and trading book securitization exposures” further below in this report.
Principles of consolidation
The Group’s subsidiaries are those entities which it directly or indirectly controls. Control over an entity is evidenced by the Group’s ability to exercise its power in order to affect any variable returns that the Group is exposed to through its involvement with the entity.
The Group sponsors the formation of structured entities and interacts with structured entities sponsored by third parties for a variety of reasons, including allowing clients to hold investments in separate legal entities, allowing clients to invest jointly in alternative assets, for asset securitization transactions, and for buying or selling credit protection.
Financial assets
The Group classifies financial assets in line with the classification and measurement requirements of IFRS 9, where financial assets are classified based on both the business model used for managing the financial assets and the contractual cash flow characteristics of the financial asset (known as Solely Payments of Principal and Interest or “SPPI”). There are three business models available:
157
|
Deutsche Bank |
||
|
Pillar 3 Report as of December 31, 2024 |
||
– Hold to Collect - Financial assets held with the objective to collect contractual cash flows; they are subsequently measured at amortized cost and are recorded in multiple lines on the Group’s consolidated balance sheet.
– Hold to Collect and Sell - Financial assets held with the objective of both collecting contractual cash flows and selling financial assets; they are recorded as financial assets at Fair Value through Other Comprehensive Income on the Group’s consolidated balance sheet.
– Other - Financial assets that do not meet the criteria of either “Hold to Collect” or “Hold to Collect and Sell”; they are recorded as Financial Assets at Fair Value through Profit or Loss on the Group’s consolidated balance sheet.
The assessment of business model requires judgment based on facts and circumstances upon initial recognition. If the Group holds a financial asset either in a Hold to Collect or a Hold to Collect and Sell business model, then an assessment at initial recognition to determine whether the contractual cash flows of the financial asset are Solely Payments of Principal and Interest on the principal amount outstanding at initial recognition is required to determine the business model classification. Contractual cash flows, that are SPPI on the principal amount outstanding, are consistent with a basic lending arrangement.
– Financial assets are classified at fair value through profit or loss if they are held in the other business model because they are either held for trading or because they do not meet the criteria for Hold to Collect or Hold to Collect and Sell; financial assets classified as financial assets at fair value through profit or loss are measured at fair value with realized and unrealized gains and losses included in Net gains (losses) on financial assets/liabilities at fair value through profit or loss.
– A financial asset shall be classified and measured at Fair Value through Other Comprehensive Income (“FVOCI”), if the financial asset is held in a Hold to Collect and Sell business model and the contractual cash flows are SPPI, unless designated under the fair value option; under FVOCI, a financial asset is measured at its fair value with any changes being recognized in Other Comprehensive Income (”OCI”) and is assessed for impairment under the IFRS 9 expected credit loss model where provisions are recorded through profit or loss (recognized based on expectations of potential credit losses).
– A financial asset is classified and subsequently measured at amortized cost if the financial asset is held in a Hold to Collect business model and the contractual cash flows are SPPI; under this measurement category, the financial asset is measured at fair value at initial recognition; subsequently the carrying amount is reduced for principal payments, plus or minus the cumulative amortization using the effective interest method; the financial asset is assessed for impairment under the IFRS 9 expected credit loss model where provisions are recognized based on expectations of potential credit losses.
Financial liabilities
Under IFRS 9 financial liabilities are measured at amortized cost using the effective interest method, except for financial liabilities at fair value through profit or loss.
Financial liabilities at fair value through profit or loss include Trading Liabilities, Financial Liabilities Designated at Fair Value through Profit or Loss and Non-Participating Investment Contracts. Financial liabilities classified at fair value through profit or loss are recognized or derecognized on trade date. Trading liabilities consist primarily of derivative liabilities (including certain loan commitments) and short positions. This also includes loan commitments where the resulting loan upon funding is allocated to the other business model such that the undrawn loan commitment is classified as derivatives held for trading.
Derecognition of financial assets and liabilities
Financial asset derecognition
A financial asset is considered for derecognition when the contractual rights to the cash flows from the financial asset expire, or the Group has either transferred the contractual right to receive the cash flows from that asset, or has assumed an obligation to pay those cash flows to one or more recipients, subject to certain criteria. The Group derecognizes a transferred financial asset if it transfers substantially all the risks and rewards of ownership. The Group enters into transactions in which it transfers previously recognized financial assets but retains substantially all the associated risks and rewards of those assets.
In transactions in which substantially all the risks and rewards of ownership of a financial asset are neither retained nor transferred, the Group derecognizes the transferred asset if control over that asset is not retained, i.e., if the transferee has the practical ability to sell the transferred asset. The rights and obligations retained in the transfer are recognized separately as assets and liabilities, as appropriate. If control over the asset is retained, the Group continues to recognize the asset to the extent of its continuing involvement, which is determined by the extent to which it remains exposed to changes in the value of the transferred asset.
158
|
Deutsche Bank |
||
|
Pillar 3 Report as of December 31, 2024 |
||
Securitization
The Group securitizes various consumer and commercial financial assets, which is achieved via the transfer of these assets to a structured entity, which issues securities to investors to finance the acquisition of the assets. Financial assets awaiting securitization are classified and measured as appropriate under the policies in the “Financial Assets” and “Financial Liabilities” sections. If the structured entity is not consolidated then the transferred assets may qualify for derecognition in full or in part, under the policy on derecognition of financial assets. Synthetic securitization structures typically involve derivative financial instruments. Those transfers that do not qualify for derecognition may be reported as secured financing or result in the recognition of continuing involvement liabilities. The investors and the securitization vehicles generally have no recourse to the Group’s other assets in cases where the issuers of the financial assets fail to perform under the original terms of those assets.
Interests in the securitized financial assets may be retained in the form of senior or subordinated tranches, interest only strips or other residual interests (collectively referred to as “retained interests”). Provided the Group’s retained interests do not result in consolidation of a structured entity, nor in continued recognition of the transferred assets, these interests are typically recorded in financial assets at fair value through profit or loss and carried at fair value. Consistent with the valuation of similar financial instruments, the fair value of retained tranches or the financial assets is initially and subsequently determined using market price quotations where available or internal pricing models that utilize variables such as yield curves, prepayment speeds, default rates, loss severity, interest rate volatilities and spreads. The assumptions used for pricing are based on observable transactions in similar securities and are verified by external pricing sources, where available. Where observable transactions in similar securities and other external pricing sources are not available, management judgment must be used to determine fair value. The Group may also periodically hold interests in securitized financial assets and record them at amortized cost.
In situations where the Group has a present obligation (either legal or constructive) to provide financial support to an unconsolidated securitization entity a provision will be created if the obligation can be reliably measured and it is probable that there will be an outflow of economic resources required to settle it.
External rating agencies used for securitizations and internal Assessment Approach
Article 449 (h-i) CRR (EU SECA)
According to Article 270 (d) CRR the Group has nominated the following list of external credit assessment institutes (ECAIs), whose ratings are used in determining risk weights in line with Articles 263 and 264 CRR:
– DBRS Morningstar
– Fitch Ratings
– Kroll Bond Rating Agency
– Moody's Investors Service
– Standard & Poor's Ratings Services
All the rating information received from above listed external credit assessment institutes is used indiscriminately for all securitization positions to which they apply, and there is no preference of external credit assessment institutes per exposure type imposed by the Group.
As the Group ceased to use asset backed commercial paper (“ABCP”) programs in 2015, there were no securitizations positions subject to the Internal Assessment Approach as of December 31, 2024. For a description of the RWA calculation approaches used for securitization positions please refer to the section “Approaches to calculation of RWA for securitizations mapped to types of exposures” in this Pillar 3 report.
159
|
Deutsche Bank |
||
|
Pillar 3 Report as of December 31, 2024 |
||
Banking and trading book securitization exposures
Article 449 (j) CRR
The amounts reported in the following two tables provide details of the Group’s securitization exposures separately for the regulatory non‑trading and trading book. The details of the Group’s trading book securitization positions subject to the market risk standardized approach (MRSA) are included in this chapter.
The table EU SEC1 details the total non-trading book securitization exposure split by exposure type that the Group has securitized in its capacity as either originator or sponsor and finally positions which have been purchased through investment activities as investor. Each table provides a break-down by traditional and synthetic as well as simple, transparent and standardized (‘simple, transparent and standardised securitisation’ or ‘STS securitisation’ means a securitisation that meets the requirements set out in Article 18 of Regulation (EU) 2017/2402) securitization transactions. The originator and sponsor columns (a-k) also contain retained positions, even where the Group does not achieve significant risk transfer (SRT) and shows the current retention of its contribution to the originated or sponsored amount. The amounts reported are the securitized principal notional amounts where no significant risk transfer is achieved. If significant risk transfer is achieved, then the EAD is shown. As the Group ceased to use any asset backed commercial paper programs in 2015, there are no securitization positions subject to the internal assessment approach as of December 31, 2024.
The table EU SEC2 provides the total purchased or retained securitization exposure held in the Group’s regulatory trading book separately for originator, sponsor and investor activities split by exposure type of the securitized assets and also further broken down into traditional and synthetic transactions as well as simple transparent and standardized securitizations. The amounts reported are the EAD.
160
|
Deutsche Bank |
||
|
Pillar 3 Report as of December 31, 2024 |
||
EU SEC1 – Securitization exposures in the non-trading book
|
|
Dec 31, 2024 |
|||||||||||||||||||||||||||||
|
a |
b |
c |
d |
e |
f |
g |
h |
i |
j |
k |
l |
m |
n |
o |
||||||||||||||||
|
Institution acts as originator |
Institution acts as sponsor |
Institution acts as investor |
||||||||||||||||||||||||||||
|
Traditional |
Synthetic |
Traditional |
Synthetic |
Traditional |
Synthetic |
|||||||||||||||||||||||||
|
in € m. |
STS |
of which: |
Non-STS |
of which: |
Total |
of which: |
Subtotal |
STS |
Non-STS |
Subtotal |
STS |
Non-STS |
Subtotal |
|||||||||||||||||
|
Total exposures |
714 |
0 |
102 |
102 |
33,709 |
33,709 |
34,525 |
0 |
3,026 |
0 |
3,026 |
263 |
51,935 |
0 |
52,198 |
|||||||||||||||
|
Retail |
714 |
0 |
33 |
33 |
3,515 |
3,515 |
4,262 |
0 |
2,298 |
0 |
2,298 |
158 |
12,989 |
0 |
13,147 |
|||||||||||||||
|
of which: |
||||||||||||||||||||||||||||||
|
Residential Mortgage |
500 |
0 |
33 |
33 |
0 |
0 |
533 |
0 |
2,283 |
0 |
2,283 |
158 |
3,731 |
0 |
3,888 |
|||||||||||||||
|
Credit Card |
0 |
0 |
0 |
0 |
0 |
0 |
0 |
0 |
0 |
0 |
0 |
0 |
242 |
0 |
242 |
|||||||||||||||
|
Other retail exposures |
214 |
0 |
0 |
0 |
3,515 |
3,515 |
3,729 |
0 |
15 |
0 |
15 |
0 |
9,016 |
0 |
9,016 |
|||||||||||||||
|
Re-securitization |
0 |
0 |
0 |
0 |
0 |
0 |
0 |
0 |
0 |
0 |
0 |
0 |
0 |
0 |
0 |
|||||||||||||||
|
Wholesale |
0 |
0 |
70 |
70 |
30,194 |
30,194 |
30,263 |
0 |
728 |
0 |
728 |
105 |
38,946 |
0 |
39,050 |
|||||||||||||||
|
of which: |
||||||||||||||||||||||||||||||
|
Loans to corporates |
0 |
0 |
0 |
0 |
30,194 |
30,194 |
30,194 |
0 |
565 |
0 |
565 |
0 |
27,680 |
0 |
27,680 |
|||||||||||||||
|
Commercial Mortgage |
0 |
0 |
70 |
70 |
0 |
0 |
70 |
0 |
95 |
0 |
95 |
0 |
602 |
0 |
602 |
|||||||||||||||
|
Lease and receivables |
0 |
0 |
0 |
0 |
0 |
0 |
0 |
0 |
68 |
0 |
68 |
105 |
4,360 |
0 |
4,465 |
|||||||||||||||
|
Other wholesale |
0 |
0 |
0 |
0 |
0 |
0 |
0 |
0 |
0 |
0 |
0 |
0 |
6,303 |
0 |
6,303 |
|||||||||||||||
|
Re-securitization |
0 |
0 |
0 |
0 |
0 |
0 |
0 |
0 |
0 |
0 |
0 |
0 |
0 |
0 |
0 |
|||||||||||||||
|
|
Jun 30, 2024 |
|||||||||||||||||||||||||||||
|
a |
b |
c |
d |
e |
f |
g |
h |
i |
j |
k |
l |
m |
n |
o |
||||||||||||||||
|
Institution acts as originator |
Institution acts as sponsor |
Institution acts as investor |
||||||||||||||||||||||||||||
|
Traditional |
Synthetic |
Traditional |
Synthetic |
Traditional |
Synthetic |
|||||||||||||||||||||||||
|
in € m. |
STS |
of which: |
Non-STS |
of which: |
Total |
of which: |
Subtotal |
STS |
Non-STS |
Subtotal |
STS |
Non-STS |
Subtotal |
|||||||||||||||||
|
Total exposures |
214 |
0 |
85 |
85 |
28,570 |
28,570 |
28,869 |
0 |
2,597 |
0 |
2,597 |
451 |
49,940 |
0 |
50,391 |
|||||||||||||||
|
Retail |
214 |
0 |
41 |
41 |
2,011 |
2,011 |
2,266 |
0 |
1,983 |
0 |
1,983 |
369 |
12,509 |
0 |
12,879 |
|||||||||||||||
|
of which: |
||||||||||||||||||||||||||||||
|
Residential Mortgage |
0 |
0 |
41 |
41 |
0 |
0 |
41 |
0 |
1,983 |
0 |
1,983 |
369 |
4,100 |
0 |
4,469 |
|||||||||||||||
|
Credit Card |
0 |
0 |
0 |
0 |
0 |
0 |
0 |
0 |
0 |
0 |
0 |
0 |
235 |
0 |
235 |
|||||||||||||||
|
Other retail exposures |
214 |
0 |
0 |
0 |
2,011 |
2,011 |
2,225 |
0 |
0 |
0 |
0 |
0 |
8,174 |
0 |
8,174 |
|||||||||||||||
|
Re-securitization |
0 |
0 |
0 |
0 |
0 |
0 |
0 |
0 |
0 |
0 |
0 |
0 |
0 |
0 |
0 |
|||||||||||||||
|
Wholesale |
0 |
0 |
44 |
44 |
26,559 |
26,559 |
26,603 |
0 |
614 |
0 |
614 |
82 |
37,430 |
0 |
37,512 |
|||||||||||||||
|
of which: |
||||||||||||||||||||||||||||||
|
Loans to corporates |
0 |
0 |
0 |
0 |
26,559 |
26,559 |
26,559 |
0 |
448 |
0 |
448 |
0 |
27,200 |
0 |
27,200 |
|||||||||||||||
|
Commercial Mortgage |
0 |
0 |
44 |
44 |
0 |
0 |
44 |
0 |
104 |
0 |
104 |
0 |
563 |
0 |
563 |
|||||||||||||||
|
Lease and receivables |
0 |
0 |
0 |
0 |
0 |
0 |
0 |
0 |
62 |
0 |
62 |
81 |
3,886 |
0 |
3,967 |
|||||||||||||||
|
Other wholesale |
0 |
0 |
0 |
0 |
0 |
0 |
0 |
0 |
0 |
0 |
0 |
1 |
5,781 |
0 |
5,782 |
|||||||||||||||
|
Re-securitization |
0 |
0 |
0 |
0 |
0 |
0 |
0 |
0 |
0 |
0 |
0 |
0 |
0 |
0 |
0 |
|||||||||||||||
161
|
Deutsche Bank |
||
|
Pillar 3 Report as of December 31, 2024 |
||
EU SEC2 – Securitization exposures in the trading book
|
|
Dec 31, 2024 |
|||||||||||||||||||||||
|
a |
b |
c |
d |
e |
f |
g |
h |
i |
j |
k |
l |
|||||||||||||
|
Institution acts as originator |
Institution acts as sponsor |
Institution acts as investor |
||||||||||||||||||||||
|
Traditional |
Synthetic |
|
Traditional |
Synthetic |
|
Traditional |
Synthetic |
|
||||||||||||||||
|
in € m. |
STS |
Non-STS |
Subtotal |
STS |
Non-STS |
Subtotal |
STS |
Non-STS |
Subtotal |
|||||||||||||||
|
Total exposures |
0 |
60 |
0 |
60 |
0 |
0 |
0 |
0 |
2 |
2,579 |
0 |
2,581 |
||||||||||||
|
Retail |
0 |
0 |
0 |
0 |
0 |
0 |
0 |
0 |
2 |
956 |
0 |
958 |
||||||||||||
|
of which: |
||||||||||||||||||||||||
|
Residential Mortgage |
0 |
0 |
0 |
0 |
0 |
0 |
0 |
0 |
2 |
839 |
0 |
841 |
||||||||||||
|
Credit Card |
0 |
0 |
0 |
0 |
0 |
0 |
0 |
0 |
0 |
7 |
0 |
7 |
||||||||||||
|
Other retail exposures |
0 |
0 |
0 |
0 |
0 |
0 |
0 |
0 |
0 |
110 |
0 |
110 |
||||||||||||
|
Re-securitization |
0 |
0 |
0 |
0 |
0 |
0 |
0 |
0 |
0 |
0 |
0 |
0 |
||||||||||||
|
Wholesale |
0 |
60 |
0 |
60 |
0 |
0 |
0 |
0 |
0 |
1,623 |
0 |
1,623 |
||||||||||||
|
of which: |
||||||||||||||||||||||||
|
Loans to corporates |
0 |
0 |
0 |
0 |
0 |
0 |
0 |
0 |
0 |
741 |
0 |
741 |
||||||||||||
|
Commercial Mortgage |
0 |
59 |
0 |
59 |
0 |
0 |
0 |
0 |
0 |
494 |
0 |
494 |
||||||||||||
|
Lease and receivables |
0 |
0 |
0 |
0 |
0 |
0 |
0 |
0 |
0 |
119 |
0 |
119 |
||||||||||||
|
Other wholesale |
0 |
0 |
0 |
0 |
0 |
0 |
0 |
0 |
0 |
269 |
0 |
269 |
||||||||||||
|
Re-securitization |
0 |
1 |
0 |
1 |
0 |
0 |
0 |
0 |
0 |
0 |
0 |
0 |
||||||||||||
…
|
|
Jun 30, 2024 |
|||||||||||||||||||||||
|
a |
b |
c |
d |
e |
f |
g |
h |
i |
j |
k |
l |
|||||||||||||
|
Institution acts as originator |
Institution acts as sponsor |
Institution acts as investor |
||||||||||||||||||||||
|
Traditional |
Synthetic |
Traditional |
Synthetic |
Traditional |
Synthetic |
|||||||||||||||||||
|
in € m. |
STS |
Non-STS |
Subtotal |
STS |
Non-STS |
Subtotal |
STS |
Non-STS |
Subtotal |
|||||||||||||||
|
Total exposures |
0 |
134 |
0 |
134 |
0 |
0 |
0 |
0 |
8 |
2,611 |
0 |
2,619 |
||||||||||||
|
Retail |
0 |
0 |
0 |
0 |
0 |
0 |
0 |
0 |
7 |
970 |
0 |
977 |
||||||||||||
|
of which: |
||||||||||||||||||||||||
|
Residential Mortgage |
0 |
0 |
0 |
0 |
0 |
0 |
0 |
0 |
7 |
870 |
0 |
876 |
||||||||||||
|
Credit Card |
0 |
0 |
0 |
0 |
0 |
0 |
0 |
0 |
0 |
12 |
0 |
12 |
||||||||||||
|
Other retail exposures |
0 |
0 |
0 |
0 |
0 |
0 |
0 |
0 |
0 |
88 |
0 |
88 |
||||||||||||
|
Re-securitization |
0 |
0 |
0 |
0 |
0 |
0 |
0 |
0 |
0 |
0 |
0 |
0 |
||||||||||||
|
Wholesale |
0 |
134 |
0 |
134 |
0 |
0 |
0 |
0 |
1 |
1,641 |
0 |
1,643 |
||||||||||||
|
of which: |
||||||||||||||||||||||||
|
Loans to corporates |
0 |
0 |
0 |
0 |
0 |
0 |
0 |
0 |
0 |
751 |
0 |
751 |
||||||||||||
|
Commercial Mortgage |
0 |
134 |
0 |
134 |
0 |
0 |
0 |
0 |
0 |
535 |
0 |
535 |
||||||||||||
|
Lease and receivables |
0 |
0 |
0 |
0 |
0 |
0 |
0 |
0 |
0 |
99 |
0 |
99 |
||||||||||||
|
Other wholesale |
0 |
0 |
0 |
0 |
0 |
0 |
0 |
0 |
1 |
257 |
0 |
258 |
||||||||||||
|
Re-securitization |
0 |
1 |
0 |
1 |
0 |
0 |
0 |
0 |
0 |
0 |
0 |
0 |
||||||||||||
162
|
Deutsche Bank |
||
|
Pillar 3 Report as of December 31, 2024 |
||
Overall, the aggregate exposure volume generated by the securitization business was € 92.4 billion as of December 31, 2024, an increase of € 7.8 billion compared to June 30, 2024. The majority of the exposure resided in the non-trading book with € 89.7 billion, whereas the trading book portion represented only a minor contribution of € 2.6 billion aggregate exposure value. Volume in the non-trading book increased by € 7.9 billion mainly driven by new originator synthetic positions and new investor traditional positions while in the trading book, the exposure volume decreased marginally by 0.1 billion compared to June 30, 2024.
As of December 31, 2024, the € 89.7 billion non-trading book exposure included two material contributions, which together covered € 85.9 billion. One dominant part consisted of the traditional securitizations with a volume of € 52.2 billion, where the Group acted as investor by purchasing securitization investments. The other dominant part was composed of the synthetic securitization transactions with a volume of € 33.7 billion, where the Group acted as originator. Compared to June 30, 2024, the net increase of traditional securitization, where the Group acted as investor was € 1.8 billion, and synthetic securitizations increased by € 5.1 billion, which reflects the Group’s increased activity in issuing new synthetic originator securitizations.
From a securitized asset perspective, the material asset types were loans to corporates and other retail exposures in the non-trading book, as well as mortgages (commercial mortgages and residential mortgages) and loans to corporates in the trading book. In the non-trading book the loans to corporates represented € 58.4, or 65% of the exposure volume, other retail exposures covered € 12.8 billion, representing 14% of the exposure volume, and mortgages covered € 7.5 billion, representing 8% of the exposure volume. In the trading book the mortgages represented the dominant part with € 1.4 billion of total € 2.6 billion, representing 53% of the exposure volume and the loans to corporates covered € 0.7 billion, representing 28% of the total exposure volume of that book. Together, the securitized asset types “Loans to corporates”, “Other retail exposures”, “Commercial Mortgages” and “Residential Mortgages”, represented around € 80.9 billion of € 92.4 billion overall securitization position exposure, which was equivalent to 88% of that volume.
Of the overall volume of securitization business of € 92.4 billion only a minority of € 7.8 billion was classified as simple, transparent and standardized (STS). This represented 8.5% of the overall exposure volume in securitizations.
Securitization exposures in the non-trading book and associated regulatory capital requirements - institution acting as originator or as sponsor
Article 449 (k)(i) CRR
The table EU SEC3 presents the retained or purchased non-trading book securitizations, where the Group acted as originator or sponsor.
Firstly, the exposure values are broken down by risk-weight bands (columns a-e). Additionally, the Group presents the exposure values, risk weighted exposure amounts and capital requirements separately for each regulatory RWA calculation approach (columns f-q). All just mentioned values are vertically broken down by traditional and synthetic transactions, securitization and re-securitization, as well as by retail or wholesale and a specific row for STS traditional transactions.
For the meaning of the names used in the following sections for the regulatory calculation approaches of the securitization framework (SEC-IRBA, SEC-SA and SEC-ERBA), please see the short description below.
– SEC-IRBA (Articles 259 and 260 CRR): Approach to be used in case the securitized assets would be treated under the IRB approach if not securitized and reside on the Group’s books; at least 95 % of the exposure value of the securitized assets need to be treated under the IRB approaches in order to apply this approach; there are a number of additional requirements in order to apply this approach (see Article 258 CRR).
– SEC-SA (Articles 261 and 262 CRR): In case SEC-IRBA is not applicable, the SEC-SA is generally to be applied; for this the capital requirement ratio under the standardized approach (KSA) of the pool of securitized assets needs to be calculated as if it was not securitized and as if it was on the Group’s book; in addition, the delinquent asset ratio on the pool level needs to be determined.
– SEC-ERBA (Articles 263 and 264 CRR): This can be applied, if an eligible external or inferred rating is available; the risk weight is determined by a lookup table from the rating letter and the maturity of the position; in case the SEC-ERBA is available there are certain rules to determine when the SEC-ERBA is to be used instead of the SEC-SA (for details see Article 254 CRR).
– 1,250 %: In all other cases, a risk weight of 1,250 % is applied.
163
|
Deutsche Bank |
||
|
Pillar 3 Report as of December 31, 2024 |
||
EU SEC3 – Securitization exposures in the non-trading book and associated regulatory capital requirements - institution acting as originator or as sponsor
|
|
Dec 31, 2024 |
|||||||||||||||||||||||||||||||||
|
a |
b |
c |
d |
e |
f |
g |
h |
i |
j |
k |
l |
m |
n |
o |
p |
q |
||||||||||||||||||
|
Exposure values (by RW bands/deductions) |
Exposure values (by regulatory approach) |
RWA (by regulatory approach) |
Capital charge after cap |
|||||||||||||||||||||||||||||||
|
in € m. |
≤20% RW |
>20% to 50% RW |
>50% to 100% RW |
>100% to <1250% RW |
1250% RW/ deductions |
SEC-IRBA |
SEC-ERBA(including IAA) |
SEC-SA |
1250% / deductions |
SEC-IRBA |
SEC-ERBA(including IAA) |
SEC-SA |
1250% / deductions |
SEC-IRBA |
SEC-ERBA(including IAA) |
SEC-SA |
1250% / deductions |
|||||||||||||||||
|
Total exposures |
36,594 |
100 |
12 |
50 |
80 |
36,278 |
18 |
462 |
80 |
5,370 |
100 |
104 |
1,004 |
423 |
4 |
8 |
80 |
|||||||||||||||||
|
Traditional transactions |
3,026 |
39 |
12 |
50 |
1 |
2,649 |
18 |
462 |
1 |
517 |
100 |
104 |
8 |
35 |
4 |
8 |
1 |
|||||||||||||||||
|
Securitization |
3,026 |
39 |
12 |
50 |
0 |
2,649 |
18 |
462 |
0 |
517 |
100 |
104 |
5 |
35 |
4 |
8 |
0 |
|||||||||||||||||
|
Retail underlying |
2,315 |
0 |
12 |
4 |
0 |
1,924 |
13 |
394 |
0 |
289 |
65 |
63 |
0 |
17 |
1 |
5 |
0 |
|||||||||||||||||
|
of which: |
||||||||||||||||||||||||||||||||||
|
STS |
0 |
0 |
0 |
0 |
0 |
0 |
0 |
0 |
0 |
0 |
0 |
0 |
0 |
0 |
0 |
0 |
0 |
|||||||||||||||||
|
Wholesale |
712 |
39 |
0 |
46 |
0 |
724 |
5 |
68 |
0 |
229 |
35 |
41 |
5 |
18 |
3 |
3 |
0 |
|||||||||||||||||
|
of which: |
||||||||||||||||||||||||||||||||||
|
STS |
0 |
0 |
0 |
0 |
0 |
0 |
0 |
0 |
0 |
0 |
0 |
0 |
0 |
0 |
0 |
0 |
0 |
|||||||||||||||||
|
Re-securitization |
0 |
0 |
0 |
0 |
0 |
0 |
0 |
0 |
0 |
0 |
0 |
0 |
3 |
0 |
0 |
0 |
0 |
|||||||||||||||||
|
Synthetic transactions |
33,568 |
61 |
0 |
0 |
80 |
33,629 |
0 |
0 |
80 |
4,853 |
0 |
0 |
996 |
388 |
0 |
0 |
80 |
|||||||||||||||||
|
Securitization |
33,568 |
61 |
0 |
0 |
80 |
33,629 |
0 |
0 |
80 |
4,853 |
0 |
0 |
996 |
388 |
0 |
0 |
80 |
|||||||||||||||||
|
Retail underlying |
3,447 |
0 |
0 |
0 |
69 |
3,447 |
0 |
0 |
69 |
505 |
0 |
0 |
857 |
40 |
0 |
0 |
69 |
|||||||||||||||||
|
Wholesale |
30,121 |
61 |
0 |
0 |
11 |
30,182 |
0 |
0 |
11 |
4,348 |
0 |
0 |
139 |
348 |
0 |
0 |
11 |
|||||||||||||||||
|
Re-securitization |
0 |
0 |
0 |
0 |
0 |
0 |
0 |
0 |
0 |
0 |
0 |
0 |
0 |
0 |
0 |
0 |
0 |
|||||||||||||||||
|
|
Jun 30, 2024 |
|||||||||||||||||||||||||||||||||
|
a |
b |
c |
d |
e |
f |
g |
h |
i |
j |
k |
l |
m |
n |
o |
p |
q |
||||||||||||||||||
|
Exposure values (by RW bands/deductions) |
Exposure values (by regulatory approach) |
RWA (by regulatory approach) |
Capital charge after cap |
|||||||||||||||||||||||||||||||
|
in € m. |
≤20% RW |
>20% to 50% RW |
>50% to 100% RW |
>100% to <1250% RW |
1250% RW/ deductions |
SEC-IRBA |
SEC-ERBA(including IAA) |
SEC-SA |
1250% / deductions |
SEC-IRBA |
SEC-ERBA(including IAA) |
SEC-SA |
1250% / deductions |
SEC-IRBA |
SEC-ERBA(including IAA) |
SEC-SA |
1250% / deductions |
|||||||||||||||||
|
Total exposures |
31,079 |
14 |
75 |
32 |
53 |
30,875 |
28 |
297 |
53 |
4,426 |
125 |
114 |
658 |
349 |
4 |
8 |
53 |
|||||||||||||||||
|
Traditional transactions |
2,562 |
14 |
75 |
32 |
0 |
2,358 |
28 |
297 |
0 |
399 |
125 |
114 |
0 |
27 |
4 |
8 |
0 |
|||||||||||||||||
|
Securitization |
2,562 |
14 |
75 |
32 |
0 |
2,358 |
28 |
297 |
0 |
399 |
125 |
114 |
0 |
27 |
4 |
8 |
0 |
|||||||||||||||||
|
Retail underlying |
1,998 |
0 |
12 |
14 |
0 |
1,820 |
21 |
183 |
0 |
273 |
100 |
35 |
0 |
16 |
2 |
3 |
0 |
|||||||||||||||||
|
of which: |
||||||||||||||||||||||||||||||||||
|
STS |
0 |
0 |
0 |
0 |
0 |
0 |
0 |
0 |
0 |
0 |
0 |
0 |
0 |
0 |
0 |
0 |
0 |
|||||||||||||||||
|
Wholesale |
563 |
14 |
63 |
18 |
0 |
538 |
7 |
114 |
0 |
126 |
25 |
79 |
0 |
10 |
2 |
6 |
0 |
|||||||||||||||||
|
of which: |
||||||||||||||||||||||||||||||||||
|
STS |
0 |
0 |
0 |
0 |
0 |
0 |
0 |
0 |
0 |
0 |
0 |
0 |
0 |
0 |
0 |
0 |
0 |
|||||||||||||||||
|
Re-securitization |
0 |
0 |
0 |
0 |
0 |
0 |
0 |
0 |
0 |
0 |
0 |
0 |
0 |
0 |
0 |
0 |
0 |
|||||||||||||||||
|
Synthetic transactions |
28,517 |
0 |
0 |
0 |
53 |
28,517 |
0 |
0 |
53 |
4,027 |
0 |
0 |
658 |
322 |
0 |
0 |
53 |
|||||||||||||||||
|
Securitization |
28,517 |
0 |
0 |
0 |
53 |
28,517 |
0 |
0 |
53 |
4,027 |
0 |
0 |
658 |
322 |
0 |
0 |
53 |
|||||||||||||||||
|
Retail underlying |
1,969 |
0 |
0 |
0 |
42 |
1,969 |
0 |
0 |
42 |
248 |
0 |
0 |
529 |
20 |
0 |
0 |
42 |
|||||||||||||||||
|
Wholesale |
26,548 |
0 |
0 |
0 |
10 |
26,548 |
0 |
0 |
10 |
3,779 |
0 |
0 |
130 |
302 |
0 |
0 |
10 |
|||||||||||||||||
|
Re-securitization |
0 |
0 |
0 |
0 |
0 |
0 |
0 |
0 |
0 |
0 |
0 |
0 |
0 |
0 |
0 |
0 |
0 |
|||||||||||||||||
164
|
Deutsche Bank |
||
|
Pillar 3 Report as of December 31, 2024 |
||
The overall exposure volume of the securitization exposures in the non-trading book was € 89.0 billion by December 31, 2024, of which € 36.8 billion related to positions for which the Group acted as originator or sponsor, which was an increase of € 5.6 billion compared to June 30, 2024. The securitization exposures for these two roles were concentrated in the lowest risk-weight band, with risk-weights equal to or lower than 20%. These positions were almost exclusively treated by the SEC-IRBA method of the securitization framework of CRR. This reflected first and foremost the way the own synthetic on-balance sheet securitizations, which covered € 33.7 billion or 92% of the € 36.8 billion of exposure volume, were structured, namely such that the senior tranche, which attracts a minimal risk-weight, was kept, while subordinated tranches were transferred to third parties. Consequently, the RWA before capping and the capital requirements were also concentrated under the method of SEC-IRBA. Accordingly, the overall capital requirements for originators and sponsors increased by € 101.8 million from € 414.0 million as of June 30, 2024 to € 515.8 million as of December 31, 2024, of which € 423.5 million or around 82% were treated under SEC-IRBA. As of December 31, 2024, exposure levels increased by 18% and capital requirements increased by 25% compared to June 30, 2024, due to the increased activity in issuing new synthetic transactions by Deutsche Bank.
Securitization exposures in the non-trading book and associated regulatory capital requirements - institution acting as investor
Article 449 (k)(ii) CRR
The table EU SEC4 presents the purchased non-trading book securitizations, where the Group acts as investor, i.e. wherever the Group is not acting as originator or sponsor.
Firstly, the exposure values are broken down by risk-weight bands (columns a-e). Additionally, the Group presents the exposure values, risk weighted exposure amounts and capital requirements for securitization positions provided separately for each regulatory RWA calculation approach (columns f-q). All these values are vertically broken down by traditional and synthetic transactions, securitization and re-securitization, as well as by retail or wholesale and a specific row for STS for traditional transactions.
165
|
Deutsche Bank |
||
|
Pillar 3 Report as of December 31, 2024 |
||
EU SEC4 – Securitization exposures in the non-trading book and associated regulatory capital requirements - institution acting as investor
|
|
Dec 31, 2024 |
|||||||||||||||||||||||||||||||||
|
a |
b |
c |
d |
e |
f |
g |
h |
i |
j |
k |
l |
m |
n |
o |
p |
q |
||||||||||||||||||
|
Exposure values (by RW bands/deductions) |
Exposure values (by regulatory approach) |
RWA (by regulatory approach) |
Capital charge after cap |
|||||||||||||||||||||||||||||||
|
in € m. |
≤20% RW |
>20% to 50% RW |
>50% to 100% RW |
>100% to <1250% RW |
1250% RW/ deductions |
SEC-IRBA |
SEC-ERBA(including IAA) |
SEC-SA |
1250% / deductions |
SEC-IRBA |
SEC-ERBA(including IAA) |
SEC-SA |
1250% / deductions |
SEC-IRBA |
SEC-ERBA(including IAA) |
SEC-SA |
1250% / deductions |
|||||||||||||||||
|
Total exposures |
48,027 |
3,132 |
837 |
178 |
24 |
20,293 |
999 |
30,881 |
24 |
3,594 |
1,350 |
5,607 |
296 |
260 |
48 |
430 |
24 |
|||||||||||||||||
|
Traditional transactions |
48,027 |
3,132 |
837 |
178 |
24 |
20,293 |
999 |
30,881 |
24 |
3,594 |
1,350 |
5,607 |
296 |
260 |
48 |
430 |
24 |
|||||||||||||||||
|
Securitization |
48,027 |
3,132 |
837 |
178 |
23 |
20,293 |
999 |
30,881 |
23 |
3,594 |
1,350 |
5,607 |
294 |
260 |
48 |
430 |
23 |
|||||||||||||||||
|
Retail underlying |
10,894 |
1,646 |
472 |
135 |
1 |
7,771 |
433 |
4,942 |
1 |
1,646 |
372 |
1,231 |
8 |
110 |
23 |
80 |
1 |
|||||||||||||||||
|
of which: |
||||||||||||||||||||||||||||||||||
|
STS |
158 |
0 |
0 |
0 |
0 |
0 |
116 |
41 |
0 |
0 |
12 |
7 |
0 |
0 |
1 |
1 |
0 |
|||||||||||||||||
|
Wholesale |
37,134 |
1,486 |
364 |
43 |
23 |
12,523 |
566 |
25,939 |
23 |
1,949 |
978 |
4,376 |
285 |
150 |
25 |
350 |
23 |
|||||||||||||||||
|
of which: |
||||||||||||||||||||||||||||||||||
|
STS |
105 |
0 |
0 |
0 |
0 |
0 |
0 |
105 |
0 |
0 |
0 |
10 |
0 |
0 |
0 |
1 |
0 |
|||||||||||||||||
|
Re-securitization |
0 |
0 |
0 |
0 |
0 |
0 |
0 |
0 |
0 |
0 |
0 |
0 |
2 |
0 |
0 |
0 |
0 |
|||||||||||||||||
|
Synthetic transactions |
0 |
0 |
0 |
0 |
0 |
0 |
0 |
0 |
0 |
0 |
0 |
0 |
0 |
0 |
0 |
0 |
0 |
|||||||||||||||||
|
Securitization |
0 |
0 |
0 |
0 |
0 |
0 |
0 |
0 |
0 |
0 |
0 |
0 |
0 |
0 |
0 |
0 |
0 |
|||||||||||||||||
|
Retail underlying |
0 |
0 |
0 |
0 |
0 |
0 |
0 |
0 |
0 |
0 |
0 |
0 |
0 |
0 |
0 |
0 |
0 |
|||||||||||||||||
|
Wholesale |
0 |
0 |
0 |
0 |
0 |
0 |
0 |
0 |
0 |
0 |
0 |
0 |
0 |
0 |
0 |
0 |
0 |
|||||||||||||||||
|
Re-securitization |
0 |
0 |
0 |
0 |
0 |
0 |
0 |
0 |
0 |
0 |
0 |
0 |
0 |
0 |
0 |
0 |
0 |
|||||||||||||||||
|
|
Jun 30, 2024 |
|||||||||||||||||||||||||||||||||
|
a |
b |
c |
d |
e |
f |
g |
h |
i |
j |
k |
l |
m |
n |
o |
p |
q |
||||||||||||||||||
|
Exposure values (by RW bands/deductions) |
Exposure values (by regulatory approach) |
RWA (by regulatory approach) |
Capital charge after cap |
|||||||||||||||||||||||||||||||
|
in € m. |
20% RW |
>20% to 50% RW |
>50% to 100% RW |
>100% to <1250% RW |
1250% RW/ deductions |
SEC-IRBA |
SEC-ERBA(including IAA) |
SEC-SA |
1250% / deductions |
SEC-IRBA |
SEC-ERBA(including IAA) |
SEC-SA |
1250% / deductions |
SEC-IRBA |
SEC-ERBA(including IAA) |
SEC-SA |
1250% / deductions |
|||||||||||||||||
|
Total exposures |
47,015 |
1,980 |
1,245 |
136 |
15 |
19,623 |
1,160 |
29,592 |
15 |
3,477 |
654 |
5,542 |
187 |
253 |
41 |
427 |
15 |
|||||||||||||||||
|
Traditional transactions |
47,015 |
1,980 |
1,245 |
136 |
15 |
19,623 |
1,160 |
29,592 |
15 |
3,477 |
654 |
5,542 |
187 |
253 |
41 |
427 |
15 |
|||||||||||||||||
|
Securitization |
47,015 |
1,980 |
1,245 |
136 |
15 |
19,623 |
1,160 |
29,592 |
15 |
3,477 |
654 |
5,542 |
185 |
253 |
41 |
427 |
15 |
|||||||||||||||||
|
Retail underlying |
10,763 |
1,059 |
963 |
89 |
5 |
7,641 |
704 |
4,528 |
5 |
1,640 |
353 |
1,219 |
58 |
111 |
21 |
82 |
5 |
|||||||||||||||||
|
of which: |
||||||||||||||||||||||||||||||||||
|
STS |
324 |
45 |
0 |
0 |
0 |
0 |
310 |
59 |
0 |
0 |
31 |
10 |
0 |
0 |
2 |
1 |
0 |
|||||||||||||||||
|
Wholesale |
36,252 |
921 |
282 |
47 |
10 |
11,982 |
456 |
25,064 |
10 |
1,838 |
301 |
4,323 |
126 |
142 |
20 |
346 |
10 |
|||||||||||||||||
|
of which: |
||||||||||||||||||||||||||||||||||
|
STS |
82 |
0 |
0 |
0 |
0 |
0 |
1 |
81 |
0 |
0 |
0 |
8 |
0 |
0 |
0 |
1 |
0 |
|||||||||||||||||
|
Re-securitization |
0 |
0 |
0 |
0 |
0 |
0 |
0 |
0 |
0 |
0 |
0 |
0 |
3 |
0 |
0 |
0 |
0 |
|||||||||||||||||
|
Synthetic transactions |
0 |
0 |
0 |
0 |
0 |
0 |
0 |
0 |
0 |
0 |
0 |
0 |
0 |
0 |
0 |
0 |
0 |
|||||||||||||||||
|
Securitization |
0 |
0 |
0 |
0 |
0 |
0 |
0 |
0 |
0 |
0 |
0 |
0 |
0 |
0 |
0 |
0 |
0 |
|||||||||||||||||
|
Retail underlying |
0 |
0 |
0 |
0 |
0 |
0 |
0 |
0 |
0 |
0 |
0 |
0 |
0 |
0 |
0 |
0 |
0 |
|||||||||||||||||
|
Wholesale |
0 |
0 |
0 |
0 |
0 |
0 |
0 |
0 |
0 |
0 |
0 |
0 |
0 |
0 |
0 |
0 |
0 |
|||||||||||||||||
|
Re-securitization |
0 |
0 |
0 |
0 |
0 |
0 |
0 |
0 |
0 |
0 |
0 |
0 |
0 |
0 |
0 |
0 |
0 |
|||||||||||||||||
166
|
Deutsche Bank |
||
|
Pillar 3 Report as of December 31, 2024 |
||
The overall exposure volume of the securitization exposures in the non-trading book was € 89.0 billion by December 31, 2024, for € 52.2 billion or 59% of which the Group acted as investor, which was an increase of € 1.8 billion compared with June 30, 2024. With € 48.0 billion, or 92% of the exposure volume, the majority of the exposure volume of the investor portfolio was concentrated in the lowest risk-weight bucket, with risk-weights below or equal to 20%. A minor portion of € 3.1 billion or 6% was allocated to the second lowest risk-weight bucket of risk-weights greater than 20% and lower than or equal to 50%. The two most important methods applied to the investor portfolio were the SEC-IRBA and the SEC-SA. The SEC-SA was applied to an exposure volume of € 30.9 billion or 59% and the SEC-IRBA was applied to € 20.3 billion or 39% of the full investor exposure amount. A minority portion of € 1.0 billion was covered by the SEC-ERBA. The least beneficial approach resulting in 1250% risk-weight had to be applied to € 24 million exposure volume of this portfolio. Consequently, also with respect to capital requirements after the cap, the two approaches SEC-IRBA and SECSA covered the major part, therein € 690 million or 91% of the investor portfolio capital requirements. The SEC-SA covered € 430 million or 57% and the SEC-IRBA covered € 260 million or 34% of the investor portfolio capital requirements after cap of € 762 million, an increase of € 25.8 million compared to June 30, 2024 with an amount of € 736 million.
Compared to June 30, 2024, the overall securitisation exposure volume in the non-trading book increased by € 7.4 billion. That movement was mainly resulting from an increase of € 1.8 billion in the investor activities and an increase of € 5.6 billion in the originator and sponsor business, which was mainly due to new synthetic originator transactions. The two main components of that € 7.4 billion movement were an increase of € 6.5 billion within the lowest risk-weight bucket, with risk-weights below or equal to 20% and an increase of € 1.2 billion within the risk-weight bucket with risk-weights greater than 20% and lower than or equal to 50%. As a result, the overall capital requirements of the non-trading book increased by 11.1% from € 1,150 million as of June 30, 2024, to € 1,278 million by December 31, 2024.
Exposures securitized by the institution - Exposures in default and specific credit risk adjustments
Article 449 (l) CRR
The table EU SEC5 presents the outstanding nominal amounts where the Group acts as originator or sponsor along with exposures which have been classified as defaulted according to Article 178 CRR and its relating specific credit risk adjustments in accordance with Article 110 CRR. The amounts are broken down by the exposure type of the securitized exposures. The outstanding nominal amounts shown correspond to the share of the Group’s contribution to the securitized assets.
EU SEC5 – Exposures securitized by the institution - Exposures in default and specific credit risk adjustments
|
|
Dec 31, 2024 |
|||||
|
a |
b |
c |
||||
|
Exposures securitized by the institution - Institution acts as originator or as sponsor |
||||||
|
Total outstanding nominal amount |
Total amount of specific credit risk adjustments made during the period |
|||||
|
in € m. |
Total |
of which exposures in default |
||||
|
Total exposures |
150,797 |
5,433 |
259 |
|||
|
Retail (total) |
51,723 |
1,711 |
47 |
|||
|
Residential mortgage |
43,122 |
1,562 |
26 |
|||
|
Credit card |
0 |
0 |
0 |
|||
|
Other retail exposures |
8,487 |
149 |
20 |
|||
|
Re-securitization |
114 |
0 |
0 |
|||
|
Wholesale (total) |
99,075 |
3,722 |
213 |
|||
|
Loans to corporates |
36,079 |
317 |
213 |
|||
|
Commercial mortgage |
62,776 |
3,404 |
0 |
|||
|
Lease and receivables |
200 |
1 |
0 |
|||
|
Other wholesale |
0 |
0 |
0 |
|||
|
Re-securitization |
19 |
1 |
0 |
|||
167
|
Deutsche Bank |
||
|
Pillar 3 Report as of December 31, 2024 |
||
|
|
Jun 30, 2024 |
|||||
|
a |
b |
c |
||||
|
Exposures securitized by the institution - Institution acts as originator or as sponsor |
||||||
|
Total outstanding nominal amount |
Total amount of specific credit risk adjustments made during the period |
|||||
|
in € m. |
Total |
of which exposures in default |
||||
|
Total exposures |
132,659 |
5,004 |
316 |
|||
|
Retail (total) |
40,014 |
1,657 |
41 |
|||
|
Residential mortgage |
33,314 |
1,553 |
26 |
|||
|
Credit card |
0 |
0 |
0 |
|||
|
Other retail exposures |
6,585 |
104 |
15 |
|||
|
Re-securitization |
115 |
0 |
0 |
|||
|
Wholesale (total) |
92,645 |
3,347 |
275 |
|||
|
Loans to corporates |
31,712 |
259 |
275 |
|||
|
Commercial mortgage |
60,731 |
3,086 |
0 |
|||
|
Lease and receivables |
191 |
1 |
0 |
|||
|
Other wholesale |
0 |
0 |
0 |
|||
|
Re-securitization |
11 |
1 |
0 |
|||
The total outstanding nominal amount of securitized assets where the Group acted as originator or sponsor was € 150.8 billion as of December 31, 2024, an increase of € 18.1 billion compared with June 30, 2024. The key drivers were an increase in residential mortgages by € 9.8 billion and an increase of € 4.4 billion in loans to corporates. The outstanding nominal amount where the Group acted as originator contributed € 146.7 billion or 97% of the total outstanding nominal amount. The outstanding nominal amount where the Group acted as sponsor was represented by € 4.1 billion or 3% of the total outstanding amount. The total outstanding nominal amount of securitized assets consisted of € 62.8 billion commercial mortgages, € 43.1 billion residential mortgages and € 36.1 billion loans to corporates. In relative terms mortgages contributed 70% and loans to corporates 24% of the total outstanding nominal amount.
Securitized assets flagged as defaulted by December 31, 2024 added up to a total of € 5.4 billion, which were split into € 3.4 billion commercial mortgages, € 1.6 billion residential mortgages and € 0.3 billion loans to corporates. In relative terms the defaulted asset ratios were 5.4% for commercial mortgages, 3.6% for residential mortgages and 0.9% for loans to corporates. Overall, the ratio of defaulted assets in the pools of these securitizations was at 3.6%, a decrease of 0.2 percentage points compared to June 30, 2024.
168
|
Deutsche Bank |
||
|
Pillar 3 Report as of December 31, 2024 |
||
Market risk
Risk management objectives and policies
Market risk management strategies and processes
Article 435 (1)(a) CRR (EU OVA & EU MRA)
The vast majority of the Group’s businesses are subject to market risk, defined as the potential for change in the market value of the trading and invested positions. Risk can arise from changes in interest rates, credit spreads, foreign exchange rates, equity prices, commodity prices and other relevant parameters, such as market volatility and market implied default probabilities. The market risk can affect accounting, economic and regulatory views of the exposure.
Market Risk Management governance is designed and established to promote oversight of all market risks, effective decision making and timely escalation to senior management. Market Risk Management defines and implements a framework to systematically identify, assess, monitor and report the market risk. Market risk managers identify market risks through active portfolio analysis and engagement with the business units.
Market risk management structure and organization
Article 435 (1)(b) CRR (EU OVA & EU MRA)
Market Risk framework
Market Risk Management is part of the Group’s independent Risk function and sits within the Market and Valuations Risk Management group. One of the primary objectives of Market Risk Management is to ensure that the business units’ risk exposure is within the approved risk appetite commensurate with its defined strategy. To achieve this objective, Market Risk Management works closely together with risk takers (“the business units”) and other control and support groups.
The market risk can be distinguished between three substantially different types:
– Trading market risk arises primarily through the market-making and client facilitation activities of the Investment Bank division. This involves taking positions in debt, equity, foreign exchange, other securities and commodities as well as in equivalent derivatives.
– Traded default risk arising from defaults and rating migrations relating to trading instruments.
– Nontrading market risk arises from market movements, primarily outside the activities of the trading units, in the banking book and from off-balance sheet items. This includes interest rate risk, credit spread risk, investment risk and foreign exchange risk as well as market risk arising from the Group’s pension schemes, guaranteed funds and equity compensation. Nontrading market risk also includes risk from the modeling of client deposits as well as savings and loan products.
The aim is to accurately measure all types of market risks by a comprehensive set of risk metrics embedding accounting, economic and regulatory considerations.
Market risks are measured by several internally developed key risk metrics and regulatory defined market risk approaches.
Trading Market Risk
The primary mechanism to manage trading market risk is the application of the Group’s risk appetite framework of which the limit framework is a key component. The Management Board, supported by Market Risk Management, sets group-wide value-at-risk, economic capital and portfolio stress testing limits for market risk in the trading book. Market Risk Management allocates this overall appetite to the Corporate Divisions and their individual business units based on established and agreed business plans. The business aligned heads within Market Risk Management also establish business unit limits, by allocating the limit down to individual portfolios, geographical regions and types of market risks.
Value-at-risk, economic capital and portfolio stress testing limits are used for managing all types of market risk at an overall portfolio level. As an additional and important complementary tool for managing certain portfolios or risk types, Market Risk Management performs risk analysis and business specific stress testing. Limits are also set on sensitivity and concentration/liquidity, exposure, business-level stress testing and event risk scenarios, taking into consideration business plans and the risk versus return assessment.
The business units are responsible for adhering to the limits against which exposures are monitored and reported. The market risk limits set by Market Risk Management are monitored on a daily, weekly and monthly basis, dependent on the risk management tool being used.
169
|
Deutsche Bank |
||
|
Pillar 3 Report as of December 31, 2024 |
||
Nontrading Market Risk
Nontrading market risk arises primarily from activities outside of the bank’s trading units, in its banking book, and from certain off-balance sheet items, embedding considerations of different accounting treatment of transactions. Significant market risk factors the Group is exposed to and are overseen by risk management groups in that area are:
– Interest rate risk (including risk from embedded optionality and changes in behavioral patterns for certain product types), credit spread risk, foreign exchange risk, equity risk (including investments in public and private equity as well as real estate, infrastructure and fund assets).
– Market risks from off-balance sheet items, such as pension schemes and guarantees, as well as structural foreign exchange risk and equity compensation risk.
As for trading market risks the risk appetite and limit framework is also applied to manage the Group’s exposure to nontrading market risk. At Group level those are captured by the management board set limits for market risk economic capital capturing exposures to all market risks across asset classes as well as earnings and economic value based limits for interest rate risk in the banking book. Those limits are cascaded down by market risk management to the divisional or portfolio level. The limit framework for nontrading market risk exposure is further complemented by a set of business specific stress tests, value-at-risk and sensitivity limits monitored on a daily or monthly basis dependent on the risk measure being used.
Scope and nature of market risk measurement and reporting systems
Article 435 (1)(c) CRR (EU OVA & EU MRA)
The scope and nature of the market risk measurement and reporting systems are described in the section “Risk management objectives and policies – Enterprise Risk - Scope and nature of risk measurement and reporting systems” of this document.
Policies for hedging and mitigating market risk
Article 435 (1)(d) CRR (EU OVA & EU MRA)
The approach to hedging and managing market risk is governed by policies explicitly designed to ensure that all hedging activities are risk reducing, not proprietary in nature and are documented prior to trade execution. Hedging activities are reviewed by the relevant business control forum. Further description of the hedging approach for specific areas in the banking book are outlined below.
Nontrading Market Risk
Nontrading market risk arises primarily from activities outside of the bank’s trading units, in its banking book, and from certain off-balance sheet items, embedding considerations of different accounting treatment of transactions. Significant market risk factors the Group is exposed to and are overseen by risk management groups in this area have been outlined above in Section Article 435 (1)(b).
Interest Rate Risk in the Banking Book
Interest rate risk in the banking book (IRRBB) is the current or prospective risk, to both the Group's capital and earnings, arising from movements in interest rates, which affect the Group's non-trading book exposures. This includes gap risk, which arises from the term structure of banking book instruments, basis risk, which describes the impact of relative changes in interest rates for financial instruments that are priced using different interest rate curves, as well as option risk, which arises from option derivative positions or from optional elements embedded in financial instruments.
The Group manages its IRRBB exposures using economic value as well as earnings based measures. The Group Treasury function is mandated to manage the interest rate risk centrally, with Market Risk Management acting as “2nd LoD” independently assessing and challenging the implementation of the framework and adherence to the risk appetite. Group Audit in its role as the “3rd LoD” is accountable for providing independent and objective assurance on the adequacy of the design, operating effectiveness and efficiency of the risk management system and systems of internal control. The Group Asset & Liability Committee (“ALCo”) oversees and steers the Group’s structural interest risk position with particular focus on banking book risks and the management of the net interest income. The ALCo monitors the sensitivity of financial resources and associated metrics to key market parameters such as interest rate curves and oversees adherence to divisional/business financial resource limits.
Economic value based measures look at the change in economic value of banking book assets, liabilities and off-balance sheet exposures resulting from interest rate movements, independent of the accounting treatment. Thereby the Group measures the change in economic value of equity (EVE) as the maximum decrease of the banking book economic value under the six standard scenarios defined by the EBA in addition to internal stress scenarios for risk steering purposes. For the reporting of internal stress scenarios and risk appetite the Group applies a few different modelling assumptions as used in this disclosure. When aggregating the economic value of equity EVE across different currencies, the Group adds up negative and positive changes without applying weight factors for positive changes. Furthermore, the Group is using behavioral model assumptions about the interest rate duration of own equity capital as well as non-maturity deposits from financial institutions.
170
|
Deutsche Bank |
||
|
Pillar 3 Report as of December 31, 2024 |
||
Earnings-based measures look at the expected change in net interest income (NII) resulting from interest rate movements over a defined time horizon, compared to a defined benchmark scenario. Thereby the Group measures the change in net interest income (∆NII) as the maximum reduction under the six standard scenarios defined by the EBA in addition to internal stress scenarios for risk steering purposes, compared to a market implied curve scenario, over a period of 12 months.
The Group employs mitigation techniques to hedge the interest rate risk arising from nontrading positions within given limits. The interest rate risk arising from nontrading asset and liability positions is managed by Treasury (Treasury Markets & Investments team). Thereby the Group uses derivatives and applies different hedge accounting techniques such as fair value hedge accounting or cash flow hedge accounting. For fair value hedges, the Group uses interest rate swaps and options contracts to manage the fair value movements of fixed rate financial instruments due to changes in benchmark interest rate. For hedges in the context of the cash flow hedge accounting, the Group uses interest rate swaps to manage the exposure to cash flow variability of the variable rate instruments as a result of changes in benchmark interest rates.
The Group assesses and measures hedge effectiveness of a hedging relationship based on the change in the fair value or cash flows of the derivative hedging instrument relative to the change in the fair value or cash flows of the hedged item attributable to the hedged risk.
The Model Risk Management function performs independent validation of models used for IRRBB measurement, as per all market risk models, in line with Deutsche Bank’s group-wide risk governance framework.
The calculation of VaR and sensitivities of interest rate risk is performed daily, whereas the measurement and reporting of economic value interest rate and earnings risk is performed on a monthly basis. The Group generally uses the same metrics in its internal management systems as it applies for the disclosure in this report.
Deutsche Bank’s key modelling assumptions are applied to the positions in the Private Bank and Corporate Bank divisions. Those positions are subject to risk of changes in clients’ behavior with regard to their deposits as well as loan products. The Group regularly tests the assumptions and updates them where appropriate following a defined governance process. In particular, the Group has made changes to its assumptions during the early phase of rising interest rates where a slower repricing in deposits was observed than it was anticipated.
The Group manages the interest rate risk exposure of its non-maturity deposits through a replicating portfolio approach to determine the average repricing maturity of the portfolio. For the purpose of constructing the replicating portfolio, the portfolio of non-maturity deposits is clustered by dimensions such as business unit, currency, product and geographical location. The main dimensions influencing the repricing maturity are elasticity of deposit rates to market interest rates, volatility of deposit balances and observable client behavior. For the reporting period the average repricing maturity assigned across all such replicating portfolios is 2.40 years and Deutsche Bank uses 15 years as the longest repricing maturity.
In the loan and some of the term deposit products Deutsche Bank considers early prepayment/withdrawal behavior of its customers. The parameters are based on historical observations, statistical analyses and expert assessments.
Furthermore, the Group generally calculates IRRBB related metrics in contractual currencies and aggregates the resulting metrics for reporting purposes. When calculating economic value based metrics the commercial margin is excluded for material parts of the balance sheet.
Credit Spread Risk in the Banking Book
Deutsche Bank is exposed to credit spread risk of bonds held in the banking book, mainly as part of the Treasury Liquidity Reserves portfolio. The credit spread risk in the banking book is managed by the businesses, with Market Risk Management acting as an independent oversight function ensuring that the exposure is within the approved risk appetite. This risk category is closely associated with interest rate risk in the banking book as changes in the perceived credit quality of individual instruments may result in fluctuations in spreads relative to underlying interest rates. The calculation of credit spread sensitivities and value-at-risk for credit spread exposure is in general performed on a daily basis, the measurement and reporting of economic capital and stress tests are performed on a monthly basis.
Foreign exchange risk
Foreign exchange risk arises from the bank’s nontrading asset and liability positions that are denominated in currencies other than the functional currency of the respective entity. The majority of this foreign exchange risk is transferred through internal hedges to trading books within the Investment Bank division and is therefore reflected and managed via the value-at-risk figures in the trading books. The remaining foreign exchange risks that have not been transferred are mitigated through match funding the investment in the same currency, so that only residual risk remains in the portfolios. Small exceptions to the above approach follow the general Market Risk Management monitoring and reporting process, as outlined for the trading portfolio.
The bulk of nontrading foreign exchange risk is related to unhedged structural foreign exchange exposure, mainly in the U.S., U.K. and China entities. Structural foreign exchange exposure arises from local capital (including retained earnings) held in the Group’s consolidated subsidiaries and branches and from investments accounted for at equity. Change in foreign exchange rates of the underlying functional currencies are booked as Currency Translation Adjustments (CTA).
171
|
Deutsche Bank |
||
|
Pillar 3 Report as of December 31, 2024 |
||
The primary objective for managing the structural foreign exchange exposure is to stabilize consolidated capital ratios from the effects of fluctuations in exchange rates. Therefore, the exposure remains unhedged or partially hedged for a number of currencies with considerable amounts of risk-weighted assets denominated in that currency in order to avoid volatility in the capital ratio for the specific entity and the Group as a whole.
Equity and investment risk
Nontrading equity risk arises predominantly from the non-consolidated investment holdings in the banking book and from the equity compensation plans.
The Group’s non-consolidated equity investment holdings in the banking book are categorized into strategic and alternative investment assets. Strategic investments typically relate to acquisitions made to support the business franchise and are undertaken with a medium to long-term investment horizon. Alternative assets are comprised of principal investments and other non-strategic investment assets. Principal investments are direct investments in private equity, real estate, venture capital, hedge or mutual funds whereas assets recovered in the workout of distressed positions or other legacy investment assets in private equity and real estate are of a non-strategic nature.
Investment proposals for strategic investments as well as monitoring of progress and performance against committed targets are evaluated by the Group Investment Committee. Depending on size, strategic investments may require approval from the Group Investment Committee, the Management Board or the Supervisory Board.
CRM Principal Investments is responsible for the risk-related governance and monitoring of the Group’s alternative asset activities. The review of new or increased principal investment commitments is the task of the Principal Investment Commitment Approval Group, established by the Enterprise Risk Committee as a risk management forum for alternative asset investments. The Principal Investment Commitment Approval Group approves investments under its authority or recommends decisions above its authority to the Management Board for approval. The Management Board also sets investment limits for business divisions and various portfolios of risk upon recommendation by the Enterprise Risk Committee.
The equity investment holdings are included in regular group wide stress tests and the monthly market risk economic capital calculations.
Pension risk
The Group is exposed to market risks from defined benefit pension schemes for past and current employees. Market risks in pension plans materialize due to a potential decline in the market value of plan assets or an increase in the present value of the pension liability of each of the pension plans. Market Risk Management is responsible for a regular measurement, monitoring, reporting and control of market risks of the asset and liability side of the defined benefit pension plans. Thereby, market risks in pension plans include but are not restricted to interest rate risk, inflation risk, credit spread risk, equity risk, and longevity risk.
Other risks in the Banking Book
Market risks in Asset Management business division primarily result from principal guaranteed funds or accounts, but also from co-investments in the Group’s funds.
172
|
Deutsche Bank |
||
|
Pillar 3 Report as of December 31, 2024 |
||
Own funds requirements under the Market Risk Standardized Approach
Article 445 CRR
As of December 31, 2024, the securitization positions, for which the specific interest rate risk is calculated using the market risk standardized approach, generated capital requirements of € 245 million corresponding to risk weighted-assets of € 3.1 billion. As of June 30, 2024 these positions generated capital requirements of € 239 million corresponding to risk weighted-assets of € 3.0 billion.
The capital requirement for Collective Investment Undertakings under the market risk standardized approach was € 9 million corresponding to risk weighted-assets of € 111 million as of December 31, 2024, compared with € 24 million and € 302 million, respectively, as of June 30, 2024.
EU MR1 – Market risk under the standardized approach
|
|
Dec 31, 2024 |
Jun 30, 2024 |
|||||
|
a |
a |
||||||
|
in € m. |
RWA |
RWA |
|||||
|
Outright products |
|||||||
|
1 |
Interest rate risk (general and specific)1 |
97 |
237 |
||||
|
2 |
Equity risk (general and specific)2 |
51 |
73 |
||||
|
3 |
Foreign exchange risk3 |
144 |
163 |
||||
|
4 |
Commodity risk |
0 |
0 |
||||
|
Options |
|||||||
|
5 |
Simplified approach |
0 |
0 |
||||
|
6 |
Delta-plus method |
0 |
0 |
||||
|
7 |
Scenario approach |
0 |
0 |
||||
|
8 |
Securitization (specific risk) |
3,068 |
2,984 |
||||
|
9 |
Total |
3,359 |
3,457 |
||||
1 Interest Rate risk RWA includes € 39 million from collective investment undertakings and € 58 million as per Article 325b of CRR which relates to consolidation of exposures of certain legal entities for own funds requirements.
2 Equity risk RWA of € 51 million is from collective investment undertakings.
3 Foreign Exchange risk RWA includes € 21 million from collective investment undertakings and € 122 million related to placeholders for foreign exchange exposures
Qualitative information on the internal model approach
Characteristics of the market risk models
Article 455 (a)(i) CRR (EU MRB)
Market Risk Management aims to accurately measure all types of market risks by a comprehensive set of risk metrics reflecting economic and regulatory requirements. In accordance with economic and regulatory requirements, the Group measures market and related risks using several key risk metrics listed below:
Internally developed market risk models
– Value-at-risk (“VaR”) and stressed value-at-risk (“SVaR”), including CVA VaR and SVaR
– Incremental risk charge
Market risk standardized approaches
– Market Risk Standardized Approach (MRSA), applied to investment funds with no look through, MRSA-eligible securitizations and positions subject to longevity risk
Stress testing measures
– Portfolio stress testing
– Business-level stress testing
– Event risk scenarios
Economic capital measures
– Market risk economic capital, including traded default risk
Other model derived and market observable metrics
– Sensitivities
– Market value/notional (concentration risk)
– Loss given default
These measures are viewed as complementary to each other and in aggregate define the market risk framework, by which all businesses can be measured and monitored.
173
|
Deutsche Bank |
||
|
Pillar 3 Report as of December 31, 2024 |
||
Value-at-Risk (VaR) at Deutsche Bank Group
VaR is a quantitative measure of the potential loss (in value) of Fair Value positions due to market movements that should not be exceeded in a defined period of time and with a defined confidence level.
The Group’s value-at-risk for the trading businesses is based on historical simulation model (internal model approach). Further details about the regulatory model approval are outlined in the disclosures to Article 455 (b).
The historical simulation approach provides more accurate modelling of the risks, enhances the Group’s analysis capabilities and provides a more effective tool for risk management. Aside from enabling a more accurate view of market risk, the implementation of historical simulation VaR has brought about an even closer alignment of the market risk systems and models to the end of day pricing.
Risk management VaR is calibrated to a 99 % confidence level and a one day holding period. This indicates a 1 in 100 chance that a mark-to-market loss from the trading positions will be at least as large as the reported VaR. For regulatory capital purposes, the VaR model is calibrated to a 99 % confidence interval and a ten day holding period.
The calculation employs a historical simulation technique that uses one year of historical market data as input and observed correlations between the risk factors during this one year period.
The VaR model is designed to take into account a comprehensive set of risk factors across all asset classes. Key risk factors are swap/government curves, index and issuer-specific credit curves, single equity and index prices, foreign exchange rates, commodity prices as well as their implied volatilities. To help ensure completeness in the risk coverage, second order risk factors, e.g. money market basis, implied dividends, option-adjusted spreads and precious metals lease rates are also considered in the VaR calculation. The list of risk factors included in the VaR model is reviewed regularly and enhanced as part of ongoing model performance reviews.
The model incorporates both linear and, especially for derivatives, nonlinear impacts predominantly through a full revaluation approach but it also utilizes a sensitivity-based approach for certain portfolios. The full revaluation approach uses the historical changes to risk factors as input to pricing functions. The sensitivity based approach uses sensitivities to underlying risk factors in combination with historical changes to those risk factors.
For each business unit a separate VaR is calculated for each risk type, e.g. interest rate risk, credit spread risk, equity risk, foreign exchange risk and commodity risk. “Diversification effect” reflects the fact that the total VaR on a given day will be lower than the sum of the VaR relating to the individual risk types. Simply adding the VaR figures of the individual risk types to arrive at an aggregate VaR would imply the assumption that the losses in all risk types occur simultaneously.
The VaR enables the Group to apply a consistent measure across the fair value exposures. It allows a comparison of risk in different businesses, and also provides a means of aggregating and netting positions within a portfolio to reflect correlations and offsets between different asset classes. Furthermore, it facilitates comparisons of the market risk both over time and against the daily trading results.
When using VaR results a number of considerations should be taken into account. These include:
– The use of historical market data may not be a good indicator of potential future events, particularly those that are extreme in nature; this “backward-looking” limitation can cause VaR to understate future potential losses (as in 2008), but can also cause it to be overstated immediately following a period of significant stress (as in post COVID-19)
– The one day holding period does not fully capture the market risk arising during periods of illiquidity, when positions cannot be closed out or hedged within one day
– VaR does not indicate the potential loss beyond the 99th quantile
– Intra-day risk is not reflected in the end of day VaR calculation
– There may be risks in the trading or banking book that are partially or not captured by the VaR model
The process of systematically capturing and evaluating risks currently not captured in the VaR model has been further developed and improved. An assessment is made to determine the level of materiality of these risks and material items are prioritized for inclusion in the internal model. Risks not in VaR are monitored and assessed on a regular basis through the Risk Not In VaR (RNIV) framework. This framework is consistent with the Historical Simulation approach which in turn yields a more accurate estimate of the contribution of these missing items and their potential capitalization.
The bank is committed to the ongoing development of the internal risk models, and allocates substantial resources to reviewing, validating and improving them.
174
|
Deutsche Bank |
||
|
Pillar 3 Report as of December 31, 2024 |
||
Stressed Value-at-Risk (SVaR)
Stressed Value-at-Risk (SVaR) calculates a stressed value-at-risk measure based on a one year period of significant market stress. The Group calculates a stressed value-at-risk measure using a 99 % confidence level. Stressed VaR is calculated with a holding period of ten days. The SVaR calculation utilizes the same systems, trade information and processes as those used for the calculation of value-at-risk. The only difference is that historical market data and observed correlations from a period of significant financial stress (i.e., characterized by high volatilities) is used as an input for the historical simulation.
The stress period selection process for the stressed value-at-risk calculation is based on the comparison of VaR calculated using historical time windows compared to the current SVaR. If a historical window produces a VaR which is higher than the current SVaR, it is further investigated and the SVaR window can then subsequently be updated accordingly. This process runs on a quarterly basis.
During 2024, the stress period selection process for Deutsche Bank Group was conducted as outlined above. As a result, the SVaR window used at various periods in 2024 included the financial credit crisis of 2008/09, the European sovereign crisis of 2011/12 and the more recent COVID-19 stress period of 2020.
CVA Value-at-Risk/ Stressed Value-at-Risk
The advanced approach CVA risk capital charge is determined by applying the VaR model. First, the exposure profiles are determined based on the internal model method (IMM) or the mark-to-market method. The next step consists in determining the synthetic CVA position based on the exposure profile and other risk parameters such as credit spreads. Based on this information the credit spread sensitivity is then calculated. Eligible CVA hedges are also incorporated and the CVA risk capital charge is determined based on the internal market risk models VaR and Stressed VaR using a 99 % confidence level and a 10-day holding period.
Incremental risk charge
Article 455 (a)(ii),(f) CRR and EU MRB
The incremental risk charge (IRC) is based on the bank’s internal model and is intended to complement the value-at-risk modeling framework. The bank uses a Monte Carlo Simulation for calculating incremental risk charge as the 99.9 % quantile of the portfolio loss distribution for allocating contributory incremental risk charge to individual positions. The assessment is performed over a one year capital horizon under a constant position approach which corresponds to applying a 12 months liquidity horizon to all instruments. The model captures the default and migration risk in an accurate and consistent quantitative approach for all portfolios. Important parameters for the incremental risk charge calculation are exposures, recovery rates, maturity, ratings with corresponding default and migration probabilities and parameters specifying issuer correlations.
The incremental risk charge is calculated on a weekly basis. For regulatory reporting purposes, the charge is determined as the higher of the most recent 12 week average of incremental risk charge and the most recent incremental risk charge.
The contributory incremental risk charge of individual positions, which is calculated by expected shortfall allocation, provides the basis for identifying risk concentrations in the portfolio.
Default and rating migration probabilities are defined by rating migration matrices which are calibrated on historical external rating data. Taking into account the trade-off between granularity of matrices and their stability, the model applies a global corporate matrix and a sovereign matrix comprising the seven main rating non-default states and one default state. Accordingly, issue or issuer ratings from the rating agencies Moody’s, S&P and Fitch are assigned to each position.
To quantify a loss due to rating migration, a revaluation of a position is performed under the new rating. The probability of joint rating downgrades and defaults is determined by the migration and rating correlations of the incremental risk charge model. These correlations are specified through systematic factors that represent geographical regions and industries and are calibrated on historical rating migration and equity time series. The simulation is based on the assumption of a constant position approach where differences in maturities of long and short positions are taken into account. As the default state is absorbing, defaulted positions do not generate any further losses from rating migrations. The price risk of defaulted debt is modeled by stochastic recoveries.
Direct validation of the incremental risk charge through back-testing methods is not possible. The charge is subject to validation principles such as the evaluation of conceptual soundness, ongoing monitoring and process and outcome analysis. Model validation relies more on indirect methods including stress tests and sensitivity analyses. Relevant parameters are included in the annual validation cycle established in the current regulatory framework.
Market risk stress testing
Article 455 (a)(iii) CRR (EU MRB)
Stress testing is a key risk management technique, which evaluates the potential effects of extreme market events and extreme movements in individual risk factors. It is one of the core quantitative tools used to assess the market risk of Deutsche Bank’s positions and complements VaR and Economic Capital. Market Risk Management performs several types of stress testing to capture a variety of risks: portfolio stress testing, individual specific stress tests, event risk scenarios, and also contributes to group wide stress testing. These are set at varying severities ranging from mild for earning stability purposes to extreme for capital adequacy assessment. The bank also participates in a number of Regulatory Stress Tests such as EBA, CCAR and MAS. In 2023 Deutsche Bank developed Market risk’s first Climate Stress test.
175
|
Deutsche Bank |
||
|
Pillar 3 Report as of December 31, 2024 |
||
Portfolio stress testing measures the profit and loss impact of potential market events based on a broad range of historical or hypothetical macro-economic scenarios considered to be severe and plausible. It is used to manage systemic tail risk and informs on earnings stability and capital resilience.
For individual specific stress tests, market risk managers identify relevant idiosyncratic risk factors and develop stress scenarios relating either to macro-economic or business-specific developments. Event risk scenario measures the impact of historically observable events or hypothetical situations on trading positions for specific emerging market countries and regions.
In addition, Market Risk Management participates in the group wide stress test process, where macro-economic scenarios are defined by Enterprise Risk Management Risk Research and each risk department translates that same scenario to the relevant shocks required to apply to their portfolio. This includes credit, market, operational and liquidity risks.
Methodology for backtesting and model validation
Article 455 (a)(iv) CRR (EU MRB)
The Group continually analyzes potential weaknesses of the value-at-risk model using statistical techniques, such as backtesting, and also rely on risk management experience.
Backtesting is a procedure used to assess the predictive accuracy of the value-at-risk calculations involving the comparison of hypothetical daily profits and losses under the buy-and-hold assumption (‘daily buy-and hold income’) to the daily value-at-risk. Under this assumption, the P&L impact on a portfolio for a trading day valued with current market prices and parameters assuming it had been left untouched for that day is estimated and compared with the estimates from the value-at-risk model from the preceding day. The calculation of hypothetical daily profits and losses (buy & hold income) excludes gains and losses from intraday trading, fees and commissions, carry (including net interest margins), reserves and other miscellaneous revenues. An outlier is a hypothetical buy-and-hold trading loss that exceeds the value-at-risk from the preceding day. Backtesting is also carried out by comparing daily value-at-risk to actual income where actual income represents total P&L excluding fees, commissions, NII and credit and debt valuation adjustments but includes intraday trading. On average, 99% confidence level should give rise to two to three outliers (calculated as maximum of outliers on buy & hold or actual income) representing 1% of approximately 260 trading days in any one year. Market risk analyzes and documents underlying reasons for outliers and classifies them either as due to market movements, risks not included in the value-at-risk model, model or process shortcomings. The results are used for further enhancement of the value-at-risk methodology. Formal communications explaining the reasons behind any outlier on Group level are provided to the BaFin and the ECB.
In addition to the standard backtesting analysis at the value-at-risk quantile, the value-at-risk model performance is further verified by analyzing the distributional fit across the whole of the distribution (full distribution backtesting). Regular backtesting is also undertaken on hypothetical portfolios to test value-at-risk performance of particular products and their hedges.
There are various Backtesting forums, with participation from Market Risk Management, Market Risk Analysis and Control, Model Validation, and Finance, that regularly review backtesting results as a whole and of individual businesses. They analyze performance fluctuations and assess the predictive power of the value-at-risk model, which allows the bank to improve and adjust the risk estimation process accordingly.
A model validation team reviews all quantitative aspects of the Value-at-Risk model on a regular basis. The review covers, but is not limited to, model assumptions, calibration approaches for risk parameters, and model performance.
Regulatory approval for market risk models
Article 455 (b) CRR (EU MRB)
The Group’s value-at-risk for the trading businesses is based on historical simulation model (internal model approach) predominantly utilizing full revaluation, although some portfolios remain on a sensitivity-based approach. The approach is used for both Risk Management and capital requirements. This model is also used for regulatory capital calculations for CVA VaR and SVaR.
The Group also has approval to use the internally-developed models described above in the calculation of regulatory capital for the Incremental Risk Charge.
Trading book allocation and prudent valuation
Article 455 (c) CRR (EU MRB)
For regulatory purposes all of Deutsche Bank’s positions must be assigned to either the trading book or the banking book. This classification of a position impacts its regulatory treatment, in particular the calculation of the regulatory capital charges for the position.
176
|
Deutsche Bank |
||
|
Pillar 3 Report as of December 31, 2024 |
||
We define the criteria for the allocation of positions to either the trading book or banking book in internal policy documents, which are based on the respective requirements applicable to the Group contained in Articles 102 to 106 of the CRR. In line with the opinion of the EBA on the application of the provisions relating to the boundary between trading book and banking book, and on the internal risk transfer between books as referred to in Article 3 (6) of Regulation (EU) No 2019/876 (EBA/Op/2023/02) we continue to apply the rules on reclassifications and internal hedges as defined by Regulation (EU) No 575/2013 prior to the amendments introduced by Regulation (EU) No 2019/876.A central function in Finance is responsible for the policy guidance and is the center of competence with regard to questions concerning its application. The Finance functions for the individual business areas are responsible for the classification of positions in line with the policy requirements.
We include positions in the trading book that are financial instruments or commodities which are held with trading intent or which are held for the purpose of hedging other trading book positions. Positions included in the trading book must be free of any restrictive covenants regarding their transferability or able to be hedged. Moreover, positions assigned to the trading book must be revalued daily and changes in the value of those positions must be reported in the profit and loss account. Further information on the valuation methodology that we use is provided below.
As part of the ongoing procedures to confirm that the inclusion of positions in the trading book continues to be in line with the above referenced internal policy guidance, the Finance functions for the bank’s trading businesses carry out a global review of the classification of positions on a quarterly basis. The results of the review are documented and presented to the respective Divisional Control Forums with representatives from Finance.
Re-allocations of positions between the trading book and the banking book may only be carried out in line with the internal policy guidance. They must be documented and are subject to approval by the heads of the Finance functions for the respective business areas.
Prudent valuation
The Group has an established valuation control framework which governs internal control standards, methodologies, and procedures over the valuation process.
Prices Quoted in Active Markets – The fair value of instruments that are quoted in active markets are determined using the quoted prices where they represent prices at which regularly and recently occurring transactions take place.
Valuation Techniques – The Group uses valuation techniques to establish the fair value of instruments where prices, quoted in active markets, are not available. Valuation techniques used for financial instruments include modelling techniques, the use of indicative quotes for proxy instruments, quotes from recent and less regular transactions and broker quotes.
For some financial instruments a rate or other parameter, rather than a price, is quoted. Where this is the case then the market rate or parameter is used as an input to a valuation model to determine fair value. For some instruments, modelling techniques follow industry standard models, for example, discounted cash flow analysis and standard option pricing models. These models are dependent upon estimated future cash flows, discount factors and volatility levels. For more complex or unique instruments, more sophisticated modelling techniques are required, and may rely upon assumptions or more complex parameters such as correlations, prepayment speeds, default rates and loss severity.
Frequently, valuation models require multiple parameter inputs. Where possible, parameter inputs are based on observable data or are derived from the prices of relevant instruments traded in active markets. Where observable data is not available for parameter inputs, then other market information is considered. For example, indicative broker quotes and consensus pricing information are used to support parameter inputs where they are available. Where no observable information is available to support parameter inputs then they are based on other relevant sources of information such as prices for similar transactions, historic data, economic fundamentals, and research information, with appropriate adjustment to reflect the terms of the actual instrument being valued and current market conditions.
Valuation Adjustments – Valuation adjustments are an integral part of the valuation process. In making appropriate valuation adjustments, the Group follows methodologies that consider factors such as bid-offer spreads, counterparty/own credit and funding risk. Bid-offer spread valuation adjustments are required to adjust mid-market valuations to the appropriate bid or offer valuation. The bid or offer valuation is the best representation of the fair value for an instrument, and therefore its fair value. The carrying value of a long position is adjusted from mid to bid, and the carrying value of a short position is adjusted from mid to offer. Bid-offer valuation adjustments are determined from bid-offer prices observed in relevant trading activity and in quotes from other broker-dealers or other knowledgeable counterparties. Where the quoted price for the instrument is already a bid-offer price then no additional bid-offer valuation adjustment is necessary. Where the fair value of financial instruments is derived from a modelling technique, then the parameter inputs into that model are normally at a mid-market level. Such instruments are generally managed on a portfolio basis and, when specified criteria are met, valuation adjustments are taken to reflect the cost of closing out the net exposure the Bank has to individual market or counterparty risks. These adjustments are determined from bid-offer prices observed in relevant trading activity and quotes from other broker-dealers.
177
|
Deutsche Bank |
||
|
Pillar 3 Report as of December 31, 2024 |
||
Where complex valuation models are used, or where less-liquid positions are being valued, then bid-offer levels for those positions may not be available directly from the market, and therefore for the close-out cost of these positions, models and parameters must be estimated. When these adjustments are designed, the Group closely examines the valuation risks associated with the model as well as the positions themselves, and the resulting adjustments are closely monitored on an ongoing basis.
CVAs are required to cover expected credit losses to the extent that the valuation technique does not already include an expected credit loss factor relating to the non-performance risk of the counterparty. The CVA amount is applied to all relevant over-the-counter (OTC) derivatives, and is determined by assessing the potential credit exposure to a given counterparty and taking into account any collateral held, the effect of any relevant netting arrangements, expected loss given default and the probability of default, based on available market information, including CDS spreads. Where counterparty CDS spreads are not available, relevant proxies are used.
The fair value of the Group’s financial liabilities at fair value through profit or loss (i.e., OTC derivative liabilities and issued note liabilities designated at fair value through profit or loss) incorporates valuation adjustments to measure the change in the Group’s own credit risk (i.e. debt valuation adjustments (DVA) for derivatives and own credit adjustment (OCA) for structured notes). For derivative liabilities the Group considers its own creditworthiness by assessing all counterparties’ expected future exposure to the Group, taking into account any collateral posted by the Group, the effect of relevant netting arrangements, the probability of default of the Group, based on the Group’s market CDS level and the expected loss given default, taking into account the seniority of derivative claims under resolution (statutory subordination). Issued note liabilities are discounted utilizing the spread at which similar instruments would be issued or bought back at the measurement date as this reflects the value from the perspective of a market participant who holds the identical item as an asset. This spread is further parameterized into a market level of funding component and an idiosyncratic own credit component. Under IFRS 9 the change in the own credit component is reported under Other Comprehensive Income (OCI).
When determining CVA and DVA, additional adjustments are made where appropriate to achieve fair value, due to the expected loss estimate of a particular arrangement, or where the credit risk being assessed differs in nature to that described by the available CDS instrument.
Funding valuation adjustments (FVA) are required to incorporate the market implied funding costs into the fair value of derivative positions. The FVA reflects a discounting spread applied to uncollateralized and partially collateralized derivatives and is determined by assessing the market-implied funding costs on both assets and liabilities.
Where there is uncertainty in the assumptions used within a modelling technique, an additional adjustment is taken to calibrate the model price to the expected market price of the financial instrument. Typically, such transactions have bid-offer levels which are less observable, and these adjustments aim to estimate the bid-offer by computing the liquidity-premium associated with the transaction. Where a financial instrument is of sufficient complexity that the cost of closing it out would be higher than the cost of closing out its component risks, then an additional adjustment is taken to reflect this.
Valuation Control – The Group has an independent specialized valuation control group within the Risk function which governs and develops the valuation control framework and manages the valuation control processes. The mandate of this specialist function includes the performance of the independent valuation control process for all businesses, the continued development of valuation control methodologies and techniques, as well as devising and governing the formal valuation control policy framework. Special attention of this independent valuation control group is directed to areas where management judgment forms part of the valuation process.
Results of the valuation control process are collected and analyzed as part of a standard monthly reporting cycle. Variances of differences outside of preset and approved tolerance levels are escalated both within the Finance function and with Senior Business Management for review, resolution and, if required, adjustment.
For instruments where fair value is determined from valuation models, the assumptions and techniques used within the models are independently validated by an independent specialist model validation group that is part of the Group’s Risk Management function.
Quotes for transactions and parameter inputs are obtained from a number of third party sources including exchanges, pricing service providers, firm broker quotes and consensus pricing services. Price sources are examined and assessed to determine the quality of fair value information they represent, with greater emphasis given to those possessing greater valuation certainty and relevance. The results are compared against actual transactions in the market to ensure the model valuations are calibrated to market prices.
Price and parameter inputs to models, assumptions and valuation adjustments are verified against independent sources. Where they cannot be verified to independent sources due to lack of observable information, the estimate of fair value is subject to procedures to assess its reasonableness. Such procedures include performing revaluation using independently generated models (including where existing models are independently recalibrated), assessing the valuations against appropriate proxy instruments and other benchmarks, and performing extrapolation techniques. Assessment is made as to whether the valuation techniques produce fair value estimates that are reflective of market levels by calibrating the results of the valuation models against market transactions where possible.
178
|
Deutsche Bank |
||
|
Pillar 3 Report as of December 31, 2024 |
||
Regulatory prudent valuation of assets carried at fair value
Pursuant to Article 34 CRR institutions shall apply the prudent valuation requirements of Article 105 CRR to all assets measured at fair value and shall deduct from CET 1 capital the amount of any additional value adjustments necessary.
Deutsche Bank determined the amount of the additional value adjustments based on the methodology defined in the Commission Delegated Regulation (EU) 2016/101.
As of December 31, 2024, the amount of the additional value adjustments was € 1.7 billion. The December 31, 2023, amount was € 1.7 billion. No material changes noted year-on-year.
As of December 31, 2024, the reduction of the expected loss from subtracting the additional value adjustments was € 96 million, which partly mitigated the negative impact of the additional value adjustments on our CET 1 capital.
Own funds requirements for market risk under the IMA
Regulatory capital requirements for market risk
Article 455 (e) CRR
The table below presents all internal model-related components relevant for the capital requirement calculation for market risk.
EU MR2-A – Market Risk under the internal models approach (IMA)
|
|
Dec 31, 2024 |
Jun 30, 2024 |
||||||||
|
a |
b |
a |
b |
|||||||
|
in € m. |
RWA |
Capital |
RWA |
Capital |
||||||
|
1 |
VaR (higher of values a and b) |
2,705 |
216 |
3,209 |
257 |
|||||
|
a) |
Previous day's VaR (Article 365(1) (VaRt-1)) |
– |
63 |
– |
64 |
|||||
|
b) |
Multiplication factor (mc) x average of previous 60 working days (VaRavg) |
– |
216 |
– |
257 |
|||||
|
2 |
SVaR (higher of values a and b) |
6,204 |
496 |
7,292 |
583 |
|||||
|
a) |
Latest SVaR (sVaRt-1) |
– |
230 |
– |
123 |
|||||
|
b) |
Multiplication factor (ms) x average of previous 60 working days (sVaRavg) |
– |
496 |
– |
583 |
|||||
|
3 |
Incremental risk charge -IRC (higher of values a and b) |
6,268 |
501 |
7,217 |
577 |
|||||
|
a) |
Most recent IRC value |
– |
501 |
– |
509 |
|||||
|
b) |
12 weeks average IRC measure |
– |
490 |
– |
577 |
|||||
|
4 |
Comprehensive Risk Measure – CRM (higher of values a, b and c) |
– |
– |
– |
– |
|||||
|
a) |
Most recent risk measure of comprehensive risk measure |
– |
– |
– |
– |
|||||
|
b) |
12 weeks average of comprehensive risk measure |
– |
– |
– |
– |
|||||
|
c) |
Comprehensive risk measure Floor |
– |
– |
– |
– |
|||||
|
5 |
Other |
428 |
34 |
555 |
44 |
|||||
|
6 |
Total |
15,605 |
1,248 |
18,272 |
1,462 |
|||||
1 Includes Risk not in VaR
As of December 31, 2024, the Internal Models Approach (IMA) components for market risk totaled € 15.6 billion, which is a decrease of € 2.7 billion since June 30, 2024. The decrease was driven by lower value-at-risk RWA due to roll-off of high market volatility period of Q2 2023 from the historical VaR observation period and lower stressed value-at-risk RWA due to overall reduced risk levels in Q4 2024 under Fixed Income and Currencies Trading business. Similarly, reduction in incremental risk charge RWA is driven by reduced risk levels under Fixed Income and Currencies Trading business.
Development of market risk RWA
Article 438 (h) CRR
The following table provides an analysis of key drivers for movements observed for market risk RWA covered by internal models (i.e. value-at-risk, stressed value-at-risk, incremental risk charge and comprehensive risk measure) in the current and previous reporting period. It also shows the corresponding movements in capital requirements, derived from RWA with an 8% capital ratio.
179
|
Deutsche Bank |
||
|
Pillar 3 Report as of December 31, 2024 |
||
EU MR2-B – RWA flow statements of market risk exposures under the IMA
|
|
Three months ended Dec 31, 2024 |
|||||||||||||||
|
a |
b |
c |
d |
e |
f |
g |
||||||||||
|
in € m. |
VaR |
SVaR |
IRC |
Compre- |
Other² |
Total RWA |
Total capital |
|||||||||
|
1 |
Market Risk RWA opening balance |
2,570 |
11,167 |
8,003 |
– |
719 |
22,460 |
1,797 |
||||||||
|
1a |
Regulatory adjustment¹ |
(1,848) |
(8,254) |
(1,802) |
– |
0 |
(11,904) |
(952) |
||||||||
|
1b |
RWA at the previous quarter-end (end of the day) |
722 |
2,913 |
6,201 |
– |
719 |
10,556 |
844 |
||||||||
|
2 |
Movement in risk levels |
67 |
(29) |
67 |
– |
(292) |
(186) |
(15) |
||||||||
|
3 |
Model updates/changes |
0 |
(36) |
0 |
– |
0 |
(36) |
(3) |
||||||||
|
4 |
Methodology and policy |
0 |
0 |
0 |
– |
0 |
0 |
0 |
||||||||
|
5 |
Acquisitions and disposals |
0 |
0 |
0 |
– |
0 |
0 |
0 |
||||||||
|
6 |
Foreign exchange movements |
0 |
0 |
0 |
– |
0 |
0 |
0 |
||||||||
|
6a |
Market data changes and recalibrations |
1 |
28 |
0 |
– |
0 |
29 |
2 |
||||||||
|
7 |
Other |
0 |
0 |
0 |
– |
0 |
0 |
0 |
||||||||
|
8a |
RWA at the end of the reporting period (end of the day) |
791 |
2,875 |
6,268 |
– |
428 |
10,362 |
829 |
||||||||
|
8b |
Regulatory adjustment¹ |
1,914 |
3,328 |
0 |
– |
0 |
5,243 |
419 |
||||||||
|
8 |
Market Risk RWA closing balance |
2,705 |
6,204 |
6,268 |
– |
428 |
15,605 |
1,248 |
||||||||
1 Indicates the difference between reported RWA (based on 60day average) and RWA (based on VaR / SVaR as of quarter-end) at the beginning (1b) and end (8a) of the reporting period.
2 Includes Risk not in VaR
|
|
Three months ended Sep 30, 2024 |
|||||||||||||||
|
a |
b |
c |
d |
e |
f |
g |
||||||||||
|
in € m. |
VaR |
SVaR |
IRC |
Compre- |
Other² |
Total RWA |
Total capital |
|||||||||
|
1 |
Market Risk RWA opening balance |
3,209 |
7,292 |
7,217 |
– |
555 |
18,272 |
1,462 |
||||||||
|
1a |
Regulatory adjustment¹ |
(2,414) |
(5,748) |
(858) |
– |
0 |
(9,021) |
(722) |
||||||||
|
1b |
RWA at the previous quarter-end (end of the day) |
795 |
1,544 |
6,358 |
– |
555 |
9,251 |
740 |
||||||||
|
2 |
Movement in risk levels |
32 |
551 |
(157) |
– |
67 |
493 |
39 |
||||||||
|
3 |
Model updates/changes |
0 |
0 |
0 |
– |
97 |
97 |
8 |
||||||||
|
4 |
Methodology and policy |
0 |
0 |
0 |
– |
0 |
0 |
0 |
||||||||
|
5 |
Acquisitions and disposals |
0 |
0 |
0 |
– |
0 |
0 |
0 |
||||||||
|
6 |
Foreign exchange movements |
0 |
0 |
0 |
– |
0 |
0 |
0 |
||||||||
|
6a |
Market data changes and recalibrations |
(104) |
818 |
0 |
– |
0 |
714 |
57 |
||||||||
|
7 |
Other |
0 |
0 |
0 |
– |
0 |
0 |
0 |
||||||||
|
8a |
RWA at the end of the reporting period (end of the day) |
722 |
2,913 |
6,201 |
– |
719 |
10,556 |
844 |
||||||||
|
8b |
Regulatory adjustment¹ |
1,848 |
8,254 |
1,802 |
– |
0 |
11,904 |
952 |
||||||||
|
8 |
Market Risk RWA closing balance |
2,570 |
11,167 |
8,003 |
– |
719 |
22,460 |
1,797 |
||||||||
1 Indicates the difference between reported RWA (based on 60day average) and RWA (based on VaR / SVaR as of quarter-end) at the beginning (1b) and end (8b) of the reporting period.
The market risk RWA movements due to position changes are represented in line “Movement in risk levels”. Changes to the Group’s market risk RWA internal models, such as methodology enhancements or risk scope extensions, are included in the category of “Model updates/changes”. In the “Methodology and policy” category the Group reflects regulatory driven changes to its market risk RWA models and calculations. Significant acquisitions and disposals would be assigned to the line item “Acquisition and disposals”. The impacts of “Foreign exchange movements” are not calculated for IMA (Internal Models Approach) components. Changes in market data levels, return assumptions for negative market levels, volatilities, correlations, liquidity and ratings are included under the “Market data changes and recalibrations” category.
As of December 31, 2024, the IMA components for market risk totaled € 15.6 billion, a decrease of € 6.9 billion since September 30, 2024. The decrease in RWA is driven by lower stressed value-at-risk (60 day average) and incremental risk charge due to overall reduced risk levels in Q4 2024 under Fixed Income and Currencies Trading business.
Other quantitative information for market risk under the internal models approach
Overview of Value-at-Risk Metrics
Article 455 (d) CRR
The following table, EU MR3, displays the maximum, minimum, average and the ending for the reporting period values resulting from the different types of models. This table is based on the spot values of the metrics as opposed to the regulatory defined calculation (e.g. not considering any comparisons between spot and average values used in the actual RWA calculations). The VaR and SVaR are both based on ten day holding periods.
180
|
Deutsche Bank |
||
|
Pillar 3 Report as of December 31, 2024 |
||
EU MR3 – IMA values for trading portfolios1
|
|
|
Dec 31, 2024 |
Jun 30, 2024 |
|||
|
in € m. |
a |
a |
||||
|
VaR (10 day 99 %) |
||||||
|
1 |
Maximum value |
97.2 |
119.9 |
|||
|
2 |
Average value |
60.3 |
83.5 |
|||
|
3 |
Minimum value |
37.7 |
45.1 |
|||
|
4 |
Period end |
62.8 |
66.8 |
|||
|
SVaR (10 day 99 %) |
||||||
|
5 |
Maximum value |
465.2 |
348.5 |
|||
|
6 |
Average value |
200.7 |
146.5 |
|||
|
7 |
Minimum value |
52.5 |
70.6 |
|||
|
8 |
Period end |
305.5 |
139.7 |
|||
|
IRC (99.9 %) |
||||||
|
9 |
Maximum value |
755.5 |
689.0 |
|||
|
10 |
Average value |
565.0 |
578.7 |
|||
|
11 |
Minimum value |
408.6 |
492.2 |
|||
|
12 |
Period end |
501.5 |
508.7 |
|||
|
Comprehensive risk capital charge (99.9 %) |
||||||
|
13 |
Maximum value |
– |
– |
|||
|
14 |
Average value |
– |
– |
|||
|
15 |
Minimum value |
– |
– |
|||
|
16 |
Period end |
– |
– |
|||
1 Amounts show the maximum, average and minimum for the preceding six-month period.
Comparison of end-of-day VaR measures with one-day changes in portfolio's value
Article 455 (g) CRR
The following graph shows the trading units daily buy-and-hold and actual income in comparison to the value-at-risk (1 day holding period) as of the close of the previous business day for the trading days of the reporting period. The value-at-risk is presented in negative amounts to visually compare the estimated potential loss of the trading positions with the buy and hold income given buy-and-hold is the relevant portion of daily profit and loss for comparison against the previous day's value at risk which excludes new trades, reserves, and any carry profit and loss ordinarily part of Actual income.
EU MR4 – Comparison of VaR estimates with gains and losses
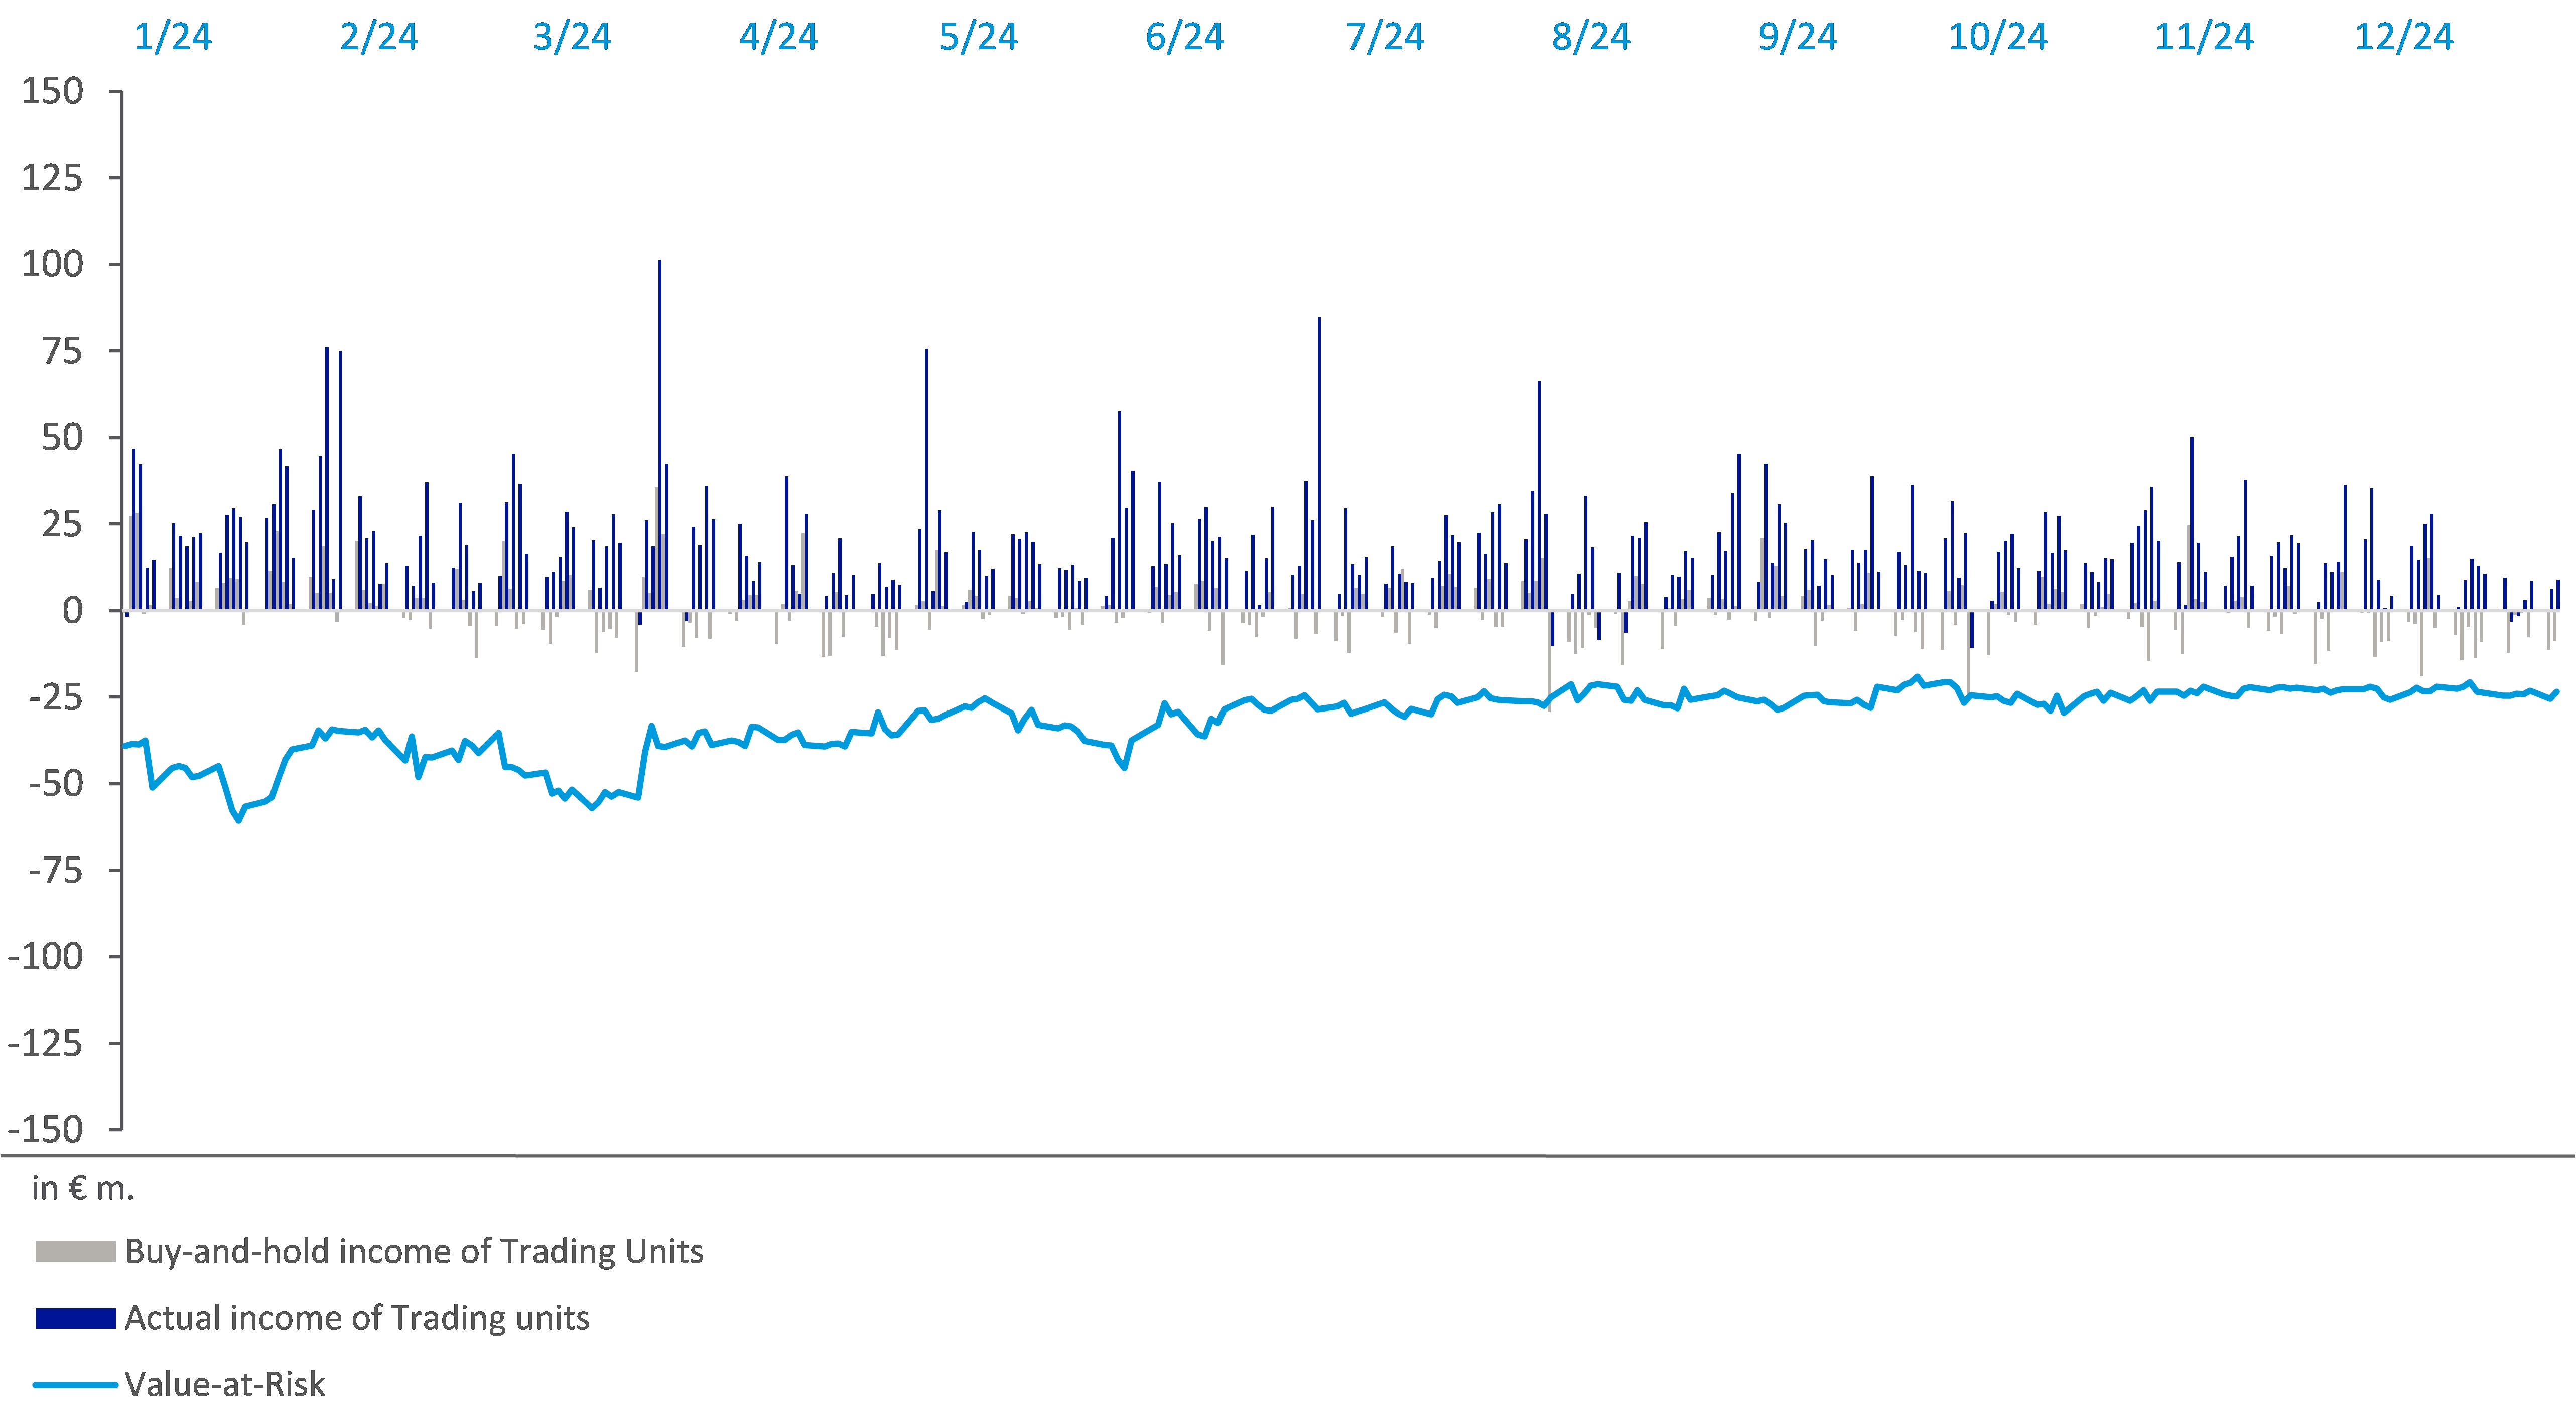
181
|
Deutsche Bank |
||
|
Pillar 3 Report as of December 31, 2024 |
||
During the reporting period (January 2024 – December 2024), the Group observed two outliers where the Group’s loss on a buy-and-hold exceeded the value-at-risk of the Trading books. The outliers in August 2024 and October 2024 were driven by increased market volatility stemming from macroeconomic data releases and central bank actions on interest rate policy.
Prudent valuation adjustments
Article 436 (e) CRR
Deutsche Bank determines the amount of the Prudent Valuation Adjustment based on the methodology defined in the CRR for exposures from the trading book and the non-trading book that are adjusted in accordance with Article 34 and Article 105, a breakdown of the amounts of the constituent elements of an institution's prudent valuation adjustment, by type of risks, and the total of constituent elements separately for the trading book and non-trading book positions.
EU PV1 – Prudent valuation adjustments (PVA)
|
|
Dec 31, 2024 |
|||||||||||
|
a |
b |
c |
d |
e |
||||||||
|
in € m. |
Risk Category |
|||||||||||
|
Category level AVA |
Equity |
Interest Rates |
Foreign Exchange |
Credit |
Commodities |
|||||||
|
1 |
Market price uncertainty |
70 |
997 |
78 |
595 |
0 |
||||||
|
3 |
Close-out cost |
30 |
421 |
89 |
154 |
0 |
||||||
|
4 |
Concentrated positions |
3 |
142 |
9 |
80 |
0 |
||||||
|
5 |
Early termination |
0 |
0 |
0 |
0 |
0 |
||||||
|
6 |
Model risk |
0 |
21 |
4 |
1 |
0 |
||||||
|
7 |
Operational risk |
0 |
0 |
0 |
0 |
0 |
||||||
|
10 |
Future administrative costs |
0 |
33 |
1 |
21 |
0 |
||||||
|
12 |
Total Additional Valuation Adjustments (AVAs) |
104 |
1,615 |
182 |
850 |
0 |
||||||
|
|
Dec 31, 2024 |
|||||||||||
|
EU e1 |
EU e2 |
f |
g |
h |
||||||||
|
in € m. |
Category level AVA - Valuation uncertainty |
Total category level post-diversification |
||||||||||
|
Category level AVA |
Unearned credit spreads AVA |
Investment and funding costs AVA |
Total |
Of which: Total core approach in the trading book |
Of which: Total core approach in the banking book |
|||||||
|
1 |
Market price uncertainty |
93 |
5 |
930 |
857 |
73 |
||||||
|
3 |
Close-out cost |
10 |
2 |
353 |
326 |
28 |
||||||
|
4 |
Concentrated positions |
0 |
0 |
235 |
216 |
18 |
||||||
|
5 |
Early termination |
0 |
0 |
0 |
0 |
0 |
||||||
|
6 |
Model risk |
154 |
7 |
106 |
98 |
8 |
||||||
|
7 |
Operational risk |
0 |
0 |
0 |
0 |
0 |
||||||
|
10 |
Future administrative costs |
0 |
0 |
55 |
51 |
4 |
||||||
|
12 |
Total Additional Valuation Adjustments (AVAs) |
257 |
14 |
1,680 |
1,548 |
132 |
||||||
182
|
Deutsche Bank |
||
|
Pillar 3 Report as of December 31, 2024 |
||
Operational risk
Risk management objectives and policies
Operational risk management strategies and processes
Article 435 (1)(a) CRR (EU OVA & EU ORA)
Deutsche Bank applies the European Banking Authority’s Single Rulebook definition of operational risk: “Operational risk means the risk of losses stemming from inadequate or failed internal processes, people and systems or from external events. Operational risk includes legal risks but excludes business and reputational risk and is embedded in all banking products and activities.” Operational risk forms a subset of the bank’s non-financial risks.
Deutsche Bank’s operational risk appetite sets out the amount of operational risk it is willing to accept as a consequence of doing business. The bank takes on operational risks consciously, both strategically as well as in day-to-day business. While the bank may have no appetite for certain types of operational risk events (such as violations of laws or regulations and misconduct), in other cases a certain amount of operational risk must be accepted if the bank is to achieve its business objectives. In case a residual risk is assessed to be outside risk appetite, risk reducing actions must be undertaken, including remediating the risks, insuring risks or ceasing business.
The Operational Risk Management Framework is a set of interrelated tools and processes that are used to identify, assess, mitigate and monitor the bank’s operational risks. Its components have been designed to operate together to provide a comprehensive, risk-based approach to managing the bank’s most material operational risks. Operational Risk Management Framework components include the Group’s approach to setting and adhering to operational risk appetite, the operational risk type and control taxonomies, the policies and procedures for operational risk management processes including the respective tools, and the bank’s operational risk capital model.
Operational risk is a risk type on the Group’s Risk Type Taxonomy. Together with Reputational Risk it forms Non-Financial risk. The Operational Risk Management Framework is a set of interrelated tools and processes that are used to identify, assess, measure, monitor and mitigate Deutsche Bank Group’s operational risks according to regulatory and industry-established definition of operational risk. It applies to the operational sub-risk types on a more granular level and enables the bank to aggregate and monitor its operational risk profile. These operational sub-risk types are controlled by various infrastructure functions and include the following:
– The Compliance department performs an independent 2nd line control function that protects the bank’s license to operate by promoting and enforcing compliance with the law and driving a culture of compliance and ethical conduct in the bank. The Compliance department assists, reviews and challenges the business divisions and works with other infrastructure functions and regulators to establish and maintain a risk-based approach to the management of the bank’s compliance risks in accordance with the bank’s risk appetite and to help the bank detect, mitigate and prevent breaches of laws, rules and regulations as well as internal policies. The Compliance department performs the following principal activities: regulatory engagement and management in collaboration with Regulatory and Exam Management Group; identification and assessment of new and changed laws, rules and regulations; acting as trusted advisor through independent review and challenge; performing second line controls; the identification, assessment, mitigation, monitoring and reporting on compliance risk; the results of these assessments and controls are regularly reported to the Management Board and Supervisory Board.
– Financial crime risks are managed by the Anti-Financial Crime (AFC) function via maintenance and development of a dedicated program; the AFC program is based on regulatory and supervisory requirements; AFC has defined roles and responsibilities and established dedicated functions for the identification and management of financial crime risks resulting from money laundering, terrorism financing, compliance with sanctions and embargoes, the facilitation of tax evasion as well as other criminal activities including fraud, bribery and corruption and other crimes; AFC updates its strategy for financial crime prevention via regular development of internal policies processes and controls, institution-specific risk assessment and staff training.
– Legal & Group Governance is a fully independent infrastructure function, mandated to provide legal advice both to the Management Board as well as to the business divisions and infrastructure functions and to support the Management Board in setting up and guarding Deutsche Bank’s Governance framework and manage the bank’s Legal and Governance Risk. Legal has a monopoly for giving legal advice, retaining and controlling outside counsel.
The independency of Legal & Group Governance is ensured through
– a direct reporting line into the Management Board and not into any business division
– a ring-fenced incentive system and compensation where performance evaluation is tied principally to risk management and not to business revenues
183
|
Deutsche Bank |
||
|
Pillar 3 Report as of December 31, 2024 |
||
– Deutsche Bank’s New Product Approval and Systematic Product Review processes form a control framework designed to manage the risks associated with new products and services and their lifecycle management. These processes are overseen by Product Governance, within the Non-Financial Risk function. Existing products and services are reviewed in one- to three year cycles designed to assess whether they remain fit for purpose and consistent with their respective target markets’ characteristics and objectives. Each product or service must be sponsored by a business Managing Director who bears ultimate accountability for it. Breaches of the New Product Approval requirements are in scope of the bank’s Red Flag consequence management process
– NFRM comprises of Risk Type Controller role for a number of non-financial and operational resilience risks; its mandate includes second line oversight of controls over transaction processing activities, as well as infrastructure risks to prevent technology or process disruption, maintain the confidentiality, integrity and availability of data, records and information security, and ensure business divisions and infrastructure functions have robust plans in place to recover important business processes and functions in the event of disruption including technical or building outage, or the effects of cyber-attack or natural disaster as well as any physical security or safety risk; NFRM Risk Type Controller also manages the risks arising from the bank’s internal and external vendor engagements via the provision of a comprehensive third party risk management framework
Operational risk management structure and organization
Article 435 (1)(b) CRR (EU OVA & EU ORA)
While the day-to-day management of operational risk is the primary responsibility of business divisions and infrastructure functions, where these risks are generated, Non-Financial Risk Management (NFRM) oversees the Group-wide management of operational risks, identifies and reports risk concentrations, and promotes a consistent application of the Operational Risk Management Framework across the bank. NFRM is part of the Group’s risk function, the Chief Risk Office, which is headed by the Chief Risk Officer.
The Chief Risk Officer appoints the Head of NFRM, who is accountable for the design, oversight and maintenance of an effective, efficient and regulatory compliant Operational Risk Management Framework, including the operational risk capital model. The Head of NFRM monitors and challenges the Operational Risk Management Framework’s Group wide implementation and monitors overall risk levels against the bank’s operational risk appetite.
The Non-Financial Risk Committee is responsible for the oversight, governance and coordination of the management of operational risk in the Group, by establishing a cross-risk and holistic perspective of the key operational risks of the Group. Its decision-making and policy related authorities include the review, advice and management of all operational risk issues that may impact the risk profile of business divisions and infrastructure functions. Several sub-fora with attendees from both the 1st LoD and 2nd LoD support the Non-Financial Risk Committee to effectively fulfil its mandate. In addition to the Group level Non-Financial Risk Committee, business divisions have established 1st LoD non-financial risk fora for the oversight and management of operational risks on various levels of the organization.
The governance of operational risks follows the bank’s 3LoD approach to managing all of its financial and non-financial risks. The Operational Risk Management Framework establishes the operational risk governance standards including the core 1st and 2nd LoD roles and their responsibilities, to ensure effective risk management and appropriate independent challenge.
Operational risk requirements for the 1st LoD: Risk owners as the 1st LoD have full accountability for their operational risks and manage these against a defined risk appetite.
Risk owners are those roles in the bank whose activities generate - or who are exposed to - operational risks. As heads of business divisions and infrastructure functions, they must determine the appropriate organizational structure to identify their operational risk profile, actively manage these risks within their organization, take business decisions on the mitigation or acceptance of operational risks to ensure they remain within risk appetite, and establish and maintain 1st LoD controls.
Operational risk requirements for the 2nd LoD: Risk Type Controllers act as the 2nd LoD control functions for all sub-risk types under the overarching risk type “Operational Risk”.
Risk Type Controllers establish the framework and define Group level risk appetite statements for the specific operational risk type they oversee. Risk Type Controllers define the minimum risk management and control standards and independently monitor and challenge risk owners’ implementation of these standards in their day-to-day processes, as well as their risk-taking and risk management activities. Risk Type Controllers provide independent operational risk oversight and monitor the risk type’s profile against the defined risk appetite. As risk type experts, Risk Type Controllers define the risk type and its taxonomy and support and facilitate the implementation of the risk type framework in the 1st LoD. To maintain their independence, Risk Type Controller roles are located only in infrastructure functions.
Operational risk requirements for NFRM as the Risk Type Controller for the overarching risk type “Operational Risk”: As the Risk Type Controller / risk control function for operational risk, NFRM establishes and maintains the overarching Operational Risk Management Framework and determines the appropriate level of capital to underpin the Group’s operational risk.
– As the 2nd LoD risk control function, NFRM defines the bank’s approach to operational risk appetite and monitors its adherence and consequences in case of operational risks outside the defined risk appetite. NFRM provides the oversight of risk and control mitigation plans to return the bank’s operational risk into its defined risk appetite, where required; it also establishes and regularly reports the bank’s operational risk profile including operational risks which are outside the defined risk appetite
184
|
Deutsche Bank |
||
|
Pillar 3 Report as of December 31, 2024 |
||
– As the subject matter expert for operational risk, NFRM provides independent risk views to facilitate forward-looking management of operational risks, actively engages with risk owners (1st LoD) and facilitates the implementation of risk management and control standards across the bank
– NFRM is accountable for the design, implementation and maintenance of the approach to determine the adequate level of capital required for operational risk, for recommendation to the Management Board; This includes the calculation and allocation of operational risk capital demand and expected loss under the Advanced Measurement Approach (AMA)
Scope and nature of Operational Risk measurement and reporting systems
Article 435 (1)(c) CRR (EU OVA & EU ORA)
To manage the broad range of sub-risk types underlying operational risk, the Operational Risk Management Framework provides a set of tools and processes that apply to all operational risk types across the bank. These enable the bank to determine its operational risk profile in relation to risk appetite for operational risk, to systematically identify operational risk themes and concentrations, and to define risk mitigating measures and priorities.
In 2024, the bank continued to mature the management of Operational Risk. This was achieved through the enhancement of the granularity of the Risk and Control Assessment; through the migration of the central control repository into a more efficient application and by uplifting the Risk Appetite Framework.
– Loss data collection: Data on internal and relevant external operational risk events (with a P&L impact ≥ €10,000) is independently validated in a timely manner. Material operational risk events trigger clearly defined lessons learned and read-across analyses, which are performed in the 1st LoD in close collaboration between business partners, risk control and other infrastructure functions. Lessons learned reviews analyze the reasons for significant operational risk events, identify their root causes, and document appropriate remediation actions to reduce the likelihood of their reoccurrence. Read across reviews take the conclusions of the lessons learned process and seek to analyze whether similar risks and control weaknesses identified in a lessons learned review exist in other areas of the bank, even if they have not yet resulted in problems or losses. This allows preventative actions to be undertaken.
– Scenario analysis: The operational risk profile is complemented and further substantiated by incorporating exploratory scenario analysis into day-to-day risk management activities. Scenario analysis is used as a risk identification and management tool that enables risk owners and Risk Type Controllers to explore potential exposure to risk as the basis for identifying potential gaps in the banks existing operational risk profile. Furthermore, it is used as an input into the calculation of the operational risk capital for the bank. Scenario storylines build on internal losses, emerging risk reviews, top risks and risk concentrations, and findings, as well as the review of external peer operational risk loss events. Information from actual and potential future loss events are systematically utilized to identify thematic susceptibilities and actively seek to reduce the likelihood of similar incidents, for example through deep dive analyses or risk profile reviews. In 2024, the new ‘Structured scenario’ approach was piloted, which allows for better quantification of potential Operational Risks.
– Risk & Control Assessment: The risk and control assessment process comprises of a series of bottom-up assessments of the risks generated by business divisions and infrastructure functions, the effectiveness of the controls in place to manage them, and the remediation actions required to bring the risks within the risk appetite. The Risk & Control Assessment is performed at a global business level and as such covers all jurisdictions. It is designed to assist Senior Management to determine whether operational risks are being managed and controlled adequately via a dynamic assessment approach which covers all applicable Risk Types from the Group’s Non-Financial Risk Type Taxonomy (NFRTT). The Risk & Control Assessment puts a greater emphasis on assessing and mitigating risks that are outside of appetite and risks that drive unethical and inappropriate market conduct within the bank. In 2024, the RCA granularity was enhanced to provide specific risk insights and ensuring a more accurate risk profile for comparison against the defined risk appetite.
– Top risks: The Top Risk Reporting process is a regular process to identify the risks which pose greatest concern across Group and divisions, in addition to ensuring there is commensurate remediation activity associated to mitigate the risk. The associated Top Risk reporting provides a forward-looking perspective on the impact of top risk reduction programs, comprising of planned remediation and control enhancements, indicating the expected timeframe for reduction. The reporting also contains emerging risks and themes that have the potential to influence the top risk population in the future. The top risk identification process is closely connected to both the risk and control assessment and risk appetite, consuming the risk exposure from the former and the appetite levels from the latter to help inform the top risk population. In 2024, the Top Risk Reporting Process was decommissioned and integrated into the Risk Appetite process.
– Transformation Risk Assessment: To identify and appropriately manage risks from material change initiatives within the bank, a transformation risk assessment process is in place to assess the impact of transformation (including bank’s future joint ventures and strategic investments) on the bank’s risk profile and control environment. The assessment considers impacts to financial and non-financial risk types and is mandatory for a subset of initiatives, categorized as key deliverables (typically includes regulatory initiatives, technology migrations, remediation initiatives, strategy and organizational changes).
185
|
Deutsche Bank |
||
|
Pillar 3 Report as of December 31, 2024 |
||
– Risk appetite: Non-financial risk appetite reflects the amount of non-financial risk the bank is willing to accept to pursue its strategy. The non-financial risk appetite framework provides a common approach to define the level of risk appetite across the firm and monitor exposure against this appetite. The operational risk profile is regularly monitored against the bank’s defined risk appetite, to alert the organization on impending problems in a timely fashion. In 2024, the concept of residual risk zones was further enhanced by introducing Operating Conditions the 1st LOD must operate within. This allows for a more precise articulation of risk appetite for a given risk type including defined breach and consequences management requirements.
– Findings and issue management: The findings and issue management process facilitates mitigating the risks associated with known control weaknesses and deficiencies, and enables management to make risk-based decisions over the need for further remediation or risk acceptance. Outputs from the findings management process must be able to demonstrate to internal and external stakeholders that the bank is actively identifying its control weaknesses and taking steps to manage associated risks within acceptable levels of risk appetite.
– Framework Adherence: Operational Risk Framework Adherence monitoring is a key activity to oversee, monitor and test the conformity to OR Framework component requirements by key stakeholders in the 1st and 2nd LoD. Operational Risk Framework Adherence results aim to proactively identify implementation improvements required of users of the OR Framework and highlight potential Framework design improvements. In 2024 Framework Adherence consequence management was enhanced whereby material adherence deficiencies identified through Framework Adherence reviews will result in Risk-Identified Issues against the responsible 1st or 2nd LoD function, unless a finding already exists to appropriately remediate the deficiency identified.
Operational risk measurement
Article 446 CRR
Deutsche Bank calculates and measures the regulatory and economic capital requirements for operational risk using the Advanced Measurement Approach (AMA) methodology. The AMA capital calculation is based upon the loss distribution approach. Gross losses from historical internal and external loss data (Operational Riskdata eXchange Association consortium data) complemented by scenario data are used to estimate the risk profile (i.e., a loss frequency and a loss severity distribution). The loss distribution approach model includes conservatism by recognizing losses on events that arise over multiple years as single events in the historical loss profile.
Within the loss distribution approach model, the frequency and severity distributions are combined in a Monte Carlo simulation to generate potential losses over a one-year time horizon. Finally, the risk mitigating benefits of insurance are applied to each loss generated in the Monte Carlo simulation. Correlation and diversification benefits are applied to the net losses in a manner compatible with regulatory requirements to arrive at a net loss distribution at Group level, covering expected and unexpected losses. Capital is then allocated to each of the business divisions considering qualitative adjustments after deducting expected loss.
The regulatory and economic capital requirements for operational risk is derived from the 99.9 % percentile. Both regulatory and economic capital requirements are calculated for a time horizon of one year.
The regulatory and economic capital demand calculations are performed on a quarterly basis. NFRM establishes and maintains the approach for capital demand quantification and ensures that appropriate development, validation and change governance processes are in place, whereby the validation is performed by an independent validation function and in line with the Group’s model risk management process.
With the go-live of the European Capital Requirements Regulation (CRR3), the regulatory capital requirement will no longer be based on the AMA methodology from 2025 onwards. Instead, the Standardised Measurement Approach for operational risk will be used. Deutsche Bank will continue to apply the AMA methodology to calculate its economic capital requirement.
Drivers for operational risk capital development
By design of the AMA capital calculation, Deutsche Bank’s operational risk capital demand is predominantly driven by historical internal loss events. In view of the relevance of legal risks within the bank’s operational risk profile, specific attention is dedicated to the management and measurement of open civil litigation and regulatory enforcement matters where the bank relies both on information from internal as well as external data sources to consider developments in legal matters that affect the bank specifically but also the banking industry as a whole. Reflecting the multi-year nature of legal proceedings the measurement of these risks furthermore takes into account changing levels of certainty by capturing the risks at various stages throughout the lifecycle of a legal matter.
Conceptually, the bank measures operational risk including legal risk by determining the annual operational risk loss that will not be exceeded with a given probability. This loss amount is driven by a component that due to the IFRS criteria is reflected in the bank’s financial statements and a component beyond the amount reflected as provisions within the bank’s financial statements.
186
|
Deutsche Bank |
||
|
Pillar 3 Report as of December 31, 2024 |
||
The legal losses which the bank expects with a likelihood of more than 50 % are already reflected in the IFRS group financial statements. These losses include net changes in provisions for existing and new cases in a specific period where the loss is deemed probable and is reliably measurable in accordance with IAS 37.
Uncertain legal losses which are not reflected in the bank’s financial statements as provisions because they do not meet the recognition criteria under IAS 37 are considered within regulatory or economic capital demand.
To quantify the litigation losses in the AMA model, the bank takes into account historical losses, provisions, contingent liabilities and legal forecasts. Legal forecasts generally comprise ranges of potential losses covering risks of outflows greater than the provision and adjustments which are deemed remote or relate to yet unknown matters. Such forecasts may result from ongoing and new legal matters which are reviewed at least quarterly by the attorneys handling the legal matters.
The legal forecasts are included in the “relevant loss data” used in the AMA model. The projection range of the legal forecasts is not restricted to the one year capital time horizon but goes beyond and conservatively assumes early settlement of the underlying losses in the reporting period - thus considering the multi-year nature of legal matters.
AMA model validation and quality control concept
All AMA model components are independently validated. The results of the validations are summarized in validation reports and identified issues are followed up for resolution. For example, the validation activities in the past years detected areas of improvement required of the AMA model regarding the selection of non-financial risk appetite metrics and the methodology driving its forward-looking component, which are now included in the model.
The model’s input sources such as loss data, scenario analyses, risk & control assessments, and expected loss are subject to comprehensive quality controls in the business divisions and the control functions.
Operational risk management stress testing concept
Stress testing is conducted on a regular basis to complement the AMA methodology, to analyze the impact of extreme stress scenarios on capital and the profit-and-loss account. It also contains reputational impacts.
In 2024, NFRM took part in all firm-wide stress test scenarios and assessed and contributed the impact of operational risk to the various stress levels of the scenarios. The impact of operational risk on Group-wide stress test scenarios has been moderate and remained in the expected range in regards to capital, which is due to the fact that the AMA model already applies a conservative multi-year view on loss sizes (including legal forecasts) even in non-stress mode.
Operational risk exposure
Article 446 CRR
The regulatory and economic capital requirements for operational risk are calculated and measured using the Advanced Measurement Approach (AMA) methodology for the entire Group. No combined use of different approaches is in place. The relevant indicator for non-AMA approaches is shown in the table below for information purposes only. This size indicator is not relevant for the calculation of the own funds requirements (EC/RC) or risk exposure amount (RWA) as these are calculated using the AMA in place for the entire Deutsche Bank group.
EU OR1 – Operational risk own funds requirements and risk-weighted exposure amounts
|
|
Dec 31, 2024 |
|||||||||||
|
a |
b |
c |
d |
e |
||||||||
|
in € m. |
Relevant indicator |
Own funds requirements |
Risk exposure amount |
|||||||||
|
Banking activities |
2022 |
2023 |
2024 |
|||||||||
|
1 |
Banking activities subject to Basic Indicator Approach (BIA) |
0 |
0 |
0 |
0 |
0 |
||||||
|
2 |
Banking activities subject to Standardized (TSA) / Alternative Standardized (ASA) Approaches |
0 |
0 |
0 |
0 |
0 |
||||||
|
3 |
Subject to TSA: |
0 |
0 |
0 |
- |
- |
||||||
|
4 |
Subject to ASA: |
0 |
0 |
0 |
- |
- |
||||||
|
5 |
Banking activities subject to Advanced Measurement Approaches AMA |
27,163 |
28,879 |
29,992 |
4,645 |
58,061 |
||||||
187
|
Deutsche Bank |
||
|
Pillar 3 Report as of December 31, 2024 |
||
Operational Risk losses by event type (profit and loss view)
|
in € m. |
2024 |
2023¹ |
||
|
Clients, Products and Business Practices |
1,909 |
676 |
||
|
Execution, Delivery and Process Management |
163 |
127 |
||
|
External Fraud |
52 |
106 |
||
|
Others |
22 |
55 |
||
|
Natural Disasters and Public Safety |
18 |
11 |
||
|
Internal Fraud |
18 |
(332) |
||
|
Group |
2,182 |
644 |
||
1 Prior year losses have been revised to account for subsequent capture of losses and reclassification.
2 Losses are reported after offsetting insurance.
As of December 31, 2024, operational risk losses increased year-on-year from € 644 million to € 2.2 billion. This was driven by an increase in litigation expenses of € 2.0 billion mainly due to provision for the Postbank takeover litigation matter, as well as the reversal of RusChemAlliance indemnification asset and the Polish FX mortgage provision and is not deemed to be representative of a deterioration in the control environment. Non-legal losses decreased year-on-year from € 214 million in 2023 to € 175 million in 2024.
Operational risk losses by event type1
The diagram “Distribution of Operational Risk Losses” summarizes the value of net operational risk loss postings by event type in 2024, against the average for the comparative five-year period 2019-2023 (in brackets). The event type “Clients, Products and Business Practices” forms the most significant portion of operational losses with a share of 88% largely made up of provisions from legacy litigation cases due to settlements reached and increased litigation reserves for unsettled cases.
The diagram “Frequency of Operational Losses” summarizes the operational risk events by event type (based on a count of events where losses were first recognized in 2024), related to the average for the comparative five-year period 2019-2023 (in brackets). “External Fraud” remains the highest frequency event type at 66% with notable reduction versus the five-year average, leading to increase in share of events in other categories.
1 Figures in brackets are averages between 2019-2023. Prior year losses have been revised to account for subsequent capture of losses and reclassification.
2 Distribution of operational risk losses is based on posting date.
3 Frequency of operational risk losses is based on first posting date.
4 The bank seeks to ensure the comprehensive capture of all operational risk loss events with a net operational risk loss impact of € 10,000 or greater, the totals shown in this section may be underestimated due to delayed detection and recording of loss events.
Use of the Advanced Measurement Approaches to operational risk
Article 454 CRR
Description of the use of insurance and other risk transfer mechanisms for the purpose of mitigation of this risk
The definition of insurance strategy and supporting insurance policy and guidelines is the responsibility of the specialized unit Corporate Insurance/Deukona. Corporate Insurance/Deukona is responsible for the global corporate insurance policy which is approved by the Management Board.
188
|
Deutsche Bank |
||
|
Pillar 3 Report as of December 31, 2024 |
||
Corporate Insurance/Deukona is responsible for acquiring insurance coverage and for negotiating contract terms and premiums. Corporate Insurance/Deukona also has a role in the allocation of insurance premiums to the businesses. Corporate Insurance/Deukona specialists assist in devising the method for reflecting insurance in the capital calculations and in arriving at parameters to reflect the regulatory requirements. They validate the settings of insurance parameters used in the AMA model and provide respective updates. Corporate Insurance/Deukona is actively involved in industry efforts to reflect the effect of insurance in the results of the capital calculations.
Insurance is bought in order to protect against unexpected and substantial unforeseeable losses. The identification, definition of magnitude and estimation procedures used are based on the recognized insurance principles and methods. The maximum limit per insured risk takes into account the reliability of the insurer and a cost/benefit ratio, especially in cases in which the insurance market tries to reduce coverage by restricted/limited policy wordings and specific exclusions.
Two insurance companies are maintained. However, insurance contracts provided are only considered in the modeling/calculation of insurance-related reductions of operational risk capital requirements where the risk is re-insured in the external insurance market.
The regulatory capital figure includes a deduction for insurance coverage amounting to € 71 million as of December 31, 2024 compared with € 76 million as of December 31, 2023. Currently, no other risk transfer techniques beyond insurance are recognized in the AMA model.
Corporate Insurance/Deukona selects insurance partners in strict compliance with the regulatory requirements specified in the CRR and based on recommendations of the respective subject matter experts on the recognition of insurance in advanced measurement approaches. The insurance portfolio, as well as Corporate Insurance/Deukona activities, is audited by Group Audit on a risk-based approach.
Exposure to interest rate risk in the banking book
Qualitative information on interest rate risk in the banking book
Article 448 (1)(c-g) CRR (EU IRRBBA)
Interest rate risk in the banking book (IRRBB) is the current or prospective risk, to both the Group's capital and earnings, arising from movements in interest rates, which affect the Group's non-trading book exposures. This includes gap risk, which arises from the term structure of banking book instruments, basis risk, which describes the impact of relative changes in interest rates for financial instruments that are priced using different interest rate curves, as well as option risk, which arises from option derivative positions or from optional elements embedded in financial instruments.
The Group manages its IRRBB exposures using economic value as well as earnings based measures. The Group Treasury function is mandated to manage the interest rate risk centrally, with Treasury Risk Management acting as “2nd Line of Defense” (LoD) independently assessing and challenging the implementation of the framework and adherence to the risk appetite. Group Audit in its role as the “3rd LoD” is accountable for providing independent and objective assurance on the adequacy of the design, operating effectiveness and efficiency of the risk management system and systems of internal control. The Group Asset & Liability Committee (“ALCo”) oversees and steers the Group’s structural interest risk position with particular focus on banking book risks and the management of the net interest income. The ALCo monitors the sensitivity of financial resources and associated metrics to key market parameters such as interest rate curves and oversees adherence to divisional/business financial resource limits.
Economic value based measures look at the change in economic value of banking book assets, liabilities and off-balance sheet exposures resulting from interest rate movements, independent of the accounting treatment. Thereby the Group measures the change in economic value of equity (∆EVE) as the maximum decrease of the banking book economic value under the six standard scenarios defined by the EBA in addition to internal stress scenarios for risk steering purposes. For the reporting of internal stress scenarios and risk appetite the Group applies a few different modelling assumptions as used in this disclosure. When aggregating the economic value of equity ∆EVE across different currencies, the Group adds up negative and positive changes without applying weight factors for positive changes. Furthermore, the Group is using behavioral model assumptions about the interest rate duration of own equity capital as well as non-maturity deposits from financial institutions.
Earnings-based measures look at the expected change in net interest income (NII) resulting from interest rate movements over a defined time horizon, compared to a defined benchmark scenario. Thereby the Group measures the change in net interest income (∆NII) as the maximum reduction under the six standard scenarios defined by the EBA in addition to internal stress scenarios for risk steering purposes, compared to a market implied curve scenario, over a period of 12 months.
189
|
Deutsche Bank |
||
|
Pillar 3 Report as of December 31, 2024 |
||
The Group employs mitigation techniques to hedge the interest rate risk arising from nontrading positions within given limits. The interest rate risk arising from nontrading asset and liability positions is managed by Treasury (Treasury Markets & Investments team). Thereby the Group uses derivatives and applies different hedge accounting techniques such as fair value hedge accounting or cash flow hedge accounting. For fair value hedges, the Group uses interest rate swaps and options contracts to manage the fair value movements of fixed rate financial instruments due to changes in benchmark interest rates. For hedges in the context of the cash flow hedge accounting, the Group uses interest rate swaps to manage the exposure to cash flow variability of the variable rate instruments as a result of changes in benchmark interest rates.
The Group assesses and measures hedge effectiveness of a hedging relationship based on the change in the fair value or cash flows of the derivative hedging instrument relative to the change in the fair value or cash flows of the hedged item attributable to the hedged risk.
The Model Risk Management function performs independent validation of models used for IRRBB measurement, as per all market risk models, in line with Deutsche Bank’s group-wide risk governance framework.
The calculation of VaR and sensitivities of interest rate risk is performed daily, whereas the measurement and reporting of economic value interest rate and earnings risk is performed on a monthly basis. The Group generally uses the same metrics in its internal management systems as it applies for the disclosure in this report.
Deutsche Bank’s key modelling assumptions are applied to the positions in the Private Bank and Corporate Bank divisions. Those positions are subject to risk of changes in clients’ behavior with regard to their deposits as well as loan products. The Group regularly tests the assumptions and updates them where appropriate following a defined governance process. In particular, the Group has made changes to its assumptions during the early phase of rising interest rates where a slower repricing in deposits was observed than it was anticipated.
The Group manages the interest rate risk exposure of its non-maturity deposits through a replicating portfolio approach to determine the average repricing maturity of the portfolio. For the purpose of constructing the replicating portfolio, the portfolio of non-maturity deposits is clustered by dimensions such as business unit, currency, product and geographical location. The main dimensions influencing the repricing maturity are elasticity of deposit rates to market interest rates, volatility of deposit balances and observable client behavior. For the reporting period the average repricing maturity assigned across all such replicating portfolios is 2.40 years and Deutsche Bank uses 15 years as the longest repricing maturity.
In the loan and some of the term deposit products Deutsche Bank considers early prepayment/withdrawal behavior of its customers. The parameters are based on historical observations, statistical analyses and expert assessments.
Furthermore, the Group generally calculates IRRBB related metrics in contractual currencies and aggregates the resulting metrics for reporting purposes. When calculating economic value based metrics the commercial margin is excluded for material parts of the balance sheet.
Changes in the economic value of equity and net interest income
Article 448 (a‑b,d) CRR
The following table shows the impact on the Group’s net interest income in the non-trading book as well as the change of the economic value for the banking book positions from interest rate changes under the six standard scenarios defined by the EBA.
EU IRRBB1 - Changes in the economic value of equity and net interest income under six supervisory shock scenarios
|
|
Changes of the economic value of equity |
Changes of the net interest income¹ |
||||||
|
in € bn. |
Dec 31, 2024 |
June 30, 2024 |
Dec 31, 2024 |
June 30, 2024 |
||||
|
Parallel up |
(5.8) |
(6.6) |
0.2 |
(0.2) |
||||
|
Parallel down |
1.3 |
2.7 |
(0.7) |
0.0 |
||||
|
Steepener |
(0.8) |
(1.1) |
(0.1) |
0.3 |
||||
|
Flattener |
(0.7) |
(0.3) |
(0.0) |
(0.5) |
||||
|
Short rates up |
(2.1) |
(2.1) |
0.0 |
(0.6) |
||||
|
Short rates down |
0.6 |
1.1 |
(0.6) |
0.3 |
||||
|
Maximum |
(5.8) |
(6.6) |
(0.7) |
(0.6) |
||||
1 Changes of the net interest income (NII) reflects the difference between projected NII in the respective scenario with shifted rates vs. market implied rates. Sensitivities are based on a static balance sheet at constant exchange rates, excluding trading positions and DWS. Figures do not include Mark to Market (MtM) / Other Comprehensive Income (OCI) effects on centrally managed positions not eligible for hedge accounting
The maximum economic value of equity loss was € (5.8) billion as of December 2024, compared to € (6.6) billion as of June 2024. As per December 2024 the maximum EVE loss represents 9.6 % of Tier 1 Capital.
The decrease in the maximum economic value of equity loss for the “Parallel up” interest rate scenario was driven by model changes and by additional risk positions to stabilize and protect net interest income as well as rebalancing activities related to the interest rate risk positions within the Bank’s Treasury portfolio.
190
|
Deutsche Bank |
||
|
Pillar 3 Report as of December 31, 2024 |
||
The maximum one-year loss in net interest income (NII) was € (0.7) billion as of December 2024, compared to € (0.6) billion as of June 2024.
The increase in the maximum net interest income loss in the “Parallel down” scenario was mainly driven by additional downside risk arising from the behavioral model assumptions applied to Deutsche Bank’s Private Bank and Corporate Bank deposits, changes in the interest rate environment as well as a result of Deutsche Bank’s net interest income risk hedge strategy.
191
|
Deutsche Bank |
||
|
Pillar 3 Report as of December 31, 2024 |
||
Environmental, social and governance (ESG) risks
Article 449a CRR
ESG disclosures are included in accordance with Article 449a CRR and the EBA ITS 2022/01. ESG risks are the risks of current and future losses arising from any negative financial, operational and/or reputational impacts on Deutsche Bank‘s clients, invested assets and/or operations as it relates to ESG factors.
Environmental risk includes both physical and transition risks related to climate change. Physical risks are the risks of losses arising from any negative impact on the bank from acute near-term risks such as extreme weather events or chronic longer-term impacts of rising temperatures. Transition risks are driven by policy, behavioral and technology changes required to foster the transition to a low carbon economy and can also impact the bank’s clients and invested assets. In addition, there are other environmental risks resulting from factors such as water stress, biodiversity loss, land erosion and depletion. All of these environmental risks can impact the bank’s assets, operations and its clients.
Social risks include losses arising from any negative financial impact on Deutsche Bank because of current or prospective impacts from social factors, such as matters related to human rights or workforce management: while governance risks are the risk of losses arising from governance factors such as anti-financial crime or non-compliance with policies or regulations. Both of these risks can impact the bank’s assets, operations and its clients.
As ESG disclosure requirements and its metrics are evolving and are being newly implemented in the banking industry, there remains uncertainty on how disclosure requirements could be interpreted and there are limitations on the amount and granularity of available data. As a result, Deutsche bank’s interpretations, methodologies, and availability of data will be further enhanced in the future as additional guidance and information becomes available.
ESG risks
Governance
ESGT1-3
Deutsche Bank believes it is part of the Group’s responsibility to support and, where possible, accelerate the transformation toward a more sustainable society and economy. Thus, the bank supports the European Commission’s Action Plan on sustainable finance as a crucial contribution toward the European Union’s achievement of its climate commitment under the Paris Agreement and its wider sustainability agenda.
The Management Board of Deutsche Bank AG as the parent company of the Deutsche Bank Group assumes ultimate responsibility for matters relating to sustainability, including the supervision and management of the effects of environmental risks (such as climate-physical, climate-transition and nature risks) in the short-, medium- and long-term. To integrate these responsibilities into the organizational structure, the Management Board delegated the Group Sustainability Committee, chaired by the bank’s Chief Executive Officer to act as the senior decision-making body for sustainability-related matters at group level, including those related to ESG risks and the bank’s net zero interim (2030) and long-term (2050) targets. Further key functions and elements of the bank’s sustainability governance include the Chief Sustainability Office and the Sustainability Strategy Steering Committee, responsible for monitoring the timely and complete implementation of the bank’s sustainability transformation agenda and escalating material risks or issues to the Group Sustainability Committee. The bank also established the Net Zero Forum, responsible for the assessment of new transactions with a significant impact on the bank’s financed emissions and/or net zero targets with representatives from business divisions, the Chief Risk Office, and the Chief Sustainability Office. Both groups are chaired by the Chief Sustainability Officer.
Within the Chief Risk Office, the Group Risk Committee, chaired by the Chief Risk Officer, is established by the Management Board to serve as the central forum for review and decision making on matters related to risk, capital, and liquidity. This includes the oversight of the Bank’s framework for the management of climate and environmental risks.
Other senior committees are responsible for the development and management of specific elements of climate and environmental risk:
– The Enterprise Risk Committee, which is composed of senior risk experts from various risk disciplines, focuses on enterprise-wide risk trends, events, and cross-risk portfolios. The committee oversees the development of the bank’s holistic Climate and Environmental Risk Management Framework
– The Non-Financial Risk Committee which oversees, governs, and coordinates the management of non-financial risks group-wide and establishes a cross-risk and holistic perspective of the bank’s key non-financial risks, including risks to own infrastructure, employees, and key processes arising from climate and environmental risks
192
|
Deutsche Bank |
||
|
Pillar 3 Report as of December 31, 2024 |
||
– The Group Reputational Risk Committee, a direct subcommittee of the Management Board since 2024, has the responsibility to review, decide and manage all transactions, client relationships or other primary reputational risk matters escalated in line with the underlying reputational risk policies and framework, including sustainability-related matters
Responsibilities over the management of environmental risks in the short-, medium- and long-term are further cascaded to business divisions and key infrastructure and control functions.
On the business side, each of Deutsche Bank’s core divisions integrates climate and broader ESG risks into its planning and risk appetite statements as part of the bank’s annual strategic planning process, which is approved by the Management Board. The first line of defense is also responsible for the identification and assessment of ESG risk factors (including climate change and nature related) stemming from their activities.
In the second line of defense, risk functions are responsible for the overall control framework around climate and environmental risks, which are considered by the bank as drivers of existing risk types. In this respect:
– The Head of Enterprise Risk Management (ERM), who reports to the Chief Risk Officer, owns the Group’s overall management and appetite frameworks. This includes qualitative risk appetite principles, quantitative risk appetite metrics, and holistic monitoring of climate and nature risks across different risk types and portfolios; a dedicated team of Climate and Environmental risk specialists supports them in the exercise of these functions
– The Heads of the Credit, Market, Liquidity, Non-Financial Risk functions (“Risk Type Controllers”) who report to the Chief Risk Officer, are responsible for the establishment and operation of appropriate controls, and the monitoring and appetite setting of climate and environmental risk drivers in their respective areas
To closely and visibly link the bank’s sustainability strategy and performance with the compensation of the Management Board, the bank’s strategic sustainability goals are reflected in the compensation system, which forms the basis of the Management Board's total compensation.
Management Board members receive fixed and variable compensation components. The latter consists of two elements (Short-Term Award and Long-Term Award) and reflects the degree to which Group, divisional and individual objectives are achieved. Both awards are linked to several ESG objectives. The aim is to closely align compensation to the bank´s sustainability strategy. The ESG objectives for the Short-Term Award are contained in individual and divisional balanced scorecards. They can also be part of a Management Board member’s individual objectives agreed at the beginning of a financial year.
ESG objectives form a central performance assessment element in the Long-Term Award and have the highest percentage weighting as a result. They are related to impactful Group ESG focus topics that are the responsibility of the Management Board. The objectives, which are transparently disclosed in the Compensation Report section of the Annual Report, include targets such as the amount of sustainable financing and investments, the reduction of electricity consumption in the bank’s buildings, along with concretely defined targets from the area of climate risk management as well as the improvement in gender diversity. In addition, the objectives include employee feedback culture, as well as achievements and positive developments regarding the bank’s control environment and remediation activities. The targets are linked to measurable Key Performance Indicators (KPIs) to ensure an objective assessment of performance. Corresponding targets and KPIs including target values, thresholds and caps are published in the Compensation Report 2024. The compensation policy and the compensation system based on it – following approval by the Supervisory Board – are implemented in individual but uniform and rule-compliant service contracts for all Management Board members in compliance with banking law pursuant to Section 10 (4) of the German Remuneration Ordinance for Institutions (InstitutsVergV). Using contract templates and standardized annexes, the variable compensation components are directly linked to plan, rules, claw back and forfeiture conditions as well as shareholding obligations
Strategy and processes
Deutsche Bank’s Management Board made sustainability a management priority in 2019, Consequently, sustainability is a key element of the bank’s “Global Hausbank” strategy. The bank is embedding sustainability into its policies, processes, and products, focusing on four pillars:
– Sustainable Finance
– Policies & Commitments
– People & Operations
– Thought Leadership & Stakeholder Engagement
The bank’s business activities, own operations, relations with employees or suppliers, and respective processes are covered by these four pillars and address the ESG-related risk factors. Managing these risks and providing solutions to ESG-related challenges are part of the bank's sustainability strategy and risk management processes. Seizing business opportunities arising from ESG challenges, Deutsche Bank set the target of achieving a cumulative volume of € 500 billion in sustainable financing and investment, as defined in the bank’s Sustainable Finance Framework, from the beginning of 2020 until the end of 2025 (excluding DWS). The Sustainable Finance Framework outlines the methodology and associated procedures for classifying financial products and services offered by Deutsche Bank as sustainable. The framework specifies the classification logic, the eligibility parameter criteria, the applicable environmental and social due diligence requirements, as well as the verification and monitoring process. It is aligned to the extent possible with the requirements of the EU Taxonomy Regulation.
193
|
Deutsche Bank |
||
|
Pillar 3 Report as of December 31, 2024 |
||
Risk Management
Managing emerging ESG risks to the bank’s balance sheet and operations is a key component of the Group’s sustainability strategy. Deutsche Bank has set interim (2030) and long term (2050) net zero aligned targets for eight carbon intensive sectors and has established frameworks and processes for enhanced due diligence in relation to sectors and clients identified as having elevated inherent environmental and social risks and/or elevated impacts on the bank’s financed emissions and net zero pathways. In 2023, the bank updated its thermal coal policy and tightened criteria used to determine the scope of the policy. Moreover, the bank’s Environmental and Social Due Diligence Framework prohibits business activity in certain high impact areas. The bank’s Reputational Risk Framework is utilized to discuss any counterparty concerns that are perceived to be in contradiction with Deutsche Bank’s values and beliefs including those driven by ESG factors. Deutsche Bank regularly performs a double materiality assessment to determine the relevance of individual non-financial topics across ESG. Starting from the financial year 2024, Deutsche Bank conducts the assessment in compliance with the requirements of the European Sustainability Reporting Standards (ESRS). The assessment applies the concept of double materiality, i.e., it considers the potential positive and negative impacts Deutsche Bank may have on the environment and society and the potential financial impacts for Deutsche Bank arising from ESG topics. The results of the materiality assessment are considered in the bank's sustainability agenda and the selection of topics reported in its Sustainability Statement 2024. In the year, unmitigated financial risks stemming from impacts of Social and Governance factors on the bank’s counterparties were not deemed material.
In addition, The Chief Risk Office conducts a comprehensive and granular financial materiality assessment of climate and other environmental risks to identify potential financial impacts across key impacted risk types. Results are integrated into the Group’s risk identification processes and risk inventory and reviewed against internal controls.
Environmental risk
Business strategy and processes: integration of environmental factors and risks
ESGT1
Climate change and environmental degradation drivers, together with the bank’s negative impacts on climate and nature, may lead to the emergence of new sources of financial and non-financial risks. Transition risks to the bank’s portfolios may materialize in the short- to medium-term as governments introduce climate-related targets and policies, as society adapts its behaviors, and as consumer and investor appetite for carbon intensive clients/sectors becomes more climate-conscious. Acute and chronic physical climate and environmental risk factors arising from higher global temperatures may increase in severity even if decarbonization efforts prove successful, impacting Deutsche Bank’s operational risks and risks to the assets and activities of the bank’s clients.
Sustainability has been a central part of Deutsche Bank’s strategy since 2019. The management of risks stemming from environmental factors have been an integral part of this strategy, first and foremost through Deutsche Bank’s decarbonization targets and their incorporation into the bank’s risk management framework. Environmental risks are:
– Assessed through annual climate and environmental materiality assessment and internal stress test, across businesses, portfolios and risk types (Credit, Market, Liquidity, Reputational and Operational)
– Monitored through monthly and quarterly dedicated reports (Climate and Environmental risk MI) discussed in senior risk committees
– Managed through risk appetite thresholds, policies requirements and exclusions (Environmental and Social policy framework), and portfolio Early Warning Indicators (EWIs)
– Considered within the bank’s business model and financial planning through the carbon budgets attributed to the bank’s businesses (and derived from its decarbonization targets) and through the inclusion of environmental risks within the Internal Capital Adequacy Assessment Process (ICAAP). Each of Deutsche Bank’s core businesses integrates climate and environmental risks into planning and risk appetite statements as part of the bank’s annual strategic planning process, approved by the Management Board.
Deutsche Bank has published net zero emissions reduction targets for eight key carbon-intensive sectors in the bank’s corporate lending portfolio:
– Oil and Gas (Upstream)
– Power Generation
– Automotives (Light Duty Vehicles)
– Steel production
– Coal mining
– Cement
– Shipping
– Commercial Aviation
194
|
Deutsche Bank |
||
|
Pillar 3 Report as of December 31, 2024 |
||
Deutsche Bank publishes annually its financed emissions and progress towards net zero-aligned targets following the standard from the Partnership for Carbon Accounting Financials, relevant international greenhouse gases emissions reporting protocols and emerging best-practice climate portfolio alignment methodologies.
Business strategy and processes: objectives, targets and risk appetite
Targets are established through a process led by the Chief Risk Office function. The selection focus is on carbon-intensive sectors of sufficient materiality, and for which net zero alignment methodologies from reputable international organizations are available, together with data of sufficient quality. The decarbonization pathways utilized are science-based and compliant with the target setting guidelines of the Net-Zero Banking Alliance (NZBA), namely:
– the Net-Zero Emissions (NZE) by 2050 scenario of the International Energy Agency (IEA)
– the Poseidon Principles pathways, calibrated against the Revised International Maritime Organization (IMO) strategy;
– the Mission Possible Partnership Prudent Scenario for Commercial Aviation
Targets and pathways are discussed and agreed with the business divisions, approved by the Group Sustainability Committee and then published externally.
Furthermore, a quantitative threshold for each target is integrated into the Group’s Risk Appetite Statement, together with a broader threshold on the overall carbon footprint of the bank’s corporate loan commitments. Some deviation from the net-zero pathway is allowed in earlier years under a simplified assumption of linear reduction and the potential for portfolio and economic volatility to impact alignment. These thresholds express the bank’s appetite for deviation from the set pathway and are a fundamental tool used by the bank to mitigate its exposure to risks associated with climate transition risk factors. New transactions or limit extensions with a significant impact on the bank’s financed emissions and/or net zero targets are reviewed by a dedicated Net Zero Forum. The forum’s review includes an assessment of client sustainability disclosures, transition strategies, decarbonization targets, governance and, as a result, the overall counterparty’s capacity to manage environmental risks. Moreover, following the establishment of Divisional carbon budgets and risk appetite, the Investment Bank and the Commercial Bank each maintain their own Net Zero Forum, while the Private Bank relies on the Group forum.
The bank monitors and manages portfolio concentrations of climate transition, physical, and other environmental risks through Early Warning Indicators (EWIs). These indicators are established for its Corporates, Sovereigns and Financial Institutions lending portfolios and include:
– Measures of exposure and appetite to counterparties and sectors vulnerable to climate change and nature degradation (for instance in terms of Gross and Net Limits, Gross and Net Utilization, Expected Losses, Credit Risk RWA, and YoY changes to these metrics)
– Proportion of these exposures/ appetite metrics related to facilities with tenor greater than 5 years (limiting the ability of the bank to manage its exposures down if required)
– Proportion of these exposures/ appetite metrics related to counterparties below investment grade or with weak DB transition risk scores (to identify counterparties with a lower capacity to manage environmental risks)
These EWIs are approved by the head of Enterprise Risk Management as part of the Climate and Environmental Risk management framework, established under the umbrella of the Group Risk Management Policy.
Lastly, the bank has sectoral requirements and restrictions stemming from its Environmental and Social Policy Framework which are monitored and enforced through the Environmental and Social due diligence process and the escalation requirements of the Reputational Risk Framework of the bank.
Business strategy and processes: investment activities towards environmental objectives and EU Taxonomy-aligned activities
In accordance with Article 8 of the EU Taxonomy Regulation and the related Disclosures Delegated Acts, starting from year end 2023, financial undertakings have to determine and disclose the proportion of exposures aligned to the EU Taxonomy in their covered assets (i.e., total assets less exposures toward central governments, central banks, supranational issuers and the trading portfolio) for the climate change mitigation and adaptation objectives. Following the adoption of the Delegated Act on the four remaining environmental objectives (water and marine resources, circular economy, pollution prevention and control, biodiversity and ecosystems) in 2023, Taxonomy alignment with the non-climate objectives will be reported starting from year-end 2025.
The identification of the Taxonomy-eligible and Taxonomy-aligned economic activities for the climate change mitigation and adaptation objectives (set out in Article 9 of the EU Taxonomy Regulation) was performed for in-scope counterparties, primarily undertakings subject to the Non-Financial Reporting Directive (NFRD) disclosure obligations and households, as well as products defined in Article 8 of the EU Taxonomy Regulation and the related Disclosures Delegated Acts. More information on this is included in section “Summary of key performance indicators on the Taxonomy-aligned exposures” of this report and in the Sustainability Statement of the bank’s Annual Report.
195
|
Deutsche Bank |
||
|
Pillar 3 Report as of December 31, 2024 |
||
Business strategy and processes: policies and procedures relating to direct and indirect engagement with clients
As disclosed in the Group’s Initial Transition Plan, Deutsche Bank pursues three financing strategies for its corporate clients: green/sustainable, transition and phase out:
– Green/Sustainable strategies include providing financing to companies that enable emissions reduction through their range of green products and services
– Transition strategies reflect the bank’s commitment to support clients in their journey to decarbonize their business models
– Phase out strategies for industries with no viable decarbonization pathways (such as thermal coal) or clients in carbon intensive industries not willing to align to the bank’s transition pathway
The Group Sustainability team, within the Chief Sustainability Office, owns the policies regulating the bank’s engagement with clients on environmental and social issues:
– The Sustainable Finance Framework, which outlines the methodology and associated procedures for classifying transactions and financial products and services offered by Deutsche Bank as sustainable. The framework assesses use of proceeds, company profiles and (transaction-specific) sustainability-linked KPIs
– The Environmental and Social (ES) Risk Framework, through which Deutsche Bank identifies transactions and/or clients that might expose it to potential environmental issues and mitigate / manages the related risks
Through the Environmental and Social Risk framework the bank has defined sectors having an inherently elevated potential for negative environmental impacts and requires enhanced due diligence based on the provisions summarized in the bank’s Environmental and Social Policy. The bank reviews the scope of sectors as well as related due diligence requirements of the Environmental and Social Policy Framework annually or as events occur. For some sectors, the bank has made specific commitments. For example, since 2016, Deutsche Bank does not finance any new coal projects, be it in power or thermal coal mining.
As part of its oversight responsibility, Group Sustainability conducts transactional and client reviews pursuant to the bank’s Environmental and Social and Sustainable Finance standards, engaging, where required, with clients to understand risks and mitigants associated with a transaction or a counterparty.
In 2023, Deutsche Bank redefined the scope of the portfolio review of its coal clients to align with the 2023 updated scope of the thermal coal guideline, thereby increasing the number of clients covered by the review. The bank also updated the review questionnaires in line with the 2023 thermal coal guideline update and the related requirements for a credible transition plan. A similar review in 2021 for coal power clients in the United States and Europe led to insights into the clients’ progress with regard to their carbon footprint and existing transition plans. Building on this, a process for a client transition dialogue has been developed to support clients on their way to a more sustainable business model.
In 2023, the bank also continued to perform the systematic review of its business activities in the oil and gas sector and continued the dialogue with its clients on their decarbonization strategies. These strategies along with clients’ carbon footprint are important criteria for how the bank continues to engage in this sector. Details on this process as well as on Deutsche Bank’s strategy, processes and progress as of year-end 2024 regarding its commitment to align the bank’s portfolio with net zero by 2050 are outlined in the “Strategy”, “Risk management strategy and processes” and “Risk management, metrics and targets” sections of the “Climate and other environmental risks” chapter.
Governance
The overall governance and oversight of environmental risks are fully aligned and embedded in the ESG committees and frameworks described in the “ESG Risks” section above.
The Chief Risk Office function of the bank produces climate and environmental risks reports to allow for the monitoring of climate risk metrics in the bank’s portfolios at different levels of the organization:
– The Group Risk Committee and the Group Sustainability Committee receive a detailed quarterly climate and environmental risk report that includes financed and facilitated emissions, exposure to carbon-intensive sectors, alignment with portfolio decarbonization targets and other climate transition, climate physical, and nature risks KPIs, Early Warning Indicators and other topics, including key industry and regulatory developments
196
|
Deutsche Bank |
||
|
Pillar 3 Report as of December 31, 2024 |
||
– The Enterprise Risk Committee and the Net Zero Forum receive, in addition to the quarterly reports, monthly flash reports on key metrics (i.e. measuring alignment with decarbonization targets and the consumption of divisional carbon budgets)
– The Management Board receives monthly updates on financed emissions and net-zero alignment via the “Risk and Capital Profile” report.
Risk management: financial effects of environmental factors
Climate change and environmental degradation may lead to the emergence of new sources of financial and non-financial risks. Transition risks to the bank’s portfolios are increasingly likely to materialize in the medium- to long-term as governments introduce climate-related targets and policies, as society adapts its behavior and as investor appetite for carbon-intensive clients/ sectors becomes more selective. These risks include but are not limited to:
– Increased default risk and/or valuation losses on exposures to clients and assets that may be impacted by climate physical and/or transition risks, such as climate-related developments in policy and regulations, the emergence of disruptive technology or business models, shifting market sentiment, and societal preferences
– Reputational risks resulting from a failure to adapt to climate risks, which may also lead to litigation by parties seeking compensation after suffering loss or damage, and
– Business disruption risks to the bank’s offices, employees, and processes in locations facing physical climate risks, such as extreme weather events and/or disruptive longer-term increases in global temperatures
The Chief Risk Office conducts a comprehensive and granular financial materiality assessment of climate and other environmental risks to identify potential financial impacts across key impacted risk types. The 2024 iteration of the exercise used an enhanced range of scenarios and approaches to assess potential outcomes over the short (1-2 years), medium (3-5 years) and long-term (>5 years).
The results of the exercise indicate that short-term financial impacts are limited. Even in the higher transition risk scenarios, there is limited rebalancing away from fossil fuels and other demand/ technology shifts over such a short time frame, while physical risks are not expected to materially change in this time frame.
In the medium-term, higher impacts linked to climate transition risk drivers in the net-zero emission scenario materialize through credit, operational, strategic and reputational risks, driven by factors such as:
– Deterioration in Oil and Gas and Coal credit risk profiles with larger impacts starting to emerge for corporate clients in other high carbon intensity sectors as well as for the most vulnerable sovereigns and financial institutions
– Valuation pressure on less energy efficient real estate exposures due to a tightening of energy efficiency minimum standards and increased costs associated with energy consumption
– Foregone revenues due to exit of carbon intensive clients with no credible transition strategy and higher competition for sustainable clients/ financing
– Potential reputational and litigation risks should the bank be seen as a negative outlier relative to peers in terms of the execution of its sustainability commitments
– Potential for operational risk impacts from physical risk events
In the long-term, cumulative impacts are higher across all risk types and scenarios. Across the higher transition scenarios, a broader range of clients are impacted and potential deterioration in portfolio credit quality becomes more pronounced. Revenue attrition (strategic risk) and potential reputational impacts are also higher. Physical risks drive losses in the low transition risk scenarios, materially impacting operational, credit, strategic and reputational risks. The ‘Disorderly transition’ scenario, yields the highest losses across all scenarios as clients face punitive carbon taxes and related policies with limited time to adapt.
Risk management: integration of environmental factors and risks into the bank’s risk framework
Climate and other environmental risks are considered as risk drivers of the main risk types of the bank (namely Credit, Market, Liquidity, Operational, Reputational and Strategic risks) and are incorporated into their respective management frameworks, under the oversight of the Enterprise Risk Committee.
Deutsche Bank’s framework for the management of environmental risks has four key elements and each one considers the short-, medium- and long-term effects of environmental risks:
– Risk identification and materiality assessment
– Risk measurement, monitoring and mitigation, integration into risk type frameworks and processes
– Scenario analysis and stress testing, and
– Risk metrics, targets, and integration in appetite
197
|
Deutsche Bank |
||
|
Pillar 3 Report as of December 31, 2024 |
||
Risk management: methodologies and international standards used
Deutsche Bank relies on several different industry frameworks and standards for the management of climate and other environmental risks. The overall risk assessment and reporting framework reflects the recommendations of the Task Force on Climate-related Financial Disclosures (TCFD). The estimation of financed emissions is based on the standard from the Partnership for Carbon Accounting Financials (PCAF). Methodologies for the bank's sector decarbonization targets are proprietary, leverage the Paris Agreement Capital Transition Assessment (PACTA) approaches and are in line with those set by peers.
Risk management: process to identify, measure and monitor environmental risks
The Chief Risk Office function conducts comprehensive financial materiality assessments of climate and other environmental risks to identify key impacts across potentially affected risk types. The drivers considered in the materiality analysis are climate transition risks arising from policy, technology and behavioral changes, acute and chronic physical risks and nature (other environmental) risks. Material climate and environmental risk drivers are then managed through the relevant risk type frameworks of the bank (Credit, Market, Liquidity, Operational, Reputational and strategic risks).
The impact assessment uses a combination of stress test results, other scenario and sensitivity analysis and qualitative expert judgement.
Deutsche Bank is committed to align its loan portfolios with emissions reduction pathways needed to achieve net zero by 2050. The bank’s decarbonization targets, together with the quantitative risk appetite thresholds integrated into the Group Risk Appetite Statement, are the main levers used to mitigate climate transition risks by progressively reducing the carbon intensity of the bank's portfolio. In addition, Early Warning Indicators described above (section “Environmental risk / Business Strategy and processes”) are used to monitor concentrations of climate-transition, climate-physical and nature-related risks in the bank’s Corporates, Sovereigns and Financial Institutions portfolios. Lastly, Deutsche Bank's Environmental and Social Policy Framework, including the bank’s provisions for the fossil fuel sectors outlines specific restrictions and escalation requirements for sectors with inherently elevated potential for negative environmental impacts. To support the bank’s materiality assessment, monitor portfolio alignment to decarbonization targets, and for risk management purposes, Deutsche Bank uses several complementary KPI and metrics such as:
– Upstream Oil & Gas: Scope 3 Absolute financed emissions (million tons of CO2)
– Coal mining (million tons of CO2)
– Power Generation: Physical emission intensity (kgCO2e per MWh)
– Automotive (Light Duty Vehicles) sector: Physical emission intensity (gCO2e per vehicle km)
– Steel production sector: Physical emission intensity (kgCO2e per ton of steel)
– Shipping (Poseidon Principles portfolio alignment score, %)
– Cement (kgCO2e per ton of cement)
– Aviation (Pegasus Guidelines portfolio alignment score, %)
– Corporate loan commitments: absolute financed emissions (scope 1 and 2, million tons of CO2e) and annual increase in financed emissions
– Corporate loan outstanding: absolute financed emissions (scope 1 and 2, million tons of CO2e)
– Sectors in scope of net-zero targets: Share of net-zero clients
– Relevant sectors in scope of net-zero targets: Technology mix
– Financed emissions for selected mortgage and commercial real estate portfolios (using proxies based on Energy Performance Certificate ratings and internal methodologies)
– Exposure to physical climate risk for uncollateralized loans and loans collateralized by Real Estate assets
– Facilitated emissions for the bank’s capital market activities in key carbon-intensive sectors
– Corporate, Sovereign and FI portfolio: KPIs established to monitor portfolio exposure, quality and tenor to clients and sectors assessed as having higher vulnerability to climate transition, physical and nature-related risks
Furthermore, climate and broader environmental risk drivers are integrated into the frameworks and processes of Deutsche Bank’s main risk types: Credit, Market, Liquidity and Non-Financial (Operational / Reputational) risks.
– Credit risk - climate risk drivers are integrated across the different stages of the transaction lifecycle, including transaction approval / client onboarding, risk classification and credit ratings, portfolio analysis and monitoring, collateral valuation
– Market risk - As part of the Market Risk Identification process individual business lines are asked to consider forward-looking and/or idiosyncratic material risks including climate and other environmental risks; climate related risks are currently managed within the existing risk framework and treated as a price trigger, in the same way as market events such as central bank announcements or earnings announcements; furthermore, a new climate stress scenario used to assess transition and physical risks in the trading book portfolio is now embedded into the bank’s market risk appetite framework
– Liquidity risk - Deutsche Bank uses stress testing and pathway analysis to assess the impact of climate risk; in particular, the bank’s stressed Net Liquidity Position Scenarios, run on a daily basis, include climate disasters as possible triggers of stress
– Operational Risk Management Framework - climate risk identification takes place through analysis of past internal and external operational risk events; exploratory scenario analysis is also used to analyze potential event situations and the effectiveness of related controls to identify areas for further risk mitigation and strengthening of the control environment. Business Continuity and Third-Party Risk Management frameworks are in place to manage risks of disruption to processes and services taking an all-hazards approach
198
|
Deutsche Bank |
||
|
Pillar 3 Report as of December 31, 2024 |
||
– Reputational risk - impacts arising from the bank’s business activities in higher risk sectors are managed through its Environmental and Social Policy Framework, an integral part of the bank’s Reputational Risk Framework which outlines specific restrictions, escalation and due diligence requirements for sectors with elevated environmental risks
Data and methodologies for measuring and assessing climate-related risks for selected products and portfolios are still under development. The lack of availability of comprehensive and consistent climate and environmental risk disclosures by clients means that risk analysis is heavily reliant on proxy emissions estimates and top-down, sectoral-/ product-based taxonomies.
Risk management: commitments and other forms of risk mitigation
The orderly and progressive execution of the bank’s sustainability strategy, including net- zero targets, growth in sustainable and transition financing, greater integration of Nature into the bank’s risk frameworks, as well as client / product / and regional strategies, is key to mitigate credit and reputational risk impacts over the long term.
In addition, the management of exposures to transition, physical and nature risks through a) risk appetite around the decarbonization targets and overall financed emission and b) Early Warning Indicators and c) sectoral requirements and restrictions is discussed in sub-section “Business strategy and processes: objectives, targets and risk appetite” of these qualitative disclosures.
On the capital side, results of the materiality assessment are considered in the risk management frameworks, including the risk inventory and ICAAP assessment. To ensure that the bank remains resilient to these shocks and adequately capitalized, Deutsche Bank has in place an expert-driven add-on to its economic capital. This add-on is designed to capture uncertainty related to tail losses that could arise in certain sectors from unexpected and abrupt changes in carbon prices.
More broadly environmental risks are managed by the bank through incorporation into the frameworks of each of its main risk types: Credit, Market, Liquidity and Non-Financial, discussed in more detail below.
Credit risk framework
Climate and environmental risk drivers are integrated across the different stages of the transaction lifecycle including transaction approval/client onboarding, risk classification and credit ratings, portfolio analysis, and monitoring and collateral valuation.
Climate and environmental risks are incorporated into the credit approval process for corporate clients via enhanced due diligence requirements. New loan requests above selected tenor and rating-based thresholds to corporate clients in carbon-intensive sectors as well as those in sectors vulnerable to climate-physical and nature (or “other environmental”) risks require a dedicated risk assessment from the Front Office and review by Credit Risk Management.
As part of the internal credit rating process, climate and other environmental risks must be assessed and, where deemed material, documented. For corporate clients, this assessment is supported by:
– Transition risk scorecards which use externally sourced data to assess the clients’ historical performance in terms of their GHG emissions, the scope and governance of climate commitments of clients versus their peers
– Physical risk scorecards providing an indication of the financial impact a given client is likely to sustain, per natural hazard type, based on asset data held for the company by S&P. The scorecard is also used as a basis for selected physical risk KPIs
The output of this assessment may lead to adjustments of relevant inputs to the bank’s internal credit rating model.
In the course of 2024, a nature-risk dashboard was implemented in the credit risk systems of the bank and made available to credit officers to support their nature-risk assessment within the credit approval process. More information on the assessment underlying the nature-risk dashboard is included in the “Metrics and targets – Nature-related (or other-environmental) risks” sub-chapter of the “Climate change” chapter within this Sustainability Statement.
Climate risks are considered as potential triggers for inclusion in the watchlist of groups or counterparties in carbon-intensive industries and without adequate transition risk mitigation strategy in place (and / or with limited financial resources to finance transition). The criteria take into consideration internal credit ratings and the scores from the transition risk scorecards.
Lastly, Deutsche Bank's Environmental and Social Policy Framework outlines specific restrictions, due diligence and escalation requirements for sectors with inherently elevated potential for negative environmental impacts.
199
|
Deutsche Bank |
||
|
Pillar 3 Report as of December 31, 2024 |
||
With regards to the valuation of collateral, the bank’s Global Collateral Management Guide (for Banking Book Collateral) sets its environmental standards based on the requirements of the Capital Requirements Regulation for the initial valuation, monitoring, and review over the life of the loan. Deutsche Bank’s underwriting standards require real estate collateral to be appropriately insured against relevant risks including applicable natural hazards. In some countries, supplemental insurance against natural hazards is provided by the government. The European residential real estate portfolio amounted to € 166.4 billion at year-end 2024. Residential mortgages for private clients in Germany represent approximately 92% of this amount and around 1.2 million German private residences financed by loans secured by immovable properties are insured appropriately against relevant risks including applicable natural hazards. The insurance cover by real estate owners is monitored and complemented or substituted by Deutsche Bank´s own insurance.
In addition, new valuations and re-valuations require the identification of material environmental physical and transition risks that could materialize. Any identified material risks must be reflected in the credit decision and / or valuation if not mitigated by construction measures and / or insurance cover. Comparable requirements are in place for other physical collateral, including large movable assets (such as airplanes and ships) and smaller assets (such as cars and machines). Insurance coverage on loan collateral is monitored on a regular basis, including by means of onsite inspections.
Market risk framework
As part of the Market Risk identification process, individual business lines are asked to consider forward-looking and / or idiosyncratic material risks, including climate and other environmental risks, which must be included in the Market Risk identification documentation. Additionally, as part of the new product and transaction approval control standards of the Market & Valuation Risk Management function, environmental drivers are required to be assessed and recorded as part of the approval process.
Climate-related risks are managed within the existing market risk framework and treated as a price trigger, in the same way as market events such as central bank announcements or earnings announcements. Market risk monitors and reports “highly carbon-intensive” exposures (as per Deutsche Bank’s climate risk taxonomy) and financed emissions in its traded credit portfolio. The report provides granular views required for the management of exposures, and the top exposures are reported to the Enterprise Risk Committee on a quarterly basis.
Furthermore, a weekly climate stress scenario to assess transition and physical risks in the trading book portfolio is embedded into the bank’s market risk appetite framework.
Liquidity risk framework
Deutsche Bank uses stress testing and pathway analysis to assess the impact of climate risk on liquidity. In particular, the bank’s stressed net liquidity position scenarios, which are run daily, include climate disasters as possible triggers of stress (physical risks).
The analysis shows that physical risks are generally smaller than other risks for which the bank daily reserves liquidity. Transition risk, which is expected to develop incrementally over many years, will be managed through the Group’s annual funding planning processes. The bank also runs an internal climate stress test on liquidity.
Non-financial risk framework
Non-Financial Risk Management has a dedicated policy on ESG Integration in the Risk Management Framework and Operational Risk Framework Procedures detailing sustainability-related requirements for business divisions and Risk Type Controllers. The team uses an ESG flag to identify operational risk types where key ESG risk drivers are identified in the taxonomy.
The impacts of ESG risk drivers are assessed as part of the risk and control assessment process of relevant non-financial risk types. A monthly working group is in place to support collaboration between business divisions, risk and control functions on the introduction and monitoring of ESG as an integral element of Non-Financial Risk Management. This working group acts as a forum for sharing activities, new regulations, remediation activities, and monitoring ESG risk drivers across Deutsche Bank’s non-financial risk profile.
In 2024, several banking supervisors and regulators continued to focus on the topic of greenwashing. Several initiatives have been conducted by Deutsche Bank to improve its control environment and raise internal awareness on greenwashing, including:
– Conducting a deep dive risk review in relation to the existing control environment around greenwashing
– Applying scenario analysis as a standard risk management tool to investigate potential sources of ESG-related litigation risks, understand the main drivers and causes of such scenarios (e.g., the misrepresentation of sustainability information in corporate communication or public disclosures) as well as which controls or remediation activities can mitigate such scenarios and what steps are to be taken to improve the control environment
– Continuous monitoring of external cases of greenwashing
– Introducing mandatory greenwashing training for all Deutsche Bank employees
The management of reputational risk arising from climate and environmental risks is covered in the “ESG due diligence” chapter within this Sustainability Statement.
200
|
Deutsche Bank |
||
|
Pillar 3 Report as of December 31, 2024 |
||
Social risk
ESGT2
Deutsche Bank’s responsibility to support and, where possible, accelerate the transformation towards a more sustainable society and economy is also reflected in its approach towards social rights, including human rights. Their infringement can result in reputational risks to the bank in case the bank supports clients appearing not to adhere to social minimum standards as well as financial risks, e.g. credit and market risks, if client creditworthiness is directly or indirectly impacted by the emergence of inadequate management of social risks.
Compared to environmental risks the potential evolution of social risks is considered more heterogenous in nature. In developed economies and many larger Emerging Market economies, strict laws and policies exist which seek the respect of human rights and prohibit their related impacts, which may drive social risks. Selected economies suffer from weaker legislation and may continue to present sources of elevated risks going forward. At a global level, the bank does currently not anticipate a significant increase in social risks in the near future. Over the long-term, however, demographic pressures, including those driven by climate-related factors, may lead to increased pressure on public services and fiscal budgets in countries which are key sources of inward migration. This may raise social risks to Deutsche Bank's clients.
The bank works with its stakeholders to tackle social challenges with a current focus on human rights. Deutsche Bank has a long-standing commitment to respecting human rights and has voluntarily endorsed international standards such as the UN Guiding Principles on business and human rights. Internationally recognized human rights, as they relate to business and human rights, at a minimum are those expressed in the International Bill of Human Rights and the principles concerning fundamental rights set out in the International Labour Organization’s Declaration on Fundamental Principles and Rights at Work. More details of Deutsche Bank’s commitment can be found in Deutsche Bank Group’s Statement on Human Rights.
Deutsche Bank acknowledges the relevance of other social risks besides those relating to human rights. Specifically, the bank recognizes that socio-economic developments, for example, climate change and the transition to a low carbon economy, have social impacts such as ending of certain jobs and skills. This risk is particularly relevant for countries heavily dependent on fossil-fuel industries as well as for those with limited means of funding the transformation to a more sustainable, climate-resilient economy. For this reason, the bank has committed itself to supporting a socially just transition as part of its Initial Transition Plan, published in October 2023. The overall concept of a just transition though rapidly evolving is still at a nascent stage and requires development of more context-specific guidance to enable broader integration across the bank’s processes.
Governance
Deutsche Bank has integrated the oversight of sustainability-related matters into governance structures on several levels. Ultimately, the Management Board of Deutsche Bank AG as the parent company of the Deutsche Bank Group assumes responsibility for matters relating to sustainability, including the supervision and management of social risks, including risk stemming from human rights, in the short-, medium- and long term.
To integrate these responsibilities into the organizational structure, the Management Board has delegated these tasks to the Group Sustainability Committee. It is chaired by the bank’s Chief Executive Officer, the Chief Sustainability Officer is acting as deputy. The Group Sustainability Committee is the senior decision-making body for sustainability-related matters at group level, including those related to social risks.
Apart from the Group Sustainability Committee, there are further senior committees who are responsible for the development and management of specific elements of social risks:
– The Group Reputational Risk Committee, a direct subcommittee of the Management Board since 2024, has the responsibility to review, decide and manage all transactions, client relationships or other primary reputational risk matters escalated in line with the underlying reputational risk policies and framework, including sustainability-related matters.
– The Non-Financial Risk Committee which oversees, governs, and coordinates the management of non-financial risks group-wide and establishes a cross-risk and holistic perspective of the bank’s key non-financial risks, including risks to own infrastructure and employees arising from climate, environmental, and social risks.
As part of Deutsche Bank’s overall sustainability strategy and building on its former Human Rights Working Group, the bank established a group-wide Human Rights Forum with a mandate to oversee Deutsche Bank’s management of human rights-related matters, monitor human rights-related trends, liaise with external experts, and initiate human rights-related projects.
The Human Rights Forum, which met quarterly in 2024, is co-chaired by the Head of Group Sustainability and the Head of Human Rights and reports to the bank's Group Sustainability Committee. The Forum consists of senior representatives from the bank's business divisions and infrastructure functions, which are also responsible within their respective remits to address relevant human rights issues in case they occur and to track the effectiveness of remedial actions.
201
|
Deutsche Bank |
||
|
Pillar 3 Report as of December 31, 2024 |
||
The Forum complements the bank's established risk management and due diligence processes within its business activities and operations. In line with the Group’s reputational risk management processes, individual cases related to potential human rights challenges linked to a client profile or transaction may be escalated to the bank’s Reputational Risk Framework. Following review and support by the business divisions, matters may be escalated to one of the bank's Regional Reputational Risk Committees or referred to the Group Reputational Risk Committee chaired by the Chief Risk Officer.
Furthermore, Deutsche Bank engages with stakeholders from broader society to understand their views on local and global environmental and social trends and challenges. In 2024, important topics of this engagement have been financing fossil fuels and protection of nature. Deutsche Bank responded to written requests, surveys, or questionnaires, and repeatedly engaged with non-governmental organizations to discuss the themes of their engagement. Group Sustainability within the Chief Sustainability Office is in charge of conducting this engagement and it reports to the Reputational Risk team within Non-Financial Risk Management on these engagement activities and topics on a monthly basis.
The Reputational Risk Team provides monthly updates on reputational risk topics to the Secretaries of the Unit Reputational Risk Assessment Process. The Risk and Capital Profile Report, which includes updates on reputational risks, is distributed to the Management Board and Supervisory Board on a monthly basis. It includes details such as the number of reputational risk issues assessed by the various committees and their decisions. Externally Deutsche Bank reports on progress in implementing its human rights approach by publishing the Human Rights Statement and Modern Slavery and Human Trafficking Statement.
To further strengthen its human rights management, a dedicated Head of Human Rights within the bank’s Chief Sustainability Office supports the management of human-rights-related initiatives and is responsible for advancing these initiatives throughout the bank. The Head of Human Rights assumes responsibilities for overseeing Deutsche Bank’s management of human rights and coordinating processes and communication channels to evaluate the effectiveness of the bank’s human rights management approach. Further responsibilities of the Head of Human Rights include the development of overarching standards for human rights management, defining risk management standards in collaboration with risk management and other functions, coordination of strategic human rights projects, representation of Deutsche Bank in relevant networks, and acting as a point of escalation for human-rights-related concerns.
Strategy and processes
Deutsche Bank places strategic importance on social topics. This includes the social dimension of
– adherence to minimum human rights and related requirements
– its sustainable finance and ESG investments volumes,
– specific restrictions on business activities with high-risk clients, as outlined in the bank’s Environmental and Social Due Diligence process
While it remains the governments’ legal obligation to protect against human rights abuses by third parties, including business enterprises, through appropriate policies, legislation, regulations, and adjudication, Deutsche Bank models its corporate responsibility pursuant to the “Protect, Respect and Remedy” framework of the UN Guiding Principles on Business and Human Rights.
This responsibility includes the need to respect human rights by avoiding causing or contributing to adverse human rights impacts from the bank’s own activities and by seeking to identify, prevent, address, mitigate and manage actual and potential adverse human rights impacts, which are directly linked to Deutsche Bank’s operations, products, or services. As such, the bank has established risk management frameworks, which also covers the management of human rights risks. More details of Deutsche Bank’s commitment can be found in Deutsche Bank’s Statement on Human Rights, Modern Slavery and Human Trafficking Statement, which have been approved by the Management Board and are publicly available.
Deutsche Bank's objectives in terms of the bank's contribution to identifying, preventing, addressing, mitigating, measuring and managing actual and potential human rights-related risks and social challenges cover:
– Understanding where the bank's business activities might trigger human rights impacts by identifying the bank’s exposure to human rights risks across its upstream and downstream value chain as well as own operations
– Identifying sectors and countries having inherently higher risks of negatively impacting human rights
– Ensuring that the bank's frameworks and processes adequately address human rights risks based on the bank’s exposure
– Offering financial solutions helping to address human rights-related and other social challenges
– Providing transparency on the bank's human rights management approach
To reinforce employee’s awareness of activities linked to potential human rights violations, Deutsche Bank has undertaken several initiatives. The bank conducted dedicated awareness sessions in cooperation with external partners. Furthermore, the bank conducted periodic trainings to reinforce employees’ awareness of activities linked to potential human rights incidents. One specific example is a 45-minute mandatory annual online course on anti-money laundering and the prevention of terrorist and proliferation financing, topics that have potential connections to human rights incidents. The course explains what modern slavery and human trafficking is and presents a scenario showing how typical risks can be recognized. Every Deutsche Bank employee worldwide (including contingent workers) must complete the module once every year. The completion rate in 2024 was 99.82%,
202
|
Deutsche Bank |
||
|
Pillar 3 Report as of December 31, 2024 |
||
An online mandatory Risk Awareness training has been deployed to all employees every other year. Since 2022, it includes a specific case on modern slavery in the private banking business as well as a question for learners on typical risk indicators.
In February 2024, Deutsche Bank´s Anti-Financial Crime department organized a “Fighting Financial Crime Week” to discuss what the bank and its partners are doing to battle financial crime. Prominent industry experts discussed a range of topics connected to financial crime, including human trafficking. As such, the NGO Mekong Club presented the business of modern slavery and human trafficking, and explained how Deutsche Bank can help to mitigate these risks in the financial sector.
Deutsche Bank’ human rights governance also benefits from the exchange of ideas and experiences from its membership in the Thun Group of Banks, econsense, UNEP FI, and UN Global Compact. The bank’s Head of Human Rights is a member of the Thun Group’s steering committee.
By year-end 2024, at least € 46 billion of the bank’s total € 373 billion volumes in sustainable finance and ESG investments were categorized as social, while € 91 billion were related to both, environmental and social activities (excluding DWS). To demonstrate its commitment, Deutsche Bank issued its inaugural social bond of € 500 million in July 2024. This was made possible by expanding the existing Green Instruments Framework to include social criteria in the Sustainable Instruments Framework. Examples of Deutsche Bank’s financing activities include social housing or hospital financing in Sub-Saharan Africa. While the volume of social investments is smaller than environmental investments, Deutsche Bank keeps strengthening its social financing activities, particularly in support of social housing and just transition. These social financing activities might involve components such as nature-based solutions, which aim to protect both indigenous communities and the environment. An example is Deutsche Bank’s involvement in the Indonesia Just Energy Transition Partnership.
Deutsche Bank identifies, prevents, mitigates, and manages actual and potential negative impacts on the environment and society as determined by the double materiality assessment and across the entire value chain. Downstream due diligence processes are holistically managed through Deutsche Bank’s Environmental and Social Due Diligence Framework. The Framework defines rules and responsibilities for risk identification, assessment, decision-making, and post-transaction monitoring, and specifies the requirements for environmental and social due diligence. Social criteria are directly linked to human rights which include child and forced labor; modern slavery; occupational health and safety; health, safety, and security of communities; protection of vulnerable groups such as Indigenous People; land and resource rights; and cultural heritage. The environmental and social due diligence requirements are embedded in the Sustainability Strategy Implementation Policy, complementary supporting documents and sectoral guidelines, and where reputational risk considerations are identified, these are referred to the Reputational Risk Framework, as appropriate. They build on international standards such as the UN Guiding Principles on Business and Human Rights and the International Labour Organization’s Core Labor Standards and integrate human rights considerations such as child and labor rights, health and safety of workers and communities including indigenous peoples’ rights.
Furthermore, Deutsche Bank has established enhanced due diligence requirements for clients active in sectors and countries identified as being sensitive to negative human rights impacts. Environmental and social issues that deem to pose at least a moderate reputational risk are subject to the established reputational risk review process. The respective social due diligence provisions are developed by Group Sustainability and are embedded into Deutsche Bank’s reputational risk procedures. While assessing its clients' human rights related practices, the bank expects as a minimum compliance with respective national laws and regulations and, where appropriate, the bank embeds industry specific internationally recognized best practices and standards. As a signatory to the Equator Principles, the bank's due diligence for project related financing in scope of the Equator Principles application follows the respective requirements, including the International Finance Corporation’s Performance Standards 5 and 7, which specifically addresses social topics such as resettlement and indigenous people’s rights. Additionally, the bank is guided by the Human Rights due diligence guidance provided under Equator principles 4, where, if applicable, Deutsche Bank expects clients to undertake Human Rights due diligence in line with UNGPs to assess their actual and/or potential negative impacts on the human rights of affected communities and other stakeholders.
If Deutsche Bank has concerns about a client with regards to human rights, it consults with relevant stakeholders. This might include direct engagement with the client as well as - in an anonymized form - with civil society representatives that are familiar with the situation or affected communities. Where appropriate, the bank obtains the advice of independent experts. Based on the available information and its assessment of the risks that have been identified, the bank decides on the further course of action, which may include working closely with the client, introducing remediation measures and seeking to encourage the client to prevent or mitigate the impact, or the termination of a business relationship.
Risk Management
Deutsche Bank takes steps to identify, prevent, address, mitigate, measure, and manage actual and potential adverse human rights risks by understanding where its business activities and operations might trigger a negative impact on human rights. The bank’s minimum standards relating to human rights and other social risks are:
203
|
Deutsche Bank |
||
|
Pillar 3 Report as of December 31, 2024 |
||
– Deutsche Bank does not engage in business activities where the Group has substantiated evidence of material adverse human rights impacts and it is determined through its internal processes that such adverse human rights impacts cannot be avoided or appropriately mitigated
– Enhanced due diligence requirements for a determined set of sectors, across project finance and in instances where material controversies related to human rights have been identified
– Enhanced due diligence requirements in the defense sector with exclusions including controversial weapons, conflict countries, private military security companies, as well as civilian-use automatic and semi-automatic firearms and human-out-of-the-loop weapon systems
– Enhanced due diligence requirements with regards to adult entertainment with exclusion of any business directly associated with adult entertainment (commercial enterprises related to the sale or purchase of sex-related services, ranging from individual workers in prostitution to the pornographic entertainment industry), associated branded products or services or prostitution
– Enhanced due diligence required related to gambling with exclusion of online gambling Business-to-Consumer operators with exposure to markets where gambling is prohibited
As a global bank, Deutsche Bank operates in many jurisdictions across the world and supports many sectors with its financial services, which provide an opportunity to help addressing social challenges, but also might expose the bank to the risk of being linked to adverse social impacts. The bank’s Know-Your-Client processes utilize a range of tools to identify adverse issues related to a client. For example, the bank considers media screening as part of its onboarding and regular client review processes. In case adverse social issues related to media hits are being identified the client must be referred to Group Sustainability for further assessment in line with the bank’s requirements for enhanced due diligence. Being a global financial institution that provides a broad range of products and services also exposes Deutsche Bank to diverse financial crime risks, including modern slavery and human trafficking. Deutsche Bank’s group-wide framework for the prevention of financial crime is inter alia preventing, deterring, and detecting client activities that might be linked to potential human rights violations. The Principles for the Management of Financial Crime Risks outline the responsibilities and accountabilities of the AFC function and of all Deutsche Bank employees and describe the essential organizational requirements and relevant processes for the management of financial crime risks across the 1st and 2nd line of defense. Global AFC policies define minimum standards for managing financial crime risks, including those with implications for human rights. These bank-wide policies are supplemented by country-specific policies and procedures that reflect national laws and regulations.
Further to the policies and processes stipulating the due diligence requirements regarding social and human rights management practices of clients, Deutsche Bank policies and procedures also address potential sector-inherent adverse social risks associated with product offering by certain sectors. In particular, the bank has established policies regarding the defense, gaming and adult entertainment sectors, which are addressed within the bank’s Reputational Risk Framework. In accordance with the Reputational Risk Framework matters linked to these industries must be reviewed by subject matter experts.
Governance risk
Governance
ESGT3
Governance is a priority for Deutsche Bank which is embedded in the organization’s code of conduct. This forms the basis for Deutsche Bank’s management of governance risks. Types of governance risk include counterparties with issues such as transparency and inclusiveness, or clients involved in bribery and corruption scandals, or accused of tax avoidance or optimization. Deutsche Bank addresses these concerns via different frameworks and processes including those relating to reputational risk and AFC.
ESG risks and governance risks specifically are integrated into the Reputational Risk Framework and AFC frameworks as deemed appropriate by the organization e.g. the Reputational Risk Framework would review any concerns regarding counterparties the institution is engaging with that could cause potential moderate or material reputational risk. The Reputational Risk Framework provides consistent standards for the identification, assessment, and management of reputational risk issues. Reputational impacts which may arise because of a failure from another risk type, control or process are addressed separately via the associated risk type framework and are therefore not addressed in this section. The Regional Reputational Risk Committees, which are 2nd LoD Committees serve as escalation bodies for their respective regions of Deutsche Bank and the Group Reputational Risk Committee serves as the escalation body at the group level on behalf of the Management Board. The oversight, governance and coordination of the management of reputational risk at Deutsche Bank falls under the responsibility of the Head of NFRM.
The escalation procedure for reputational risk requires that relevant stakeholders are consulted for input, such as country management, key control functions, and other second-line subject matter experts. The Unit Reputational Risk Assessment Process (Unit RRAP) is chaired by a business division’s relevant senior manager and applies to all matters deemed to pose moderate or greater reputational risk. If a matter is considered to pose a material reputational risk and/or meets one of the bank’s mandatory referral criteria, it is referred for further review to the relevant Regional Reputational Risk Committee. In exceptional circumstances, matters are referred to the Group Reputational Risk Committee.
204
|
Deutsche Bank |
||
|
Pillar 3 Report as of December 31, 2024 |
||
AFC acts as an independent function setting policies and minimum control standards for the management and mitigation of financial crime risks at Deutsche Bank, including those relating to clients or counterparties that may be the subject of allegations of bribery and corruption. Deutsche Bank’s business divisions are responsible and accountable for the implementation and operationalization of these policies and standards. The Management Board ensures that AFC can execute its tasks independently and effectively.
Strategy and processes
Deutsche Bank’s Group Risk Appetite Statement (GRAS) covers the bank’s position on reputational risk and AFC risk appetite which integrates governance risk concerns. The GRAS is owned by Enterprise Risk Management, reviewed by the Group Risk Committee and acknowledged by the Management Board on an annual basis.
Deutsche Bank has limited appetite for transactions or relationships with material reputational risk or in areas which inherently pose a higher reputational risk, such as the defense, gaming, or adult entertainment sectors, where there are ethical concerns and potential concerns of corruption and bribery. Specifically, matters are deemed to pose material reputational risk if they are considered likely to: attract significant negative media attention; result in repeated criticism via various media channels, NGO letters or formal campaigns; be opposed by significant cross-sections of the public; result in regulatory criticism and / or may have a negative impact on DB’s relationship with any supervisory authority; result in criticism at DB’s annual general meeting; trigger client attrition; or, result in employees questioning how the matter fits in with DB’s values. These cases are reviewed via the Reputational Risk Framework on a case-by-case basis considering views from a broad range of stakeholders. Reputational risk, including governance risk, cannot be precluded as it can be driven by unforeseeable changes in perception of the Group’s practices by various stakeholders (e.g. public, clients, shareholders and regulators).
Deutsche Bank has no tolerance for its employees or third parties acting on its behalf engaging in bribery or corruption. On an annual basis, Deutsche Bank undertakes an assessment of inherent bribery and corruption risks and corresponding controls across all its businesses. Deutsche Bank has continued to reduce its exposure to areas that present a higher inherent risk of bribery and corruption, such as the use of business development consultants. Deutsche Bank continues to implement new, and further enhance its existing, controls in these key risk areas. These controls are both preventative and detective and include enhanced due diligence on clients, vendors and other third parties, contractual representations, and warranties, monitoring of relevant payment flows, as well as the monitoring of client, vendor, and other third-party relationships. Potential instances of bribery or corruption are independently investigated, and any employee determined to be engaged in such behavior would be subject to disciplinary action, including red flags, up to and including termination of employment. All Deutsche Bank’s bribery and corruption policies and procedures also apply to all temporary/contract employees. Identified instances of bribery and corruption would be reported to senior management and relevant legal or regulatory authorities. See chapter on “Whistleblowing” for further information.
Deutsche Bank has policies, procedures and controls that cover those areas that present an increased risk of bribery and corruption, the cornerstone of which is the Anti-Bribery and Corruption Policy. These policies cover all key areas of Deutsche Bank’s bribery and corruption risk exposure, including gifts and entertainment, charitable donations, hiring practices, joint ventures and strategic investments, vendor risk management, books and records, and political contributions.
Deutsche Bank has also implemented a holistic fraud risk management framework across all lines of defense, defining governance and minimum standards, and establishing key controls to mitigate the risk of fraud, such as mandatory time away and fraud transaction monitoring. The Anti-Fraud Policy also sets out the applicable minimum requirements and defines the prohibition of fraud including internal fraud by employees against Deutsche Bank, its clients and other third parties, fraud by external parties against Deutsche Bank, the understanding and assessment of fraud risk, as well as the escalation of internal and external fraud.
Risk management
DB uses a risk-based approach to identify counterparties of concern and determine appropriate escalation steps. This means for governance risk that DB will assess areas such as ethical considerations, strategy and risk management, inclusiveness, transparency, conflict of interest management and internal communication on critical concerns, if they have been deemed to carry an additional risk factor. For example, via the presence of adverse media, allegations, or NGO activities regarding concerns with the governance of the counterparty. Once concerns are identified they are escalated within the existing Reputational Risk and AFC frameworks as deemed appropriate. Deutsche Bank’s Sustainability Statement (https://investor-relations.db.com/reports-and-events/annual-reports) provides further details on the Rep Risk Framework and AFC/KYC processes.
The Reputational Risk Framework is in place to manage the process through which active decisions are taken on matters which may pose a reputational risk, before the event, and in doing so to prevent damage to Deutsche Bank’s reputation wherever possible. Along with other reputational risk matters, this Framework is used to assess any issues identified in relation to the governance performance of counterparties, including the role of the counterparty’s top governing body, from a reputational risk management perspective. Such concerns can be driven by allegations of corruption and bribery, aggressive business practices and/or issues around transparent business dealings. The Framework is also utilized to discuss reputational risks arising from, but not limited to, counterparty concerns perceived to be in contradiction with Deutsche Bank’s code of conduct, and potential issues with the business purpose/economic substance of the transaction or product, high risk industries, environmental and social considerations, and the nature of the transaction or product or its structure and terms.
205
|
Deutsche Bank |
||
|
Pillar 3 Report as of December 31, 2024 |
||
Under the Reputational Risk Framework, all employees are responsible for identifying potential reputational risks and reporting them by means of the Unit RRAP. Each Business Division has an established process through which matters, which are deemed to be a moderate or greater reputational risk are assessed (Unit RRAP). The Framework is applicable across all Business and Infrastructure Divisions and Regions. Whilst every employee has a responsibility to protect Deutsche Bank’s reputation, the primary responsibility for the identification, assessment, management, monitoring and, if necessary, referring or reporting of reputational risk matters lies with Deutsche Bank’s Business Divisions as the primary risk owners.
To the extent the bank engages with third parties either to act on its behalf or as part of a joint venture or strategic investment, AFC will conduct appropriate levels of due diligence before entering into such a relationship to gain comfort with regard to the counterparty’s controls and whether engaging with the counterparty is within risk appetite. Equally, all new client adoptions are assessed for bribery and corruption concerns, and, where appropriate, will be reviewed as part of the reputational risk process described above.
Climate change transition risk
Financed emissions are emissions that banks and investors finance through on-balance sheet lending and investing activities. Greenhouse gases (GHG) can be distinguished into three categories: Scope 1, 2 and 3.
– Scope 1: Direct GHG emissions occur from sources owned or controlled by the counterparty
– Scope 2: Indirect GHG emissions from generation of purchased electricity, steam, heating, or cooling consumed by the counterparty
– Scope 3: Other indirect GHG emissions not included in Scope 2 occurring in the value chain of the counterparty; it can be further broken down into upstream emissions i.e., life cycle of materials, products or services up to the point of sale and downstream emissions i.e., distribution, storage, use and end-of-life treatment of products and services
Table ESG1 highlights potential transition risks the Group is exposed to on loans and advances, debt securities and equity instruments in the banking book as clients transition to a low-carbon and climate-resilient economy. Transition risk is deemed to be higher for those exposures not aligned with the EU Paris-Benchmark and exposures with a longer maturity, especially from clients operating in carbon-related sectors and highly contributing to climate change.
Starting June 30, 2024, Deutsche Bank reports the estimates of financed emissions (Scope 1,2 & 3) for exposures in the banking book. The Bank calculates its financed emissions within the Pillar 3 using the methodology from the Sustainability Statement 2024. Financed emissions reported in the table rely on MSCI data and the emission factors of the Partnership for Carbon Accounting Financials(“PCAF”). PCAF Data quality scores are calculated according to the rules outlined in PCAF’s Global GHG Accounting and Reporting Standard for the Financial Industry and reflect the extent to which sectoral proxy estimates were utilized in the calculation of financed emissions and are an indication of the challenges that the bank and the industry still face with getting access to consistent and audited client specific climate risk data.
Determination of clients not aligned with the EU Paris-Benchmark is done on a best-efforts basis, either based on available third-party data or relevant NACE codes considered for the EU PAB benchmark exclusion which has further been enhanced in December 2024 to include NACE codes as suggested by the Bundesverband Öffentlicher Banken Deutschlands (association of public banks in Germany). The coverage of available information on counterparty exposures is expected to improve over time and could result in further counterparties being identified as not aligned.
For those exposures excluded from the EU-Paris aligned Benchmarks, the bank manages these exposures within its risk management framework and in accordance with the bank’s net zero targets and Environmental and Social Framework, and related sectoral policies, where applicable.
Exposures to financial corporates are included in “K - Financial and insurance activities” according to EBA Q&A 2022_6600. The industry classification is based on the counterparty’s NACE code. Determined exposures against holding companies have been re-allocated to a different NACE code based on their economic operating model.
The increase in exposure of €29,7 bn was primarily driven by “K - Financial and insurance activities”, within “Exposures towards sectors other than those that highly contribute to climate change”.
206
|
Deutsche Bank |
||
|
Pillar 3 Report as of December 31, 2024 |
||
ESG1 – Banking book- Climate Change transition risk: Credit quality of exposures by sector, emissions and maturity
|
|
Dec 31, 2024 |
||||||||||||||||||||||||||||||||||
|
a |
b |
c |
d |
e |
f |
g |
h |
i |
j |
k |
l |
m |
n |
o |
p |
||||||||||||||||||||
|
Gross carrying amount |
Accumulated impairment, accumulated negative changes in fair value due to credit risk and provisions |
GHG financed emissions (scope 1, scope 2 and scope 3 emissions of the counterparty) (in Mtons of CO2 equivalent) |
GHG emissions (column i): gross carrying amount percentage of the portfolio derived from company-specific reporting³ |
<= 5 years |
> 5 year <= 10 years |
> 10 year <= 20 years |
> 20 years |
Average weighted maturity |
|||||||||||||||||||||||||||
|
in € m. |
of which: |
of which: |
of which: |
of which: |
of which: |
of which: |
of which: |
||||||||||||||||||||||||||||
|
1 |
Exposures towards sectors that highly contribute to climate change* |
149,910 |
11,032 |
796 |
26,339 |
7,676 |
(2,310) |
(214) |
(1,986) |
174 |
143 |
– |
125,286 |
10,613 |
7,896 |
6,115 |
3.5 |
||||||||||||||||||
|
2 |
A - Agriculture, forestry and fishing |
947 |
191 |
1 |
74 |
31 |
(9) |
(1) |
(7) |
2 |
1 |
– |
779 |
78 |
67 |
24 |
3.6 |
||||||||||||||||||
|
3 |
B - Mining and quarrying |
3,510 |
2,765 |
7 |
382 |
16 |
(28) |
(6) |
(17) |
20 |
12 |
– |
3,389 |
85 |
33 |
3 |
1.6 |
||||||||||||||||||
|
4 |
B.05 - Mining of coal and lignite |
98 |
50 |
0 |
1 |
2 |
(3) |
0 |
(2) |
1 |
1 |
– |
95 |
2 |
0 |
0 |
4.6 |
||||||||||||||||||
|
5 |
B.06 - Extraction of crude petroleum and natural gas |
2,687 |
1,991 |
7 |
366 |
11 |
(23) |
(6) |
(14) |
17 |
10 |
– |
2,587 |
74 |
25 |
1 |
1.3 |
||||||||||||||||||
|
6 |
B.07 - Mining of metal ores |
231 |
231 |
0 |
0 |
0 |
(0) |
0 |
(0) |
1 |
1 |
– |
230 |
0 |
0 |
1 |
1.2 |
||||||||||||||||||
|
7 |
B.08 - Other mining and quarrying |
171 |
171 |
0 |
15 |
2 |
(1) |
(0) |
(1) |
0 |
0 |
– |
155 |
9 |
6 |
1 |
4.1 |
||||||||||||||||||
|
8 |
B.09 - Mining support service activities |
323 |
323 |
0 |
0 |
0 |
(0) |
0 |
0 |
1 |
0 |
– |
322 |
0 |
1 |
0 |
2.1 |
||||||||||||||||||
|
9 |
C - Manufacturing |
35,645 |
2,134 |
412 |
5,198 |
1,614 |
(665) |
(45) |
(589) |
72 |
66 |
– |
32,466 |
2,021 |
1,008 |
150 |
1.9 |
||||||||||||||||||
|
10 |
C.10 - Manufacture of food products |
3,454 |
14 |
1 |
473 |
65 |
(42) |
(3) |
(35) |
3 |
3 |
– |
3,084 |
313 |
40 |
17 |
1.9 |
||||||||||||||||||
|
11 |
C.11 - Manufacture of beverages |
818 |
0 |
1 |
83 |
7 |
(8) |
(3) |
(3) |
0 |
0 |
– |
764 |
51 |
2 |
1 |
1.4 |
||||||||||||||||||
|
12 |
C.12 - Manufacture of tobacco products |
724 |
218 |
0 |
1 |
0 |
(0) |
(0) |
(0) |
0 |
0 |
– |
709 |
15 |
0 |
0 |
1.3 |
||||||||||||||||||
|
13 |
C.13 - Manufacture of textiles |
415 |
0 |
0 |
39 |
34 |
(16) |
(0) |
(15) |
1 |
1 |
– |
328 |
42 |
39 |
6 |
3.5 |
||||||||||||||||||
|
14 |
C.14 - Manufacture of wearing apparel |
189 |
0 |
0 |
29 |
33 |
(18) |
(0) |
(17) |
0 |
0 |
– |
145 |
20 |
23 |
1 |
3.1 |
||||||||||||||||||
|
15 |
C.15 - Manufacture of leather and related products |
171 |
0 |
0 |
38 |
8 |
(4) |
(0) |
(3) |
0 |
0 |
– |
152 |
9 |
9 |
1 |
2.0 |
||||||||||||||||||
|
16 |
C.16 - Manufacture of wood and of products of wood and cork, except furniture; manufacture of articles of straw and plaiting materials |
217 |
0 |
0 |
38 |
23 |
(20) |
(0) |
(20) |
0 |
0 |
– |
172 |
29 |
11 |
5 |
3.5 |
||||||||||||||||||
207
|
Deutsche Bank |
||
|
Pillar 3 Report as of December 31, 2024 |
||
|
|
Dec 31, 2024 |
||||||||||||||||||||||||||||||||||
|
a |
b |
c |
d |
e |
f |
g |
h |
i |
j |
k |
l |
m |
n |
o |
p |
||||||||||||||||||||
|
Gross carrying amount |
Accumulated impairment, accumulated negative changes in fair value due to credit risk and provisions |
GHG financed emissions (scope 1, scope 2 and scope 3 emissions of the counterparty) (in Mtons of CO2 equivalent) |
GHG emissions (column i): gross carrying amount percentage of the portfolio derived from company-specific reporting³ |
<= 5 years |
> 5 year <= 10 years |
> 10 year <= 20 years |
> 20 years |
Average weighted maturity |
|||||||||||||||||||||||||||
|
in € m. |
of which: |
of which: |
of which: |
of which: |
of which: |
of which: |
of which: |
||||||||||||||||||||||||||||
|
17 |
C.17 - Manufacture of pulp, paper and paperboard |
634 |
0 |
4 |
144 |
20 |
(12) |
(1) |
(10) |
1 |
0 |
– |
548 |
63 |
22 |
1 |
2.1 |
||||||||||||||||||
|
18 |
C.18 - Printing and service activities related to printing |
243 |
0 |
0 |
59 |
7 |
(5) |
(2) |
(4) |
0 |
0 |
– |
196 |
25 |
18 |
4 |
4.1 |
||||||||||||||||||
|
19 |
C.19 - Manufacture of coke oven products |
778 |
774 |
2 |
277 |
0 |
(1) |
(0) |
(0) |
5 |
4 |
– |
742 |
34 |
2 |
1 |
0.6 |
||||||||||||||||||
|
20 |
C.20 - Production of chemicals |
2,488 |
221 |
1 |
270 |
117 |
(23) |
(4) |
(16) |
3 |
3 |
– |
2,214 |
107 |
163 |
4 |
2.4 |
||||||||||||||||||
|
21 |
C.21 - Manufacture of pharmaceutical preparations |
2,125 |
21 |
0 |
190 |
46 |
(13) |
(4) |
(8) |
1 |
0 |
– |
1,894 |
206 |
25 |
1 |
1.9 |
||||||||||||||||||
|
22 |
C.22 - Manufacture of rubber products |
1,832 |
177 |
27 |
539 |
83 |
(40) |
(4) |
(35) |
6 |
6 |
– |
1,677 |
127 |
27 |
1 |
1.6 |
||||||||||||||||||
|
23 |
C.23 - Manufacture of other non-metallic mineral products |
619 |
0 |
6 |
134 |
41 |
(31) |
(1) |
(29) |
1 |
0 |
– |
542 |
58 |
12 |
7 |
2.8 |
||||||||||||||||||
|
24 |
C.24 - Manufacture of basic metals |
1,990 |
147 |
32 |
287 |
186 |
(37) |
(2) |
(33) |
5 |
4 |
– |
1,852 |
54 |
82 |
1 |
1.7 |
||||||||||||||||||
|
25 |
C.25 - Manufacture of fabricated metal products, except machinery and equipment |
1,800 |
3 |
23 |
330 |
112 |
(60) |
(4) |
(55) |
2 |
2 |
– |
1,514 |
190 |
79 |
16 |
2.7 |
||||||||||||||||||
|
26 |
C.26 - Manufacture of computer, electronic and optical products |
2,498 |
0 |
4 |
192 |
24 |
(17) |
(3) |
(12) |
1 |
1 |
– |
2,370 |
90 |
35 |
2 |
1.7 |
||||||||||||||||||
|
27 |
C.27 - Manufacture of electrical equipment |
2,537 |
56 |
96 |
443 |
84 |
(47) |
(1) |
(45) |
8 |
8 |
– |
2,390 |
86 |
46 |
16 |
1.8 |
||||||||||||||||||
|
28 |
C.28 - Manufacture of machinery and equipment n.e.c. |
3,525 |
0 |
63 |
365 |
144 |
(89) |
(4) |
(81) |
9 |
8 |
– |
3,302 |
131 |
82 |
11 |
1.8 |
||||||||||||||||||
|
29 |
C.29 - Manufacture of motor vehicles, trailers and semi-trailers |
4,232 |
439 |
131 |
712 |
99 |
(65) |
(3) |
(60) |
21 |
21 |
– |
4,174 |
44 |
10 |
3 |
0.8 |
||||||||||||||||||
|
30 |
C.30 - Manufacture of other transport equipment |
1,074 |
50 |
16 |
65 |
162 |
(53) |
(0) |
(52) |
2 |
2 |
– |
1,008 |
39 |
27 |
0 |
2.0 |
||||||||||||||||||
208
|
Deutsche Bank |
||
|
Pillar 3 Report as of December 31, 2024 |
||
|
|
Dec 31, 2024 |
||||||||||||||||||||||||||||||||||
|
a |
b |
c |
d |
e |
f |
g |
h |
i |
j |
k |
l |
m |
n |
o |
p |
||||||||||||||||||||
|
Gross carrying amount |
Accumulated impairment, accumulated negative changes in fair value due to credit risk and provisions |
GHG financed emissions (scope 1, scope 2 and scope 3 emissions of the counterparty) (in Mtons of CO2 equivalent) |
GHG emissions (column i): gross carrying amount percentage of the portfolio derived from company-specific reporting³ |
<= 5 years |
> 5 year <= 10 years |
> 10 year <= 20 years |
> 20 years |
Average weighted maturity |
|||||||||||||||||||||||||||
|
in € m. |
of which: |
of which: |
of which: |
of which: |
of which: |
of which: |
of which: |
||||||||||||||||||||||||||||
|
31 |
C.31 - Manufacture of furniture |
233 |
0 |
0 |
27 |
15 |
(12) |
(0) |
(11) |
0 |
0 |
– |
192 |
24 |
13 |
4 |
3.0 |
||||||||||||||||||
|
32 |
C.32 - Other manufacturing |
2,967 |
16 |
7 |
450 |
299 |
(53) |
(5) |
(46) |
2 |
2 |
– |
2,429 |
260 |
235 |
44 |
3.3 |
||||||||||||||||||
|
33 |
C.33 - Repair and installation of machinery and equipment |
81 |
0 |
0 |
13 |
3 |
(0) |
(0) |
(0) |
0 |
0 |
– |
69 |
4 |
4 |
3 |
2.7 |
||||||||||||||||||
|
34 |
D - Electricity, gas, steam and air conditioning supply |
5,887 |
4,201 |
76 |
396 |
210 |
(98) |
(11) |
(77) |
18 |
8 |
– |
4,675 |
804 |
316 |
91 |
3.6 |
||||||||||||||||||
|
35 |
D35.1 - Electric power generation, transmission and distribution |
5,107 |
3,587 |
70 |
358 |
167 |
(61) |
(10) |
(41) |
16 |
7 |
– |
4,094 |
664 |
260 |
89 |
3.5 |
||||||||||||||||||
|
36 |
D35.11 - Production of electricity |
2,990 |
2,974 |
49 |
329 |
167 |
(56) |
(10) |
(41) |
8 |
2 |
– |
2,213 |
538 |
152 |
87 |
4.1 |
||||||||||||||||||
|
37 |
D35.2 - Manufacture of gas; distribution of gaseous fuels through mains |
730 |
565 |
6 |
31 |
42 |
(37) |
(0) |
(36) |
2 |
1 |
– |
562 |
119 |
50 |
0 |
3.6 |
||||||||||||||||||
|
38 |
D35.3 - Steam and air conditioning supply |
50 |
49 |
0 |
7 |
1 |
(0) |
(0) |
(0) |
0 |
0 |
– |
20 |
22 |
6 |
2 |
7.2 |
||||||||||||||||||
|
39 |
E - Water supply; sewerage, waste management and remediation activities |
836 |
0 |
4 |
227 |
5 |
(8) |
(4) |
(3) |
1 |
0 |
– |
650 |
118 |
63 |
4 |
3.5 |
||||||||||||||||||
|
40 |
F - Construction |
5,378 |
53 |
36 |
778 |
240 |
(99) |
(9) |
(86) |
4 |
4 |
– |
3,703 |
584 |
464 |
627 |
7.1 |
||||||||||||||||||
|
41 |
F.41 - Construction of buildings |
2,692 |
18 |
7 |
447 |
77 |
(42) |
(4) |
(37) |
2 |
2 |
– |
1,984 |
245 |
123 |
339 |
7.0 |
||||||||||||||||||
|
42 |
F.42 - Civil engineering |
558 |
0 |
21 |
66 |
7 |
(5) |
(2) |
(3) |
0 |
0 |
– |
360 |
111 |
39 |
47 |
8.0 |
||||||||||||||||||
|
43 |
F.43 - Specialised construction activities |
2,128 |
35 |
8 |
266 |
156 |
(52) |
(3) |
(46) |
2 |
2 |
– |
1,360 |
227 |
301 |
241 |
7.0 |
||||||||||||||||||
|
44 |
G - Wholesale and retail trade; repair of motor vehicles and motorcycles |
25,037 |
1,264 |
113 |
3,044 |
808 |
(433) |
(28) |
(384) |
40 |
39 |
– |
22,442 |
933 |
1,196 |
467 |
2.2 |
||||||||||||||||||
|
45 |
H - Transportation and storage |
8,334 |
412 |
84 |
1,167 |
354 |
(76) |
(10) |
(60) |
6 |
2 |
– |
6,685 |
1,150 |
434 |
64 |
3.5 |
||||||||||||||||||
|
46 |
H.49 - Land transport and transport via pipelines |
1,457 |
363 |
52 |
403 |
57 |
(16) |
(2) |
(12) |
1 |
1 |
– |
1,257 |
53 |
123 |
24 |
3.4 |
||||||||||||||||||
|
47 |
H.50 - Water transport |
1,302 |
0 |
1 |
455 |
3 |
(10) |
(6) |
(2) |
2 |
0 |
– |
845 |
288 |
154 |
15 |
5.4 |
||||||||||||||||||
|
48 |
H.51 - Air transport |
2,539 |
1 |
13 |
197 |
155 |
(15) |
(0) |
(14) |
2 |
1 |
– |
2,054 |
409 |
75 |
1 |
3.6 |
||||||||||||||||||
209
|
Deutsche Bank |
||
|
Pillar 3 Report as of December 31, 2024 |
||
|
|
Dec 31, 2024 |
||||||||||||||||||||||||||||||||||
|
a |
b |
c |
d |
e |
f |
g |
h |
i |
j |
k |
l |
m |
n |
o |
p |
||||||||||||||||||||
|
Gross carrying amount |
Accumulated impairment, accumulated negative changes in fair value due to credit risk and provisions |
GHG financed emissions (scope 1, scope 2 and scope 3 emissions of the counterparty) (in Mtons of CO2 equivalent) |
GHG emissions (column i): gross carrying amount percentage of the portfolio derived from company-specific reporting³ |
<= 5 years |
> 5 year <= 10 years |
> 10 year <= 20 years |
> 20 years |
Average weighted maturity |
|||||||||||||||||||||||||||
|
in € m. |
of which: |
of which: |
of which: |
of which: |
of which: |
of which: |
of which: |
||||||||||||||||||||||||||||
|
49 |
H.52 - Warehousing and support activities for transportation |
2,812 |
48 |
11 |
104 |
132 |
(34) |
(1) |
(31) |
1 |
1 |
– |
2,322 |
389 |
80 |
21 |
2.9 |
||||||||||||||||||
|
50 |
H.53 - Postal and courier activities |
225 |
0 |
8 |
8 |
8 |
(2) |
(0) |
(1) |
0 |
0 |
– |
208 |
11 |
2 |
4 |
1.2 |
||||||||||||||||||
|
51 |
I - Accommodation and food service activities |
2,716 |
0 |
0 |
386 |
87 |
(33) |
(5) |
(25) |
1 |
0 |
– |
1,869 |
455 |
277 |
115 |
5.0 |
||||||||||||||||||
|
52 |
L - Real estate activities |
61,621 |
11 |
62 |
14,687 |
4,312 |
(861) |
(95) |
(738) |
12 |
11 |
– |
48,629 |
4,385 |
4,038 |
4,569 |
4.7 |
||||||||||||||||||
|
53 |
Exposures towards sectors other than those that highly contribute to climate change* |
233,258 |
484 |
279 |
9,680 |
2,882 |
(927) |
(75) |
(694) |
0 |
0 |
– |
178,658 |
14,631 |
6,820 |
33,148 |
9.2 |
||||||||||||||||||
|
54 |
K - Financial and insurance activities¹ |
175,811 |
234 |
250 |
4,417 |
1,391 |
(389) |
(12) |
(284) |
0 |
0 |
– |
133,484 |
8,730 |
3,006 |
30,591 |
11.5 |
||||||||||||||||||
|
55 |
Exposures to other sectors (NACE codes J, M - U) |
57,447 |
250 |
30 |
5,264 |
1,491 |
(538) |
(62) |
(410) |
0 |
0 |
– |
45,174 |
5,901 |
3,815 |
2,557 |
4.0 |
||||||||||||||||||
|
56 |
Total |
383,168 |
11,516 |
1,075 |
36,020 |
10,558 |
(3,237) |
(289) |
(2,680) |
174 |
143 |
– |
303,944 |
25,245 |
14,716 |
39,264 |
7.0 |
||||||||||||||||||
1 Includes exposures to financial corporates as per EBA Q&A 2022_6600
2 Based on % of turnover contributing to environmentally sustainable activities aligned with the EU Taxonomy CCM objectives.
3 The Bank can derive the % of gross carrying amount for Scope 1 & 2 based on company specific reporting, however Scope 3 is based on estimates hence not reported
210
|
Deutsche Bank |
||
|
Pillar 3 Report as of December 31, 2024 |
||
|
|
Jun 30, 2024 |
||||||||||||||||||||||||||||||||||
|
a |
b |
c |
d |
e |
f |
g |
h |
i |
j |
k |
l |
m |
n |
o |
p |
||||||||||||||||||||
|
Gross carrying amount |
Accumulated impairment, accumulated negative changes in fair value due to credit risk and provisions |
GHG financed emissions (scope 1, scope 2 and scope 3 emissions of the counterparty) (in tons of CO2 equivalent) |
GHG emissions (column i): gross carrying amount percentage of the portfolio derived from company-specific reporting |
<= 5 years |
> 5 year <= 10 years |
> 10 year <= 20 years |
> 20 years |
Average weighted maturity |
|||||||||||||||||||||||||||
|
in € m. |
of which: |
of which: |
of which: |
of which: |
of which: |
of which: |
of which: |
||||||||||||||||||||||||||||
|
1 |
Exposures towards sectors that highly contribute to climate change* |
150,145 |
8,208 |
838 |
26,771 |
7,352 |
(2,169) |
(222) |
(1,811) |
179 |
149 |
– |
122,854 |
13,175 |
8,182 |
5,935 |
3.6 |
||||||||||||||||||
|
2 |
A - Agriculture, forestry and fishing |
835 |
194 |
1 |
212 |
16 |
(8) |
(2) |
(6) |
1 |
1 |
– |
652 |
88 |
71 |
25 |
3.4 |
||||||||||||||||||
|
3 |
B - Mining and quarrying |
4,506 |
4,506 |
10 |
382 |
19 |
(29) |
(6) |
(17) |
24 |
14 |
– |
3,805 |
691 |
8 |
2 |
2.2 |
||||||||||||||||||
|
4 |
B.05 - Mining of coal and lignite |
7 |
7 |
0 |
0 |
3 |
(2) |
0 |
(2) |
0 |
0 |
– |
4 |
3 |
1 |
0 |
3.9 |
||||||||||||||||||
|
5 |
B.06 - Extraction of crude petroleum and natural gas |
3,470 |
3,470 |
10 |
248 |
11 |
(23) |
(5) |
(13) |
20 |
11 |
– |
2,817 |
652 |
1 |
1 |
2.2 |
||||||||||||||||||
|
6 |
B.07 - Mining of metal ores |
400 |
400 |
0 |
123 |
0 |
(1) |
(1) |
0 |
2 |
2 |
– |
398 |
0 |
1 |
0 |
1.2 |
||||||||||||||||||
|
7 |
B.08 - Other mining and quarrying |
85 |
85 |
0 |
10 |
5 |
(2) |
(0) |
(2) |
0 |
0 |
– |
71 |
8 |
4 |
1 |
3.8 |
||||||||||||||||||
|
8 |
B.09 - Mining support service activities |
544 |
544 |
0 |
0 |
0 |
(1) |
0 |
(0) |
2 |
0 |
– |
514 |
29 |
1 |
0 |
2.3 |
||||||||||||||||||
|
9 |
C - Manufacturing |
37,098 |
2,192 |
397 |
6,353 |
1,616 |
(584) |
(54) |
(494) |
79 |
73 |
– |
33,625 |
2,469 |
879 |
125 |
1.9 |
||||||||||||||||||
|
10 |
C.10 - Manufacture of food products |
3,096 |
28 |
1 |
541 |
66 |
(44) |
(4) |
(38) |
3 |
3 |
– |
2,767 |
260 |
51 |
17 |
1.9 |
||||||||||||||||||
|
11 |
C.11 - Manufacture of beverages |
867 |
0 |
0 |
104 |
9 |
(6) |
(2) |
(3) |
0 |
0 |
– |
809 |
54 |
3 |
1 |
1.5 |
||||||||||||||||||
|
12 |
C.12 - Manufacture of tobacco products² |
458 |
369 |
0 |
383 |
0 |
(1) |
(1) |
(0) |
0 |
0 |
– |
449 |
10 |
0 |
0 |
1.8 |
||||||||||||||||||
|
13 |
C.13 - Manufacture of textiles |
481 |
0 |
0 |
43 |
39 |
(14) |
(0) |
(13) |
1 |
1 |
– |
389 |
44 |
43 |
5 |
3.4 |
||||||||||||||||||
|
14 |
C.14 - Manufacture of wearing apparel |
190 |
0 |
0 |
41 |
28 |
(18) |
(0) |
(17) |
0 |
0 |
– |
156 |
13 |
20 |
1 |
3.0 |
||||||||||||||||||
|
15 |
C.15 - Manufacture of leather and related products |
120 |
0 |
0 |
38 |
10 |
(3) |
(0) |
(3) |
0 |
0 |
– |
98 |
13 |
8 |
1 |
2.6 |
||||||||||||||||||
|
16 |
C.16 - Manufacture of wood and of products of wood and cork, except furniture; manufacture of articles of straw and plaiting materials |
259 |
0 |
0 |
38 |
25 |
(16) |
(0) |
(16) |
0 |
0 |
– |
211 |
30 |
12 |
5 |
3.7 |
||||||||||||||||||
211
|
Deutsche Bank |
||
|
Pillar 3 Report as of December 31, 2024 |
||
|
|
Jun 30, 2024 |
||||||||||||||||||||||||||||||||||
|
a |
b |
c |
d |
e |
f |
g |
h |
i |
j |
k |
l |
m |
n |
o |
p |
||||||||||||||||||||
|
Gross carrying amount |
Accumulated impairment, accumulated negative changes in fair value due to credit risk and provisions |
GHG financed emissions (scope 1, scope 2 and scope 3 emissions of the counterparty) (in tons of CO2 equivalent) |
GHG emissions (column i): gross carrying amount percentage of the portfolio derived from company-specific reporting |
<= 5 years |
> 5 year <= 10 years |
> 10 year <= 20 years |
> 20 years |
Average weighted maturity |
|||||||||||||||||||||||||||
|
in € m. |
of which: |
of which: |
of which: |
of which: |
of which: |
of which: |
of which: |
||||||||||||||||||||||||||||
|
17 |
C.17 - Manufacture of pulp, paper and paperboard |
702 |
0 |
0 |
149 |
16 |
(8) |
(1) |
(6) |
1 |
1 |
– |
603 |
77 |
21 |
2 |
2.2 |
||||||||||||||||||
|
18 |
C.18 - Printing and service activities related to printing |
207 |
0 |
0 |
51 |
7 |
(4) |
(1) |
(3) |
0 |
0 |
– |
162 |
21 |
20 |
4 |
4.1 |
||||||||||||||||||
|
19 |
C.19 - Manufacture of coke oven products |
860 |
860 |
1 |
149 |
0 |
(2) |
(1) |
(0) |
5 |
5 |
– |
858 |
0 |
2 |
1 |
0.8 |
||||||||||||||||||
|
20 |
C.20 - Production of chemicals |
3,834 |
225 |
4 |
699 |
231 |
(22) |
(4) |
(14) |
5 |
4 |
– |
3,122 |
511 |
197 |
4 |
2.4 |
||||||||||||||||||
|
21 |
C.21 - Manufacture of pharmaceutical preparations |
1,883 |
12 |
0 |
236 |
78 |
(6) |
(2) |
(2) |
1 |
0 |
– |
1,673 |
193 |
16 |
0 |
1.9 |
||||||||||||||||||
|
22 |
C.22 - Manufacture of rubber products |
1,690 |
2 |
16 |
540 |
48 |
(33) |
(5) |
(27) |
5 |
5 |
– |
1,509 |
157 |
23 |
1 |
1.9 |
||||||||||||||||||
|
23 |
C.23 - Manufacture of other non-metallic mineral products |
813 |
89 |
16 |
144 |
40 |
(22) |
(1) |
(20) |
1 |
0 |
– |
724 |
67 |
18 |
5 |
2.4 |
||||||||||||||||||
|
24 |
C.24 - Manufacture of basic metals |
1,852 |
18 |
26 |
345 |
180 |
(32) |
(3) |
(27) |
5 |
4 |
– |
1,700 |
82 |
68 |
2 |
1.8 |
||||||||||||||||||
|
25 |
C.25 - Manufacture of fabricated metal products, except machinery and equipment |
2,028 |
3 |
27 |
314 |
106 |
(59) |
(3) |
(54) |
5 |
4 |
– |
1,730 |
199 |
80 |
18 |
2.7 |
||||||||||||||||||
|
26 |
C.26 - Manufacture of computer, electronic and optical products |
2,785 |
0 |
2 |
249 |
24 |
(16) |
(3) |
(10) |
1 |
1 |
– |
2,627 |
115 |
41 |
2 |
1.7 |
||||||||||||||||||
|
27 |
C.27 - Manufacture of electrical equipment |
3,047 |
51 |
69 |
240 |
94 |
(55) |
(2) |
(50) |
10 |
10 |
– |
2,882 |
118 |
43 |
5 |
1.5 |
||||||||||||||||||
|
28 |
C.28 - Manufacture of machinery and equipment n.e.c. |
3,802 |
0 |
58 |
510 |
130 |
(88) |
(5) |
(79) |
9 |
9 |
– |
3,559 |
152 |
81 |
10 |
1.8 |
||||||||||||||||||
|
29 |
C.29 - Manufacture of motor vehicles, trailers and semi-trailers |
4,332 |
534 |
165 |
837 |
119 |
(57) |
(3) |
(51) |
23 |
22 |
– |
4,257 |
63 |
9 |
2 |
1.0 |
||||||||||||||||||
|
30 |
C.30 - Manufacture of other transport equipment |
1,076 |
0 |
8 |
99 |
84 |
(16) |
(1) |
(15) |
2 |
2 |
– |
1,005 |
41 |
29 |
1 |
1.9 |
||||||||||||||||||
212
|
Deutsche Bank |
||
|
Pillar 3 Report as of December 31, 2024 |
||
|
|
Jun 30, 2024 |
||||||||||||||||||||||||||||||||||
|
a |
b |
c |
d |
e |
f |
g |
h |
i |
j |
k |
l |
m |
n |
o |
p |
||||||||||||||||||||
|
Gross carrying amount |
Accumulated impairment, accumulated negative changes in fair value due to credit risk and provisions |
GHG financed emissions (scope 1, scope 2 and scope 3 emissions of the counterparty) (in tons of CO2 equivalent) |
GHG emissions (column i): gross carrying amount percentage of the portfolio derived from company-specific reporting |
<= 5 years |
> 5 year <= 10 years |
> 10 year <= 20 years |
> 20 years |
Average weighted maturity |
|||||||||||||||||||||||||||
|
in € m. |
of which: |
of which: |
of which: |
of which: |
of which: |
of which: |
of which: |
||||||||||||||||||||||||||||
|
31 |
C.31 - Manufacture of furniture |
254 |
0 |
0 |
47 |
16 |
(11) |
(0) |
(10) |
0 |
0 |
– |
206 |
27 |
15 |
6 |
3.4 |
||||||||||||||||||
|
32 |
C.32 - Other manufacturing |
2,385 |
1 |
3 |
542 |
268 |
(48) |
(10) |
(35) |
1 |
1 |
– |
2,064 |
219 |
75 |
27 |
2.8 |
||||||||||||||||||
|
33 |
C.33 - Repair and installation of machinery and equipment |
75 |
0 |
2 |
16 |
0 |
(1) |
(0) |
(0) |
0 |
0 |
– |
64 |
2 |
5 |
4 |
3.2 |
||||||||||||||||||
|
34 |
D - Electricity, gas, steam and air conditioning supply |
5,766 |
371 |
202 |
364 |
101 |
(36) |
(5) |
(22) |
12 |
5 |
– |
4,077 |
1,260 |
376 |
53 |
3.8 |
||||||||||||||||||
|
35 |
D35.1 - Electric power generation, transmission and distribution |
5,082 |
297 |
199 |
284 |
100 |
(34) |
(4) |
(21) |
10 |
5 |
– |
3,711 |
1,001 |
319 |
52 |
3.7 |
||||||||||||||||||
|
36 |
D35.11 - Production of electricity |
3,050 |
260 |
172 |
169 |
100 |
(28) |
(3) |
(21) |
5 |
3 |
– |
2,194 |
664 |
143 |
49 |
3.7 |
||||||||||||||||||
|
37 |
D35.2 - Manufacture of gas; distribution of gaseous fuels through mains |
648 |
74 |
3 |
78 |
0 |
(1) |
(0) |
(0) |
1 |
1 |
– |
357 |
238 |
54 |
0 |
4.4 |
||||||||||||||||||
|
38 |
D35.3 - Steam and air conditioning supply² |
36 |
0 |
0 |
2 |
1 |
(0) |
(0) |
(0) |
0 |
0 |
– |
9 |
21 |
4 |
1 |
6.9 |
||||||||||||||||||
|
39 |
E - Water supply; sewerage, waste management and remediation activities |
797 |
0 |
1 |
43 |
5 |
(5) |
(0) |
(2) |
0 |
0 |
– |
611 |
108 |
72 |
6 |
3.6 |
||||||||||||||||||
|
40 |
F - Construction |
5,662 |
39 |
24 |
958 |
258 |
(113) |
(10) |
(97) |
3 |
3 |
– |
3,738 |
476 |
789 |
660 |
7.6 |
||||||||||||||||||
|
41 |
F.41 - Construction of buildings |
2,810 |
8 |
7 |
549 |
96 |
(55) |
(5) |
(49) |
2 |
1 |
– |
2,011 |
159 |
277 |
363 |
7.5 |
||||||||||||||||||
|
42 |
F.42 - Civil engineering |
748 |
0 |
7 |
97 |
10 |
(6) |
(2) |
(4) |
0 |
0 |
– |
486 |
104 |
122 |
36 |
7.4 |
||||||||||||||||||
|
43 |
F.43 - Specialised construction activities |
2,104 |
31 |
9 |
312 |
152 |
(52) |
(4) |
(44) |
1 |
1 |
– |
1,240 |
213 |
390 |
261 |
7.8 |
||||||||||||||||||
|
44 |
G - Wholesale and retail trade; repair of motor vehicles and motorcycles |
24,266 |
791 |
67 |
3,042 |
737 |
(411) |
(29) |
(363) |
43 |
41 |
– |
21,411 |
1,100 |
1,298 |
457 |
2.4 |
||||||||||||||||||
|
45 |
H - Transportation and storage |
7,747 |
114 |
74 |
1,366 |
259 |
(66) |
(6) |
(52) |
5 |
2 |
– |
6,307 |
1,051 |
313 |
75 |
3.4 |
||||||||||||||||||
|
46 |
H.49 - Land transport and transport via pipelines |
1,735 |
69 |
38 |
521 |
52 |
(17) |
(3) |
(13) |
1 |
1 |
– |
1,615 |
59 |
25 |
37 |
3.1 |
||||||||||||||||||
|
47 |
H.50 - Water transport |
1,587 |
0 |
1 |
531 |
29 |
(9) |
(1) |
(6) |
2 |
0 |
– |
1,136 |
302 |
148 |
1 |
4.4 |
||||||||||||||||||
|
48 |
H.51 - Air transport |
906 |
1 |
9 |
175 |
101 |
(12) |
(0) |
(11) |
0 |
0 |
– |
711 |
141 |
53 |
1 |
3.9 |
||||||||||||||||||
213
|
Deutsche Bank |
||
|
Pillar 3 Report as of December 31, 2024 |
||
|
|
Jun 30, 2024 |
||||||||||||||||||||||||||||||||||
|
a |
b |
c |
d |
e |
f |
g |
h |
i |
j |
k |
l |
m |
n |
o |
p |
||||||||||||||||||||
|
Gross carrying amount |
Accumulated impairment, accumulated negative changes in fair value due to credit risk and provisions |
GHG financed emissions (scope 1, scope 2 and scope 3 emissions of the counterparty) (in tons of CO2 equivalent) |
GHG emissions (column i): gross carrying amount percentage of the portfolio derived from company-specific reporting |
<= 5 years |
> 5 year <= 10 years |
> 10 year <= 20 years |
> 20 years |
Average weighted maturity |
|||||||||||||||||||||||||||
|
in € m. |
of which: |
of which: |
of which: |
of which: |
of which: |
of which: |
of which: |
||||||||||||||||||||||||||||
|
49 |
H.52 - Warehousing and support activities for transportation |
3,171 |
45 |
18 |
129 |
72 |
(26) |
(1) |
(20) |
1 |
1 |
– |
2,511 |
545 |
84 |
32 |
3.1 |
||||||||||||||||||
|
50 |
H.53 - Postal and courier activities |
348 |
0 |
7 |
10 |
4 |
(2) |
(0) |
(2) |
0 |
0 |
– |
334 |
6 |
4 |
5 |
1.2 |
||||||||||||||||||
|
51 |
I - Accommodation and food service activities |
1,928 |
0 |
0 |
362 |
67 |
(34) |
(6) |
(27) |
0 |
0 |
– |
895 |
623 |
263 |
146 |
6.9 |
||||||||||||||||||
|
52 |
L - Real estate activities |
61,540 |
0 |
62 |
13,689 |
4,274 |
(883) |
(104) |
(731) |
10 |
9 |
– |
47,734 |
5,309 |
4,112 |
4,385 |
4.8 |
||||||||||||||||||
|
53 |
Exposures towards sectors other than those that highly contribute to climate change* |
203,350 |
842 |
169 |
12,712 |
2,482 |
(983) |
(101) |
(713) |
0 |
0 |
– |
146,272 |
15,768 |
7,374 |
33,936 |
10.6 |
||||||||||||||||||
|
54 |
K - Financial and insurance activities¹ |
150,202 |
205 |
96 |
6,254 |
1,238 |
(390) |
(19) |
(260) |
0 |
0 |
– |
106,937 |
9,136 |
3,642 |
30,487 |
12.5 |
||||||||||||||||||
|
55 |
Exposures to other sectors (NACE codes J, M - U) |
53,149 |
637 |
73 |
6,458 |
1,244 |
(593) |
(82) |
(453) |
0 |
0 |
– |
39,336 |
6,632 |
3,732 |
3,449 |
5.1 |
||||||||||||||||||
|
56 |
Total |
353,495 |
9,049 |
1,007 |
39,483 |
9,834 |
(3,152) |
(323) |
(2,523) |
179 |
149 |
– |
269,126 |
28,943 |
15,555 |
39,871 |
7.6 |
||||||||||||||||||
1 Includes exposures to financial corporates as per EBA Q&A 2022_6600
2 Based on % of turnover contributing to environmentally sustainable activities eligible per the EU Taxonomy CCM objectives.
3 Prior year comparatives are not aligned to presentation in the current year
214
|
Deutsche Bank |
||
|
Pillar 3 Report as of December 31, 2024 |
||
Energy efficiency of real estate collateral
Table ESG2 highlights the energy efficiency of commercial and residential real estate collateralizing loans on Deutsche Bank’s balance sheet. The information includes energy efficiency measured in terms of kWh/m² energy consumption and Energy Performance Certificate (EPC) labels.
In general, energy efficiency data is not available for most collateral. While some local EPC data bases are available for Spain and Italy, a major part of the Group’s portfolios is located in countries without any public source of EPC data. However, for a larger portion of the portfolio, Deutsche Bank can estimate EPCs based on collateral information and external data bases such as PCAF and dena. If contracts are secured by multiple properties, the kWh/m² are allocated on a pro rata basis to each of the properties based on the weighted average lending value. In total, for 3.1% of the reported exposure Deutsche Bank uses the PCAF methodology.
Loans collateralized by immovable property are predominantly arising from the bank’s German residential real estate portfolio (€ 153.2 billion) where Deutsche Bank has good market coverage and energy efficiency can be estimated with a robust methodology. Due to the large amount of newly constructed properties in its’ German mortgage portfolio, a high proportion of the gross carrying amount is shown with low energy efficiency levels. Deutsche Bank started collecting EPCs for new residential real estate loans for portfolios within the EU mid-2022. Yet due to data protection schemes, EPCs are not systematically collected from private households. Hence, a low amount of actual EPC labels is available for residential immovable properties. For all private household clients, Deutsche Bank collects EPC documentation where it’s legally necessary for the client to have an EPC label for the property. Most of Deutsche Bank’s reported numbers on collected EPC labels are linked to the German and Spanish mortgage portfolio. EPC collection processes for collecting energy efficiency labels for commercial immovable properties is in process of being developed. Loans collateralized with garages and plots (included in residential immovable property), do not have a kWh/m² estimate and are classified as 0 kWh/m² in column b. Exposures for loans, where an EPC label is not available are reported without EPCs in column o. If an EPC label is available without kWh/m², the gross carrying amount is reported under “Level of energy efficiency estimated“ in a5.
For portfolios outside of the EU there is a lack of comprehensive and consistent local energy-efficiency standards which are comparable to the EU. Deutsche Bank is in the process of collecting, but does not yet have systematic, reliable data to estimate kWh/m² for these portfolios. Hence, most non-EU portfolios are reported without kWh/m² or EPC information.
215
|
Deutsche Bank |
||
|
Pillar 3 Report as of December 31, 2024 |
||
ESG2 – Banking book - Climate change transition risk: Loans collateralised by immovable property - Energy efficiency of the collateral
|
|
Dec 31, 2024 |
||||||||||||||||||||||||||||||||||
|
a |
b |
c |
d |
e |
f |
g |
h |
i |
j |
k |
l |
m |
n |
o |
p |
||||||||||||||||||||
|
Total gross carrying amount amount |
|||||||||||||||||||||||||||||||||||
|
Level of energy efficiency (EP score in kWh/m² of collateral) |
Level of energy efficiency (EPC label of collateral) |
Without EPC label of collateral |
|||||||||||||||||||||||||||||||||
|
in € m. |
0; <= 100 |
> 100; <= 200 |
> 200; <= 300 |
> 300; <= 400 |
> 400; <= 500 |
> 500 |
A |
B |
C |
D |
E |
F |
G |
of which: |
|||||||||||||||||||||
|
1 |
Total EU area |
193,545 |
56,609 |
62,526 |
49,968 |
1,168 |
722 |
2,457 |
709 |
408 |
592 |
1,125 |
2,817 |
1,370 |
2,614 |
183,911 |
89 |
||||||||||||||||||
|
2 |
Of which Loans collateralized by commercial immovable property |
27,122 |
1,751 |
3,346 |
1,530 |
100 |
432 |
2,075 |
17 |
20 |
14 |
35 |
34 |
78 |
297 |
26,627 |
32 |
||||||||||||||||||
|
3 |
Of which Loans collateralized by residential immovable property |
166,412 |
54,859 |
59,180 |
48,438 |
1,068 |
291 |
371 |
692 |
388 |
578 |
1,090 |
2,783 |
1,291 |
2,317 |
157,272 |
99 |
||||||||||||||||||
|
4 |
Of which Collateral obtained by taking possession: residential and commercial immovable properties |
11 |
0 |
0 |
0 |
0 |
0 |
11 |
- |
- |
- |
- |
- |
- |
- |
11 |
0 |
||||||||||||||||||
|
5 |
Of which Level of energy efficiency (EP score in kWh/m² of collateral) estimated |
164,298 |
54,882 |
59,063 |
47,541 |
239 |
484 |
2,090 |
- |
- |
- |
- |
- |
- |
- |
163,979 |
100 |
||||||||||||||||||
|
6 |
Total non-EU area |
47,102 |
145 |
307 |
64 |
6 |
5 |
36 |
- |
8 |
1 |
2 |
13 |
1 |
6 |
47,071 |
1 |
||||||||||||||||||
|
7 |
Of which Loans collateralized by commercial immovable property |
41,997 |
1 |
67 |
1 |
0 |
4 |
35 |
- |
- |
- |
- |
- |
- |
- |
41,997 |
0 |
||||||||||||||||||
|
8 |
Of which Loans collateralized by residential immovable property |
5,105 |
143 |
240 |
63 |
6 |
1 |
1 |
- |
8 |
1 |
2 |
13 |
1 |
6 |
5,074 |
8 |
||||||||||||||||||
|
9 |
Of which Collateral obtained by taking possession: residential and commercial immovable properties |
0 |
0 |
0 |
0 |
0 |
0 |
0 |
- |
- |
- |
- |
- |
- |
- |
0 |
0 |
||||||||||||||||||
|
10 |
Of which Level of energy efficiency (EP score in kWh/m² of collateral) estimated |
541 |
141 |
298 |
60 |
1 |
5 |
36 |
- |
- |
- |
- |
- |
- |
- |
530 |
100 |
||||||||||||||||||
216
|
Deutsche Bank |
||
|
Pillar 3 Report as of December 31, 2024 |
||
|
|
Jun 30, 2024 |
||||||||||||||||||||||||||||||||||
|
a |
b |
c |
d |
e |
f |
g |
h |
i |
j |
k |
l |
m |
n |
o |
p |
||||||||||||||||||||
|
Total gross carrying amount amount |
|||||||||||||||||||||||||||||||||||
|
Level of energy efficiency (EP score in kWh/m² of collateral) |
Level of energy efficiency (EPC label of collateral) |
Without EPC label of collateral |
|||||||||||||||||||||||||||||||||
|
in € m. |
0; <= 100 |
> 100; <= 200 |
> 200; <= 300 |
> 300; <= 400 |
> 400; <= 500 |
> 500 |
A |
B |
C |
D |
E |
F |
G |
of which: |
|||||||||||||||||||||
|
1 |
Total EU area |
198,559 |
56,061 |
62,769 |
50,636 |
1,032 |
676 |
2,388 |
668 |
375 |
542 |
1,020 |
2,619 |
1,191 |
2,353 |
189,791 |
87 |
||||||||||||||||||
|
2 |
Of which Loans collateralized by commercial immovable property |
28,300 |
1,579 |
3,544 |
1,502 |
29 |
409 |
1,992 |
13 |
22 |
7 |
33 |
29 |
17 |
302 |
27,878 |
31 |
||||||||||||||||||
|
3 |
Of which Loans collateralized by residential immovable property |
170,248 |
54,481 |
59,224 |
49,134 |
1,003 |
267 |
385 |
655 |
354 |
535 |
987 |
2,590 |
1,174 |
2,052 |
161,901 |
96 |
||||||||||||||||||
|
4 |
Of which Collateral obtained by taking possession: residential and commercial immovable properties |
12 |
0 |
0 |
0 |
0 |
0 |
12 |
- |
- |
- |
- |
- |
- |
- |
12 |
0 |
||||||||||||||||||
|
5 |
Of which Level of energy efficiency (EP score in kWh/m² of collateral) estimated |
165,297 |
54,478 |
59,641 |
48,418 |
265 |
467 |
2,027 |
- |
- |
- |
- |
- |
- |
- |
164,824 |
100 |
||||||||||||||||||
|
6 |
Total non-EU area |
44,419 |
158 |
255 |
70 |
3 |
141 |
43 |
- |
4 |
2 |
2 |
13 |
1 |
3 |
44,394 |
1 |
||||||||||||||||||
|
7 |
Of which Loans collateralized by commercial immovable property |
40,259 |
1 |
6 |
3 |
0 |
140 |
42 |
- |
- |
- |
- |
- |
- |
- |
40,259 |
0 |
||||||||||||||||||
|
8 |
Of which Loans collateralized by residential immovable property |
4,160 |
157 |
249 |
67 |
3 |
1 |
1 |
- |
4 |
2 |
2 |
13 |
1 |
3 |
4,135 |
11 |
||||||||||||||||||
|
9 |
Of which Collateral obtained by taking possession: residential and commercial immovable properties |
0 |
0 |
0 |
0 |
0 |
0 |
0 |
- |
- |
- |
- |
- |
- |
- |
0 |
0 |
||||||||||||||||||
|
10 |
Of which Level of energy efficiency (EP score in kWh/m² of collateral) estimated |
657 |
156 |
249 |
67 |
1 |
141 |
43 |
- |
- |
- |
- |
- |
- |
- |
645 |
100 |
||||||||||||||||||
217
|
Deutsche Bank |
||
|
Pillar 3 Report as of December 31, 2024 |
||
Alignment metrics on relative scope 3 emissions
The following template discloses eight carbon intensive sectors currently tracked by Deutsche Bank’s Net Zero target regime. This information is also available in the 2023 Non-Financial Reports and 2024 Sustainability Statement, where more details and context can be found such as 2050 final decarbonization targets, year-on-year analysis, and high-level methodological details.
In December 2024, the bank’s Sustainability Committee approved the establishment of a new Net-Zero target for Commercial Aviation. This is the first year disclosing a portfolio climate alignment score following the Pegasus Guidelines which was 1.3% as of year-end 2023.
Deutsche Bank’s sectoral targets are calibrated by using the International Energy Agency (IEA) Net Zero Emissions (NZE) Roadmap as well as the decarbonisation pathways from the Poseidon Principles methodology which follows the Revised International Maritime Organisation (IMO) Strategy for shipping and the Mission Possible Partnership Prudent Scenario for Commercial Aviation.
Deutsche Bank’s Net Zero target regime reports the exposure in terms of total loan commitment basis (i.e., loan drawn and undrawn) in line with the 2023 Non-Financial Reports and 2024 Sustainability Statement, instead of the gross carrying amount; the undrawn loan exposure is included as it is a better reflection of the balance sheet commitment the bank makes to the clients.
ESG3: Banking book - Indicators of potential climate change transition risk: Alignment metrics
|
|
Dec 31, 2024 |
|||||||||||
|
c |
d |
e |
f |
g |
||||||||
|
Sector |
Portfolio gross carrying amount¹ |
Alignment metric |
Year of reference |
Distance to IEA NZE2050 [in %]2 |
Target (year of reference + 3 years)3 |
|||||||
|
1 |
Power |
11,818 |
312 kgCO2e/MWh |
2024 |
151.6 |
124 |
||||||
|
3 |
Automotive |
7,698 |
162 gCO2/v-km |
2024 |
111.0 |
77 |
||||||
|
4 |
Aviation |
1,685 |
1.3% Pegasus Guidelines |
2023 |
1.3 |
0 |
||||||
|
5 |
Maritime transport |
945 |
19.7% Poseidon Principles (Revised-Striving) |
2023 |
19.7 |
0 |
||||||
|
6 |
Cement, clinker and lime production |
263 |
781 kgCO2e/t cement |
2024 |
50.2 |
520 |
||||||
|
7 |
Iron and steel, coke, and metal ore production |
2,159 |
1,234 kgCO2e/t steel |
2024 |
22.9 |
1,004 |
||||||
|
9 |
Oil and Gas |
9,582 |
19.2 MtCO2/y |
2024 |
6.7 |
18 |
||||||
|
10 |
Coal Mining |
1,222 |
4.6 MtCO2/y |
2024 |
14.0 |
4 |
||||||
1 Includes drawn and undrawn loan commitments as of YE 2024
2 % represented in terms of Distance to IEA NZE 2030, as the bank has not set a target with a 3-year horizon beyond the interim target set for 2030
3 The bank has chosen to disclose the Target (2030) instead of the Target (year of reference + 3 years)
Exposures to Top 20 carbon-intensive firms
Table ESG4 highlights the aggregate exposure Deutsche Bank has towards the top 20 most carbon-intensive firms and its subsidiaries in the world by gross carrying amount (including loans and advances, debt securities and equity instruments) in the banking book and weighted average maturity. The underlying data source for identifying the top 20 most carbon-intensive firms is the publicly latest available list from the Carbon Majors Report 2020 with database as of 2018.
ESG4 – Exposures in the banking book to the top 20 carbon-intensive firms in the world
|
|
Dec 31, 2024 |
|||||||||||
|
a |
b |
c |
d |
e |
||||||||
|
in € m. |
Gross carrying amount (aggregate) |
Gross carrying amount towards the counterparties compared to total gross carrying amount (aggregate in %) |
Of which environmentally sustainable (CCM)¹ |
Weighted average maturity |
Number of top 20 polluting firms included |
|||||||
|
1 |
Top 20 polluting firms |
2,351 |
0.36 |
3 |
0.9 |
14 |
||||||
1 Based on % of turnover contributing to environmentally sustainable activities aligned with the EU Taxonomy CCM objectives
218
|
Deutsche Bank |
||
|
Pillar 3 Report as of December 31, 2024 |
||
|
|
Jun 30, 2024 |
|||||||||||
|
a |
b |
c |
d |
e |
||||||||
|
in € m. |
Gross carrying amount (aggregate) |
Gross carrying amount towards the counterparties compared to total gross carrying amount (aggregate in %) |
Of which environmentally sustainable (CCM)¹ |
Weighted average maturity |
Number of top 20 polluting firms included |
|||||||
|
1 |
Top 20 polluting firms |
3,033 |
0.44 |
3 |
1.4 |
16 |
||||||
1 Based on % of turnover contributing to environmentally sustainable activities eligible per the EU Taxonomy CCM objectives
Deutsche Bank’s exposure towards the Top 20 firms decreased by € 0.7 billion resulting in a lower overall exposure ratio of 0.36%. The weighted average maturity decreased to 0.9 years.
Climate change - physical risk
Acute and chronic climate change events are defined as the likelihood of gradual changes in weather and climate conditions. These changes can have a potential impact on economic output and productivity, can cause sudden damage to properties, disruption of supply chains, and depreciation of assets, as well as additional cost related to operational downtime.
The bank utilizes data provided by Standard & Poor’s (S&P) to map locations as having acute or chronic hazard scores. S&P’s exposure scores forecast climate event probabilities for eight hazards and four climate scenarios. The exposure scores represent the likelihood of each climate hazard and scenario over the next eight decades. For purposes of determining Deutsche Bank’s physical risk, it has selected the exposure scores from the Representative Concentration Pathways 7 (RCP7) 2.1° by 2050) scenario projection for the 2040 decade only.
Acute risks are defined by S&P hazards for Coastal Flooding, Fluvial Flooding, Pluvial Flooding & Tropical Cyclones. Chronic risks are defined by S&P for hazards for extreme heat, extreme cold, wildfire, water stress and drought. A loan is considered sensitive to impacts from climate change physical events if at least one or more of a loan’s physical exposure score surpasses threshold calibrated individually per natural hazard type.
If the loan has real estate as collateral, the bank uses S&P exposure scores to map them against the property zip codes to determine the exposure score. For larger companies, with multiple, regionally diversified locations and loans not secured by real estate, S&P provides an exposure score from their internal asset and client database, which aggregates the risk based on the company’s multiple locations and operations If the borrower is not in S&P’s database and does not have real estate as collateral, the bank will use the clients domiciled address to determine the appropriate exposure score based on similar locations with information available from S&P. As of December 31, 2024, the Group obtained exposure scores on 98% of the German Private Bank real estate loans and 90.5% across Private Bank (excl. German Private Bank), Corporate Bank and Investment Bank. Continuous enhancement to processes, refinement of methodology and forward-looking information can result in changes to exposures subject to physical risk.
Table ESG5 provides information on exposures in the banking book (including loans and advances and debt securities) towards non-financial corporates with a geographical grouping in four regions: Europe, the Middle East and Africa (EMEA), Asia Pacific, North America and Latin America. The gross carrying amount of the loans do not consider any risk mitigation, adaption or resilience measures the bank may have taken to reduce the risk of physical loss or any costs related to climate change. The increase in exposures sensitive to physical risk versus the prior period is primarily driven by data quality enhancements enabling more precise mapping of property addresses for the in-scope assets within North America. In addition, during the second half of the year 2024 selected exposures were reclassified between the residential and commercial exposures in the EMEA region.
219
|
Deutsche Bank |
||
|
Pillar 3 Report as of December 31, 2024 |
||
ESG5 – Banking book - Climate change physical risk: Exposures subject to physical risk – EMEA
|
|
Dec 31, 2024 |
|||||||||||||||||||||||||||||
|
b |
c |
d |
e |
f |
g |
h |
i |
j |
k |
l |
m |
n |
o |
|||||||||||||||||
|
Total gross carrying amount amount |
||||||||||||||||||||||||||||||
|
of which: exposures sensitive to impact from climate change physical events |
||||||||||||||||||||||||||||||
|
Breakdown by maturity bucket |
of which: |
oh which: |
of which: |
of which: |
of which: |
Accumulated impairment, accumulated negative changes in fair value due to credit risk and provisions |
||||||||||||||||||||||||
|
in € m. |
<= 5 years |
> 5 year <= 10 years |
> 10 year <= 20 years |
> 20 years |
Average weighted maturity |
of which: |
of which: |
|||||||||||||||||||||||
|
1 |
A - Agriculture, forestry and fishing |
496 |
33 |
25 |
17 |
6 |
5.9 |
67 |
2 |
12 |
23 |
1 |
(1) |
(0) |
(0) |
|||||||||||||||
|
2 |
B - Mining and quarrying |
2,221 |
51 |
123 |
3 |
0 |
1.7 |
78 |
98 |
2 |
2 |
0 |
(0) |
(0) |
0 |
|||||||||||||||
|
3 |
C - Manufacturing |
23,774 |
1,814 |
571 |
89 |
21 |
2.3 |
2,117 |
338 |
40 |
327 |
136 |
(66) |
(3) |
(62) |
|||||||||||||||
|
4 |
D - Electricity, gas, steam and air conditioning supply |
2,121 |
38 |
133 |
102 |
0 |
6.1 |
222 |
51 |
0 |
6 |
4 |
(3) |
(0) |
(2) |
|||||||||||||||
|
5 |
E - Water supply; sewerage, waste management and remediation activities |
596 |
20 |
27 |
3 |
4 |
5.4 |
52 |
2 |
0 |
2 |
1 |
(1) |
(0) |
(1) |
|||||||||||||||
|
6 |
F - Construction |
3,182 |
185 |
74 |
120 |
49 |
7.1 |
409 |
18 |
2 |
146 |
84 |
(17) |
(1) |
(15) |
|||||||||||||||
|
7 |
G - Wholesale and retail trade; repair of motor vehicles and motorcycles |
17,252 |
2,230 |
341 |
188 |
192 |
3.4 |
1,897 |
1,030 |
24 |
556 |
104 |
(61) |
(5) |
(55) |
|||||||||||||||
|
8 |
H - Transportation and storage |
5,328 |
417 |
764 |
286 |
14 |
4.4 |
378 |
1,102 |
2 |
399 |
36 |
(25) |
(6) |
(19) |
|||||||||||||||
|
9 |
L - Real estate activities |
25,895 |
1,788 |
3,267 |
671 |
162 |
4.5 |
2,952 |
2,555 |
1 |
778 |
189 |
(100) |
(4) |
(94) |
|||||||||||||||
|
10 |
Loans collateralized by residential immovable property |
167,399 |
1,787 |
4,296 |
5,279 |
5,247 |
17.2 |
15,478 |
539 |
107 |
1,913 |
304 |
(105) |
(28) |
(71) |
|||||||||||||||
|
11 |
Loans collateralized by commercial immovable property |
34,206 |
1,864 |
454 |
1,673 |
2,565 |
5.2 |
4,400 |
1,649 |
24 |
868 |
174 |
(82) |
(7) |
(74) |
|||||||||||||||
|
12 |
Repossessed collaterals |
11 |
4 |
1 |
1 |
0 |
4.3 |
3 |
3 |
0 |
0 |
8 |
(0) |
0 |
(8) |
|||||||||||||||
|
13 |
Other relevant sectors (breakdown below where relevant) |
0 |
0 |
0 |
0 |
0 |
0.0 |
0 |
0 |
0 |
0 |
0 |
0 |
0 |
0 |
|||||||||||||||
220
|
Deutsche Bank |
||
|
Pillar 3 Report as of December 31, 2024 |
||
|
|
Jun 30, 2024 |
|||||||||||||||||||||||||||||
|
b |
c |
d |
e |
f |
g |
h |
i |
j |
k |
l |
m |
n |
o |
|||||||||||||||||
|
Total gross carrying amount amount |
||||||||||||||||||||||||||||||
|
of which: exposures sensitive to impact from climate change physical events |
||||||||||||||||||||||||||||||
|
Breakdown by maturity bucket |
of which: |
oh which: |
of which: |
of which: |
of which: |
Accumulated impairment, accumulated negative changes in fair value due to credit risk and provisions |
||||||||||||||||||||||||
|
in € m. |
<= 5 years |
> 5 year <= 10 years |
> 10 year <= 20 years |
> 20 years |
Average weighted maturity |
of which: |
of which: |
|||||||||||||||||||||||
|
1 |
A - Agriculture, forestry and fishing |
581 |
34 |
26 |
19 |
6 |
5.8 |
68 |
17 |
1 |
33 |
1 |
(1) |
(1) |
(0) |
|||||||||||||||
|
2 |
B - Mining and quarrying |
3,039 |
58 |
232 |
4 |
0 |
1.3 |
35 |
259 |
0 |
9 |
0 |
(1) |
(1) |
0 |
|||||||||||||||
|
3 |
C - Manufacturing |
26,343 |
1,914 |
855 |
54 |
16 |
1.9 |
2,267 |
608 |
36 |
479 |
112 |
(55) |
(6) |
(47) |
|||||||||||||||
|
4 |
D - Electricity, gas, steam and air conditioning supply |
2,655 |
90 |
85 |
84 |
0 |
4.9 |
151 |
108 |
0 |
9 |
1 |
(2) |
(0) |
(1) |
|||||||||||||||
|
5 |
E - Water supply; sewerage, waste management and remediation activities |
619 |
25 |
9 |
16 |
3 |
4.6 |
51 |
1 |
0 |
4 |
1 |
(1) |
(0) |
(1) |
|||||||||||||||
|
6 |
F - Construction |
3,994 |
368 |
87 |
157 |
58 |
6.1 |
488 |
183 |
1 |
224 |
71 |
(18) |
(2) |
(15) |
|||||||||||||||
|
7 |
G - Wholesale and retail trade; repair of motor vehicles and motorcycles |
17,354 |
1,657 |
598 |
211 |
123 |
3.5 |
1,743 |
858 |
12 |
280 |
117 |
(63) |
(4) |
(58) |
|||||||||||||||
|
8 |
H - Transportation and storage |
4,737 |
304 |
416 |
303 |
11 |
5.2 |
429 |
608 |
2 |
314 |
43 |
(15) |
(0) |
(15) |
|||||||||||||||
|
9 |
L - Real estate activities |
33,018 |
1,510 |
3,543 |
771 |
114 |
4.4 |
2,559 |
3,056 |
2 |
787 |
379 |
(116) |
(4) |
(111) |
|||||||||||||||
|
10 |
Loans collateralized by residential immovable property |
170,910 |
1,486 |
4,653 |
5,688 |
9,515 |
21.4 |
19,445 |
480 |
94 |
1,782 |
242 |
(88) |
(31) |
(49) |
|||||||||||||||
|
11 |
Loans collateralized by commercial immovable property |
32,660 |
1,639 |
218 |
542 |
602 |
3.7 |
1,318 |
1,844 |
7 |
818 |
331 |
(96) |
(6) |
(89) |
|||||||||||||||
|
12 |
Repossessed collaterals |
12 |
4 |
0 |
2 |
2 |
4.6 |
4 |
4 |
0 |
0 |
8 |
(8) |
0 |
(8) |
|||||||||||||||
|
13 |
Other relevant sectors (breakdown below where relevant) |
0 |
0 |
0 |
0 |
0 |
0.0 |
0 |
0 |
0 |
0 |
0 |
0 |
0 |
0 |
|||||||||||||||
221
|
Deutsche Bank |
||
|
Pillar 3 Report as of December 31, 2024 |
||
ESG5 – Banking book - Climate change physical risk: Exposures subject to physical risk – Asia Pacific
|
|
Dec 31, 2024 |
|||||||||||||||||||||||||||||
|
b |
c |
d |
e |
f |
g |
h |
i |
j |
k |
l |
m |
n |
o |
|||||||||||||||||
|
Total gross carrying amount amount |
||||||||||||||||||||||||||||||
|
of which: exposures sensitive to impact from climate change physical events |
||||||||||||||||||||||||||||||
|
Breakdown by maturity bucket |
of which: |
oh which: |
of which: |
of which: |
of which: |
Accumulated impairment, accumulated negative changes in fair value due to credit risk and provisions |
||||||||||||||||||||||||
|
in € m. |
<= 5 years |
> 5 year <= 10 years |
> 10 year <= 20 years |
> 20 years |
Average weighted maturity |
of which: |
of which: |
|||||||||||||||||||||||
|
1 |
A - Agriculture, forestry and fishing |
37 |
23 |
0 |
0 |
0 |
0.3 |
0 |
15 |
9 |
0 |
0 |
(0) |
0 |
0 |
|||||||||||||||
|
2 |
B - Mining and quarrying |
468 |
58 |
120 |
26 |
0 |
4.6 |
158 |
46 |
0 |
58 |
0 |
(1) |
(0) |
0 |
|||||||||||||||
|
3 |
C - Manufacturing |
6,334 |
923 |
117 |
110 |
52 |
1.7 |
552 |
588 |
62 |
218 |
41 |
(6) |
(1) |
(4) |
|||||||||||||||
|
4 |
D - Electricity, gas, steam and air conditioning supply |
1,853 |
110 |
155 |
133 |
0 |
5.7 |
256 |
140 |
2 |
36 |
0 |
(1) |
(0) |
0 |
|||||||||||||||
|
5 |
E - Water supply; sewerage, waste management and remediation activities |
103 |
1 |
0 |
0 |
0 |
0.7 |
0 |
1 |
0 |
0 |
0 |
0 |
0 |
0 |
|||||||||||||||
|
6 |
F - Construction |
1,047 |
245 |
1 |
62 |
0 |
0.9 |
25 |
282 |
0 |
3 |
13 |
(1) |
(0) |
(1) |
|||||||||||||||
|
7 |
G - Wholesale and retail trade; repair of motor vehicles and motorcycles |
4,315 |
614 |
55 |
237 |
6 |
3.7 |
482 |
419 |
11 |
32 |
19 |
(5) |
(0) |
(4) |
|||||||||||||||
|
8 |
H - Transportation and storage |
1,095 |
125 |
100 |
160 |
0 |
5.3 |
62 |
324 |
0 |
107 |
31 |
(2) |
(1) |
(1) |
|||||||||||||||
|
9 |
L - Real estate activities |
2,391 |
664 |
131 |
84 |
0 |
2.7 |
459 |
419 |
0 |
106 |
10 |
(2) |
(0) |
0 |
|||||||||||||||
|
10 |
Loans collateralized by residential immovable property |
1,846 |
121 |
78 |
271 |
6 |
7.8 |
127 |
349 |
0 |
27 |
26 |
(5) |
(0) |
(4) |
|||||||||||||||
|
11 |
Loans collateralized by commercial immovable property |
2,622 |
757 |
228 |
109 |
0 |
2.3 |
693 |
402 |
0 |
112 |
71 |
(12) |
(0) |
(12) |
|||||||||||||||
|
12 |
Repossessed collaterals |
0 |
0 |
0 |
0 |
0 |
0.0 |
0 |
0 |
0 |
0 |
0 |
0 |
0 |
0 |
|||||||||||||||
|
13 |
Other relevant sectors (breakdown below where relevant) |
0 |
0 |
0 |
0 |
0 |
0.0 |
0 |
0 |
0 |
0 |
0 |
0 |
0 |
0 |
|||||||||||||||
222
|
Deutsche Bank |
||
|
Pillar 3 Report as of December 31, 2024 |
||
|
|
Jun 30, 2024 |
|||||||||||||||||||||||||||||
|
b |
c |
d |
e |
f |
g |
h |
i |
j |
k |
l |
m |
n |
o |
|||||||||||||||||
|
Total gross carrying amount amount |
||||||||||||||||||||||||||||||
|
of which: exposures sensitive to impact from climate change physical events |
||||||||||||||||||||||||||||||
|
Breakdown by maturity bucket |
of which: |
oh which: |
of which: |
of which: |
of which: |
Accumulated impairment, accumulated negative changes in fair value due to credit risk and provisions |
||||||||||||||||||||||||
|
in € m. |
<= 5 years |
> 5 year <= 10 years |
> 10 year <= 20 years |
> 20 years |
Average weighted maturity |
of which: |
of which: |
|||||||||||||||||||||||
|
1 |
A - Agriculture, forestry and fishing |
126 |
119 |
0 |
0 |
0 |
0.1 |
111 |
119 |
111 |
0 |
0 |
0 |
0 |
0 |
|||||||||||||||
|
2 |
B - Mining and quarrying |
662 |
1 |
97 |
0 |
0 |
3.1 |
97 |
1 |
0 |
56 |
1 |
(0) |
(0) |
(0) |
|||||||||||||||
|
3 |
C - Manufacturing |
5,348 |
775 |
11 |
26 |
98 |
0.5 |
263 |
705 |
57 |
168 |
41 |
(4) |
(1) |
(2) |
|||||||||||||||
|
4 |
D - Electricity, gas, steam and air conditioning supply |
1,708 |
344 |
85 |
50 |
0 |
2.7 |
331 |
151 |
3 |
38 |
0 |
(1) |
(0) |
0 |
|||||||||||||||
|
5 |
E - Water supply; sewerage, waste management and remediation activities |
30 |
0 |
0 |
0 |
0 |
0.0 |
0 |
0 |
0 |
0 |
0 |
0 |
0 |
0 |
|||||||||||||||
|
6 |
F - Construction |
969 |
232 |
0 |
22 |
0 |
0.3 |
72 |
183 |
0 |
15 |
1 |
(1) |
0 |
(0) |
|||||||||||||||
|
7 |
G - Wholesale and retail trade; repair of motor vehicles and motorcycles |
3,244 |
674 |
56 |
155 |
6 |
2.8 |
606 |
296 |
10 |
14 |
6 |
(0) |
(0) |
0 |
|||||||||||||||
|
8 |
H - Transportation and storage |
1,133 |
81 |
71 |
74 |
0 |
4.7 |
47 |
179 |
0 |
105 |
1 |
(1) |
(1) |
(0) |
|||||||||||||||
|
9 |
L - Real estate activities |
1,882 |
333 |
234 |
49 |
0 |
2.0 |
476 |
140 |
0 |
107 |
46 |
(5) |
(0) |
(4) |
|||||||||||||||
|
10 |
Loans collateralized by residential immovable property |
1,283 |
0 |
0 |
0 |
0 |
0.0 |
0 |
0 |
0 |
0 |
0 |
(0) |
0 |
0 |
|||||||||||||||
|
11 |
Loans collateralized by commercial immovable property |
2,315 |
412 |
215 |
49 |
0 |
1.7 |
543 |
132 |
0 |
107 |
104 |
(2) |
(0) |
(2) |
|||||||||||||||
|
12 |
Repossessed collaterals |
0 |
0 |
0 |
0 |
0 |
0.0 |
0 |
0 |
0 |
0 |
0 |
0 |
0 |
0 |
|||||||||||||||
|
13 |
Other relevant sectors (breakdown below where relevant) |
0 |
0 |
0 |
0 |
0 |
0.0 |
0 |
0 |
0 |
0 |
0 |
0 |
0 |
0 |
|||||||||||||||
223
|
Deutsche Bank |
||
|
Pillar 3 Report as of December 31, 2024 |
||
ESG5 – Banking book - Climate change physical risk: Exposures subject to physical risk – North America
|
|
Dec 31, 2024 |
|||||||||||||||||||||||||||||
|
b |
c |
d |
e |
f |
g |
h |
i |
j |
k |
l |
m |
n |
o |
|||||||||||||||||
|
Total gross carrying amount amount |
||||||||||||||||||||||||||||||
|
of which: exposures sensitive to impact from climate change physical events |
||||||||||||||||||||||||||||||
|
Breakdown by maturity bucket |
of which: |
oh which: |
of which: |
of which: |
of which: |
Accumulated impairment, accumulated negative changes in fair value due to credit risk and provisions |
||||||||||||||||||||||||
|
in € m. |
<= 5 years |
> 5 year <= 10 years |
> 10 year <= 20 years |
> 20 years |
Average weighted maturity |
of which: |
of which: |
|||||||||||||||||||||||
|
1 |
A - Agriculture, forestry and fishing |
346 |
107 |
150 |
0 |
0 |
2.9 |
0 |
0 |
257 |
0 |
0 |
0 |
0 |
0 |
|||||||||||||||
|
2 |
B - Mining and quarrying |
317 |
0 |
11 |
0 |
0 |
2.5 |
0 |
11 |
0 |
0 |
11 |
(14) |
0 |
(14) |
|||||||||||||||
|
3 |
C - Manufacturing |
4,146 |
287 |
161 |
0 |
0 |
1.5 |
30 |
418 |
0 |
103 |
64 |
(3) |
(2) |
(0) |
|||||||||||||||
|
4 |
D - Electricity, gas, steam and air conditioning supply |
1,230 |
180 |
31 |
0 |
0 |
1.7 |
152 |
59 |
0 |
17 |
0 |
(1) |
(0) |
0 |
|||||||||||||||
|
5 |
E - Water supply; sewerage, waste management and remediation activities |
81 |
30 |
0 |
0 |
0 |
1.0 |
0 |
30 |
0 |
0 |
0 |
(0) |
0 |
0 |
|||||||||||||||
|
6 |
F - Construction |
1,080 |
257 |
123 |
1 |
86 |
9.1 |
16 |
450 |
0 |
85 |
0 |
(0) |
(0) |
0 |
|||||||||||||||
|
7 |
G - Wholesale and retail trade; repair of motor vehicles and motorcycles |
3,173 |
332 |
51 |
0 |
0 |
1.0 |
5 |
374 |
3 |
6 |
22 |
(2) |
0 |
(2) |
|||||||||||||||
|
8 |
H - Transportation and storage |
1,521 |
73 |
487 |
0 |
0 |
4.0 |
43 |
516 |
0 |
48 |
64 |
(1) |
(1) |
0 |
|||||||||||||||
|
9 |
L - Real estate activities |
32,450 |
8,514 |
3,042 |
544 |
613 |
3.0 |
1,888 |
9,464 |
1,361 |
4,025 |
1,654 |
(185) |
(15) |
(166) |
|||||||||||||||
|
10 |
Loans collateralized by residential immovable property |
2,055 |
17 |
12 |
155 |
1,116 |
23.3 |
27 |
1,248 |
25 |
1,069 |
111 |
(3) |
(3) |
0 |
|||||||||||||||
|
11 |
Loans collateralized by commercial immovable property |
31,533 |
8,728 |
3,197 |
562 |
184 |
2.3 |
1,824 |
9,575 |
1,272 |
4,095 |
1,638 |
(181) |
(12) |
(166) |
|||||||||||||||
|
12 |
Repossessed collaterals |
0 |
0 |
0 |
0 |
0 |
0.0 |
0 |
0 |
0 |
0 |
0 |
0 |
0 |
0 |
|||||||||||||||
|
13 |
Other relevant sectors (breakdown below where relevant) |
0 |
0 |
0 |
0 |
0 |
0.0 |
0 |
0 |
0 |
0 |
0 |
0 |
0 |
0 |
|||||||||||||||
224
|
Deutsche Bank |
||
|
Pillar 3 Report as of December 31, 2024 |
||
|
|
Jun 30, 2024 |
|||||||||||||||||||||||||||||
|
b |
c |
d |
e |
f |
g |
h |
i |
j |
k |
l |
m |
n |
o |
|||||||||||||||||
|
Total gross carrying amount amount |
||||||||||||||||||||||||||||||
|
of which: exposures sensitive to impact from climate change physical events |
||||||||||||||||||||||||||||||
|
Breakdown by maturity bucket |
of which: |
oh which: |
of which: |
of which: |
of which: |
Accumulated impairment, accumulated negative changes in fair value due to credit risk and provisions |
||||||||||||||||||||||||
|
in € m. |
<= 5 years |
> 5 year <= 10 years |
> 10 year <= 20 years |
> 20 years |
Average weighted maturity |
of which: |
of which: |
|||||||||||||||||||||||
|
1 |
A - Agriculture, forestry and fishing |
69 |
67 |
0 |
0 |
0 |
0.0 |
64 |
67 |
64 |
64 |
0 |
0 |
0 |
0 |
|||||||||||||||
|
2 |
B - Mining and quarrying |
253 |
51 |
11 |
0 |
0 |
1.1 |
0 |
61 |
0 |
0 |
11 |
(14) |
0 |
(13) |
|||||||||||||||
|
3 |
C - Manufacturing |
4,352 |
304 |
109 |
0 |
0 |
1.4 |
78 |
335 |
0 |
84 |
63 |
(2) |
(1) |
(0) |
|||||||||||||||
|
4 |
D - Electricity, gas, steam and air conditioning supply |
1,086 |
213 |
84 |
0 |
0 |
2.4 |
207 |
90 |
0 |
16 |
0 |
(1) |
(0) |
0 |
|||||||||||||||
|
5 |
E - Water supply; sewerage, waste management and remediation activities |
50 |
23 |
0 |
0 |
0 |
1.7 |
0 |
23 |
0 |
0 |
0 |
(0) |
0 |
0 |
|||||||||||||||
|
6 |
F - Construction |
624 |
29 |
77 |
0 |
0 |
2.2 |
26 |
80 |
0 |
11 |
0 |
(0) |
(0) |
0 |
|||||||||||||||
|
7 |
G - Wholesale and retail trade; repair of motor vehicles and motorcycles |
3,283 |
369 |
45 |
0 |
0 |
1.0 |
10 |
410 |
6 |
37 |
0 |
(1) |
(1) |
0 |
|||||||||||||||
|
8 |
H - Transportation and storage |
1,515 |
55 |
229 |
0 |
0 |
4.2 |
0 |
284 |
0 |
50 |
1 |
(0) |
(0) |
0 |
|||||||||||||||
|
9 |
L - Real estate activities |
26,268 |
7,869 |
1,172 |
69 |
243 |
1.9 |
3,254 |
7,428 |
1,329 |
2,415 |
1,237 |
(167) |
(19) |
(143) |
|||||||||||||||
|
10 |
Loans collateralized by residential immovable property |
2,181 |
36 |
0 |
0 |
0 |
0.8 |
0 |
36 |
0 |
0 |
0 |
0 |
0 |
0 |
|||||||||||||||
|
11 |
Loans collateralized by commercial immovable property |
33,356 |
7,491 |
742 |
0 |
61 |
1.2 |
2,998 |
6,458 |
1,162 |
2,073 |
1,219 |
(160) |
(14) |
(142) |
|||||||||||||||
|
12 |
Repossessed collaterals |
0 |
0 |
0 |
0 |
0 |
0.0 |
0 |
0 |
0 |
0 |
0 |
0 |
0 |
0 |
|||||||||||||||
|
13 |
Other relevant sectors (breakdown below where relevant) |
0 |
0 |
0 |
0 |
0 |
0.0 |
0 |
0 |
0 |
0 |
0 |
0 |
0 |
0 |
|||||||||||||||
225
|
Deutsche Bank |
||
|
Pillar 3 Report as of December 31, 2024 |
||
ESG5 – Banking book - Climate change physical risk: Exposures subject to physical risk – Latin America
|
|
Dec 31, 2024 |
|||||||||||||||||||||||||||||
|
b |
c |
d |
e |
f |
g |
h |
i |
j |
k |
l |
m |
n |
o |
|||||||||||||||||
|
Total gross carrying amount amount |
||||||||||||||||||||||||||||||
|
of which: exposures sensitive to impact from climate change physical events |
||||||||||||||||||||||||||||||
|
Breakdown by maturity bucket |
of which: |
oh which: |
of which: |
of which: |
of which: |
Accumulated impairment, accumulated negative changes in fair value due to credit risk and provisions |
||||||||||||||||||||||||
|
in € m. |
<= 5 years |
> 5 year <= 10 years |
> 10 year <= 20 years |
> 20 years |
Average weighted maturity |
of which: |
of which: |
|||||||||||||||||||||||
|
1 |
A - Agriculture, forestry and fishing |
68 |
0 |
0 |
0 |
0 |
0.0 |
0 |
0 |
0 |
0 |
0 |
0 |
0 |
0 |
|||||||||||||||
|
2 |
B - Mining and quarrying |
504 |
0 |
0 |
0 |
0 |
0.0 |
0 |
0 |
0 |
0 |
0 |
0 |
0 |
0 |
|||||||||||||||
|
3 |
C - Manufacturing |
1,308 |
170 |
15 |
141 |
0 |
6.3 |
156 |
170 |
0 |
3 |
0 |
(1) |
0 |
0 |
|||||||||||||||
|
4 |
D - Electricity, gas, steam and air conditioning supply |
431 |
158 |
40 |
0 |
0 |
1.7 |
132 |
66 |
0 |
0 |
40 |
(19) |
0 |
(19) |
|||||||||||||||
|
5 |
E - Water supply; sewerage, waste management and remediation activities |
56 |
0 |
0 |
0 |
0 |
0.0 |
0 |
0 |
0 |
0 |
0 |
0 |
0 |
0 |
|||||||||||||||
|
6 |
F - Construction |
69 |
0 |
14 |
0 |
0 |
0.0 |
14 |
0 |
0 |
0 |
0 |
(0) |
0 |
0 |
|||||||||||||||
|
7 |
G - Wholesale and retail trade; repair of motor vehicles and motorcycles |
297 |
143 |
0 |
0 |
0 |
0.1 |
106 |
38 |
0 |
15 |
0 |
(0) |
(0) |
(0) |
|||||||||||||||
|
8 |
H - Transportation and storage |
353 |
90 |
48 |
29 |
0 |
4.4 |
0 |
167 |
0 |
97 |
0 |
(0) |
0 |
0 |
|||||||||||||||
|
9 |
L - Real estate activities |
660 |
0 |
2 |
0 |
0 |
4.4 |
2 |
0 |
0 |
0 |
0 |
(0) |
0 |
0 |
|||||||||||||||
|
10 |
Loans collateralized by residential immovable property |
217 |
0 |
0 |
0 |
0 |
0.0 |
0 |
0 |
0 |
0 |
0 |
0 |
0 |
0 |
|||||||||||||||
|
11 |
Loans collateralized by commercial immovable property |
757 |
0 |
0 |
0 |
0 |
0.0 |
0 |
0 |
0 |
0 |
0 |
0 |
0 |
0 |
|||||||||||||||
|
12 |
Repossessed collaterals |
0 |
0 |
0 |
0 |
0 |
0.0 |
0 |
0 |
0 |
0 |
0 |
0 |
0 |
0 |
|||||||||||||||
|
13 |
Other relevant sectors (breakdown below where relevant) |
0 |
0 |
0 |
0 |
0 |
0.0 |
0 |
0 |
0 |
0 |
0 |
0 |
0 |
0 |
|||||||||||||||
226
|
Deutsche Bank |
||
|
Pillar 3 Report as of December 31, 2024 |
||
|
|
Jun 30, 2024 |
|||||||||||||||||||||||||||||
|
b |
c |
d |
e |
f |
g |
h |
i |
j |
k |
l |
m |
n |
o |
|||||||||||||||||
|
Total gross carrying amount amount |
||||||||||||||||||||||||||||||
|
of which: exposures sensitive to impact from climate change physical events |
||||||||||||||||||||||||||||||
|
Breakdown by maturity bucket |
of which: |
oh which: |
of which: |
of which: |
of which: |
Accumulated impairment, accumulated negative changes in fair value due to credit risk and provisions |
||||||||||||||||||||||||
|
in € m. |
<= 5 years |
> 5 year <= 10 years |
> 10 year <= 20 years |
> 20 years |
Average weighted maturity |
of which: |
of which: |
|||||||||||||||||||||||
|
1 |
A - Agriculture, forestry and fishing |
59 |
0 |
0 |
0 |
0 |
0.0 |
0 |
0 |
0 |
0 |
0 |
0 |
0 |
0 |
|||||||||||||||
|
2 |
B - Mining and quarrying |
552 |
317 |
57 |
0 |
0 |
2.4 |
373 |
0 |
0 |
0 |
0 |
(0) |
0 |
0 |
|||||||||||||||
|
3 |
C - Manufacturing |
1,054 |
282 |
5 |
87 |
0 |
4.0 |
260 |
113 |
0 |
11 |
0 |
(0) |
0 |
0 |
|||||||||||||||
|
4 |
D - Electricity, gas, steam and air conditioning supply |
317 |
26 |
27 |
0 |
0 |
1.7 |
27 |
26 |
0 |
0 |
0 |
(0) |
0 |
0 |
|||||||||||||||
|
5 |
E - Water supply; sewerage, waste management and remediation activities |
99 |
0 |
0 |
0 |
0 |
0.0 |
0 |
0 |
0 |
0 |
0 |
0 |
0 |
0 |
|||||||||||||||
|
6 |
F - Construction |
76 |
11 |
0 |
0 |
0 |
0.5 |
11 |
0 |
0 |
0 |
0 |
(0) |
0 |
0 |
|||||||||||||||
|
7 |
G - Wholesale and retail trade; repair of motor vehicles and motorcycles |
385 |
146 |
23 |
0 |
0 |
0.9 |
104 |
64 |
0 |
0 |
0 |
(0) |
0 |
0 |
|||||||||||||||
|
8 |
H - Transportation and storage |
363 |
69 |
46 |
0 |
33 |
5.9 |
0 |
149 |
0 |
102 |
0 |
(0) |
(0) |
0 |
|||||||||||||||
|
9 |
L - Real estate activities |
371 |
5 |
54 |
0 |
0 |
4.6 |
59 |
0 |
0 |
0 |
0 |
(1) |
0 |
0 |
|||||||||||||||
|
10 |
Loans collateralized by residential immovable property |
35 |
0 |
0 |
0 |
0 |
0.0 |
0 |
0 |
0 |
0 |
0 |
0 |
0 |
0 |
|||||||||||||||
|
11 |
Loans collateralized by commercial immovable property |
229 |
5 |
0 |
0 |
0 |
0.7 |
5 |
0 |
0 |
0 |
0 |
0 |
0 |
0 |
|||||||||||||||
|
12 |
Repossessed collaterals |
0 |
0 |
0 |
0 |
0 |
0.0 |
0 |
0 |
0 |
0 |
0 |
0 |
0 |
0 |
|||||||||||||||
|
13 |
Other relevant sectors (breakdown below where relevant) |
0 |
0 |
0 |
0 |
0 |
0.0 |
0 |
0 |
0 |
0 |
0 |
0 |
0 |
0 |
|||||||||||||||
227
|
Deutsche Bank |
||
|
Pillar 3 Report as of December 31, 2024 |
||
Summary of key performance indicators on the Taxonomy-aligned exposures
In accordance with Article 8 of the EU Taxonomy Regulation and the related Disclosures Delegated Acts for year-end 2024, financial undertakings have to determine and disclose the proportion of exposures aligned to the EU Taxonomy in their covered assets (i.e., total assets less exposures toward central governments, central banks, supranational issuers and the trading portfolio) for the climate change mitigation and adaptation objectives.
Where the use of proceeds is known at a transaction level, the bank considers relevant exposures to the extent the underlying transaction is financing a Taxonomy eligible or aligned activity. For general purpose lending to counterparties subject to the EU Taxonomy disclosure obligations as of year-end 2023, the bank considers exposures weighted by the eligibility and alignment turnover key performance indicators (KPIs) disclosed by its clients. The turnover KPIs are collected via a vendor, MSCI and mapped to relevant counterparties. Identification of undertakings with obligation to report under the EU Taxonomy and the related Disclosures Delegated Acts and their respective Taxonomy KPIs is performed in a data collection project based on the materiality of the in-scope exposures, except for the assets under management disclosures which are based on external vendor classification. As the EU Taxonomy metrics are evolving, there are limitations on the amount and granularity of available data.
Within the exposures to households, residential real estate loans against households collateralized by residential immovable property, building renovation loans and motor vehicle loans are all considered Taxonomy eligible. Given the low level of energy performance certificate (EPC) coverage in the portfolio, Taxonomy alignment of the residential real estate loans has been additionally determined via KfW sponsoring programs and the respective KfW Efficiency House standards under which loans have been granted. Deutsche Bank has involved an external industry expert to determine which standards are compliant with the technical screening criteria for substantial contribution, as defined in the EU Taxonomy’s climate change mitigation activities 7.1 “Construction of new buildings” and 7.7 “Acquisition and ownership of buildings”. Based on that, buildings constructed until 31. December 2020 shall either have an EPC class A or belong to “the top 15% of the national or regional building stock expressed as operational Primary Energy Demand (PED)”. It was concluded that buildings adhering to the criteria of KfW-70 or better are compliant with the “top 15% benchmark”. For buildings constructed after 31. December 2020, the EU Taxonomy defines that the PED has to be “at least 10% lower than the threshold set for the nearly zero-energy building (NZEB) requirements in national measures”. Here, it was concluded that buildings adhering to the criteria of KfW-40 or better are compliant with the “at least 10% lower than NZEB”-benchmark that is based on the updated German Buildings Energy Act (GEG/ Gebäudeenergiegesetz). Furthermore, EPCs are already widely collected in new business and their availability for the residential property stock is to be systematically increased with proportionate measures.
For consumer lending, the use of the proceeds information is currently not collected from customers. Accordingly, the information about Taxonomy alignment of the bank’s motor vehicle loan portfolio is currently not available. Taxonomy alignment of the renovation loan portfolio currently cannot be established either.
The calculation of Deutsche Bank’s KPIs presented in ESG6, ESG7 and ESG8 are based on the prudential consolidation circle and FINREP balance sheet.
ESG6 “Summary of KPIs on the Taxonomy-aligned exposures” summarizes Deutsche Bank’s KPIs as of December 31, 2024. The decrease in the GAR stock compared to the prior period was driven by stricter EU Taxonomy assessment criteria implemented for residential real estate.
ESG7 “Assets for the calculation of GAR” highlight the composition of the ratio’s numerator and denominator. Exposures are presented by counterparty type, e.g., financial undertakings, non-financial undertakings and households, and further split by product type, e.g., loans and advances, debt securities and equity instruments. Assets which are not considered in the GAR calculation i.e., exposures to central governments and supranational issuers, central banks exposures and trading book is also reported in this table. Taxonomy eligibility and alignment are assessed for exposures which are included in the GAR numerator.
ESG 8 “GAR (%)” includes “GAR KPI stock” which represents the summary GAR KPIs on the basis of data disclosed in the ESG7 and reflects the proportion of exposures related to Taxonomy eligible and aligned activities compared to the covered assets based on the turnover KPIs of the bank’s counterparties for the lending exposures. “GAR KPI flow” highlight the GAR KPIs on flow of new Taxonomy eligible and aligned loans and advances, debt securities and equity instruments to NFRD-relevant undertakings and households in relation to the total flow of loans and advances, debt securities and equity instruments to financial and non-financial undertakings and households. The flow data is calculated using gross carrying amount of exposures (i.e. new loans and advances, debt securities, equity instruments) newly incurred between July and December 2024 based on the turnover KPIs of the bank’s counterparties for lending exposures.
228
|
Deutsche Bank |
||
|
Pillar 3 Report as of December 31, 2024 |
||
ESG6 – Summary of key performance indicators (KPIs) on the Taxonomy-aligned exposures
|
|
Dec 31, 2024 |
|||||||
|
KPI |
||||||||
|
in % |
Climate change mitigation |
Climate change adaptation |
Total (Climate change mitigation + Climate change adaptation) |
% coverage (over total assets) |
||||
|
GAR stock |
1.0 |
0.0 |
1.0 |
16.9 |
||||
|
GAR flow |
0.3 |
0.0 |
0.3 |
20.2 |
||||
|
|
Jun 30, 2024 |
|||||||
|
KPI |
||||||||
|
in % |
Climate change mitigation |
Climate change adaptation |
Total (Climate change mitigation + Climate change adaptation) |
% coverage (over total assets) |
||||
|
GAR stock |
1.2 |
0.0 |
1.2 |
17.7 |
||||
|
GAR flow¹ |
0.1 |
0.0 |
0.1 |
23.2 |
||||
1 The calculation methodology for flow KPIs was refined for year-end 2024; comparative figures were aligned to presentation in the current report
229
|
Deutsche Bank |
||
|
Pillar 3 Report as of December 31, 2024 |
||
ESG7 – Mitigating actions: Assets for the calculation of GAR
|
|
Dec 31, 2024 |
||||||||||||||||||||||||||||||||||
|
a |
b |
c |
d |
e |
f |
g |
h |
i |
j |
k |
l |
m |
n |
o |
p |
||||||||||||||||||||
|
Disclosure reference date: Dec 31, 2024 |
|||||||||||||||||||||||||||||||||||
|
Total gross carrying amount |
Climate Change Mitigation (CCM) |
Climate Change Adaptation (CCA) |
TOTAL (CCM + CCA) |
||||||||||||||||||||||||||||||||
|
of which: towards taxonomy relevant sectors (Taxonomy-eligible) |
of which: towards taxonomy relevant sectors (Taxonomy-eligible) |
of which: towards taxonomy relevant sectors (Taxonomy-eligible) |
|||||||||||||||||||||||||||||||||
|
of which: environmentally sustainable (Taxonomy-aligned) |
of which: environmentally sustainable (Taxonomy-aligned) |
of which: environmentally sustainable (Taxonomy-aligned) |
|||||||||||||||||||||||||||||||||
|
in € m. |
of which: |
of which: |
of which: |
of which: |
of which: |
of which: |
of which: |
of which: |
of which: |
||||||||||||||||||||||||||
|
GAR - Covered assets in both numerator and denominator |
|||||||||||||||||||||||||||||||||||
|
1 |
Loans and advances, debt securities and equity instruments not HfT eligible for GAR calculation |
234,124 |
172,994 |
6,079 |
0 |
57 |
561 |
294 |
18 |
0 |
0 |
7 |
173,289 |
6,097 |
0 |
57 |
568 |
||||||||||||||||||
|
2 |
Financial corporations |
22,212 |
4,507 |
367 |
0 |
28 |
92 |
10 |
4 |
0 |
0 |
4 |
4,517 |
371 |
0 |
28 |
96 |
||||||||||||||||||
|
3 |
Credit institutions |
17,525 |
3,662 |
271 |
0 |
27 |
25 |
6 |
0 |
0 |
0 |
0 |
3,668 |
271 |
0 |
27 |
25 |
||||||||||||||||||
|
4 |
Loans and advances |
17,086 |
3,627 |
270 |
0 |
27 |
25 |
6 |
0 |
0 |
0 |
0 |
3,633 |
270 |
0 |
27 |
25 |
||||||||||||||||||
|
5 |
Debt securities, including UoP |
438 |
36 |
1 |
0 |
0 |
0 |
0 |
0 |
0 |
0 |
0 |
36 |
1 |
0 |
0 |
0 |
||||||||||||||||||
|
6 |
Equity instruments |
0 |
0 |
0 |
─ |
0 |
0 |
0 |
0 |
─ |
0 |
0 |
0 |
0 |
─ |
0 |
0 |
||||||||||||||||||
|
7 |
Other financial corporations |
4,688 |
844 |
96 |
0 |
1 |
67 |
4 |
4 |
0 |
0 |
4 |
849 |
100 |
0 |
1 |
71 |
||||||||||||||||||
|
8 |
of which investment firms |
2,970 |
622 |
69 |
0 |
0 |
62 |
4 |
4 |
0 |
0 |
4 |
626 |
73 |
0 |
0 |
66 |
||||||||||||||||||
|
9 |
Loans and advances |
2,970 |
622 |
69 |
0 |
0 |
62 |
4 |
4 |
0 |
0 |
4 |
626 |
73 |
0 |
0 |
66 |
||||||||||||||||||
|
10 |
Debt securities, including UoP |
0 |
0 |
0 |
0 |
0 |
0 |
0 |
0 |
0 |
0 |
0 |
0 |
0 |
0 |
0 |
0 |
||||||||||||||||||
|
11 |
Equity instruments |
0 |
0 |
0 |
─ |
0 |
0 |
0 |
0 |
─ |
0 |
0 |
0 |
0 |
─ |
0 |
0 |
||||||||||||||||||
|
12 |
of which management companies |
760 |
30 |
0 |
0 |
0 |
0 |
0 |
0 |
0 |
0 |
0 |
30 |
0 |
0 |
0 |
0 |
||||||||||||||||||
|
13 |
Loans and advances |
760 |
30 |
0 |
0 |
0 |
0 |
0 |
0 |
0 |
0 |
0 |
30 |
0 |
0 |
0 |
0 |
||||||||||||||||||
|
14 |
Debt securities, including UoP |
0 |
0 |
0 |
0 |
0 |
0 |
0 |
0 |
0 |
0 |
0 |
0 |
0 |
0 |
0 |
0 |
||||||||||||||||||
|
15 |
Equity instruments |
0 |
0 |
0 |
0 |
0 |
0 |
0 |
─ |
0 |
0 |
0 |
0 |
─ |
0 |
0 |
|||||||||||||||||||
|
16 |
of which insurance undertakings |
958 |
193 |
27 |
0 |
1 |
5 |
0 |
0 |
0 |
0 |
0 |
193 |
27 |
0 |
1 |
5 |
||||||||||||||||||
|
17 |
Loans and advances |
958 |
193 |
27 |
0 |
1 |
5 |
0 |
0 |
0 |
0 |
0 |
193 |
27 |
0 |
1 |
5 |
||||||||||||||||||
|
18 |
Debt securities, including UoP |
0 |
0 |
0 |
0 |
0 |
0 |
0 |
0 |
0 |
0 |
0 |
0 |
0 |
0 |
0 |
0 |
||||||||||||||||||
|
19 |
Equity instruments |
0 |
0 |
0 |
─ |
0 |
0 |
0 |
0 |
─ |
0 |
0 |
0 |
0 |
─ |
0 |
0 |
||||||||||||||||||
|
20 |
Non-financial corporations (subject to NFRD disclosure obligations) |
12,313 |
2,980 |
742 |
0 |
28 |
469 |
284 |
14 |
0 |
0 |
3 |
3,264 |
756 |
0 |
28 |
471 |
||||||||||||||||||
|
21 |
Loans and advances |
12,094 |
2,902 |
742 |
0 |
28 |
469 |
284 |
14 |
0 |
0 |
3 |
3,186 |
756 |
0 |
28 |
471 |
||||||||||||||||||
|
22 |
Debt securities, including UoP |
220 |
78 |
0 |
0 |
0 |
0 |
0 |
0 |
0 |
0 |
0 |
78 |
0 |
0 |
0 |
0 |
||||||||||||||||||
|
23 |
Equity instruments |
0 |
0 |
0 |
─ |
0 |
0 |
0 |
0 |
─ |
0 |
0 |
0 |
0 |
─ |
0 |
0 |
||||||||||||||||||
|
24 |
Households |
199,587 |
165,497 |
4,970 |
0 |
0 |
0 |
─ |
─ |
─ |
─ |
─ |
165,497 |
4,970 |
0 |
0 |
0 |
||||||||||||||||||
|
25 |
of which loans collateralised by residential immovable property |
159,075 |
159,071 |
4,970 |
0 |
0 |
0 |
─ |
─ |
─ |
─ |
─ |
159,071 |
4,970 |
0 |
0 |
0 |
||||||||||||||||||
|
26 |
of which building renovation loans |
2,948 |
2,948 |
0 |
0 |
0 |
0 |
─ |
─ |
─ |
─ |
─ |
2,948 |
0 |
0 |
0 |
0 |
||||||||||||||||||
230
|
Deutsche Bank |
||
|
Pillar 3 Report as of December 31, 2024 |
||
|
|
Dec 31, 2024 |
||||||||||||||||||||||||||||||||||
|
a |
b |
c |
d |
e |
f |
g |
h |
i |
j |
k |
l |
m |
n |
o |
p |
||||||||||||||||||||
|
Disclosure reference date: Dec 31, 2024 |
|||||||||||||||||||||||||||||||||||
|
Total gross carrying amount |
Climate Change Mitigation (CCM) |
Climate Change Adaptation (CCA) |
TOTAL (CCM + CCA) |
||||||||||||||||||||||||||||||||
|
of which: towards taxonomy relevant sectors (Taxonomy-eligible) |
of which: towards taxonomy relevant sectors (Taxonomy-eligible) |
of which: towards taxonomy relevant sectors (Taxonomy-eligible) |
|||||||||||||||||||||||||||||||||
|
of which: environmentally sustainable (Taxonomy-aligned) |
of which: environmentally sustainable (Taxonomy-aligned) |
of which: environmentally sustainable (Taxonomy-aligned) |
|||||||||||||||||||||||||||||||||
|
in € m. |
of which: |
of which: |
of which: |
of which: |
of which: |
of which: |
of which: |
of which: |
of which: |
||||||||||||||||||||||||||
|
27 |
of which motor vehicle loans |
3,478 |
3,478 |
0 |
0 |
0 |
0 |
─ |
─ |
─ |
─ |
─ |
3,478 |
0 |
0 |
0 |
0 |
||||||||||||||||||
|
28 |
Local governments financing |
0 |
0 |
0 |
0 |
0 |
0 |
0 |
0 |
0 |
0 |
0 |
0 |
0 |
0 |
0 |
0 |
||||||||||||||||||
|
29 |
Housing financing |
0 |
0 |
0 |
0 |
0 |
0 |
0 |
0 |
0 |
0 |
0 |
0 |
0 |
0 |
0 |
0 |
||||||||||||||||||
|
30 |
Other local governments financing |
0 |
0 |
0 |
0 |
0 |
0 |
0 |
0 |
0 |
0 |
0 |
0 |
0 |
0 |
0 |
0 |
||||||||||||||||||
|
31 |
Collateral obtained by taking possession: residential and commercial immovable properties |
11 |
11 |
0 |
0 |
0 |
0 |
0 |
0 |
0 |
0 |
0 |
11 |
0 |
0 |
0 |
0 |
||||||||||||||||||
|
32 |
TOTAL GAR ASSETS |
234,124 |
172,994 |
6,079 |
0 |
57 |
561 |
294 |
18 |
0 |
0 |
7 |
173,289 |
6,097 |
0 |
57 |
568 |
||||||||||||||||||
|
Assets excluded from the numerator for GAR calculation (covered in the denominator) |
|||||||||||||||||||||||||||||||||||
|
33 |
EU Non-financial corporations (not subject to NFRD disclosure obligations) |
125,585 |
─ |
─ |
─ |
─ |
─ |
─ |
─ |
─ |
─ |
─ |
─ |
─ |
─ |
─ |
─ |
||||||||||||||||||
|
34 |
Loans and advances |
122,858 |
─ |
─ |
─ |
─ |
─ |
─ |
─ |
||||||||||||||||||||||||||
|
35 |
Debt securities, including UoP |
2,258 |
─ |
─ |
─ |
─ |
─ |
─ |
─ |
─ |
─ |
─ |
─ |
─ |
─ |
─ |
─ |
||||||||||||||||||
|
36 |
Equity instruments |
469 |
─ |
─ |
─ |
─ |
─ |
─ |
─ |
─ |
─ |
─ |
─ |
─ |
─ |
─ |
─ |
||||||||||||||||||
|
37 |
Non-EU Non-financial corporations (not subject to NFRD disclosure obligations) |
223,765 |
─ |
─ |
─ |
─ |
─ |
─ |
─ |
─ |
─ |
─ |
─ |
─ |
─ |
─ |
─ |
||||||||||||||||||
|
38 |
Loans and advances |
214,331 |
─ |
─ |
─ |
─ |
─ |
─ |
─ |
─ |
─ |
─ |
─ |
─ |
─ |
─ |
─ |
||||||||||||||||||
|
39 |
Debt securities, including UoP |
8,416 |
─ |
─ |
─ |
─ |
─ |
─ |
─ |
||||||||||||||||||||||||||
|
40 |
Equity instruments |
1,018 |
─ |
─ |
─ |
─ |
─ |
─ |
─ |
||||||||||||||||||||||||||
|
41 |
Derivatives |
1,151 |
─ |
─ |
─ |
─ |
─ |
─ |
─ |
─ |
─ |
─ |
─ |
─ |
─ |
─ |
─ |
||||||||||||||||||
|
42 |
On demand interbank loans |
6,109 |
─ |
─ |
─ |
─ |
─ |
─ |
─ |
─ |
─ |
─ |
─ |
─ |
─ |
─ |
─ |
||||||||||||||||||
|
43 |
Cash and cash-related assets |
1,896 |
─ |
─ |
─ |
─ |
─ |
─ |
─ |
||||||||||||||||||||||||||
|
44 |
Other assets (e.g. Goodwill, commodities etc.) |
22,742 |
─ |
─ |
─ |
─ |
─ |
─ |
─ |
─ |
─ |
─ |
─ |
─ |
─ |
─ |
─ |
||||||||||||||||||
|
45 |
TOTAL ASSETS IN THE DENOMINATOR (GAR) |
615,372 |
─ |
─ |
─ |
─ |
─ |
─ |
─ |
─ |
─ |
─ |
─ |
─ |
─ |
─ |
─ |
||||||||||||||||||
|
Other assets excluded from both the numerator and denominator for GAR calculation |
|||||||||||||||||||||||||||||||||||
|
46 |
Sovereigns |
152,482 |
─ |
─ |
─ |
─ |
─ |
─ |
─ |
─ |
─ |
─ |
─ |
─ |
─ |
─ |
─ |
||||||||||||||||||
|
47 |
Central banks exposure |
155,851 |
─ |
─ |
─ |
─ |
─ |
─ |
─ |
─ |
─ |
─ |
─ |
─ |
─ |
─ |
─ |
||||||||||||||||||
|
48 |
Trading book |
465,328 |
─ |
─ |
─ |
─ |
─ |
─ |
─ |
||||||||||||||||||||||||||
|
49 |
TOTAL ASSETS EXCLUDED FROM NUMERATOR AND DENOMINATOR |
773,661 |
─ |
─ |
─ |
─ |
─ |
─ |
─ |
─ |
─ |
─ |
─ |
─ |
─ |
─ |
─ |
||||||||||||||||||
|
50 |
TOTAL ASSETS |
1,389,033 |
─ |
─ |
─ |
─ |
─ |
─ |
─ |
─ |
─ |
─ |
─ |
─ |
─ |
─ |
─ |
||||||||||||||||||
231
|
Deutsche Bank |
||
|
Pillar 3 Report as of December 31, 2024 |
||
|
|
Jun 30, 2024 |
||||||||||||||||||||||||||||||||||
|
a |
b |
c |
d |
e |
f |
g |
h |
i |
j |
k |
l |
m |
n |
o |
p |
||||||||||||||||||||
|
Disclosure reference date: Jun 30, 2024 |
|||||||||||||||||||||||||||||||||||
|
Total gross carrying amount |
Climate Change Mitigation (CCM) |
Climate Change Adaptation (CCA) |
TOTAL (CCM + CCA) |
||||||||||||||||||||||||||||||||
|
of which: towards taxonomy relevant sectors (Taxonomy-eligible) |
of which: towards taxonomy relevant sectors (Taxonomy-eligible) |
of which: towards taxonomy relevant sectors (Taxonomy-eligible) |
|||||||||||||||||||||||||||||||||
|
of which: environmentally sustainable (Taxonomy-aligned) |
of which: environmentally sustainable (Taxonomy-aligned) |
of which: environmentally sustainable (Taxonomy-aligned) |
|||||||||||||||||||||||||||||||||
|
in € m. |
of which: |
of which: |
of which: |
of which: |
of which: |
of which: |
of which: |
of which: |
of which: |
||||||||||||||||||||||||||
|
GAR - Covered assets in both numerator and denominator |
|||||||||||||||||||||||||||||||||||
|
1 |
Loans and advances, debt securities and equity instruments not HfT eligible for GAR calculation |
238,888 |
171,375 |
7,362 |
0 |
88 |
379 |
63 |
14 |
0 |
0 |
7 |
171,439 |
7,376 |
0 |
88 |
386 |
||||||||||||||||||
|
2 |
Financial corporations |
16,542 |
2,459 |
144 |
0 |
0 |
59 |
33 |
5 |
0 |
0 |
5 |
2,492 |
149 |
0 |
0 |
63 |
||||||||||||||||||
|
3 |
Credit institutions |
11,999 |
1,695 |
65 |
0 |
0 |
2 |
0 |
0 |
0 |
0 |
0 |
1,695 |
65 |
0 |
0 |
2 |
||||||||||||||||||
|
4 |
Loans and advances |
11,563 |
1,695 |
65 |
0 |
0 |
2 |
0 |
0 |
0 |
0 |
0 |
1,695 |
65 |
0 |
0 |
2 |
||||||||||||||||||
|
5 |
Debt securities, including UoP |
436 |
0 |
0 |
0 |
0 |
0 |
0 |
0 |
0 |
0 |
0 |
0 |
0 |
0 |
0 |
0 |
||||||||||||||||||
|
6 |
Equity instruments |
0 |
0 |
0 |
─ |
0 |
0 |
0 |
0 |
─ |
0 |
0 |
0 |
0 |
─ |
0 |
0 |
||||||||||||||||||
|
7 |
Other financial corporations |
4,543 |
765 |
78 |
0 |
0 |
56 |
33 |
5 |
0 |
0 |
5 |
798 |
84 |
0 |
0 |
61 |
||||||||||||||||||
|
8 |
of which investment firms |
2,212 |
562 |
78 |
0 |
0 |
56 |
33 |
5 |
0 |
0 |
5 |
595 |
83 |
0 |
0 |
61 |
||||||||||||||||||
|
9 |
Loans and advances |
2,212 |
562 |
78 |
0 |
0 |
56 |
33 |
5 |
0 |
0 |
5 |
595 |
83 |
0 |
0 |
61 |
||||||||||||||||||
|
10 |
Debt securities, including UoP |
0 |
0 |
0 |
0 |
0 |
0 |
0 |
0 |
0 |
0 |
0 |
0 |
0 |
0 |
0 |
0 |
||||||||||||||||||
|
11 |
Equity instruments |
0 |
0 |
0 |
─ |
0 |
0 |
0 |
0 |
─ |
0 |
0 |
0 |
0 |
─ |
0 |
0 |
||||||||||||||||||
|
12 |
of which management companies |
1,340 |
136 |
0 |
0 |
0 |
0 |
0 |
0 |
0 |
0 |
0 |
136 |
0 |
0 |
0 |
0 |
||||||||||||||||||
|
13 |
Loans and advances |
1,199 |
136 |
0 |
0 |
0 |
0 |
0 |
0 |
0 |
0 |
0 |
136 |
0 |
0 |
0 |
0 |
||||||||||||||||||
|
14 |
Debt securities, including UoP |
141 |
0 |
0 |
0 |
0 |
0 |
0 |
0 |
0 |
0 |
0 |
0 |
0 |
0 |
0 |
0 |
||||||||||||||||||
|
15 |
Equity instruments |
0 |
0 |
0 |
─ |
0 |
0 |
0 |
0 |
─ |
0 |
0 |
0 |
0 |
─ |
0 |
0 |
||||||||||||||||||
|
16 |
of which insurance undertakings |
991 |
67 |
0 |
0 |
0 |
0 |
0 |
0 |
0 |
0 |
0 |
67 |
0 |
0 |
0 |
0 |
||||||||||||||||||
|
17 |
Loans and advances |
991 |
67 |
0 |
0 |
0 |
0 |
0 |
0 |
0 |
0 |
0 |
67 |
0 |
0 |
0 |
0 |
||||||||||||||||||
|
18 |
Debt securities, including UoP |
0 |
0 |
0 |
0 |
0 |
0 |
0 |
0 |
0 |
0 |
0 |
0 |
0 |
0 |
0 |
0 |
||||||||||||||||||
|
19 |
Equity instruments |
0 |
0 |
0 |
─ |
0 |
0 |
0 |
0 |
─ |
0 |
0 |
0 |
0 |
─ |
0 |
0 |
||||||||||||||||||
|
20 |
Non-financial corporations (subject to NFRD disclosure obligations) |
13,209 |
2,836 |
673 |
0 |
88 |
321 |
30 |
8 |
0 |
0 |
2 |
2,866 |
681 |
0 |
88 |
323 |
||||||||||||||||||
|
21 |
Loans and advances |
13,127 |
2,779 |
652 |
0 |
88 |
300 |
30 |
8 |
0 |
0 |
2 |
2,810 |
661 |
0 |
88 |
302 |
||||||||||||||||||
|
22 |
Debt securities, including UoP |
82 |
57 |
21 |
0 |
0 |
21 |
0 |
0 |
0 |
0 |
0 |
57 |
21 |
0 |
0 |
21 |
||||||||||||||||||
|
23 |
Equity instruments |
0 |
0 |
0 |
─ |
0 |
0 |
0 |
0 |
─ |
0 |
0 |
0 |
0 |
─ |
0 |
0 |
||||||||||||||||||
|
24 |
Households |
209,125 |
166,080 |
6,545 |
0 |
0 |
0 |
166,080 |
6,545 |
0 |
0 |
0 |
|||||||||||||||||||||||
|
25 |
of which loans collateralised by residential immovable property |
160,002 |
160,002 |
6,545 |
0 |
0 |
0 |
─ |
─ |
─ |
─ |
─ |
160,002 |
6,545 |
0 |
0 |
0 |
||||||||||||||||||
|
26 |
of which building renovation loans |
2,806 |
2,806 |
0 |
0 |
0 |
0 |
2,806 |
0 |
0 |
0 |
0 |
|||||||||||||||||||||||
|
27 |
of which motor vehicle loans |
3,272 |
3,272 |
0 |
0 |
0 |
0 |
─ |
─ |
─ |
─ |
─ |
3,272 |
0 |
0 |
0 |
0 |
||||||||||||||||||
232
|
Deutsche Bank |
||
|
Pillar 3 Report as of December 31, 2024 |
||
|
|
Jun 30, 2024 |
||||||||||||||||||||||||||||||||||
|
a |
b |
c |
d |
e |
f |
g |
h |
i |
j |
k |
l |
m |
n |
o |
p |
||||||||||||||||||||
|
Disclosure reference date: Jun 30, 2024 |
|||||||||||||||||||||||||||||||||||
|
Total gross carrying amount |
Climate Change Mitigation (CCM) |
Climate Change Adaptation (CCA) |
TOTAL (CCM + CCA) |
||||||||||||||||||||||||||||||||
|
of which: towards taxonomy relevant sectors (Taxonomy-eligible) |
of which: towards taxonomy relevant sectors (Taxonomy-eligible) |
of which: towards taxonomy relevant sectors (Taxonomy-eligible) |
|||||||||||||||||||||||||||||||||
|
of which: environmentally sustainable (Taxonomy-aligned) |
of which: environmentally sustainable (Taxonomy-aligned) |
of which: environmentally sustainable (Taxonomy-aligned) |
|||||||||||||||||||||||||||||||||
|
in € m. |
of which: |
of which: |
of which: |
of which: |
of which: |
of which: |
of which: |
of which: |
of which: |
||||||||||||||||||||||||||
|
28 |
Local governments financing |
0 |
0 |
0 |
0 |
0 |
0 |
0 |
0 |
0 |
0 |
0 |
0 |
0 |
0 |
0 |
0 |
||||||||||||||||||
|
29 |
Housing financing |
0 |
0 |
0 |
0 |
0 |
0 |
0 |
0 |
0 |
0 |
0 |
0 |
0 |
0 |
0 |
0 |
||||||||||||||||||
|
30 |
Other local governments financing |
0 |
0 |
0 |
0 |
0 |
0 |
0 |
0 |
0 |
0 |
0 |
0 |
0 |
0 |
0 |
0 |
||||||||||||||||||
|
31 |
Collateral obtained by taking possession: residential and commercial immovable properties |
12 |
0 |
0 |
0 |
0 |
0 |
0 |
0 |
0 |
0 |
0 |
0 |
0 |
0 |
0 |
0 |
||||||||||||||||||
|
32 |
TOTAL GAR ASSETS |
238,888 |
171,375 |
7,362 |
0 |
88 |
379 |
63 |
14 |
0 |
0 |
7 |
171,439 |
7,376 |
0 |
88 |
386 |
||||||||||||||||||
|
Assets excluded from the numerator for GAR calculation (covered in the denominator) |
|||||||||||||||||||||||||||||||||||
|
33 |
EU Non-financial corporations (not subject to NFRD disclosure obligations) |
124,663 |
─ |
─ |
─ |
─ |
─ |
─ |
─ |
─ |
─ |
─ |
─ |
─ |
─ |
─ |
─ |
||||||||||||||||||
|
34 |
Loans and advances |
121,704 |
─ |
─ |
─ |
─ |
|||||||||||||||||||||||||||||
|
35 |
Debt securities, including UoP |
2,496 |
─ |
─ |
─ |
─ |
─ |
─ |
─ |
─ |
─ |
─ |
─ |
─ |
─ |
||||||||||||||||||||
|
36 |
Equity instruments |
463 |
─ |
─ |
─ |
─ |
─ |
─ |
─ |
─ |
─ |
─ |
─ |
─ |
─ |
─ |
─ |
||||||||||||||||||
|
37 |
Non-EU Non-financial corporations (not subject to NFRD disclosure obligations) |
198,684 |
─ |
─ |
─ |
─ |
─ |
─ |
|||||||||||||||||||||||||||
|
38 |
Loans and advances |
188,294 |
─ |
─ |
─ |
─ |
─ |
─ |
─ |
─ |
─ |
─ |
─ |
||||||||||||||||||||||
|
39 |
Debt securities, including UoP |
9,557 |
─ |
─ |
─ |
─ |
─ |
─ |
─ |
─ |
─ |
─ |
─ |
─ |
─ |
─ |
─ |
||||||||||||||||||
|
40 |
Equity instruments |
833 |
|||||||||||||||||||||||||||||||||
|
41 |
Derivatives |
1,273 |
─ |
─ |
─ |
─ |
─ |
─ |
─ |
─ |
─ |
─ |
─ |
─ |
─ |
─ |
─ |
||||||||||||||||||
|
42 |
On demand interbank loans |
7,202 |
─ |
─ |
─ |
─ |
|||||||||||||||||||||||||||||
|
43 |
Cash and cash-related assets |
1,656 |
─ |
─ |
─ |
─ |
─ |
─ |
─ |
─ |
─ |
─ |
─ |
─ |
─ |
─ |
|||||||||||||||||||
|
44 |
Other assets (e.g. Goodwill, commodities etc.) |
22,982 |
─ |
─ |
─ |
─ |
─ |
─ |
─ |
─ |
─ |
─ |
─ |
─ |
─ |
─ |
─ |
||||||||||||||||||
|
45 |
TOTAL ASSETS IN THE DENOMINATOR (GAR) |
595,349 |
─ |
─ |
|||||||||||||||||||||||||||||||
|
Other assets excluded from both the numerator and denominator for GAR calculation |
|||||||||||||||||||||||||||||||||||
|
46 |
Sovereigns |
149,387 |
─ |
─ |
─ |
─ |
─ |
─ |
─ |
─ |
─ |
─ |
─ |
─ |
─ |
─ |
─ |
||||||||||||||||||
|
47 |
Central banks exposure |
157,181 |
─ |
─ |
─ |
─ |
─ |
─ |
─ |
||||||||||||||||||||||||||
|
48 |
Trading book |
451,498 |
|||||||||||||||||||||||||||||||||
|
49 |
TOTAL ASSETS EXCLUDED FROM NUMERATOR AND DENOMINATOR |
758,066 |
─ |
─ |
─ |
─ |
─ |
─ |
─ |
─ |
─ |
─ |
─ |
─ |
|||||||||||||||||||||
|
50 |
TOTAL ASSETS |
1,353,415 |
─ |
─ |
─ |
─ |
─ |
─ |
─ |
||||||||||||||||||||||||||
233
|
Deutsche Bank |
||
|
Pillar 3 Report as of December 31, 2024 |
||
234
|
Deutsche Bank |
||
|
Pillar 3 Report as of December 31, 2024 |
||
ESG8 – GAR (%)
|
|
Dec 31, 2024 |
|||||||||||||||||||||||||||||||||
|
a |
b |
c |
d |
e |
f |
g |
h |
i |
j |
k |
l |
m |
n |
o |
p |
|||||||||||||||||||
|
Disclosure reference date: Dec 31, 2024 KPIs on stock |
||||||||||||||||||||||||||||||||||
|
Climate Change Mitigation (CCM) |
Climate Change Adaptation (CCA) |
TOTAL (CCM + CCA) |
||||||||||||||||||||||||||||||||
|
Proportion of eligible assets funding taxonomy relevant sectors |
Proportion of eligible assets funding taxonomy relevant sectors |
Proportion of eligible assets funding taxonomy relevant sectors |
||||||||||||||||||||||||||||||||
|
of which: environmentally sustainable (Taxonomy-aligned) |
of which: environmentally sustainable (Taxonomy-aligned) |
of which: environmentally sustainable (Taxonomy-aligned) |
||||||||||||||||||||||||||||||||
|
in % (compared to total covered assets in the denominator) |
of which: |
of which: |
of which: |
of which: |
of which: |
of which: |
of which: |
of which: |
of which: |
Proportion of total assets covered |
||||||||||||||||||||||||
|
1 |
GAR |
28.1 |
1.0 |
0.0 |
0.0 |
0.1 |
0.1 |
0.0 |
0.0 |
0.0 |
0.0 |
28.2 |
1.0 |
0.0 |
0.0 |
0.1 |
16.9 |
|||||||||||||||||
|
2 |
Loans and advances, debt securities and equity instruments not HfT eligible for GAR calculation |
28.1 |
1.0 |
0.0 |
0.0 |
0.1 |
0.1 |
0.0 |
0.0 |
0.0 |
0.0 |
28.2 |
1.0 |
0.0 |
0.0 |
0.1 |
16.9 |
|||||||||||||||||
|
3 |
Financial corporations |
0.7 |
0.1 |
0.0 |
0.0 |
0.0 |
0.0 |
0.0 |
0.0 |
0.0 |
0.0 |
0.7 |
0.1 |
0.0 |
0.0 |
0.0 |
1.6 |
|||||||||||||||||
|
4 |
Credit institutions |
0.6 |
0.0 |
0.0 |
0.0 |
0.0 |
0.0 |
0.0 |
0.0 |
0.0 |
0.0 |
0.6 |
0.0 |
0.0 |
0.0 |
0.0 |
1.3 |
|||||||||||||||||
|
5 |
Other financial corporations |
0.1 |
0.0 |
0.0 |
0.0 |
0.0 |
0.0 |
0.0 |
0.0 |
0.0 |
0.0 |
0.1 |
0.0 |
0.0 |
0.0 |
0.0 |
0.3 |
|||||||||||||||||
|
6 |
of which investment firms |
0.1 |
0.0 |
0.0 |
0.0 |
0.0 |
0.0 |
0.0 |
0.0 |
0.0 |
0.0 |
0.1 |
0.0 |
0.0 |
0.0 |
0.0 |
0.2 |
|||||||||||||||||
|
7 |
of which management companies |
0.0 |
0.0 |
0.0 |
0.0 |
0.0 |
0.0 |
0.0 |
0.0 |
0.0 |
0.0 |
0.0 |
0.0 |
0.0 |
0.0 |
0.0 |
0.1 |
|||||||||||||||||
|
8 |
of which insurance undertakings |
0.0 |
0.0 |
0.0 |
0.0 |
0.0 |
0.0 |
0.0 |
0.0 |
0.0 |
0.0 |
0.0 |
0.0 |
0.0 |
0.0 |
0.0 |
0.1 |
|||||||||||||||||
|
9 |
Non-financial corporations (subject to NFRD disclosure obligations) |
0.5 |
0.1 |
0.0 |
0.0 |
0.1 |
0.1 |
0.0 |
0.0 |
0.0 |
0.0 |
0.5 |
0.1 |
0.0 |
0.0 |
0.1 |
0.9 |
|||||||||||||||||
|
10 |
Households |
26.9 |
0.8 |
0.0 |
0.0 |
0.0 |
0.0 |
0.0 |
0.0 |
0.0 |
0.0 |
26.9 |
0.8 |
0.0 |
0.0 |
0.0 |
14.4 |
|||||||||||||||||
|
11 |
of which loans collateralised by residential immovable property |
25.9 |
0.8 |
0.0 |
0.0 |
0.0 |
0.0 |
0.0 |
0.0 |
0.0 |
0.0 |
25.9 |
0.8 |
0.0 |
0.0 |
0.0 |
11.5 |
|||||||||||||||||
|
12 |
of which building renovation loans |
0.5 |
0.0 |
0.0 |
0.0 |
0.0 |
0.0 |
0.0 |
0.0 |
0.0 |
0.0 |
0.5 |
0.0 |
0.0 |
0.0 |
0.0 |
0.2 |
|||||||||||||||||
|
13 |
of which motor vehicle loans |
0.6 |
0.0 |
0.0 |
0.0 |
0.0 |
0.0 |
0.0 |
0.0 |
0.0 |
0.0 |
0.6 |
0.0 |
0.0 |
0.0 |
0.0 |
0.3 |
|||||||||||||||||
|
14 |
Local governments financing |
0.0 |
0.0 |
0.0 |
0.0 |
0.0 |
0.0 |
0.0 |
0.0 |
0.0 |
0.0 |
0.0 |
0.0 |
0.0 |
0.0 |
0.0 |
0.0 |
|||||||||||||||||
|
15 |
Housing financing |
0.0 |
0.0 |
0.0 |
0.0 |
0.0 |
0.0 |
0.0 |
0.0 |
0.0 |
0.0 |
0.0 |
0.0 |
0.0 |
0.0 |
0.0 |
0.0 |
|||||||||||||||||
|
16 |
Other local governments financing |
0.0 |
0.0 |
0.0 |
0.0 |
0.0 |
0.0 |
0.0 |
0.0 |
0.0 |
0.0 |
0.0 |
0.0 |
0.0 |
0.0 |
0.0 |
0.0 |
|||||||||||||||||
|
17 |
Collateral obtained by taking possession: residential and commercial immovable properties |
0.0 |
0.0 |
0.0 |
0.0 |
0.0 |
0.0 |
0.0 |
0.0 |
0.0 |
0.0 |
0.0 |
0.0 |
0.0 |
0.0 |
0.0 |
0.0 |
|||||||||||||||||
235
|
Deutsche Bank |
||
|
Pillar 3 Report as of December 31, 2024 |
||
|
|
Dec 31, 2024 |
|||||||||||||||||||||||||||||||||
|
q |
r |
s |
t |
u |
v |
w |
x |
y |
z |
aa |
ab |
ac |
ad |
ae |
af |
|||||||||||||||||||
|
Disclosure reference date: Dec 31, 2024 KPIs on flows |
||||||||||||||||||||||||||||||||||
|
Climate Change Mitigation (CCM) |
Climate Change Adaptation (CCA) |
TOTAL (CCM + CCA) |
||||||||||||||||||||||||||||||||
|
Proportion of new eligible assets funding taxonomy relevant sectors |
Proportion of new eligible assets funding taxonomy relevant sectors |
Proportion of new eligible assets funding taxonomy relevant sectors |
||||||||||||||||||||||||||||||||
|
of which: environmentally sustainable (Taxonomy-aligned) |
of which: environmentally sustainable (Taxonomy-aligned) |
of which: environmentally sustainable (Taxonomy-aligned) |
||||||||||||||||||||||||||||||||
|
in % (compared to total covered assets in the denominator) |
of which: |
of which: |
of which: |
of which: |
of which: |
of which: |
of which: |
of which: |
of which: |
Proportion of total new assets covered |
||||||||||||||||||||||||
|
1 |
GAR |
4.5 |
0.3 |
0.0 |
0.0 |
0.1 |
0.1 |
0.0 |
0.0 |
0.0 |
0.0 |
4.6 |
0.3 |
0.0 |
0.0 |
0.1 |
20.2 |
|||||||||||||||||
|
2 |
Loans and advances, debt securities and equity instruments not HfT eligible for GAR calculation |
4.5 |
0.3 |
0.0 |
0.0 |
0.1 |
0.1 |
0.0 |
0.0 |
0.0 |
0.0 |
4.6 |
0.3 |
0.0 |
0.0 |
0.1 |
20.2 |
|||||||||||||||||
|
3 |
Financial corporations |
2.8 |
0.2 |
0.0 |
0.0 |
0.0 |
0.0 |
0.0 |
0.0 |
0.0 |
0.0 |
2.8 |
0.2 |
0.0 |
0.0 |
0.0 |
15.5 |
|||||||||||||||||
|
4 |
Credit institutions |
2.8 |
0.2 |
0.0 |
0.0 |
0.0 |
0.0 |
0.0 |
0.0 |
0.0 |
0.0 |
2.8 |
0.2 |
0.0 |
0.0 |
0.0 |
15.0 |
|||||||||||||||||
|
5 |
Other financial corporations |
0.0 |
0.0 |
0.0 |
0.0 |
0.0 |
0.0 |
0.0 |
0.0 |
0.0 |
0.0 |
0.0 |
0.0 |
0.0 |
0.0 |
0.0 |
0.5 |
|||||||||||||||||
|
6 |
of which investment firms |
0.0 |
0.0 |
0.0 |
0.0 |
0.0 |
0.0 |
0.0 |
0.0 |
0.0 |
0.0 |
0.0 |
0.0 |
0.0 |
0.0 |
0.0 |
0.4 |
|||||||||||||||||
|
7 |
of which management companies |
0.0 |
0.0 |
0.0 |
0.0 |
0.0 |
0.0 |
0.0 |
0.0 |
0.0 |
0.0 |
0.0 |
0.0 |
0.0 |
0.0 |
0.0 |
0.1 |
|||||||||||||||||
|
8 |
of which insurance undertakings |
0.0 |
0.0 |
0.0 |
0.0 |
0.0 |
0.0 |
0.0 |
0.0 |
0.0 |
0.0 |
0.0 |
0.0 |
0.0 |
0.0 |
0.0 |
0.0 |
|||||||||||||||||
|
9 |
Non-financial corporations (subject to NFRD disclosure obligations) |
0.3 |
0.1 |
0.0 |
0.0 |
0.1 |
0.1 |
0.0 |
0.0 |
0.0 |
0.0 |
0.4 |
0.1 |
0.0 |
0.0 |
0.1 |
1.2 |
|||||||||||||||||
|
10 |
Households |
1.4 |
0.0 |
0.0 |
0.0 |
0.0 |
0.0 |
0.0 |
0.0 |
0.0 |
0.0 |
1.4 |
0.0 |
0.0 |
0.0 |
0.0 |
3.5 |
|||||||||||||||||
|
11 |
of which loans collateralised by residential immovable property |
1.0 |
0.0 |
0.0 |
0.0 |
0.0 |
0.0 |
0.0 |
0.0 |
0.0 |
0.0 |
1.0 |
0.0 |
0.0 |
0.0 |
0.0 |
1.0 |
|||||||||||||||||
|
12 |
of which building renovation loans |
0.0 |
0.0 |
0.0 |
0.0 |
0.0 |
0.0 |
0.0 |
0.0 |
0.0 |
0.0 |
0.0 |
0.0 |
0.0 |
0.0 |
0.0 |
0.0 |
|||||||||||||||||
|
13 |
of which motor vehicle loans |
0.3 |
0.0 |
0.0 |
0.0 |
0.0 |
0.0 |
0.0 |
0.0 |
0.0 |
0.0 |
0.3 |
0.0 |
0.0 |
0.0 |
0.0 |
0.3 |
|||||||||||||||||
|
14 |
Local governments financing |
0.0 |
0.0 |
0.0 |
0.0 |
0.0 |
0.0 |
0.0 |
0.0 |
0.0 |
0.0 |
0.0 |
0.0 |
0.0 |
0.0 |
0.0 |
0.0 |
|||||||||||||||||
|
15 |
Housing financing |
0.0 |
0.0 |
0.0 |
0.0 |
0.0 |
0.0 |
0.0 |
0.0 |
0.0 |
0.0 |
0.0 |
0.0 |
0.0 |
0.0 |
0.0 |
0.0 |
|||||||||||||||||
|
16 |
Other local governments financing |
0.0 |
0.0 |
0.0 |
0.0 |
0.0 |
0.0 |
0.0 |
0.0 |
0.0 |
0.0 |
0.0 |
0.0 |
0.0 |
0.0 |
0.0 |
0.0 |
|||||||||||||||||
|
17 |
Collateral obtained by taking possession: residential and commercial immovable properties |
0.0 |
0.0 |
0.0 |
0.0 |
0.0 |
0.0 |
0.0 |
0.0 |
0.0 |
0.0 |
0.0 |
0.0 |
0.0 |
0.0 |
0.0 |
0.0 |
|||||||||||||||||
236
|
Deutsche Bank |
||
|
Pillar 3 Report as of December 31, 2024 |
||
|
|
Jun 30, 2024 |
|||||||||||||||||||||||||||||||||
|
a |
b |
c |
d |
e |
f |
g |
h |
i |
j |
k |
l |
m |
n |
o |
p |
|||||||||||||||||||
|
Disclosure reference date: Jun 30, 2024 |
||||||||||||||||||||||||||||||||||
|
Climate Change Mitigation (CCM) |
Climate Change Adaptation (CCA) |
TOTAL (CCM + CCA) |
||||||||||||||||||||||||||||||||
|
Proportion of eligible assets funding taxonomy relevant sectors |
Proportion of eligible assets funding taxonomy relevant sectors |
Proportion of eligible assets funding taxonomy relevant sectors |
||||||||||||||||||||||||||||||||
|
of which: environmentally sustainable (Taxonomy-aligned) |
of which: environmentally sustainable (Taxonomy-aligned) |
of which: environmentally sustainable (Taxonomy-aligned) |
||||||||||||||||||||||||||||||||
|
in % (compared to total covered assets in the denominator) |
of which: |
of which: |
of which: |
of which: |
of which: |
of which: |
of which: |
of which: |
of which: |
Proportion of total assets covered |
||||||||||||||||||||||||
|
1 |
GAR |
28.8 |
1.2 |
0.0 |
0.0 |
0.1 |
0.0 |
0.0 |
0.0 |
0.0 |
0.0 |
28.8 |
1.2 |
0.0 |
0.0 |
0.1 |
17.7 |
|||||||||||||||||
|
2 |
Loans and advances, debt securities and equity instruments not HfT eligible for GAR calculation |
28.8 |
1.2 |
0.0 |
0.0 |
0.1 |
0.0 |
0.0 |
0.0 |
0.0 |
0.0 |
28.8 |
1.2 |
0.0 |
0.0 |
0.1 |
17.7 |
|||||||||||||||||
|
3 |
Financial corporations |
0.4 |
0.0 |
0.0 |
0.0 |
0.0 |
0.0 |
0.0 |
0.0 |
0.0 |
0.0 |
0.4 |
0.0 |
0.0 |
0.0 |
0.0 |
1.2 |
|||||||||||||||||
|
4 |
Credit institutions |
0.3 |
0.0 |
0.0 |
0.0 |
0.0 |
0.0 |
0.0 |
0.0 |
0.0 |
0.0 |
0.3 |
0.0 |
0.0 |
0.0 |
0.0 |
0.9 |
|||||||||||||||||
|
5 |
Other financial corporations |
0.1 |
0.0 |
0.0 |
0.0 |
0.0 |
0.0 |
0.0 |
0.0 |
0.0 |
0.0 |
0.1 |
0.0 |
0.0 |
0.0 |
0.0 |
0.3 |
|||||||||||||||||
|
6 |
of which investment firms |
0.1 |
0.0 |
0.0 |
0.0 |
0.0 |
0.0 |
0.0 |
0.0 |
0.0 |
0.0 |
0.1 |
0.0 |
0.0 |
0.0 |
0.0 |
0.2 |
|||||||||||||||||
|
7 |
of which management companies |
0.0 |
0.0 |
0.0 |
0.0 |
0.0 |
0.0 |
0.0 |
0.0 |
0.0 |
0.0 |
0.0 |
0.0 |
0.0 |
0.0 |
0.0 |
0.1 |
|||||||||||||||||
|
8 |
of which insurance undertakings |
0.0 |
0.0 |
0.0 |
0.0 |
0.0 |
0.0 |
0.0 |
0.0 |
0.0 |
0.0 |
0.0 |
0.0 |
0.0 |
0.0 |
0.0 |
0.1 |
|||||||||||||||||
|
9 |
Non-financial corporations (subject to NFRD disclosure obligations) |
0.5 |
0.1 |
0.0 |
0.0 |
0.1 |
0.0 |
0.0 |
0.0 |
0.0 |
0.0 |
0.5 |
0.1 |
0.0 |
0.0 |
0.1 |
1.0 |
|||||||||||||||||
|
10 |
Households |
27.9 |
1.1 |
0.0 |
0.0 |
0.0 |
0.0 |
0.0 |
0.0 |
0.0 |
0.0 |
27.9 |
1.1 |
0.0 |
0.0 |
0.0 |
15.5 |
|||||||||||||||||
|
11 |
of which loans collateralised by residential immovable property |
26.9 |
1.1 |
0.0 |
0.0 |
0.0 |
0.0 |
0.0 |
0.0 |
0.0 |
0.0 |
26.9 |
1.1 |
0.0 |
0.0 |
0.0 |
11.8 |
|||||||||||||||||
|
12 |
of which building renovation loans |
0.5 |
0.0 |
0.0 |
0.0 |
0.0 |
0.0 |
0.0 |
0.0 |
0.0 |
0.0 |
0.5 |
0.0 |
0.0 |
0.0 |
0.0 |
0.2 |
|||||||||||||||||
|
13 |
of which motor vehicle loans |
0.6 |
0.0 |
0.0 |
0.0 |
0.0 |
0.0 |
0.0 |
0.0 |
0.0 |
0.0 |
0.6 |
0.0 |
0.0 |
0.0 |
0.0 |
0.2 |
|||||||||||||||||
|
14 |
Local governments financing |
0.0 |
0.0 |
0.0 |
0.0 |
0.0 |
0.0 |
0.0 |
0.0 |
0.0 |
0.0 |
0.0 |
0.0 |
0.0 |
0.0 |
0.0 |
0.0 |
|||||||||||||||||
|
15 |
Housing financing |
0.0 |
0.0 |
0.0 |
0.0 |
0.0 |
0.0 |
0.0 |
0.0 |
0.0 |
0.0 |
0.0 |
0.0 |
0.0 |
0.0 |
0.0 |
0.0 |
|||||||||||||||||
|
16 |
Other local governments financing |
0.0 |
0.0 |
0.0 |
0.0 |
0.0 |
0.0 |
0.0 |
0.0 |
0.0 |
0.0 |
0.0 |
0.0 |
0.0 |
0.0 |
0.0 |
0.0 |
|||||||||||||||||
|
17 |
Collateral obtained by taking possession: residential and commercial immovable properties |
0.0 |
0.0 |
0.0 |
0.0 |
0.0 |
0.0 |
0.0 |
0.0 |
0.0 |
0.0 |
0.0 |
0.0 |
0.0 |
0.0 |
0.0 |
0.0 |
|||||||||||||||||
237
|
Deutsche Bank |
||
|
Pillar 3 Report as of December 31, 2024 |
||
|
|
Jun 30, 2024 |
|||||||||||||||||||||||||||||||||
|
q |
r |
s |
t |
u |
v |
w |
x |
y |
z |
aa |
ab |
ac |
ad |
ae |
af |
|||||||||||||||||||
|
Disclosure reference date: Jun 30, 2024 KPIs on flows ¹ |
||||||||||||||||||||||||||||||||||
|
Climate Change Mitigation (CCM) |
Climate Change Adaptation (CCA) |
TOTAL (CCM + CCA) |
||||||||||||||||||||||||||||||||
|
Proportion of new eligible assets funding taxonomy relevant sectors |
Proportion of new eligible assets funding taxonomy relevant sectors |
Proportion of new eligible assets funding taxonomy relevant sectors |
||||||||||||||||||||||||||||||||
|
of which: environmentally sustainable (Taxonomy-aligned) |
of which: environmentally sustainable (Taxonomy-aligned) |
of which: environmentally sustainable (Taxonomy-aligned) |
||||||||||||||||||||||||||||||||
|
in % (compared to total covered assets in the denominator) |
of which: |
of which: |
of which: |
of which: |
of which: |
of which: |
of which: |
of which: |
of which: |
Proportion of total new assets covered |
||||||||||||||||||||||||
|
1 |
GAR |
5.1 |
0.1 |
0.0 |
0.0 |
0.0 |
0.0 |
0.0 |
0.0 |
0.0 |
0.0 |
5.1 |
0.1 |
0.0 |
0.0 |
0.0 |
23.2 |
|||||||||||||||||
|
2 |
Loans and advances, debt securities and equity instruments not HfT eligible for GAR calculation |
5.1 |
0.1 |
0.0 |
0.0 |
0.0 |
0.0 |
0.0 |
0.0 |
0.0 |
0.0 |
5.1 |
0.1 |
0.0 |
0.0 |
0.0 |
23.2 |
|||||||||||||||||
|
3 |
Financial corporations |
1.7 |
0.0 |
0.0 |
0.0 |
0.0 |
0.0 |
0.0 |
0.0 |
0.0 |
0.0 |
1.7 |
0.0 |
0.0 |
0.0 |
0.0 |
16.3 |
|||||||||||||||||
|
4 |
Credit institutions |
1.7 |
0.0 |
0.0 |
0.0 |
0.0 |
0.0 |
0.0 |
0.0 |
0.0 |
0.0 |
1.7 |
0.0 |
0.0 |
0.0 |
0.0 |
14.9 |
|||||||||||||||||
|
5 |
Other financial corporations |
0.0 |
0.0 |
0.0 |
0.0 |
0.0 |
0.0 |
0.0 |
0.0 |
0.0 |
0.0 |
0.0 |
0.0 |
0.0 |
0.0 |
0.0 |
1.4 |
|||||||||||||||||
|
6 |
of which investment firms |
0.0 |
0.0 |
0.0 |
0.0 |
0.0 |
0.0 |
0.0 |
0.0 |
0.0 |
0.0 |
0.0 |
0.0 |
0.0 |
0.0 |
0.0 |
1.3 |
|||||||||||||||||
|
7 |
of which management companies |
0.0 |
0.0 |
0.0 |
0.0 |
0.0 |
0.0 |
0.0 |
0.0 |
0.0 |
0.0 |
0.0 |
0.0 |
0.0 |
0.0 |
0.0 |
0.0 |
|||||||||||||||||
|
8 |
of which insurance undertakings |
0.0 |
0.0 |
0.0 |
0.0 |
0.0 |
0.0 |
0.0 |
0.0 |
0.0 |
0.0 |
0.0 |
0.0 |
0.0 |
0.0 |
0.0 |
0.1 |
|||||||||||||||||
|
9 |
Non-financial corporations (subject to NFRD disclosure obligations) |
0.5 |
0.1 |
0.0 |
0.0 |
0.0 |
0.0 |
0.0 |
0.0 |
0.0 |
0.0 |
0.5 |
0.1 |
0.0 |
0.0 |
0.0 |
1.3 |
|||||||||||||||||
|
10 |
Households |
2.9 |
0.1 |
0.0 |
0.0 |
0.0 |
0.0 |
0.0 |
0.0 |
0.0 |
0.0 |
2.8 |
0.1 |
0.0 |
0.0 |
0.0 |
5.6 |
|||||||||||||||||
|
11 |
of which loans collateralised by residential immovable property |
2.2 |
0.1 |
0.0 |
0.0 |
0.0 |
0.0 |
0.0 |
0.0 |
0.0 |
0.0 |
2.2 |
0.1 |
0.0 |
0.0 |
0.0 |
2.2 |
|||||||||||||||||
|
12 |
of which building renovation loans |
0.1 |
0.0 |
0.0 |
0.0 |
0.0 |
0.0 |
0.0 |
0.0 |
0.0 |
0.0 |
0.1 |
0.0 |
0.0 |
0.0 |
0.0 |
0.1 |
|||||||||||||||||
|
13 |
of which motor vehicle loans |
0.5 |
0.0 |
0.0 |
0.0 |
0.0 |
0.0 |
0.0 |
0.0 |
0.0 |
0.0 |
0.5 |
0.0 |
0.0 |
0.0 |
0.0 |
0.5 |
|||||||||||||||||
|
14 |
Local governments financing |
0.0 |
0.0 |
0.0 |
0.0 |
0.0 |
0.0 |
0.0 |
0.0 |
0.0 |
0.0 |
0.0 |
0.0 |
0.0 |
0.0 |
0.0 |
0.0 |
|||||||||||||||||
|
15 |
Housing financing |
0.0 |
0.0 |
0.0 |
0.0 |
0.0 |
0.0 |
0.0 |
0.0 |
0.0 |
0.0 |
0.0 |
0.0 |
0.0 |
0.0 |
0.0 |
0.0 |
|||||||||||||||||
|
16 |
Other local governments financing |
0.0 |
0.0 |
0.0 |
0.0 |
0.0 |
0.0 |
0.0 |
0.0 |
0.0 |
0.0 |
0.0 |
0.0 |
0.0 |
0.0 |
0.0 |
0.0 |
|||||||||||||||||
|
17 |
Collateral obtained by taking possession: residential and commercial immovable properties |
0.0 |
0.0 |
0.0 |
0.0 |
0.0 |
0.0 |
0.0 |
0.0 |
0.0 |
0.0 |
0.0 |
0.0 |
0.0 |
0.0 |
0.0 |
0.0 |
|||||||||||||||||
1 The calculation methodology for flow KPIs was refined for year-end 2024; comparative figures were aligned to presentation in the current year
238
|
Deutsche Bank |
||
|
Pillar 3 Report as of December 31, 2024 |
||
Climate change mitigating actions not covered in EU Taxonomy
The following table ESG10 provides an overview of on balance-sheet loans and bonds as of December 31, 2024 that are supporting the transition toward sustainable growth and a low-carbon economy, but are not covered by or not aligned to the EU Taxonomy and therefore not included in by the Green Asset Ratio tables ESG7 and ESG8.
Loans aimed at climate change mitigation were assessed in accordance with Deutsche Bank Green Financing Framework. These loans support projects related to mitigation of climate change transition risk, such as generation of renewable energy, development and implementation of products or technology that reduce the use of energy, green buildings, clean transportation as well as development of energy-efficient data centers, hosting, and related activities. Bonds aimed at climate change mitigation were facilitated by Deutsche Bank as part of its target to achieve at least € 500 billion in sustainable financing and ESG investments between 2020 and year end 2025, as defined in the Group’s Sustainable Finance Framework. Reported numbers are on balance-sheet positions as of December 31, 2024.
The majority of the € 12 billion assets reported by Deutsche Bank in ESG10 is loans. The increase since June 30, 2024, is predominantly offsetting the reduction in the EU Taxonomy aligned assets reported in ESG6-8 due to stricter assessment criteria implemented for residential real estate.
239
|
Deutsche Bank |
||
|
Pillar 3 Report as of December 31, 2024 |
||
ESG10 – Other climate change risk mitigating actions that are not covered in the EU Taxonomy
|
|
Dec 31, 2024 |
|||||||||||
|
in € m. |
b |
c |
d |
e |
f |
|||||||
|
Type of financial instrument |
Type of counterparty |
Gross carrying amount |
Type of risk mitigated (Climate change transition risk) |
Type of risk mitigated (Climate change physical risk) |
Qualitative information on the nature of the mitigating actions |
|||||||
|
1 |
Bonds (e.g. green, sustainable, sustainability-linked under standards other than the EU standards) |
Financial corporations |
95 |
Climate change transition risk |
Eligible projects for pertain to Renewable Energy generation (solar, wind and hydro power), energy efficiency, clean transportation, green buildings, sustainable forestry, healthcare, education, Sustainable Water Management, Biodiversity Conservation and Sustainable Management of Natural Resources and Land Use |
|||||||
|
2 |
Non-financial corporations |
71 |
Climate change transition risk |
Eligible projects for pertain to Renewable Energy generation (solar, wind and hydro power), energy efficiency, clean transportation, green buildings, sustainable forestry, healthcare, education, Sustainable Water Management, Biodiversity Conservation and Sustainable Management of Natural Resources and Land Use |
||||||||
|
3 |
Of which Loans collateralised by commercial immovable property |
0 |
||||||||||
|
4 |
Households |
0 |
||||||||||
|
5 |
Of which Loans collateralised by residential immovable property |
0 |
||||||||||
|
6 |
Of which building renovation loans |
0 |
||||||||||
|
7 |
Other counterparties |
1,265 |
Climate change transition risk |
Eligible projects for pertain to Renewable Energy generation (solar, wind and hydro power), energy efficiency, clean transportation, green buildings, sustainable forestry, healthcare, education, Sustainable Water Management, Biodiversity Conservation and Sustainable Management of Natural Resources and Land Use |
||||||||
|
8 |
Loans (e.g. green, sustainable, sustainability-linked under standards other than the EU standards) |
Financial corporations |
898 |
Climate change transition risk |
Loans for projects for setting up and operating Solar, Wind and Biomass Power plants (renewable energy). Loans to energy efficient commercial buildings. Loans for Efficient lightning, data center and clean transportation |
|||||||
|
9 |
Non-financial corporations |
7,777 |
Climate change transition risk |
Loans for projects for setting up and operating Solar, Wind and Biomass Power plants (renewable energy). Loans to energy efficient commercial buildings. Loans for Efficient lightning, data center and clean transportation |
||||||||
|
10 |
Of which Loans collateralised by commercial immovable property |
2,331 |
Climate change transition risk |
Loans for energy efficient commercial buildings. |
||||||||
|
11 |
Households |
1,763 |
Climate change transition risk |
Loans for construction/acquisition of new and existing energy efficient residential buildings. |
||||||||
|
12 |
Of which Loans collateralised by residential immovable property |
1,763 |
Climate change transition risk |
Loans for construction/acquisition of new and existing energy efficient residential buildings. |
||||||||
|
13 |
Of which building renovation loans |
0 |
||||||||||
|
14 |
Other counterparties |
0 |
||||||||||
240
|
Deutsche Bank |
||
|
Pillar 3 Report as of December 31, 2024 |
||
|
|
Jun 30, 2024 |
|||||||||||
|
in € m. |
b |
c |
d |
e |
f |
|||||||
|
Type of financial instrument |
Type of counterparty |
Gross carrying amount |
Type of risk mitigated (Climate change transition risk) |
Type of risk mitigated (Climate change physical risk) |
Qualitative information on the nature of the mitigating actions |
|||||||
|
1 |
Bonds (e.g. green, sustainable, sustainability-linked under standards other than the EU standards) |
Financial corporations |
95 |
Climate change transition risk |
Projects pertaining to renewable energy generation (solar, wind and hydro power), energy efficiency, clean transportation, green buildings, and sustainable management of natural resources and land use |
|||||||
|
2 |
Non-financial corporations |
372 |
Climate change transition risk |
|||||||||
|
3 |
Of which Loans collateralised by commercial immovable property |
0 |
||||||||||
|
4 |
Households |
0 |
||||||||||
|
5 |
Of which Loans collateralised by residential immovable property |
0 |
||||||||||
|
6 |
Of which building renovation loans |
0 |
||||||||||
|
7 |
Other counterparties |
805 |
Climate change transition risk |
Projects pertaining to renewable energy generation (solar, wind and hydro power), energy efficiency, clean transportation, green buildings, and sustainable management of natural resources and land use |
||||||||
|
8 |
Loans (e.g. green, sustainable, sustainability-linked under standards other than the EU standards) |
Financial corporations |
353 |
Climate change transition risk |
||||||||
|
9 |
Non-financial corporations |
6,841 |
Climate change transition risk |
Loans for projects for setting up and operating Solar, Wind and Biomass Power plants (renewable energy). Loans to energy efficient commercial buildings |
||||||||
|
10 |
Of which Loans collateralised by commercial immovable property |
2,349 |
Climate change transition risk |
Loans for energy efficient commercial buildings |
||||||||
|
11 |
Households |
8 |
Climate change transition risk |
Loans for construction and acquisition of new and existing energy efficient residential buildings |
||||||||
|
12 |
Of which Loans collateralised by residential immovable property |
8 |
Climate change transition risk |
Loans for construction and acquisition of new and existing energy efficient residential buildings |
||||||||
|
13 |
Of which building renovation loans |
0 |
||||||||||
|
14 |
Other counterparties |
0 |
||||||||||
241
|
Deutsche Bank |
||
|
Pillar 3 Report as of December 31, 2024 |
||
Liquidity risk
Risk management objectives and policies
Liquidity risk management strategies and processes
Article 435 (1)(a) CRR (EU OVA & EU LIQA)
The Group’s liquidity risk management principles are documented in the “Group Liquidity Risk Management Policy” and the framework is described in the “Global Liquidity Risk Framework” and “Global Funding Risk Framework” documents. Both the policy and framework documents adhere to and articulate how the eight key risk management practices are applied to liquidity risk, with such key practices including risk governance, risk organization (3 lines of defence), risk culture, risk appetite and -strategy, risk identification and -assessment, risk mitigation and controls, risk measurement and reporting, stress planning and -execution. The individual roles and responsibilities relevant to each of these practices are laid out and documented in the Global Responsibility Matrix for liquidity risk, which provides further clarity and transparency on the roles and responsibilities across all involved stakeholders.
Liquidity risk management structure and organization
Article 435 (1)(b) CRR (EU OVA & EU LIQA)
The Management Board defines the liquidity and funding risk strategy for the Group and sets the risk appetite, based on recommendations made by the Group Risk Committee. The Management Board reviews and approves the risk appetite at least annually. The risk appetite is applied at the Group level and to internally defined Key Liquidity Entities e.g., Deutsche Bank AG to monitor and control liquidity risk as well as the Group’s long-term funding and issuance plan.
The Liquidity Risk Management Framework defines the organization of the liquidity managing functions in alignment with the three lines of defence structure, which is described in the “Risk Management Policy”. The Corporate Divisions and Treasury comprise the first line of defence, responsible for executing the steps needed to most effectively manage the liquidity of the Group and steer business activities. CRO comprises the second line of defence, responsible for defining the liquidity risk management framework, providing independent risk oversight, challenge, and validation of activities conducted by the first line of defence, including establishing the risk appetite. Group Audit comprises the third line of defence, responsible for overseeing the activities of both the first line of defence and second line of defence.
Scope and nature of liquidity risk measurement and reporting system
Article 435 (1)(c) CRR (EU OVA & EU LIQA)
Finance teams - Liquidity & Treasury Reporting & Analysis (LTRA) and Global Reporting, together own the overall accountability for the accurate and timely production of both external regulatory liquidity reporting (Pillar 1) as well as internal management reporting (Pillar 2) for the liquidity risk of the Group. In addition, Liquidity & Treasury Reporting & Analysis is responsible for the development of management information systems and the related analysis to support the liquidity risk framework and its governance for Treasury and Liquidity Risk Management.
Policies for hedging and mitigating liquidity risk
Article 435 (1)(d) CRR (EU OVA & EU LIQA)
The Group’s liquidity risk management principles are documented in the “Group Liquidity Risk Management Policy” and the framework is described in the “Global Liquidity Risk Framework” and “Global Funding Risk Framework” documents. All additional procedures and supporting documents (both global and local) issued by the liquidity risk management functions further define the requirements specific to liquidity risk practices. All of these procedures are subordinate to the “Group Liquidity Risk Management Policy” and are subject to the standards it sets forth.
Approach to centralized group liquidity management and individual legal entity liquidity management
The Bank ensures at the level of each liquidity relevant entity that all local liquidity metrics are managed in compliance with the defined risk appetite. Local liquidity surpluses are pooled in DB AG Frankfurt Branch and local liquidity shortfalls can be met through support from DB AG Frankfurt Branch. Transfers of liquidity capacity between entities are subject to the approval framework outlined in the “Intercompany Funding Policy” involving the Group’s liquidity steering function as well as the local liquidity managers.
242
|
Deutsche Bank |
||
|
Pillar 3 Report as of December 31, 2024 |
||
The bank's contingency funding plans
Deutsche Bank’s Group Contingency Funding Plan (CFP) outlines how the bank would respond to an actual or anticipated liquidity stress event. It includes a decisive set of actions that can be taken to raise cash and recover the bank’s key liquidity metrics in times of liquidity stress. The CFP includes a clear governance structure and well-defined liquidity risk indicators to ensure timely and effective decision-making, communication, and coordination during a liquidity stress event. Deutsche Bank has established the Financial Resource Management Council (FRMC) which is responsible for oversight of capital and liquidity across contingency, recovery, and resolution scenarios in a crisis situation.
Liquidity stress testing and scenario analysis
Global internal liquidity stress testing and scenario analysis is used for measuring liquidity risk and evaluating the Group’s short-term liquidity position within the liquidity framework. This complements the daily operational cash management process. The long-term liquidity strategy based on contractual and behavioral modelled cash flow information is represented by a long-term metric known as the Funding Matrix (refer to Funding Risk Management below).
The global liquidity stress testing process is managed by Treasury in accordance with the Management Board approved risk appetite. Treasury is responsible for the design of the overall methodology, the choice of liquidity risk drivers and the determination of appropriate assumptions (parameters) to translate input data into stress testing output. Liquidity Risk Management (LRM) is responsible for the definition of the stress scenarios. Under the principles laid out by Model Risk Management, LRM performs the independent validation of liquidity risk models and non-model estimates. LTRA is responsible for implementing these methodologies and performing the stress test calculation in conjunction with Treasury, LRM and IT.
Stress testing and scenario analysis are used to evaluate the impact of sudden and severe stress events on the Group’s liquidity position. Deutsche Bank has selected four scenarios to calculate the Group’s stressed Net Liquidity Position (“sNLP”). These scenarios are designed to capture potential outcomes which may be experienced by Deutsche Bank during periods of idiosyncratic and/or market-wide stress and are designed to be both plausible and sufficiently severe as to materially impact the Group’s liquidity position. The most severe scenario assesses the potential consequences of a combined market-wide and idiosyncratic stress event, including downgrades of Deutsche Bank’s credit rating. Under each of the scenarios the impact of a liquidity stress event over different time horizons and across multiple liquidity risk drivers, covering all business lines, product areas and balance sheet is considered. The output from scenario analysis feeds the Group Wide Stress Test, which considers the impact of scenarios on all risk stripes.
In addition, potential funding requirements from contingent liquidity risks which might arise under stress, including drawdowns on credit facilities, increased collateral requirements under derivative agreements, and outflows from deposits with a contractual rating linked trigger are included in the analysis. Subsequently Countermeasures, which are the actions the Group would take to counterbalance the outflows incurred during a stress event, are taken into consideration. Those countermeasures include utilizing the Bank’s Liquidity Reserve and generating liquidity from other unencumbered, marketable assets without causing any material impact on the bank’s business model.
Stress testing is conducted at a global level and for defined Key Liquidity Entities covering an eight-week stress horizon which is considered the most critical time span during a liquidity crisis and, where, on a Group level, liquidity is actively steered and assessed. In addition to the consolidated currency stress test, stress tests for material currencies (EUR and USD) are performed. Ad-hoc analysis may be conducted to reflect the impact of potential downside events that could affect the Bank such as the COVID-19 pandemic. Relevant stress assumptions are applied to reflect liquidity flows from risk drivers and on-balance sheet and off-balance sheet products. The suite of stress testing scenarios and assumptions are reviewed on a regular basis and are updated when enhancements are made to stress testing methodologies.
Complementing daily liquidity stress testing, the Bank also conducts regular Group Wide Stress Testing (GWST) run by Enterprise Risk Management (ERM) analyzing liquidity risks in conjunction with the other defined risk types and evaluating their impact and interplay to both capital and liquidity positions.
Qualitative information on LCR
Article 451a CRR (EU LIQB)
The Liquidity Coverage Ratio (LCR)
The LCR is intended to promote the short-term resilience of a bank’s liquidity risk profile over a 30 day stress scenario. The ratio is defined as the amount of High Quality Liquid Assets (“HQLA”) that could be used to raise liquidity, measured against the total volume of net cash outflows, arising from both contractual and modelled exposures, in a stressed scenario.
243
|
Deutsche Bank |
||
|
Pillar 3 Report as of December 31, 2024 |
||
The Group’s average Liquidity Coverage Ratio of 134% (twelve months average) as of December 31, 2024 has been calculated in accordance with the Commission Delegated Regulation (EU) 2015/61 and the EBA Guidelines on LCR disclosure to complement the disclosure of liquidity risk management under Article 435 CRR.
The Group’s Liquidity Coverage Ratio was 131% as of December 31, 2024, or € 53 billion of excess over the regulatory minimum of 100%. This compares with September 30, 2024 LCR of 135% or € 60 billion of excess over the regulatory minimum. The ratio decrease is largely due to asset growth across businesses as well as additional modelled outflows related to commitments and guarantees.
Concentration of funding and liquidity sources
Diversification of the Group’s funding profile in terms of investor types, regions and products is an important element of the Group’s liquidity risk management framework. The Group’s most stable funding sources stem from capital markets issuances and equity, as well as from Private Bank and Corporate Bank deposits. Other customer deposits and secured funding and short positions are additional sources of funding. Unsecured wholesale funding represents unsecured wholesale liabilities sourced primarily by the Treasury Pool Management team. Given the relatively short-term nature of these liabilities, it is predominantly used to fund liquid trading assets.
To promote the additional diversification of the Group’s refinancing activities, the bank holds a license to issue mortgage Pfandbriefe. The Group continues to run a program for the purpose of issuing Covered Bonds under Spanish law (Cedulas). Additionally, the Group also issues green bonds under the Group’s Sustainable Finance Framework. The Group also issued a Panda bond, following recent regulatory changes by PBoC (People’s Bank of China) and SAFE (State Administration of Foreign Exchange (of China)) to facilitate foreign remittance of Panda bond proceeds.
Unsecured wholesale funding comprises a range of institutional products, such as certificate of deposits, commercial paper as well as Money Market deposits.
To avoid any unwanted reliance on these short-term funding sources, and to promote a sound funding profile which complies with the defined risk appetite, the Group has implemented limits (across tenors) on these funding sources which are derived from daily stress testing analysis. In addition, the bank limits the total volume of unsecured wholesale funding to manage the reliance on this funding source as part of the overall funding diversification.
Composition of HQLA
The average HQLA of € 224 billion has been calculated in accordance with the Commission Delegated Regulation (EU) 2015/61 and the EBA Guidelines on LCR disclosure to complement the disclosure of liquidity risk management under Article 435 CRR.
The HQLA as of December, 2024 of € 226 billion is primarily held in Level 1 cash and central bank reserves (53%) and Level 1 high quality securities (41%). This compares to September 30, 2024 of which € 230 billion was primarily held in Level 1 cash and central bank reserves (52%) and Level 1 high quality securities (43%)
Derivative exposures and potential collateral calls
The majority of outflows related to derivative exposures and other collateral requirements shown in item 11 below are in relation to derivative contractual cash outflows that are offset by derivative cash inflows shown below in item 19 Other cash inflows.
Other significant outflows included in item 11 relate to the impact of an adverse market scenario on derivatives based on the 24 month historical look back approach and the potential posting of additional collateral as a result of a 3 notch downgrade of Deutsche Bank’s credit rating (as per regulatory requirements).
Currency mismatch in the LCR
The LCR is calculated for EUR and USD which have been identified as significant currencies (having liabilities > 5% of total group liabilities excluding regulatory capital and off-balance sheet liabilities) in accordance with the Commission Delegated Regulation (EU) 2015/61. In addition to the above the Group also calculates an LCR for the GBP currency. No explicit LCR risk appetite is set for the significant currencies. However, limits have been defined over the respective significant currency stressed Net Liquidity Position (sNLP). This allows the internal monitoring and management of risks stemming from currency mismatches that may arise from liquidity inflows and outflows over the short-term horizon.
244
|
Deutsche Bank |
||
|
Pillar 3 Report as of December 31, 2024 |
||
Other items in the LCR calculation that are not captured in the LCR disclosure template but that the institution considers relevant for its liquidity profile
The Pillar 3 disclosure obligations require Banks to disclose twelve months rolling averages each quarter. The Group does not consider anything else relevant for disclosure.
Quantitative information on LCR
Article 451a CRR
EU LIQ1 – LCR disclosure template
|
|
in € bn. |
Total unweighted value (average) |
Total weighted value (average) |
|||||||||||||||
|
Quarter ending on |
Dec 31, 2024 |
Sep 30, 2024 |
Jun 30, 2024 |
Mar 31, 2024 |
Dec 31, 2024 |
Sep 30, 2024 |
Jun 30, 2024 |
Mar 31, 2024 |
||||||||||
|
Number of data points used in the calculation of averages |
12 |
12 |
12 |
12 |
12 |
12 |
12 |
12 |
||||||||||
|
High-quality liquid assets |
||||||||||||||||||
|
1 |
Total high-quality liquid assets (HQLA) |
– |
– |
– |
– |
224 |
221 |
218 |
216 |
|||||||||
|
Cash-outflows |
||||||||||||||||||
|
2 |
Retail deposits and deposits from small business costumers |
278 |
275 |
274 |
273 |
14 |
14 |
14 |
14 |
|||||||||
|
of which: |
||||||||||||||||||
|
3 |
Stable deposits |
125 |
125 |
126 |
128 |
6 |
6 |
6 |
6 |
|||||||||
|
4 |
Less stable deposits |
61 |
59 |
59 |
59 |
8 |
8 |
8 |
8 |
|||||||||
|
5 |
Unsecured wholesale funding |
249 |
243 |
238 |
233 |
108 |
106 |
104 |
102 |
|||||||||
|
of which: |
||||||||||||||||||
|
6 |
Operational deposits (all counterparties) and deposits in network of cooperative banks |
74 |
71 |
71 |
72 |
18 |
18 |
18 |
18 |
|||||||||
|
7 |
Non-operational deposits (all counterparties) |
173 |
169 |
165 |
159 |
87 |
86 |
85 |
82 |
|||||||||
|
8 |
Unsecured debt |
2 |
2 |
2 |
2 |
2 |
2 |
2 |
2 |
|||||||||
|
9 |
Secured wholesale funding |
– |
– |
– |
– |
13 |
11 |
10 |
10 |
|||||||||
|
10 |
Additional requirements |
239 |
237 |
235 |
231 |
79 |
78 |
78 |
78 |
|||||||||
|
of which: |
||||||||||||||||||
|
11 |
Outflows related to derivative exposures and other collateral requirements |
27 |
28 |
28 |
28 |
23 |
24 |
24 |
25 |
|||||||||
|
12 |
Outflows related to loss of funding on debt products |
0 |
0 |
0 |
0 |
0 |
0 |
0 |
0 |
|||||||||
|
13 |
Credit and liquidity facilities |
212 |
209 |
208 |
203 |
56 |
54 |
54 |
53 |
|||||||||
|
14 |
Other contractual funding obligations |
54 |
54 |
55 |
58 |
7 |
8 |
8 |
8 |
|||||||||
|
15 |
Other contingent funding obligations |
297 |
286 |
278 |
271 |
3 |
3 |
3 |
3 |
|||||||||
|
16 |
Total cash outflows |
– |
– |
– |
– |
224 |
219 |
217 |
215 |
|||||||||
|
Cash - inflows |
||||||||||||||||||
|
17 |
Secured lending (e.g. reverse repos) |
279 |
261 |
255 |
268 |
12 |
10 |
10 |
10 |
|||||||||
|
18 |
Inflows from fully performing exposures |
48 |
48 |
49 |
49 |
37 |
37 |
37 |
37 |
|||||||||
|
19 |
Other cash inflows |
11 |
11 |
12 |
13 |
11 |
11 |
12 |
13 |
|||||||||
|
EU 19a |
Difference between total weighted inflows and total weighted outflows arising from transactions in third countries where there are transfer restrictions or which are denominated in non-convertible currencies |
– |
– |
– |
– |
2 |
2 |
3 |
3 |
|||||||||
|
EU 19b |
Excess inflows from a related specialized credit institution |
– |
– |
– |
– |
0 |
0 |
0 |
0 |
|||||||||
|
20 |
Total cash inflows |
338 |
320 |
315 |
331 |
57 |
56 |
57 |
57 |
|||||||||
|
of which: |
||||||||||||||||||
|
EU 20a |
Fully exempt inflows |
0 |
0 |
0 |
0 |
0 |
0 |
0 |
0 |
|||||||||
|
EU 20b |
Inflows subject to 90 % cap |
0 |
0 |
0 |
0 |
0 |
0 |
0 |
0 |
|||||||||
|
EU 20c |
Inflows subject to 75 % cap |
318 |
300 |
295 |
312 |
56 |
55 |
56 |
56 |
|||||||||
|
Total adjusted value |
||||||||||||||||||
|
21 |
Liquidity buffer |
– |
– |
– |
– |
224 |
221 |
218 |
216 |
|||||||||
|
22 |
Total net cash outflows |
– |
– |
– |
– |
167 |
163 |
161 |
158 |
|||||||||
|
23 |
Liquidity coverage ratio (%) |
– |
– |
– |
– |
134 |
135 |
136 |
136 |
|||||||||
245
|
Deutsche Bank |
||
|
Pillar 3 Report as of December 31, 2024 |
||
Net Stable Funding Ratio
The NSFR requires banks to maintain a stable funding profile in relation to its on- and off-balance sheet activities. The ratio is defined as the amount of available stable funding (the portion of capital and liabilities expected to be a stable source of funding), relative to the amount of required stable funding (a function of the liquidity characteristics of various assets held).
Deutsche Bank’s Net Stable Funding (NSFR) reduced 1% to 121% for a surplus of € 110 billion in Q4 2024 vs Q3 2024 reported at 122% or a surplus of € 111 billion. The reduction in surplus was primarily due to increased business inventory picked up through Q4 driving an increase in Required Stable Funding (RSF) in excess of increased deposit driving the Available Stable Funding (ASF) increase.
EU LIQ2 – Net stable funding ratio template
|
|
Dec 31, 2024 |
||||||||||||
|
a |
b |
c |
d |
e |
|||||||||
|
Unweighted value by residual maturity |
Weighted value |
||||||||||||
|
in € b. |
No maturity |
< 6 months |
6 months to < 1 year |
≥ 1 year |
|||||||||
|
Available stable funding (ASF) Items |
|||||||||||||
|
1 |
Capital items and instruments |
77 |
0 |
0 |
9 |
85 |
|||||||
|
2 |
Own funds |
77 |
0 |
0 |
8 |
84 |
|||||||
|
3 |
Other capital instruments |
– |
0 |
0 |
1 |
1 |
|||||||
|
4 |
Retail deposits |
– |
246 |
35 |
4 |
266 |
|||||||
|
5 |
Stable deposits |
– |
164 |
28 |
3 |
185 |
|||||||
|
6 |
Less stable deposits |
– |
82 |
7 |
1 |
80 |
|||||||
|
7 |
Wholesale funding: |
– |
431 |
28 |
132 |
269 |
|||||||
|
8 |
Operational deposits |
– |
82 |
0 |
0 |
41 |
|||||||
|
9 |
Other wholesale funding |
– |
349 |
28 |
132 |
228 |
|||||||
|
10 |
Interdependent liabilities |
– |
0 |
0 |
0 |
0 |
|||||||
|
11 |
Other liabilities: |
13 |
112 |
2 |
4 |
5 |
|||||||
|
12 |
NSFR derivative liabilities |
13 |
– |
– |
– |
– |
|||||||
|
13 |
All other liabilities and capital instruments not included in the above categories |
– |
112 |
2 |
4 |
5 |
|||||||
|
14 |
Total available stable funding (ASF) |
– |
– |
– |
– |
625 |
|||||||
|
Required stable funding (RSF) Items |
|||||||||||||
|
15 |
Total high-quality liquid assets (HQLA) |
– |
– |
– |
– |
12 |
|||||||
|
EU 15a |
Assets encumbered for more than 12m in cover pool |
– |
0 |
0 |
21 |
18 |
|||||||
|
16 |
Deposits held at other financial institutions for operational purposes |
– |
0 |
0 |
0 |
0 |
|||||||
|
17 |
Performing loans and securities: |
– |
232 |
45 |
412 |
407 |
|||||||
|
18 |
Performing securities financing transactions with financial customers collateralized by Level 1 HQLA subject to 0% haircut |
– |
88 |
2 |
2 |
3 |
|||||||
|
19 |
Performing securities financing transaction with financial customers collateralized by other assets and loans and advances to financial institutions |
– |
50 |
15 |
66 |
76 |
|||||||
|
20 |
Performing loans to non-financial corporate clients, loans to retail and small business customers, and loans to sovereigns, and PSEs, |
– |
48 |
19 |
144 |
158 |
|||||||
|
of which: |
|||||||||||||
|
21 |
With a risk weight of less than or equal to 35% under the Basel II Standardized Approach for credit risk |
– |
5 |
1 |
5 |
6 |
|||||||
|
22 |
Performing residential mortgages, |
– |
2 |
1 |
114 |
82 |
|||||||
|
of which: |
|||||||||||||
|
23 |
With a risk weight of less than or equal to 35% under the Basel II Standardized Approach for credit risk |
– |
1 |
1 |
85 |
57 |
|||||||
|
24 |
Other loans and securities that are not default and do not qualify as HQLA, including exchange-traded equities and trade finance on-balance sheet products |
– |
43 |
8 |
87 |
88 |
|||||||
|
25 |
Interdependent assets |
– |
0 |
0 |
0 |
0 |
|||||||
|
26 |
Other assets: |
0 |
122 |
1 |
27 |
60 |
|||||||
|
27 |
Physical traded commodities |
– |
– |
– |
3 |
2 |
|||||||
|
28 |
Assets posted as initial margin for derivative contracts and contributions to default funds of CCPs |
– |
7 |
6 |
|||||||||
|
29 |
NSFR derivative assets |
– |
5 |
5 |
|||||||||
|
30 |
NSFR derivative liabilities before deduction of variation margin posted |
– |
48 |
2 |
|||||||||
|
31 |
All other assets not included in the above categories |
– |
62 |
1 |
24 |
44 |
|||||||
|
32 |
Off-balance sheet items |
103 |
25 |
159 |
18 |
||||||||
|
33 |
Total required stable funding (RSF) |
– |
– |
– |
– |
515 |
|||||||
|
34 |
Net Stable Funding Ratio (in percent) |
– |
– |
– |
– |
121 |
|||||||
246
|
Deutsche Bank |
||
|
Pillar 3 Report as of December 31, 2024 |
||
|
|
Sep 30, 2024 |
||||||||||||
|
a |
b |
c |
d |
e |
|||||||||
|
Unweighted value by residual maturity |
Weighted value |
||||||||||||
|
in € b. |
No maturity |
< 6 months |
6 months to < 1 year |
≥ 1 year |
|||||||||
|
Available stable funding (ASF) Items |
|||||||||||||
|
1 |
Capital items and instruments |
74 |
0 |
0 |
8 |
82 |
|||||||
|
2 |
Own funds |
74 |
0 |
0 |
7 |
81 |
|||||||
|
3 |
Other capital instruments |
– |
0 |
0 |
1 |
1 |
|||||||
|
4 |
Retail deposits |
– |
240 |
32 |
4 |
259 |
|||||||
|
5 |
Stable deposits |
– |
163 |
26 |
3 |
183 |
|||||||
|
6 |
Less stable deposits |
– |
77 |
6 |
1 |
76 |
|||||||
|
7 |
Wholesale funding: |
– |
427 |
35 |
129 |
268 |
|||||||
|
8 |
Operational deposits |
– |
72 |
0 |
0 |
36 |
|||||||
|
9 |
Other wholesale funding |
– |
355 |
35 |
129 |
231 |
|||||||
|
10 |
Interdependent liabilities |
– |
0 |
0 |
0 |
0 |
|||||||
|
11 |
Other liabilities: |
5 |
167 |
3 |
3 |
4 |
|||||||
|
12 |
NSFR derivative liabilities |
5 |
– |
– |
– |
– |
|||||||
|
13 |
All other liabilities and capital instruments not included in the above categories |
– |
167 |
3 |
3 |
4 |
|||||||
|
14 |
Total available stable funding (ASF) |
– |
– |
– |
– |
613 |
|||||||
|
Required stable funding (RSF) Items |
|||||||||||||
|
15 |
Total high-quality liquid assets (HQLA) |
– |
– |
– |
– |
11 |
|||||||
|
EU 15a |
Assets encumbered for more than 12m in cover pool |
– |
0 |
0 |
21 |
18 |
|||||||
|
16 |
Deposits held at other financial institutions for operational purposes |
– |
0 |
0 |
0 |
0 |
|||||||
|
17 |
Performing loans and securities: |
– |
227 |
44 |
403 |
394 |
|||||||
|
18 |
Performing securities financing transactions with financial customers collateralized by Level 1 HQLA subject to 0% haircut |
– |
95 |
2 |
1 |
2 |
|||||||
|
19 |
Performing securities financing transaction with financial customers collateralized by other assets and loans and advances to financial institutions |
– |
46 |
12 |
60 |
69 |
|||||||
|
20 |
Performing loans to non-financial corporate clients, loans to retail and small business customers, and loans to sovereigns, and PSEs, |
– |
47 |
23 |
138 |
154 |
|||||||
|
of which: |
|||||||||||||
|
21 |
With a risk weight of less than or equal to 35% under the Basel II Standardized Approach for credit risk |
– |
5 |
1 |
5 |
6 |
|||||||
|
22 |
Performing residential mortgages, |
– |
2 |
1 |
124 |
90 |
|||||||
|
of which: |
|||||||||||||
|
23 |
With a risk weight of less than or equal to 35% under the Basel II Standardized Approach for credit risk |
– |
1 |
1 |
92 |
62 |
|||||||
|
24 |
Other loans and securities that are not default and do not qualify as HQLA, including exchange-traded equities and trade finance on-balance sheet products |
– |
37 |
7 |
80 |
79 |
|||||||
|
25 |
Interdependent assets |
– |
0 |
0 |
0 |
0 |
|||||||
|
26 |
Other assets: |
0 |
163 |
1 |
25 |
61 |
|||||||
|
27 |
Physical traded commodities |
– |
– |
– |
1 |
1 |
|||||||
|
28 |
Assets posted as initial margin for derivative contracts and contributions to default funds of CCPs |
– |
6 |
5 |
|||||||||
|
29 |
NSFR derivative assets |
– |
10 |
10 |
|||||||||
|
30 |
NSFR derivative liabilities before deduction of variation margin posted |
– |
37 |
2 |
|||||||||
|
31 |
All other assets not included in the above categories |
– |
111 |
1 |
24 |
44 |
|||||||
|
32 |
Off-balance sheet items |
93 |
27 |
149 |
17 |
||||||||
|
33 |
Total required stable funding (RSF) |
– |
– |
– |
– |
502 |
|||||||
|
34 |
Net Stable Funding Ratio (in percent) |
– |
– |
– |
– |
122 |
|||||||
247
|
Deutsche Bank |
||
|
Pillar 3 Report as of December 31, 2024 |
||
|
|
Jun 30, 2024 |
||||||||||||
|
a |
b |
c |
d |
e |
|||||||||
|
Unweighted value by residual maturity |
Weighted value |
||||||||||||
|
in € b. |
No maturity |
< 6 months |
6 months to < 1 year |
≥ 1 year |
|||||||||
|
Available stable funding (ASF) Items |
|||||||||||||
|
1 |
Capital items and instruments |
74 |
0 |
0 |
9 |
83 |
|||||||
|
2 |
Own funds |
74 |
0 |
0 |
8 |
82 |
|||||||
|
3 |
Other capital instruments |
– |
0 |
0 |
1 |
1 |
|||||||
|
4 |
Retail deposits |
– |
241 |
33 |
3 |
259 |
|||||||
|
5 |
Stable deposits |
– |
165 |
26 |
3 |
185 |
|||||||
|
6 |
Less stable deposits |
– |
76 |
6 |
1 |
74 |
|||||||
|
7 |
Wholesale funding: |
– |
411 |
38 |
129 |
264 |
|||||||
|
8 |
Operational deposits |
– |
70 |
0 |
0 |
35 |
|||||||
|
9 |
Other wholesale funding |
– |
341 |
38 |
129 |
229 |
|||||||
|
10 |
Interdependent liabilities |
– |
0 |
0 |
0 |
0 |
|||||||
|
11 |
Other liabilities: |
0 |
157 |
3 |
4 |
5 |
|||||||
|
12 |
NSFR derivative liabilities |
0 |
– |
– |
– |
– |
|||||||
|
13 |
All other liabilities and capital instruments not included in the above categories |
– |
157 |
3 |
4 |
5 |
|||||||
|
14 |
Total available stable funding (ASF) |
– |
– |
– |
– |
612 |
|||||||
|
Required stable funding (RSF) Items |
|||||||||||||
|
15 |
Total high-quality liquid assets (HQLA) |
– |
– |
– |
– |
11 |
|||||||
|
EU 15a |
Assets encumbered for more than 12m in cover pool |
– |
0 |
0 |
22 |
19 |
|||||||
|
16 |
Deposits held at other financial institutions for operational purposes |
– |
0 |
0 |
0 |
0 |
|||||||
|
17 |
Performing loans and securities: |
– |
199 |
41 |
410 |
397 |
|||||||
|
18 |
Performing securities financing transactions with financial customers collateralized by Level 1 HQLA subject to 0% haircut |
– |
74 |
3 |
2 |
4 |
|||||||
|
19 |
Performing securities financing transaction with financial customers collateralized by other assets and loans and advances to financial institutions |
– |
41 |
12 |
60 |
69 |
|||||||
|
20 |
Performing loans to non-financial corporate clients, loans to retail and small business customers, and loans to sovereigns, and PSEs, |
– |
48 |
19 |
142 |
156 |
|||||||
|
of which: |
|||||||||||||
|
21 |
With a risk weight of less than or equal to 35% under the Basel II Standardized Approach for credit risk |
– |
3 |
0 |
7 |
7 |
|||||||
|
22 |
Performing residential mortgages, |
– |
3 |
1 |
123 |
89 |
|||||||
|
of which: |
|||||||||||||
|
23 |
With a risk weight of less than or equal to 35% under the Basel II Standardized Approach for credit risk |
– |
1 |
1 |
91 |
60 |
|||||||
|
24 |
Other loans and securities that are not default and do not qualify as HQLA, including exchange-traded equities and trade finance on-balance sheet products |
– |
34 |
7 |
83 |
79 |
|||||||
|
25 |
Interdependent assets |
– |
0 |
0 |
0 |
0 |
|||||||
|
26 |
Other assets: |
0 |
174 |
1 |
24 |
58 |
|||||||
|
27 |
Physical traded commodities |
– |
– |
– |
1 |
1 |
|||||||
|
28 |
Assets posted as initial margin for derivative contracts and contributions to default funds of CCPs |
– |
6 |
5 |
|||||||||
|
29 |
NSFR derivative assets |
– |
7 |
7 |
|||||||||
|
30 |
NSFR derivative liabilities before deduction of variation margin posted |
– |
41 |
2 |
|||||||||
|
31 |
All other assets not included in the above categories |
– |
119 |
1 |
23 |
43 |
|||||||
|
32 |
Off-balance sheet items |
91 |
25 |
157 |
17 |
||||||||
|
33 |
Total required stable funding (RSF) |
– |
– |
– |
– |
502 |
|||||||
|
34 |
Net Stable Funding Ratio (in percent) |
– |
– |
– |
– |
122 |
|||||||
248
|
Deutsche Bank |
||
|
Pillar 3 Report as of December 31, 2024 |
||
|
|
Mar 31, 2024 |
||||||||||||
|
a |
b |
c |
d |
e |
|||||||||
|
Unweighted value by residual maturity |
Weighted value |
||||||||||||
|
in € b. |
No maturity |
< 6 months |
6 months to < 1 year |
1 year |
|||||||||
|
Available stable funding (ASF) Items |
|||||||||||||
|
1 |
Capital items and instruments |
73 |
0 |
0 |
11 |
84 |
|||||||
|
2 |
Own funds |
73 |
0 |
0 |
9 |
82 |
|||||||
|
3 |
Other capital instruments |
– |
0 |
0 |
2 |
2 |
|||||||
|
4 |
Retail deposits |
– |
236 |
35 |
4 |
257 |
|||||||
|
5 |
Stable deposits |
– |
162 |
29 |
3 |
185 |
|||||||
|
6 |
Less stable deposits |
– |
74 |
6 |
1 |
72 |
|||||||
|
7 |
Wholesale funding: |
– |
402 |
34 |
127 |
259 |
|||||||
|
8 |
Operational deposits |
– |
72 |
0 |
0 |
36 |
|||||||
|
9 |
Other wholesale funding |
– |
330 |
34 |
127 |
223 |
|||||||
|
10 |
Interdependent liabilities |
– |
0 |
0 |
0 |
0 |
|||||||
|
11 |
Other liabilities: |
0 |
161 |
2 |
5 |
6 |
|||||||
|
12 |
NSFR derivative liabilities |
0 |
– |
– |
– |
– |
|||||||
|
13 |
All other liabilities and capital instruments not included in the above categories |
– |
161 |
2 |
5 |
6 |
|||||||
|
14 |
Total available stable funding (ASF) |
– |
– |
– |
– |
606 |
|||||||
|
Required stable funding (RSF) Items |
|||||||||||||
|
15 |
Total high-quality liquid assets (HQLA) |
– |
– |
– |
– |
10 |
|||||||
|
EU 15a |
Assets encumbered for more than 12m in cover pool |
– |
0 |
0 |
23 |
19 |
|||||||
|
16 |
Deposits held at other financial institutions for operational purposes |
– |
0 |
0 |
0 |
0 |
|||||||
|
17 |
Performing loans and securities: |
– |
200 |
38 |
399 |
388 |
|||||||
|
18 |
Performing securities financing transactions with financial customers collateralized by Level 1 HQLA subject to 0% haircut |
– |
70 |
3 |
1 |
3 |
|||||||
|
19 |
Performing securities financing transaction with financial customers collateralized by other assets and loans and advances to financial institutions |
– |
39 |
12 |
56 |
65 |
|||||||
|
20 |
Performing loans to non-financial corporate clients, loans to retail and small business customers, and loans to sovereigns, and PSEs, |
– |
54 |
16 |
134 |
152 |
|||||||
|
of which: |
|||||||||||||
|
21 |
With a risk weight of less than or equal to 35% under the Basel II Standardized Approach for credit risk |
– |
3 |
0 |
9 |
9 |
|||||||
|
22 |
Performing residential mortgages, |
– |
1 |
1 |
127 |
90 |
|||||||
|
of which: |
|||||||||||||
|
23 |
With a risk weight of less than or equal to 35% under the Basel II Standardized Approach for credit risk |
– |
1 |
0 |
93 |
61 |
|||||||
|
24 |
Other loans and securities that are not default and do not qualify as HQLA, including exchange-traded equities and trade finance on-balance sheet products |
– |
35 |
7 |
81 |
78 |
|||||||
|
25 |
Interdependent assets |
– |
0 |
0 |
0 |
0 |
|||||||
|
26 |
Other assets: |
0 |
173 |
1 |
26 |
60 |
|||||||
|
27 |
Physical traded commodities |
– |
– |
– |
0 |
0 |
|||||||
|
28 |
Assets posted as initial margin for derivative contracts and contributions to default funds of CCPs |
– |
6 |
5 |
|||||||||
|
29 |
NSFR derivative assets |
– |
7 |
7 |
|||||||||
|
30 |
NSFR derivative liabilities before deduction of variation margin posted |
– |
41 |
2 |
|||||||||
|
31 |
All other assets not included in the above categories |
– |
119 |
1 |
26 |
46 |
|||||||
|
32 |
Off-balance sheet items |
98 |
25 |
150 |
17 |
||||||||
|
33 |
Total required stable funding (RSF) |
– |
– |
– |
– |
495 |
|||||||
|
34 |
Net Stable Funding Ratio (in percent) |
– |
– |
– |
– |
123 |
|||||||
Unencumbered assets
Qualitative information on unencumbered assets
Article 443 CRR and EU AE4
In accordance to the EBA ITS 2020/04 guideline the data on encumbered and unencumbered assets uses the median of the last four quarterly data points. Therefore, the sum of sub-components does not necessarily add up in the quantitative information disclosed below.
Encumbered assets primarily comprise those on- and off-balance sheet assets that are pledged as collateral against secured funding, collateral swaps, and other collateralized obligations. Additionally, in line with the EBA technical standards on regulatory asset encumbrance reporting, we consider default funds and initial margins as encumbered, as well as other assets pledged which cannot be freely withdrawn such as mandatory minimum reserves at central banks. We also include derivative margin receivable assets as encumbered under these EBA guidelines.
249
|
Deutsche Bank |
||
|
Pillar 3 Report as of December 31, 2024 |
||
Quantitative information on unencumbered assets
Article 443 CRR
The below tables set out a breakdown of on- and off-balance sheet items, broken down between encumbered and unencumbered. Any securities borrowed or purchased under resale agreements are shown based on the fair value of collateral received. Following the European Commission’s disclosure guidance for asset encumbrance we have introduced the asset quality indicator concept “high-quality liquid assets” (HQLA) as defined under the Delegated Act on Liquidity Coverage Ratio.
For December 2024, € 185 billion of the Group's on-balance sheet assets were encumbered. These assets primarily relate to firm financing of trading inventory and other securities, funding (i.e. Pfandbriefe and covered bonds) secured against loan collateral and cash collateral for derivative margin requirements.
For December 2024, the Group had received securities as collateral with a fair value of € 334 billion, of which € 232 billion were sold or on pledged. These pledges typically relate to trades to facilitate client activity, including prime brokerage, collateral posted in respect of Exchange Traded Funds and derivative margin requirements.
‘Own debt securities issued other than covered bonds and asset backed securities’ refers to those own bond holdings that are not derecognized from the balance sheet by a non-IFRS institution. This is not applicable for Deutsche Bank Group.
EU AE1 – Encumbered and unencumbered assets
|
|
Dec, 31 2024 |
|||||||||||||||||
|
010 |
030 |
040 |
050 |
060 |
080 |
090 |
100 |
|||||||||||
|
Encumbered assets |
Unencumbered assets |
|||||||||||||||||
|
Carrying amount |
Fair value |
Carrying amount |
Fair value |
|||||||||||||||
|
in € bn. |
of which |
of which |
of which |
of which |
||||||||||||||
|
030 |
Equity instruments |
0.2 |
0.0 |
– |
– |
3.6 |
0.9 |
– |
– |
|||||||||
|
040 |
Debt securities |
83.3 |
61.1 |
83.3 |
61.1 |
97.2 |
62.7 |
97.2 |
62.7 |
|||||||||
|
of which: |
||||||||||||||||||
|
050 |
Covered bonds |
0.6 |
0.5 |
0.6 |
0.5 |
1.5 |
1.4 |
1.5 |
1.4 |
|||||||||
|
060 |
Securitisations |
4.0 |
0.6 |
4.0 |
0.6 |
3.8 |
0.3 |
3.8 |
0.3 |
|||||||||
|
070 |
Issued by general governments |
69.6 |
57.7 |
69.6 |
57.7 |
63.5 |
60.0 |
63.5 |
60.0 |
|||||||||
|
080 |
Issued by financial corporations |
9.5 |
1.9 |
9.5 |
1.9 |
19.0 |
2.6 |
19.0 |
2.6 |
|||||||||
|
090 |
Issued by non-financial corporations |
4.8 |
1.7 |
4.8 |
1.7 |
11.1 |
0.8 |
11.1 |
0.8 |
|||||||||
|
120 |
Other assets |
100.2 |
12.9 |
– |
– |
1,118.5 |
128.3 |
– |
– |
|||||||||
|
010 |
Total |
185.2 |
73.3 |
– |
– |
1,178.1 |
191.1 |
– |
– |
|||||||||
|
|
Dec, 31 2023 |
|||||||||||||||||
|
010 |
030 |
040 |
050 |
060 |
080 |
090 |
100 |
|||||||||||
|
Encumbered assets |
Unencumbered assets |
|||||||||||||||||
|
Carrying amount |
Fair value |
Carrying amount |
Fair value |
|||||||||||||||
|
in € bn. |
of which |
of which |
of which |
of which |
||||||||||||||
|
030 |
Equity instruments |
0.2 |
0 |
– |
– |
2.8 |
0.9 |
– |
– |
|||||||||
|
040 |
Debt securities |
76.9 |
60.9 |
76.9 |
60.9 |
76.1 |
47.5 |
76.1 |
47.5 |
|||||||||
|
of which: |
||||||||||||||||||
|
050 |
Covered bonds |
0.4 |
0.4 |
0.4 |
0.4 |
1.2 |
1.2 |
1.2 |
1.2 |
|||||||||
|
060 |
Asset-backed securities |
3.4 |
0.3 |
3.4 |
0.3 |
3.3 |
0.5 |
3.3 |
0.5 |
|||||||||
|
070 |
Issued by general governments |
64.4 |
57.4 |
64.4 |
57.4 |
49.4 |
44.2 |
49.4 |
44.2 |
|||||||||
|
080 |
Issued by financial corporations |
7.8 |
1.7 |
7.8 |
1.7 |
15.7 |
2.3 |
15.7 |
2.3 |
|||||||||
|
090 |
Issued by non-financial corporations |
4.3 |
1.8 |
4.3 |
1.8 |
10.7 |
0.6 |
10.7 |
0.6 |
|||||||||
|
120 |
Other assets |
121.3 |
13.2 |
– |
– |
1,032.2 |
148.5 |
– |
– |
|||||||||
|
010 |
Total |
196.9 |
74.3 |
– |
– |
1,115.1 |
194.7 |
– |
– |
|||||||||
250
|
Deutsche Bank |
||
|
Pillar 3 Report as of December 31, 2024 |
||
EU AE2 – Collateral received
|
|
Dec 31, 2024 |
|||||||||
|
010 |
030 |
040 |
060 |
|||||||
|
Unencumbered |
||||||||||
|
Fair value of encumbered |
Fair value of collateral received |
|||||||||
|
in € bn. |
of which |
of which |
||||||||
|
140 |
Loans on demand |
0 |
0 |
0 |
0 |
|||||
|
150 |
Equity instruments |
0.6 |
0.2 |
0.1 |
0.0 |
|||||
|
160 |
Debt securities |
330.5 |
295.1 |
98.9 |
62.5 |
|||||
|
of which: |
||||||||||
|
170 |
Covered bonds |
5.2 |
5.2 |
13.3 |
13.1 |
|||||
|
180 |
Asset-backed securities |
10.2 |
3.0 |
8.7 |
0.6 |
|||||
|
190 |
Issued by general governments |
292.9 |
281.2 |
62.0 |
48.9 |
|||||
|
200 |
Issued by financial corporations |
25.1 |
8.8 |
31.3 |
11.6 |
|||||
|
210 |
Issued by non-financial corporations |
11.8 |
3.2 |
5.6 |
0.7 |
|||||
|
220 |
Loans and advances other than loans on demand |
0 |
0 |
0.4 |
0 |
|||||
|
230 |
Other collateral received |
2.6 |
0 |
2.9 |
0 |
|||||
|
130 |
Total collateral received |
334.0 |
295.7 |
101.9 |
62.5 |
|||||
|
240 |
Own debt securities issued other than own covered bonds or asset-backed securities |
0 |
0 |
0 |
0 |
|||||
|
241 |
Own covered bonds and asset-backed securities issued and not yet pledged |
– |
– |
32.4 |
6.5 |
|||||
|
250 |
Total Assets, collateral received and own debt securities issued |
518.8 |
370.6 |
– |
– |
|||||
|
|
|
Dec 31, 2023 |
||||||||
|
010 |
030 |
040 |
060 |
|||||||
|
|
Unencumbered |
|||||||||
|
Fair value of encumbered |
Fair value of collateral received |
|||||||||
|
in € bn. |
of which |
of which |
||||||||
|
140 |
Loans on demand |
0 |
0 |
0 |
0 |
|||||
|
150 |
Equity instruments |
0.5 |
0.2 |
0.1 |
0.0 |
|||||
|
160 |
Debt securities |
303.2 |
275.7 |
50.8 |
32.3 |
|||||
|
of which: |
||||||||||
|
170 |
Covered bonds |
5.3 |
5.2 |
6.2 |
6.1 |
|||||
|
180 |
Asset-backed securities |
12.3 |
7.3 |
5.0 |
0.1 |
|||||
|
190 |
Issued by general governments |
263.8 |
255.9 |
33.4 |
26.9 |
|||||
|
200 |
Issued by financial corporations |
30.4 |
13.0 |
14.1 |
5.2 |
|||||
|
210 |
Issued by non-financial corporations |
8.8 |
2.7 |
2.6 |
0.4 |
|||||
|
220 |
Loans and advances other than loans on demand |
0 |
0 |
2.0 |
0 |
|||||
|
230 |
Other collateral received |
3.1 |
0 |
3.2 |
0 |
|||||
|
130 |
Total collateral received |
306.9 |
276.2 |
55.6 |
32.7 |
|||||
|
240 |
Own debt securities issued other than own covered bonds or asset-backed securities |
0 |
0 |
0 |
0 |
|||||
|
241 |
Own covered bonds and asset-backed securities issued and not yet pledged |
– |
– |
13.1 |
2.4 |
|||||
|
250 |
Total Assets, collateral received and own debt securities issued |
503.8 |
351.2 |
– |
– |
|||||
The below table shows selected amounts for encumbered on- and off-balance sheet assets against the corresponding liabilities that have given rise to the encumbrance. These include assets pledged for derivatives margin, collateral required for repurchase agreements, and assets needed, for example, for the Group’s covered bond issuance portfolio.
EU AE3 – Sources of encumbrance
|
|
Dec 31, 2024 |
Dec 31, 2023 |
||||||||
|
010 |
030 |
010 |
030 |
|||||||
|
in € bn. |
Matching liabilities, |
Assets, collateral received |
Matching liabilities, |
Assets, collateral received |
||||||
|
010 |
Carrying amount of selected financial liabilities |
406.2 |
424.3 |
398.7 |
416.4 |
|||||
251
|
Deutsche Bank |
||
|
Pillar 3 Report as of December 31, 2024 |
||
Reputational Risk
Within the bank’s risk management process, reputational risk is defined as the risk of possible damage to Deutsche Bank’s brand and reputation, and the associated risk to earnings, capital or liquidity arising from any association, action or inaction which could be perceived by stakeholders to be inappropriate, unethical or inconsistent with Deutsche Bank’s Code of Conduct.
Risk management objectives and policies
Reputational Risk Management strategies and processes
Article 435 (1)(a) CRR (EU OVA)
Deutsche Bank has limited appetite for transactions or relationships with material reputational risk or in areas which inherently pose a higher reputational risk such as the defence, gaming, or adult entertainment sectors, or where there are certain environmental concerns. Reputational risk cannot be precluded as it can be driven by unforeseeable changes in perception of its practices by its various stakeholders (e.g. public, clients, shareholders and regulators).
The Reputational Risk Framework (the Framework) is in place to manage the process through which active decisions are taken on matters which may pose a reputational risk, before the event, and in doing so to prevent damage to Deutsche Bank’s reputation wherever possible. The Framework provides consistent standards for the identification, assessment and management of reputational risk issues. Reputational impacts which may arise as a consequence of a failure from another risk type, control or process are addressed separately via the associated risk type framework and are therefore not addressed in this section. The reputational risk could arise from multiple sources including, but not limited to, potential issues with the profile of the counterparty, the business purpose / economic substance of the transaction or product, high risk industries, environmental and social considerations, and the nature of the transaction or product or its structure and terms.
The modelling and quantitative measurement of reputational risk internal capital is implicitly covered in the bank’s economic capital framework primarily within strategic risk.
Reputational Risk Management structure and organization
Article 435 (1)(b) CRR (EU OVA)
Whilst every employee has a responsibility to protect our reputation, the primary responsibility for the identification, assessment, management, monitoring and, if necessary, referring or reporting of reputational risk matters lies with Deutsche Bank’s Business Divisions as the primary risk owners. Each Business Division has an established process through which matters, which are deemed to be a moderate or greater reputational risk are assessed, the Unit Reputational Risk Assessment Process.
The Unit RRAP is required to refer any material reputational risk matters to the respective Regional Reputational Risk Committee. The Framework also sets out a number of matters which are considered inherently higher risk from a reputational risk perspective and are therefore mandatory referrals to the Regional Reputational Risk Committees. The Regional Reputational Risk Committees, which are 2nd LoD Committees and meet on an ad hoc basis as required. The Group Reputational Risk Committee (GRRC) reviews cases with a Group wide impact and in exceptional circumstances, those that could not be resolved at a regional level. The Head of NFRM is responsible for ensuring the oversight, governance and coordination of the management of reputational risk of Deutsche Bank.
The Framework is applicable to all business units and regions. Matters specific to DWS are reviewed by a DWS reputational risk committee and, if necessary, escalated to the DWS Executive Board, which can escalate matters to the management board of DB AG.
Scope and nature of reputational risk measurement and reporting systems
Article 435 (1)(c) CRR (EU OVA)
The Reputational Risk Team provides monthly updates on reputational risk topics to the secretaries of the Unit Reputational Risk Assessment Process and the Regional Reputational Risk Committees. A monthly report is provided to the Group Risk Committee covering material reputational risk discussions and breaches of the Reputational Risk Framework. The Risk and Capital Profile report includes updates on reputational risk, which is distributed on a monthly basis to the Management Board and Supervisory Board. This includes details such as the number of reputational risk issues assessed by the various committees and their decisions.
252
|
Deutsche Bank |
||
|
Pillar 3 Report as of December 31, 2024 |
||
Policies for hedging and mitigating reputational risk
Article 435 (1)(d) CRR (EU OVA)
The Reputational Risk Framework is governed by the Reputational Risk Policy and Framework. The Framework has a group wide scope and is globally applicable. Regional and divisional reputational risk procedures have been implemented where deemed appropriate. Specific guidance on reputational risk issues is provided in the Reputational Risk Guidance Statements. Subject Matter Expert input is required for specific reputational risk drivers such as defence, gaming, and environmental issues. Due to geopolitical developments in 2024 focus on the topic of defense continued.
Model risk
Risk management objectives and policies
Model Risk Management strategies and processes
Article 435 (1)(a) CRR (EU OVA)
Model risk is one of the bank’s level 1 risks, and is overseen by the Chief Risk Officer through the setting of a quantitative and qualitative risk appetite statement, and managed through:
– A Model Risk Management Policy and procedure, and supporting documents aligned to risk appetite, regulatory requirements, and industry best practice, with clear roles and responsibilities for stakeholders
– Inventorisation of all sources of model risk, supporting ongoing model risk framework components including risk assessments and attestations
– Key controls for all sources of model risk from development through to decommissioning, including validation, approval, deployment and monitoring:
– Independent Validations, and subsequent independent approvals, verify that models have been appropriately designed and implemented for their intended scope and purpose, and that respective controls are in place to assure that they continue to perform as expected during their use
– The controls identify limitations and weaknesses, resulting in findings and compensating controls, these may be conditions for use, such as adjustments or overlays
– Model risk governance, including senior forums for monitoring and escalation of model risk related topics, as well as monthly updates to the Management Board on the model risk appetite metrics, and periodic model risk updates to the Supervisory Board.
Model Risk Management structure and organization
Article 435 (1)(b) CRR (EU OVA)
Model risk is managed in accordance with the segregation of duties set out in the Risk Management Policy. Model risk is attached to those functions that generate and steer model risk directly such as Model Owners, Model Developers, Senior Model Users, including infrastructure functions.
The control function for model risk is Model Risk Management (MoRM) with its independent validation unit for model risk. The Head of MoRM is part of the Bank's Risk Division with reporting directly to the Chief Risk Officer. Group Audit is responsible for overseeing the activities of both the functions owning and using models and MoRM as the risk type control function.
MoRM fulfils all the responsibilities of a risk type control function, including:
– Defining and regularly updating the model risk framework by setting minimum risk management and/or control standards to support the bank’s compliance with all applicable material rules and regulations
– Independently assessing the implementation of, and adherence to, the framework of functions that generate and steer model risk directly, and reporting an overall assessment of the bank’s risk profile
– Acting as an advisor to these functions on how to identify, assess and manage risks and implement the framework
– Monitoring model risk adherence to the defined risk appetite, including escalating confirmed breaches, and recommending matters for potential consequence management, which can be enforced at a divisional and individual level.
MoRM is also responsible for the approval of the use of models within the bank and the initial and ongoing validation of models in line with Policy. Independent model validation functions outside of Model Risk Management are required to have a sufficient level of independence and expertise, and to apply MoRM standards.
253
|
Deutsche Bank |
||
|
Pillar 3 Report as of December 31, 2024 |
||
Scope and nature of model risk measurement and reporting systems
Article 435 (1)(c) CRR (EU OVA)
The governance and monitoring of model risk is facilitated by a combination of individuals in the functions that directly generate and manage model risk and MoRM model risk managers, supported by Model Risk Councils and forums, which escalate to the Risk Committee of the Board of Directors. They support the management of model risk for individual models, as well as in the aggregate.
The Model Inventory owned by MoRM is the repository for sources of model risk across the firm and provides the basis for the reporting of model risk.
MoRM provides (at least) quarterly updates on model risk topics to divisional/regional Model Risk fora, escalating into the Group Model Risk Council, as well as providing updates to certain Deutsche Bank AG Branches (London and New York), the Group Risk Committee and stand-alone model risk sections in the risk and capital profile. The risk and capital profile is distributed monthly to the Management Board and quarterly to the Supervisory Board.
Model risk profiles are produced by MoRM, to enable the monitoring, reporting and governance of model risk. Model risk profiles include:
– Current and emerging model risks and adherence to risk limits and risk concentrations
– Key information to effectively monitor model risk and identify potential areas of concern, such as: Risk Appetite Metric results, remediation and mitigating actions and target dates, and residual model risk
– Individual metrics showing risk appetite results for that reporting period, including remediation plans, compensating controls and ‘paths to green/amber’
– Status of remediation of material problems; appropriate and timely responses to identified problems, with current and forward-looking perspectives
– Reporting on overdue validation findings
Policies for mitigating model risk
Article 435 (1)(d) CRR (EU OVA)
The model risk framework is governed by the Model Risk Policy and Procedure. Model Risk is mitigated at a model level, through appropriate actions independently verified as proportionate. These may be built into the model, as part of development, or subsequently identified as part of the initial validation process or subsequent monitoring processes.
As part of independent validation, MoRM may identify the need for temporary or permanent mitigants prior to permitting the use of a model. These mitigants may take the form of adjustments to the output, the allocation of a reserve/buffer, limitations or restrictions on the use of a model, additional monitoring and/or restrictions or amendments to inputs and/or parameters.
These mitigants, are tracked and monitored as part of periodic reviews. Reassessments may also be triggered by significant changes to the model or its materiality, or potentially through the resolution of related weaknesses in the model.
254
|
Deutsche Bank |
||
|
Pillar 3 Report as of December 31, 2024 |
||
Remuneration policy
Article 450 CRR, Article 435 (2)(a)-(c) CRR and EU OVB
Article 450 CRR, Article 435 (2)(a)-(c) CRR and related requirements such as table EU REMA and EU OVB and templates EU REM1-5 are addressed by the following section from the Employee Compensation Report from within the Annual Report 2024.
Number of directorships held by board members
Article 435 (2)(a) CRR (EU OVB)
The number of directorships held by members of the management board are listed below in the table:
Number of directorships
|
|
Dec 31, 2024 |
|||
|
Number of executive and non-executive directorships |
Number of supervisory board directorships |
|||
|
Christian Sewing |
0 |
0 |
||
|
James von Moltke |
0 |
0 |
||
|
Fabrizio Campelli |
0 |
0 |
||
|
Bernd Leukert |
0 |
1 |
||
|
Alexander von zur Mühlen |
0 |
0 |
||
|
Laura Padovani |
0 |
0 |
||
|
Claudio de Sanctis |
0 |
0 |
||
|
Rebecca Short |
0 |
0 |
||
|
Stefan Simon |
1 |
1 |
||
|
Olivier Vigneron |
0 |
0 |
||
Recruitment policy for board members
Article 435 (2)(b) CRR (EU OVB)
Pursuant to the German Banking Act (KWG) the members of the Management Board must be professionally suitable and reliable and devote sufficient time to their role. The Supervisory Board assess the qualification of the individuals as well as the qualification of the Management Board as a whole (collective suitability). In this connection diversity of backgrounds and mindsets plays an important role as well as gender, nationality and age. The Nomination Committee supports the Chairman’s Committee and the Supervisory Board in identifying suitable candidates to fill a position on the bank’s Management Board. In doing so, the Committee prepares a position description with a candidate profile and states the expected time commitment. Suitable candidates are identified, in some cases in collaboration with external recruiting consultants, and structured interviews are conducted. Besides this succession planning with external candidates, the Management Board and Supervisory Board maintain a list of internal candidates. The Nomination Committee and Supervisory Board regularly receive reports from the Management Board on internal candidates for succession planning and the process from the perspective of the Management Board. For the selection of suitable candidates, external and internal, the Nomination Committee takes into account the balance and diversity of the knowledge, skills and experience of all members of the Management Board. It also seeks to foster diversity on the Management Board, for example, with regard to gender, nationality and age.
Building on the work of the Nomination Committee, the Chairman’s Committee submits a recommendation for the Supervisory Board’s resolution. Based on this, the Supervisory Board decides on the appointment of Management Board members. The first appointment period is for a maximum of three years. Management Board members can be reappointed for one or several terms of office, which may be for a maximum of five years pursuant to the law, whereby at Deutsche Bank such reappointments should generally for a maximum of three years.
Policy on diversity for board members
Article 435 (2)(c) CRR (EU OVB)
The Stock Corporation Act (AktG) requires that a company that is listed on a stock exchange and has three or more members of the Management Board, such as Deutsche Bank, must have at least one woman and one man as member of its Management Board, failing which renders the appointment void. In addition, promoting diversity on the Management Board is very important to the Supervisory Board, and it is actively working on Management Board diversity, e.g., in terms of gender, nationality and age, as well as different backgrounds and mindsets.
255
|
Deutsche Bank |
||
|
Pillar 3 Report as of December 31, 2024 |
||
Moreover, the AktG requires that the Management Board of a listed company sets targets for the share of women in the two management layers below the Management Board. The Supervisory Board and Management Board strive to and should serve as role models for the bank regarding diversity, equity and inclusion generally. In accordance with the bank’s values and beliefs specified above, diversity in the composition of the Supervisory Board and the Management Board also facilitates the proper performance of the tasks and duties assigned to them by law, the Articles of Association and Terms of Reference.
As an integral part of Deutsche Bank’s strategy as a leading European bank with a global reach and a strong home market in Germany, diversity is a decisive factor for the bank’s success. Diversity, equity and inclusion help Deutsche Bank in forming and strengthening relationships with its clients and partners in the societies where the bank does business.
Age and gender as well as educational and professional backgrounds have long been accepted as key aspects of the far more comprehensive understanding of diversity at Deutsche Bank.
The bank is convinced that diversity, equity and inclusion stimulate innovation, for example, and helps the bank to take more balanced decisions and thus play a decisive role for the success of Deutsche Bank. Diversity and inclusion are therefore integral components of the bank’s values and beliefs and its Code of Conduct.
Diversity concept and succession planning for the Management Board
Through the composition of the Management Board, it has to be ensured that its members have, at all times, the required knowledge, skills and experience necessary to properly perform their tasks. Accordingly, when selecting members for the Management Board, care is to be taken that they collectively have sufficient expertise and diversity within the meaning of the bank’s objectives specified above. Furthermore, the Supervisory Board and the Management Board should ensure long-term succession planning.
The Act supplementing and amending the regulations for the equal participation of women and men in management positions in the private sector and in the public service (“Zweites Führungspositionen Gesetz” - FüPoG II) stipulates that at least one woman and one man are to be appointed to a board with more than three members, with no additional targets to be set. As of December 31, 2024, the bank has fulfilled this requirement with two women on the Board. As a rule, a member of the board of directors should not have exceeded the age limit for standard early retirement pension for long-term insured persons in the German statutory pension insurance scheme by the expiry date of his or her appointment.
Implementation
In accordance with the law, the Articles of Association and Terms of Reference, the Supervisory Board adopted a candidate profiles for the members of the Management Board, based on a proposal from the Nomination Committee. These profiles takes into account an “Expertise and Capabilities Matrix”, specifying, among other things, the required knowledge, skills and experience to perform the tasks as Management Board member, in order to successfully develop and implement the bank’s strategy in the respective market or the respective division and as a management body collectively. The Management Board reviews succession plans for Management Board positions, both individually and as a group. Individual succession plans are reviewed and internal succession candidates are discussed in detail based on potential, leadership skills and experience as well as fit and proper suitability. As gender diversity is a key focus of Deutsche Bank the respective succession metrics and data analytics support this process. After approval by the Management Board these plans are submitted to the Nomination Committee and the Supervisory Board in principle at a meeting for extensive deliberations.
In identifying candidates to fill a position on the bank’s Management Board, the Supervisory Board’s Nomination Committee takes into account the appropriate diversity balance of all Management Board members collectively. Furthermore, it also considers the targets set by the Supervisory Board in accordance with statutory requirements for the percentage of women on the Management Board.
The Nomination Committee supports the Supervisory Board with the periodic assessment, to be performed at least once a year, of the knowledge, skills and experience of the individual members of the Management Board and of the Management Board in its entirety.
Results achieved in the 2024 financial year
As of December 31, 2024 the Management Board comprised two women (20%) and eight men. The age structure is diverse, ranging from 49 to 58 years of age as of December 31, 2024.
In the light of the bank’s strategy as a leading European bank with a global reach and a strong home market in Germany, five of the nine Management Board members as of December 31, 2024 have a German background. Furthermore, the current Management Board members are citizens of Italy, the United Kingdom, France, Australia, New Zealand and Switzerland. However, the ethnic diversity of the Management Board does not currently reflect the full diversity of the markets where the bank do business or the diversity of the bank’s employees.
256
|
Deutsche Bank |
||
|
Pillar 3 Report as of December 31, 2024 |
||
The diverse range of the members’ educational and professional backgrounds includes banking, business administration, economics, law, linguistics, philosophy and engineering.
The bank transparently reports on Management Board diversity in addition to the information presented above in this Corporate Governance Statement in the section “Management Board and Supervisory Board” as well as on the bank’s website: http://www.db.com/ (Heading Investor Relations, “Corporate Governance”, “Management Board”).
Compensation of the employees
The content of the 2024 Employee Compensation Report is based on the qualitative and quantitative remuneration disclosure requirements outlined in Article 450 No. 1 (a) to (j) Capital Requirements Regulation (CRR) in conjunction with Section 16 of the Remuneration Ordinance for Institutions (Institutsvergütungsverordnung – InstVV).
This Compensation Report takes a group-wide view and covers all consolidated entities of the Deutsche Bank Group. In accordance with regulatory requirements, equivalent reports for 2024 are prepared for BHW Bausparkasse AG classified as Significant Institution in the meaning of the German Banking Act as well as for other subsidiaries within Deutsche Bank Group in accordance with local regulatory requirements.
Regulatory environment
Ensuring compliance with regulatory requirements is an overarching consideration in the bank’s Group Compensation Strategy. The bank strives to be at the forefront of implementing regulatory requirements with respect to compensation and will continue to maintain a close exchange with its prudential supervisor, the European Central Bank (ECB), to be in compliance with all existing and new requirements.
As an EU-headquartered institution, Deutsche Bank is subject to the Capital Requirements Regulation/Directive (CRR/CRD) globally, as transposed into German national law in the German Banking Act and InstVV. These rules are applied to all of Deutsche Bank subsidiaries and branches world-wide to the extent required in accordance with Section 27 InstVV. As a Significant Institution within the meaning of the German Banking Act, Deutsche Bank identifies all employees whose work is deemed to have a material impact on the overall risk profile (Material Risk Takers or MRTs) in accordance with the criteria stipulated in the German Banking Act and in the Commission Delegated Regulation 2021/923. MRT identification is performed for Deutsche Bank Group as well as for institutions in the EU at institutional level.
Taking into account more specific sectorial legislation and in accordance with InstVV, some of Deutsche Bank’s subsidiaries (in particular within the DWS Group) fall under sector specific remuneration rules, such as the Alternative Investments Fund Managers Directive (AIFMD), the Undertakings for Collective Investments in Transferable Securities Directive (UCITS) and the Investment Firm Directive (IFD) including the applicable local transpositions. MRTs are also identified in these subsidiaries. Identified employees are subject to the remuneration provisions outlined in the applicable Guidelines on sound remuneration policies published by the European Securities and Markets Authority (ESMA) and the European Banking Authority (EBA).
Deutsche Bank takes into account the regulations targeted at employees who engage directly or indirectly with the bank’s clients, for instance as per the local transpositions of the Markets in Financial Instruments Directive II – MiFID II. Accordingly, specific provisions for employees deemed to be Relevant Persons are implemented with a view to ensuring that they act in the best interest of the bank’s clients.
Where applicable, Deutsche Bank is also subject to specific rules and regulations implemented by local regulators. Many of these requirements are aligned with the InstVV. However, where variations are apparent, proactive and open discussions with regulators have enabled the bank to follow the local regulations whilst ensuring that any impacted employees or locations remain within the bank’s overall Group Compensation Framework. This includes, amongst others, the compensation structures applied to Covered Employees in the United States under the requirements of the Federal Reserve Board as well as the requirements related to compensation recovery for executive officers in the event of an accounting restatement as required by the U.S. Securities and Exchange Commission. In any case, the InstVV requirements are applied as minimum standards globally.
257
|
Deutsche Bank |
||
|
Pillar 3 Report as of December 31, 2024 |
||
Compensation governance
Deutsche Bank has a robust governance structure enabling it to operate within the clear parameters of its Compensation Strategy and Policy. In accordance with the German two-tier board structure, the Supervisory Board governs the compensation of the Management Board members while the Management Board oversees compensation matters for all other employees in the Group. Both the Supervisory Board and the Management Board are supported by specific committees and functions, in particular the Compensation Control Committee (CCC), the Compensation Officer, and the Senior Executive Compensation Committee (SECC).
In line with their responsibilities, the bank’s control functions as per InstVV are involved in the design and application of the bank’s remuneration systems, in the identification of MRTs and in determining the total amount of Variable Compensation. This includes assessing the impact of employees’ behavior and the business-related risks, performance criteria, granting of remuneration and severances as well as ex-post risk adjustments.
Reward governance structure
|
|
1 Does not comprise a complete list of Supervisory Board Committees
Compensation Control Committee (CCC)
The Supervisory Board has set up the CCC to support in establishing and monitoring the structure of the compensation system for the Management Board Members of Deutsche Bank AG. Furthermore, the CCC monitors the appropriateness of the compensation systems for the employees of Deutsche Bank Group, as established by the Management Board and the SECC. The CCC reviews whether the total amount of variable compensation is affordable and set in accordance with the risk, capital and liquidity situation as well as in alignment with the business and risk strategies. Furthermore, the CCC supports the Supervisory Board in monitoring the bank’s MRT identification process.
Further details, including the composition and the number of meetings held, can be found in the Report of the Supervisory Board within this Annual Report.
258
|
Deutsche Bank |
||
|
Pillar 3 Report as of December 31, 2024 |
||
Compensation Officer
The Management Board, in cooperation with the CCC, has appointed a Group Compensation Officer to support the Supervisory Boards of Deutsche Bank AG and of the bank’s Significant Institutions in Germany in performing their compensation related duties. The Compensation Officer is involved in the conceptual review, development, monitoring and application of the employees’ compensation systems, the MRT identification and remuneration disclosures on an ongoing basis. The Compensation Officer performs all relevant monitoring obligations independently, provides an assessment on the appropriateness of the design and strategy of the compensation systems for employees at least annually and regularly supports and advises the CCC.
Senior Executive Compensation Committee (SECC)
The SECC is a delegated committee established by the Management Board which has the mandate to develop sustainable compensation principles, to prepare recommendations on Total Compensation levels and to ensure appropriate compensation governance and oversight. The SECC establishes the Compensation and Benefits Strategy, Policy and corresponding guiding principles. Moreover, using quantitative and qualitative factors, the SECC assesses Group and divisional performance as a basis for compensation decisions and makes recommendations to the Management Board regarding the total amount of annual variable compensation and its allocation across business divisions and infrastructure functions.
In order to maintain its independence, only representatives from infrastructure and control functions who are not aligned to any of the business divisions are members of the SECC. In 2024, the SECC’s membership comprised of the DB AG Management Board member responsible for Human Resources and the Chief Financial Officer as Co-Chairpersons, the Head of Compliance, the Head of Human Resources and the Head of Performance & Reward as well as an additional representative from both Finance and Risk as voting members. The Compensation Officer and an additional representative from Finance participated as non-voting members. The SECC generally meets on a monthly basis but with more frequent meetings during the compensation determination process. It held 19 meetings in total with regard to the compensation process for the performance year 2024.
Compensation and Benefits Strategy
Deutsche Bank recognizes that its compensation framework plays a vital role in supporting its strategic objectives. It enables the bank to attract and retain the individuals required to achieve the bank’s objectives. The Compensation and Benefits Strategy is built on three core pillars (Principles, Performance and Processes as outlined below) that support the bank’s global, client-centric business and risk strategy, reinforced by safe and sound compensation practices that operate within the bank’s profitability, solvency and liquidity position.
|
|
259
|
Deutsche Bank |
||
|
Pillar 3 Report as of December 31, 2024 |
||
Group Compensation Framework
The compensation framework, generally applicable globally across all regions and business lines, emphasizes an appropriate balance between Fixed Pay (FP) and Variable Compensation (VC) – together forming Total Compensation (TC). It aligns incentives for sustainable performance at all levels of Deutsche Bank whilst ensuring the transparency of compensation decisions and their impact on shareholders and employees. The underlying principles of Deutsche Bank’s Compensation Framework are applied to all employees equally and are supported by the key principle ‘equal pay for equal work or work of equal value’ and the necessity for equal opportunities, irrespective of differences in, e.g., tenure, gender or ethnicity.
Pursuant to CRD and the requirements subsequently adopted in the German Banking Act, Deutsche Bank is subject to a maximum ratio of 1:1 with regard to fixed-to-variable remuneration components, which was increased to 1:2 for a limited population with shareholder approval on May 22, 2014 with an approval rate of 95.27%, based on valid votes by 27.68% of the share capital represented at the Annual General Meeting. Control Functions as defined by InstVV, comprising Risk, Compliance and Anti-Financial Crime, Group Audit and the Group Compensation Officer and his Deputy, are subject to a maximum ratio of 2:1. Employees in certain infrastructure functions should continue to be subject to a maximum ratio of 1:1.
With effect from 2024 the bank amended and simplified its compensation framework by ensuring all employees are eligible for individual VC, by incorporating the former Group VC Component into the overall VC pool determination, and by removing both Reference Total Compensation and Recognition Awards. To maintain an appropriate balance between FP and VC, the bank implemented a more standardized VC orientation concept with orientation values based on division, profession and seniority that indicate the average expected VC as a percentage value of FP.
Fixed Pay is the key and primary compensation element for most employees globally. It is a fixed regular payment based on transparent and predetermined conditions. It is delivered either in the form of base salary and where applicable local specific fixed pay allowances. Fixed Pay reflects the value of the individual role and function within the organization, regional and divisional specifics and rewards the factors an employee brings to the organization such as qualification, skills and experience required for the role in line with remuneration levels in the specific geographic location and level of responsibility.
Variable Compensation is a discretionary compensation component that reflects Group, Divisional risk-adjusted financial and non-financial performance as well as individual contributions. It acknowledges that employees contribute towards the success of their Division and the Group as a whole. At the same time, VC allows the bank to differentiate individual contributions and to drive behavior and conduct through an incentive system that can positively influence culture and the achievement of the bank’s strategic objectives and to apply consequences for falling below the standards of delivery, behavior and conduct by reducing the VC.
In the context of InstVV, severance payments are considered variable compensation. The bank’s severance framework ensures full alignment with the respective InstVV requirements.
Employee benefits are considered FP from a regulatory perspective, as they have no direct link to performance or discretion. They are granted in accordance with applicable local market practices and requirements. Pension expenses represent the main element of the bank’s benefits portfolio globally.
Total Compensation (TC) is made up of defined Fixed Pay, Variable Compensation and is supplemented by benefits.
Employee groups with specific compensation structures
For some areas of the bank, compensation structures deviate in some aspects from the Group Compensation Framework outlined above, but within regulatory boundaries.
Postbank units
While executive staff of former Postbank generally follow the remuneration structure of Deutsche Bank, the compensation for any other staff in Postbank units is based on specific frameworks agreed with trade unions or with the respective workers’ councils. Where no collective agreements exist, compensation is subject to individual contracts. In general, non-executive and tariff staff in Postbank units receive VC, but the structure and portion of VC can differ between legal entities.
DWS
DWS asset management entities and employees fall under AIFMD, UCITS or IFD regulation, with only a very limited number of employees remain in scope of the bank’s Group InstVV requirements. DWS has established its own compensation governance, policy, and structures, as well as Risk Taker identification process in line with its regulatory requirements. These structures and processes are aligned with InstVV where required but tailored towards the Asset Management business. Pursuant to the ESMA/EBA Guidelines, DWS’s compensation strategy is designed to ensure an appropriate ratio between fixed and variable compensation.
260
|
Deutsche Bank |
||
|
Pillar 3 Report as of December 31, 2024 |
||
Generally, DWS applies remuneration rules that are equivalent to the Deutsche Bank Group approach, but use DWS Group-related parameters, where possible. Notable deviations from the Group Compensation Framework include the use of share-based instruments linked to DWS shares and fund-linked instruments. These serve to improve the alignment of employee compensation with DWS’ shareholders’ and investors’ interests.
Tariff staff
Tariff staff are either subject to a collective agreement (Tarifvertrag für das private Bankgewerbe und die öffentlichen Banken), as negotiated between trade unions and employer associations, or subject to agreements as negotiated with the respective trade unions directly. The remuneration of tariff staff is included in the quantitative disclosures in this Report.
Determination of performance-based variable compensation
The bank puts a strong focus on its governance related to compensation decision-making processes. A robust set of rule-based principles for compensation decisions with close links to the performance of both businesses and individuals were applied.
The total amount of VC for any given performance year is derived from an assessment of the bank’s profitability, solvency, and liquidity position (affordability assessment), Group performance and the performance of divisions and infrastructure functions in support of achieving the bank’s strategic objectives.
In a first step, Deutsche Bank assesses the bank’s affordability as well as other limitations (such as cost constraints) to determine what the bank “can” award in line with regulatory and internal requirements. In the next step, the bank assesses divisional risk-adjusted performance, i.e. what the bank “should” award in order to provide an appropriate compensation for contributions to the bank’s success. The proportion of the VC pools related to Group performance, which has a weighting of 25%, is determined based on the performance of a selected number of Group’s Key Performance Indicators (KPIs), including Common Equity Tier 1 (CET 1) Capital Ratio, Cost/Income Ratio (CIR), Post-Tax Return on Tangible Equity (RoTE), ESG: Environmental - Sustainable Financing and ESG Investments, Social - Gender Diversity and Governance - Audit Control Risk Management Grade.
When assessing divisional performance, a range of considerations are referenced. Performance is assessed in the context of financial and – based on Balanced Scorecards – non-financial targets. To ensure that performance is reviewed in its entirety and that consideration is also given to criteria that are difficult to evaluate with a solely formulaic approach, the SECC additionally conducts a qualitative review. Following the quantitative calculation of the combined performance assessed VC pools, the SECC will review a set of pre-defined qualitative criteria related to both financial and non-financial performance and may decide to apply a maximum 10 percentage points up or down overlay on the divisional performance assessment. The financial targets for front-office divisions are subject to appropriate risk-adjustment, in particular by referencing the degree of future potential risks to which Deutsche Bank may be exposed, and the amount of capital required to absorb severe unexpected losses arising from these risks. For the infrastructure functions, the financial performance assessment is mainly based on the achievement of cost targets. While the allocation of VC to infrastructure functions, and in particular to control functions, depends on both Deutsche Bank’s overall and their own performance, it is not dependent on the performance of the division(s) that these functions oversee.
At the level of the individual employee, the VC Guiding Principles are established, which detail the factors and metrics that managers need to take into account when making VC decisions. In doing so, they must fully appreciate the risk-taking activities of individuals to ensure that VC allocations are balanced and risk-taking is not inappropriately incentivized. The factors and metrics to be considered include, but are not limited to, (i) business delivery (“What”), i.e. quantitative and qualitative financial, risk-adjusted and non-financial performance metrics, and (ii) behavior (“How”), i.e. culture, conduct and control considerations such as qualitative inputs from control functions or disciplinary sanctions. VC setting recommendations help managers to translate individual performance (“What” and “How”) into appropriate pay outcomes. Generally, performance is assessed based on a one-year period. However, for Management Board members of all Significant Institutions, a performance period of three years is taken into account.
261
|
Deutsche Bank |
||
|
Pillar 3 Report as of December 31, 2024 |
||
Variable compensation structure
The compensation structures are designed to provide a mechanism that promotes and supports long-term performance of employees and the bank. Whilst a portion of VC is paid upfront, these structures require that an appropriate portion is deferred to ensure alignment to the sustainable performance of the Group. For both parts of VC, Deutsche Bank shares are used as instruments and as an effective way to align compensation with Deutsche Bank’s sustainable performance and the interests of shareholders.
The bank continues to go beyond regulatory requirements with the scope as well as the amount of VC that is deferred and the minimum deferral periods for certain employee groups. The deferral rate and period are determined based on the risk categorization of the employee as well as the business unit. Where applicable, the bank starts to defer parts of variable compensation for MRTs where VC is set at or above € 50,000 or where VC exceeds 1/3 of TC. For non-MRTs, deferrals start at higher levels of VC. MRTs are on average subject to deferral rates in excess of the minimum 40% (60% for Senior Management) as required by InstVV. For MRTs in Material Business Units (MBU) the bank applies a deferral rate of at least 50%. The VC threshold for MRTs requiring at least 60% deferral is set at € 500,000. Moreover, for all employees whose FP exceeds the amount of € 500,000, the full amount of the VC is deferred.
As detailed in the table below, deferral periods range from three to five years, dependent on employee groups.
Overview of 2024 award types (excluding DWS Group)
|
Award Type |
Description |
Beneficiaries |
Deferral Period |
Retention Period |
Portion |
|||||
|
Upfront: |
Upfront cash |
All eligible employees |
N/A |
N/A |
100% of VC, except employees with deferred awards |
|||||
|
Upfront: |
Upfront equity (linked to Deutsche Bank’s share price over the retention period) |
MRTs with VC ≥ € 50,000 or where VC exceeds 1/3 of TC € 500,000 |
N/A |
12 months |
50% of upfront VC |
|||||
|
Deferred: |
Deferred cash |
All employees with deferred VC |
Equal tranche vesting: Non-MRTs: 3 years |
N/A |
50% of deferred VC |
|||||
|
Deferred: |
Deferred equity (linked to Deutsche Bank’s share price over the vesting and retention period) |
All employees with deferred VC |
Equal tranche vesting: |
12 months for MRTs |
50% of deferred VC |
N/A – Not applicable
1 For the purpose of Performance Year 2024 annual awards, Senior Management is defined DB AG MB-1 positions; incumbents of MB-2 positions in IB and CB reporting to Head of CB and Co-Heads of IB; further individuals with significant business responsibilities; MB members of Significant Institutions in the meaning of the German Banking Act; respective MB-1 positions with managerial responsibility; for the specific deferral rules for the Management Board of Deutsche Bank AG refer to the Compensation Report for the Management Board
Employees are not allowed to sell, pledge, transfer or assign a deferred award or any rights in respect to the award. They may not enter into any transaction having an economic effect of hedging any variable compensation, for example offsetting the risk of price movement with respect to the equity-based award. The Human Resources and Compliance functions, overseen by the Compensation Officer, work together to monitor employee trading activity and to ensure that all employees comply with this requirement.
262
|
Deutsche Bank |
||
|
Pillar 3 Report as of December 31, 2024 |
||
Ex-post risk adjustment of variable compensation
In line with regulatory requirements relating to ex-post risk adjustment of variable compensation, the bank believes that a long-term view on conduct and performance of its employees is a key element of deferred VC. As a result, under the Management Board’s oversight, all deferred awards are subject to performance conditions and forfeiture provisions as detailed below.
Overview on Deutsche Bank Group performance conditions and forfeiture provisions of variable compensation granted for Performance Year 2024
|
|
1 Considering clearly defined and governed adjustments for relevant Profit and Loss items (e.g., business restructurings; impairments of goodwill or intangibles)
2 Only applicable to InstVV MRTs in front office divisions
3 Other provisions may apply as outlined in the respective plan rules
263
|
Deutsche Bank |
||
|
Pillar 3 Report as of December 31, 2024 |
||
Material Risk Taker compensation disclosure
On a global basis, 1,451 employees were identified as MRTs according to CRD/InstVV for financial year 2024, compared to 1,477 employees for 2023. The number of 2024 Group MRTs amounts to 1,213 individuals. Moreover, 292 individuals were identified at an institutional level (thereof 54 Group MRTs). The remuneration elements for all those MRTs on a consolidated basis are detailed in the tables below in accordance with Article 450 CRR. Where applicable, the EU REM tables display the prescribed business lines as per Annex XXXIII of Regulation No 575/2013.
With regard to deferral arrangements and pay-out instruments, 86 MRTs, whose total remuneration amounts to € 16.8 million (thereof € 5.7 million variable remuneration including severance payments) benefit from a derogation laid down in Article 94(3) CRD point (a) and 63 MRTs, whose total remuneration amounts to € 15.3 million (thereof € 5.5 million variable remuneration including severance payments) benefit from a derogation laid down in Article 94(3) CRD point (b).
Remuneration for 2024 - Material Risk Takers (REM 1)
|
|
2024 |
||||||||||||
|
in € m. |
Super- |
Manage- |
Senior Management4 |
Other Material Risk Takers |
Group |
||||||||
|
Fixed Pay |
Number of MRTs5 |
21 |
10 |
224 |
1,020 |
1,275 |
|||||||
|
Total Fixed Pay |
8 |
33 |
166 |
653 |
860 |
||||||||
|
of which: cash-based |
8 |
29 |
160 |
621 |
818 |
||||||||
|
of which: shares or equivalent ownership interests |
0 |
0 |
0 |
0 |
0 |
||||||||
|
of which: share-linked instruments or equivalent non-cash instruments |
0 |
0 |
0 |
0 |
0 |
||||||||
|
of which: other instruments |
0 |
0 |
0 |
0 |
0 |
||||||||
|
of which: other forms |
0 |
4 |
6 |
32 |
42 |
||||||||
|
Variable Pay |
Number of MRTs5 |
0 |
10 |
223 |
984 |
1,217 |
|||||||
|
Total Variable Pay6 |
0 |
42 |
171 |
667 |
881 |
||||||||
|
of which: cash-based |
0 |
9 |
92 |
351 |
451 |
||||||||
|
of which: deferred |
0 |
0 |
75 |
269 |
344 |
||||||||
|
of which: shares or equivalent ownership interests |
0 |
34 |
75 |
316 |
426 |
||||||||
|
of which: deferred |
0 |
26 |
73 |
269 |
368 |
||||||||
|
of which: share-linked instruments or equivalent non-cash instruments |
0 |
0 |
4 |
0 |
4 |
||||||||
|
of which: deferred |
0 |
0 |
3 |
0 |
3 |
||||||||
|
of which: other instruments |
0 |
0 |
1 |
0 |
1 |
||||||||
|
of which: deferred |
0 |
0 |
1 |
0 |
1 |
||||||||
|
of which: other forms |
0 |
0 |
0 |
0 |
0 |
||||||||
|
of which: deferred |
0 |
0 |
0 |
0 |
0 |
||||||||
|
Total Pay |
8 |
75 |
338 |
1,321 |
1,741 |
||||||||
1 The table may contain marginal rounding differences
2 Supervisory Board represents the Supervisory Board Members of Deutsche Bank AG
3 Management Board represents the Management Board Members of Deutsche Bank AG
4 Senior Management is defined as Deutsche Bank AG MB-1 positions; incumbents of MB-2 positions in IB and CB reporting to Head of CB and Co-Heads of IB; further individuals with significant business responsibilities; MB members of institutions required to identify MRTs at a solo institutional level and respective MB-1 positions with managerial responsibility
5 Beneficiaries only as of December 31, 2024 (HC reported for Supervisory Board and Management Board, FTE reported for the remaining part); therefore, the totals do not add up to the 1,451 individuals identified as MRTs; shows remuneration awarded to all MRTs (including 2024 leavers)
6 Variable Pay includes Deutsche Bank´s Year-end performance-based VC for 2024, other VC and severance payments; it also includes fringe benefits awarded to Management Board Members of Deutsche Bank AG which are to be classified as variable remuneration, and considers the newly introduced LTI Plan for Management Board members of Deutsche Bank AG set up for the performance period 2024-2026, which during the “transition phase” is shown with the target amount; the table does not include new hire replacement awards for lost entitlements from previous employers (buyouts)
Guaranteed variable remuneration and severance payments - Material Risk Takers (REM 2)
|
|
2024 |
||||||||||
|
in € m. |
Super- |
Manage- |
Senior Management4 |
Other Material Risk Takers |
Group |
||||||
|
Guaranteed variable remuneration awards |
|||||||||||
|
Number of MRTs5 |
0 |
0 |
4 |
2 |
6 |
||||||
|
Total amount |
0 |
0 |
6 |
9 |
15 |
||||||
|
of which: paid during financial year, not taken into account in bonus cap |
0 |
0 |
3 |
8 |
10 |
||||||
|
Severance payments awarded in previous periods, paid out during financial year |
|||||||||||
|
Number of MRTs5 |
0 |
0 |
0 |
0 |
0 |
||||||
|
Total amount |
0 |
0 |
0 |
0 |
0 |
||||||
|
Severance payments awarded during financial year |
|||||||||||
|
Number of MRTs5 |
0 |
0 |
8 |
69 |
77 |
||||||
|
Total amount6 |
0 |
0 |
8 |
34 |
42 |
||||||
|
of which: paid during financial year |
0 |
0 |
8 |
32 |
40 |
||||||
|
of which: deferred |
0 |
0 |
0 |
2 |
2 |
||||||
|
of which: paid during financial year, not taken into account in bonus cap |
0 |
0 |
8 |
32 |
40 |
||||||
|
of which: highest payment that has been awarded to a single person |
0 |
0 |
2 |
3 |
3 |
||||||
1 The table may contain marginal rounding differences
264
|
Deutsche Bank |
||
|
Pillar 3 Report as of December 31, 2024 |
||
2 Supervisory Board represents the Supervisory Board Members of Deutsche Bank AG
3 Management Board represents the Management Board Members of Deutsche Bank AG
4 Senior Management is defined as Deutsche Bank AG MB-1 positions; incumbents of MB-2 positions in IB and CB reporting to Head of CB and Co-Heads of IB; further individuals with significant business responsibilities; MB members of institutions required to identify MRTs at a solo institutional level and respective MB-1 positions with managerial responsibility
5 Beneficiaries only (HC reported for all categories)
Deferred remuneration - Material Risk Takers (REM 3)
|
|
2024 |
|||||||||||||||
|
in € m. |
Total amount of deferred remuneration awarded for previous performance periods |
|
|
Amount of performance adjustment made in the financial year to deferred remuneration that was due to vest in the financial year |
Amount of performance adjustment made in the financial year to deferred remuneration that was due to vest in future performance years |
Total amount of adjustment during the financial year due to ex post implicit adjustments5 |
Total amount of deferred remuneration awarded before the financial year actually paid out in the financial year6 |
Total of amount of deferred remuneration awarded for previous performance period that has vested but is subject to retention periods |
||||||||
|
Supervisory Board2 |
0 |
0 |
0 |
0 |
0 |
0 |
0 |
0 |
||||||||
|
Cash-based |
0 |
0 |
0 |
0 |
0 |
0 |
0 |
0 |
||||||||
|
Shares or equivalent ownership interests |
0 |
0 |
0 |
0 |
0 |
0 |
0 |
0 |
||||||||
|
Share-linked instruments or equivalent non-cash instruments |
0 |
0 |
0 |
0 |
0 |
0 |
0 |
0 |
||||||||
|
Other instruments |
0 |
0 |
0 |
0 |
0 |
0 |
0 |
0 |
||||||||
|
Other forms |
0 |
0 |
0 |
0 |
0 |
0 |
0 |
0 |
||||||||
|
Management Board3 |
124 |
18 |
106 |
0 |
0 |
26 |
18 |
11 |
||||||||
|
Cash-based |
55 |
7 |
48 |
0 |
0 |
0 |
7 |
0 |
||||||||
|
Shares or equivalent ownership interests |
69 |
11 |
58 |
0 |
0 |
26 |
11 |
11 |
||||||||
|
Share-linked instruments or equivalent non-cash instruments |
0 |
0 |
0 |
0 |
0 |
0 |
0 |
0 |
||||||||
|
Other instruments |
0 |
0 |
0 |
0 |
0 |
0 |
0 |
0 |
||||||||
|
Other forms |
0 |
0 |
0 |
0 |
0 |
0 |
0 |
0 |
||||||||
|
Senior management4 |
374 |
77 |
297 |
0 |
0 |
69 |
77 |
38 |
||||||||
|
Cash-based |
183 |
38 |
145 |
0 |
0 |
0 |
38 |
0 |
||||||||
|
Shares or equivalent ownership interests |
183 |
38 |
144 |
0 |
0 |
68 |
38 |
37 |
||||||||
|
Share-linked instruments or equivalent non-cash instruments |
6 |
1 |
5 |
0 |
0 |
1 |
1 |
1 |
||||||||
|
Other instruments |
2 |
0 |
2 |
0 |
0 |
0 |
0 |
0 |
||||||||
|
Other forms |
0 |
0 |
0 |
0 |
0 |
0 |
0 |
0 |
||||||||
|
Other Material Risk Takers |
1,472 |
369 |
1,102 |
0 |
1 |
256 |
366 |
141 |
||||||||
|
Cash-based |
725 |
180 |
545 |
0 |
1 |
0 |
179 |
0 |
||||||||
|
Shares or equivalent ownership interests |
746 |
189 |
557 |
0 |
1 |
256 |
187 |
141 |
||||||||
|
Share-linked instruments or equivalent non-cash instruments |
1 |
0 |
0 |
0 |
0 |
0 |
0 |
0 |
||||||||
|
Other instruments |
0 |
0 |
0 |
0 |
0 |
0 |
0 |
0 |
||||||||
|
Other forms |
0 |
0 |
0 |
0 |
0 |
0 |
0 |
0 |
||||||||
|
Total amount |
1,970 |
465 |
1,505 |
0 |
1 |
351 |
461 |
190 |
||||||||
1 The table may contain marginal rounding differences
2 Supervisory Board represents the Supervisory Board Members of Deutsche Bank AG
3 Management Board represents the Management Board Members of Deutsche Bank AG
4 Senior Management is defined as Deutsche Bank AG MB-1 positions; incumbents of MB-2 positions in IB and CB reporting to Head of CB and Co-Heads of IB; further individuals with significant business responsibilities; MB members of institutions required to identify MRTs at a solo institutional level and respective MB-1 positions with managerial responsibility
5 Changes of value of deferred remuneration due to the changes of prices of instruments
6 Defined as remuneration awarded before the financial year which vested in the financial year (including where subject to a retention period)
265
|
Deutsche Bank |
||
|
Pillar 3 Report as of December 31, 2024 |
||
Remuneration of high earners – Material Risk Takers (REM 4)
|
|
2024 |
2023 |
||
|
in € |
Number of individuals |
Number of individuals |
||
|
Total Pay1 |
||||
|
1,000,000 to 1,499,999 |
331 |
290 |
||
|
1,500,000 to 1,999,999 |
125 |
88 |
||
|
2,000,000 to 2,499,999 |
59 |
53 |
||
|
2,500,000 to 2,999,999 |
48 |
16 |
||
|
3,000,000 to 3,499,999 |
25 |
8 |
||
|
3,500,000 to 3,999,999 |
14 |
14 |
||
|
4.000,000 to 4,499,999 |
6 |
11 |
||
|
4,500,000 to 4,999,999 |
5 |
1 |
||
|
5,000,000 to 5,999,999 |
9 |
4 |
||
|
6,000,000 to 6,999,999 |
3 |
8 |
||
|
7,000,000 to 7,999,999 |
12 |
5 |
||
|
8,000,000 to 8,999,999 |
3 |
4 |
||
|
9,000,000 to 9,999,999 |
3 |
2 |
||
|
10,000,000 to 10,999,999 |
3 |
0 |
||
|
14,000,000 to 14,999,999 |
0 |
1 |
||
|
17,000,000 to 17,999,999 |
1 |
0 |
||
|
Total |
647 |
505 |
||
1 Includes all components of FP and VC (including severances); buyouts are not included
In total, 647 MRTs received a Total Pay of € 1 million or more for 2024. This increase is mainly driven by the greater allocation of the variable compensation pool to the Investment Bank in recognition of its strong performance.
Compensation awards 2024 – Material Risk Takers (REM 5)
|
|
Management Body Remuneration |
Business Areas |
|||||||||||||||||
|
in € m. |
Super- |
Manage- |
Total Manage- |
Invest- |
Retail Banking2 |
Asset |
Corporate Functions2 |
Control Functions2 |
Total |
||||||||||
|
Total number of Material Risk Takers3 |
1,275 |
||||||||||||||||||
|
of which: Management Body |
21 |
10 |
31 |
N/A |
N/A |
N/A |
N/A |
N/A |
N/A |
||||||||||
|
of which: Senior Management4 |
N/A |
N/A |
N/A |
27 |
76 |
5 |
79 |
38 |
224 |
||||||||||
|
of which: Other Material Risk Takers |
N/A |
N/A |
N/A |
582 |
224 |
0 |
130 |
84 |
1,020 |
||||||||||
|
Total Pay of Material Risk Takers |
8 |
75 |
83 |
1,095 |
295 |
15 |
177 |
77 |
1,741 |
||||||||||
|
of which: variable pay5 |
0 |
42 |
42 |
588 |
143 |
7 |
76 |
23 |
881 |
||||||||||
|
of which: fixed pay |
8 |
33 |
40 |
507 |
152 |
7 |
100 |
54 |
860 |
||||||||||
1 The table may contain marginal rounding differences
2 Supervisory Board represents the Supervisory Board Members of Deutsche Bank AG, Management Board represents the Management Board Members of Deutsche Bank AG; Investment Banking = Investment Bank; Retail Banking = Private Bank and Corporate Bank; Asset Management = Asset Management (DWS); Control Functions include Chief Risk Office, Group Audit, Compliance and Anti-Financial Crime; Corporate Functions include any Infrastructure function which is neither captured as a Control Function nor part of any division
3 HC as of December 31, 2024 reported for Supervisory Board and Management Board, FTE as of December 31, 2024 reported for the remaining part; therefore, the totals do not add up to the 1,451 individuals identified as MRTs; shows remuneration awarded to all MRTs (including 2024 leavers)
4 Senior Management is defined as Deutsche Bank AG MB-1 positions; incumbents of MB-2 positions in IB and CB reporting to Head of CB and Co-Heads of IB; further individuals with significant business responsibilities; MB members of institutions required to identify MRTs at a solo institutional level and respective MB-1 positions with managerial responsibility
5 Variable Pay includes Deutsche Bank´s Year-end performance-based VC for 2024, other VC and severance payments; it also includes fringe benefits awarded to Management Board Members of Deutsche Bank AG which are to be classified as variable remuneration, and considers the newly introduced LTI Plan for Management Board members of Deutsche Bank AG set up for the performance period 2024-2026, which during the “transition phase” is shown with the target amount; the table does not include new hire replacement awards for lost entitlements from previous employers (buyouts)
266
|
Deutsche Bank |
||
|
Pillar 3 Report as of December 31, 2024 |
||
List of tables
267
|
Deutsche Bank |
||
|
Pillar 3 Report as of December 31, 2024 |
||
268
|
Deutsche Bank |
||
|
Pillar 3 Report as of December 31, 2024 |
||
269