The investment objective of the Riverbridge Growth Fund (the “Fund”) is to seek long term capital appreciation.
This table describes the fees and expenses that you may pay if you buy, hold, and sell shares of the Fund. You may pay other fees, such as brokerage commissions and other fees to financial intermediaries, which are not reflected in the table and example below.
Shareholder Fees - Riverbridge Growth Fund - USD ($) |
Investor Class Shares |
Institutional Class Shares |
|---|---|---|
| Maximum sales charge (load) imposed on purchases | none | none |
| Maximum deferred sales charge (load) | none | none |
| Redemption fee if redeemed within 90 days of purchase (as a percentage of amount redeemed) | 1.00% | 1.00% |
| Wire fee | $ 20 | $ 20 |
| Overnight check delivery fee | 25 | 25 |
| Retirement account fees (annual maintenance fee) | $ 15 | $ 15 |
Annual Fund Operating Expenses - Riverbridge Growth Fund |
Investor Class Shares |
Institutional Class Shares |
|
|---|---|---|---|
| Management fees | 0.75% | 0.75% | |
| Distribution and service (Rule 12b-1) fees | 0.25% | none | |
| Other expenses | 0.29% | 0.29% | |
| Shareholder service fees | 0.07% | 0.07% | |
| All other expenses | 0.22% | 0.22% | |
| Total annual fund operating expenses | 1.29% | 1.04% | |
| Fees waived and/or expenses reimbursed | [1] | (0.08%) | (0.08%) |
| Total annual fund operating expenses after waiving fees and/or reimbursing expenses | [1] | 1.21% | 0.96% |
| [1] | The Fund’s advisor has contractually agreed to waive its fees and/or pay for operating expenses of the Fund to ensure that total annual fund operating expenses (excluding any taxes, leverage interest, brokerage commissions, dividend and interest expenses on short sales, acquired fund fees and expenses (as determined in accordance with SEC Form N-1A), expenses incurred in connection with any merger or reorganization and extraordinary expenses such as litigation expenses) do not exceed 1.21% and 0.96% of the average daily net assets of the Fund’s Investor Class and Institutional Class shares, respectively. This agreement is in effect through March 31, 2026, and it may be terminated before that date only by the Trust’s Board of Trustees. The Fund’s advisor is permitted to seek reimbursement from the Fund, subject to certain limitations, of fees waived or payments made to the Fund for a period ending three full fiscal years after the date of the waiver or payment. This reimbursement may be requested from the Fund if the reimbursement will not cause the Fund’s annual expense ratio to exceed the lesser of (a) the expense limitation in effect at the time such fees were waived or payments made, or (b) the expense limitation in effect at the time of the reimbursement. |
This example is intended to help you compare the cost of investing in the Fund with the cost of investing in other mutual funds.
The example assumes that you invest $10,000 in the Fund for the time periods indicated and then redeem all of your shares at the end of those periods. The example also assumes that your investment has a 5% return each year and that the Fund’s operating expenses remain the same. The example reflects the Fund’s contractual fee waiver and/or expense reimbursement only for the term of the contractual fee waiver and/or expense reimbursement.
Although your actual costs may be higher or lower, based on these assumptions your costs would be:
Expense Example - Riverbridge Growth Fund - USD ($) |
One Year |
Three Years |
Five Years |
Ten Years |
|---|---|---|---|---|
| Investor Class Shares | 123 | 401 | 700 | 1,549 |
| Institutional Class Shares | 98 | 323 | 566 | 1,264 |
The Fund pays transaction costs, such as commissions, when it buys and sells securities (or “turns over” its portfolio). A higher portfolio turnover may indicate higher transaction costs and may result in higher taxes when Fund shares are held in a taxable account. These costs, which are not reflected in annual fund operating expenses or in the example, affect the Fund’s performance. During the most recent fiscal year, the Fund’s portfolio turnover rate was 6% of the average value of its portfolio.
Under normal circumstances, the Fund invests in equity securities of companies of any size, including small- and mid-capitalization companies. The Fund’s investments in equity securities may include common stock, preferred stock and convertible securities. While the Fund invests primarily in equity securities of U.S. issuers, it may invest in securities of non-U.S. issuers. The Fund’s investments in foreign securities are primarily comprised of U.S. dollar-denominated securities of foreign issuers traded in the United States and American Depositary Receipts (“ADRs”). ADRs are receipts that represent interests in foreign securities held on deposit by U.S. banks. The Fund will invest in a portfolio of securities typically spread across many economic sectors, although from time to time, the Fund may have a significant portion of its assets in one or more market sectors such as the information technology sector. The Fund’s advisor seeks to diversify the Fund’s exposure to earnings catalysts (e.g. consumer spending, U.S. healthcare reimbursement and energy pricing) rather than limit the Fund’s exposure to individual market sectors.
The Fund’s advisor believes that earnings power determines the value of a franchise. The Fund’s advisor focuses on companies that it views as building their earnings power and building their intrinsic, or actual, values over long periods of time. The Fund’s advisor uses a bottom-up approach that seeks to identify high quality growth companies that demonstrate the ability to sustain strong secular earnings growth, regardless of overall economic conditions.
The bar chart and table below provide some indication of the risks of investing in the Fund by showing changes in the Fund’s performance from year to year for Institutional Class Shares and by showing how the average annual total returns of each class of the Fund compare with the average annual total returns of the S&P 500 Index, the Fund’s broad-based securities market index, and the Russell 3000 Growth Index, the Fund’s secondary benchmark index that more closely represents the investment exposure sought by the Fund. Performance for classes other than those shown may vary from the performance shown to the extent the expenses for those classes differ. Updated performance information is available at the Fund’s website, www.riverbridge.com, or by calling the Fund at 1-888-447-4470. The Fund’s past performance, before and after taxes, is not necessarily an indication of how the Fund will perform in the future.
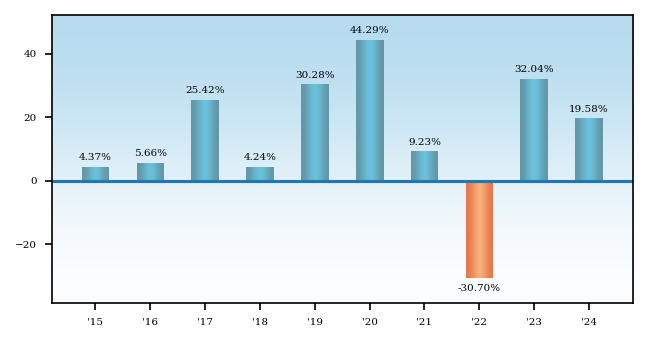
| Institutional Class Shares | ||
| Highest Calendar Quarter Return at NAV | 27.48% | Quarter Ended 06/30/2020 |
| Lowest Calendar Quarter Return at NAV | (20.70)% | Quarter Ended 06/30/2022 |
Average Annual Returns - Riverbridge Growth Fund |
Label |
One Year |
Five Years |
Ten Years |
|||
|---|---|---|---|---|---|---|---|
| Institutional Class Shares | Institutional Class Shares – Return Before Taxes | 19.58% | 11.51% | 12.47% | |||
| Institutional Class Shares | Institutional Class Shares – Return After Taxes on Distributions | Institutional Class Shares – Return After Taxes on Distributions | 18.98% | [1] | 11.02% | [1] | 11.84% | [1] |
| Institutional Class Shares | Institutional Class Shares – Return After Taxes on Distributions and Sale of Fund Shares | Institutional Class Shares – Return After Taxes on Distributions and Sale of Fund Shares | 12.04% | [1] | 9.15% | [1] | 10.25% | [1] |
| Investor Class Shares | Investor Class Shares – Return Before Taxes | 19.29% | 11.24% | 12.22% | |||
| S&P 500 Index (Reflects No Deductions for Fees, Expenses or Taxes) | S&P 500 Index (Reflects No Deductions for Fees, Expenses or Taxes) | 25.02% | 14.53% | 13.10% | |||
| Russell 3000 Growth Index (Reflects No Deductions for Fees, Expenses or Taxes) | Russell 3000 Growth Index (Reflects No Deductions for Fees, Expenses or Taxes) | 32.46% | 18.25% | 16.22% | |||
| [1] | After-tax returns are calculated using the historical highest individual federal marginal income tax rates and do not reflect the impact of state and local taxes. Actual after-tax returns depend on an investor’s tax situation and may differ from those shown. After-tax returns shown are not relevant to investors who hold their Fund shares through tax-deferred arrangements, such as 401(k) plans or individual retirement accounts. After-tax returns are shown for Institutional Class Shares only and after-tax returns for classes other than Institutional Class will vary from returns shown for Institutional Class. |