The ETC 6 Meridian Quality Growth ETF (the “Fund”) seeks capital appreciation.
This table describes the fees and expenses that you may pay if you buy, hold, and sell shares of the Fund. You may pay other fees, such as brokerage commissions and other fees to financial intermediaries, which are not reflected in the table and Example below.
Annual Fund Operating Expenses |
ETC 6 Meridian Quality Growth ETF
ETC 6 Meridian Quality Growth ETF
|
|
|---|---|---|
| Management Fee | 0.31% | |
| Distribution and Service (12b-1) Fees | none | |
| Other Expenses | 0.39% | |
| Total Annual Fund Operating Expenses | 0.70% | [1] |
| [1] | Fees have been restated to reflect current year fees. |
This Example is intended to help you compare the cost of investing in the Fund with the cost of investing in other funds. The Example assumes that you invest $10,000 in the Fund for the time periods indicated and then sell all of your shares at the end of those periods. The Example also assumes that your investment has a 5% return each year and that the Fund’s operating expenses remain the same (after taking into account the fee waiver for the first year of each period). Although your actual costs may be higher or lower, based on these assumptions your cost would be:
Expense Example |
1 Year |
3 Years |
5 Years |
10 Years |
|---|---|---|---|---|
| ETC 6 Meridian Quality Growth ETF | ETC 6 Meridian Quality Growth ETF | USD ($) | 72 | 224 | 390 | 871 |
The Fund pays transaction costs, such as commissions, when it buys and sells securities (or “turns over” its portfolio). A higher portfolio turnover rate may indicate higher transaction costs and may result in higher taxes when shares of the Fund are held in a taxable account. These costs, which are not reflected in annual fund operating expenses or in the Example above, affect the Fund’s performance. For the fiscal year ended November 30, 2024, the Fund’s portfolio turnover rate was 74% of the average value of its portfolio.
The Fund is an actively managed exchange-traded fund (“ETF”) that seeks to achieve its investment objective primarily by investing in equity securities. The Fund invests mainly in common stocks and may invest in the securities of companies of any capitalization.
In selecting investments for the Fund, Madison Avenue Financial Solutions, LLC, the Fund’s sub-adviser (the “Sub-Adviser”), uses a quantitatively-driven strategy designed to emphasize securities of companies that exhibit high quality and growth characteristics relative to their peers. Quality is defined as high and improving profitability, low leverage and low default probability, and low net equity and debt issuance relative to dividends and net buybacks. From an initial universe consisting of companies in the broad U.S. equity market, the Sub-Adviser excludes micro-cap companies (i.e., companies with a market capitalization of less than $500 million) and securities of companies that exhibit poor liquidity and momentum characteristics. Liquidity is measured as average dollar volume traded relative to the average shares outstanding, where the highest values are least favorable. Momentum is measured as the trailing 12-month price return excluding the most recent month, where the lowest values are least favorable. The Sub-Adviser ranks the remaining securities based on a composite of several quality-focused variables intended to measure profitability, growth, and ability to service financing obligations, and securities ranking the highest on this composite measure are considered for inclusion in the Fund. The Fund’s holdings are market cap weighted with a maximum individual weight for each holding of 5% at the time of purchase.
While investing in a particular market sector is not a strategy of the Fund, its portfolio may be significantly invested in one or more sectors as a result of the security selection decisions made pursuant to its strategy. Currently, the Fund expects to invest a significant portion of its assets in the securities of companies in the Information Technology Sector, although this may change from time to time.
The Fund is non-diversified and may invest a greater percentage of its assets in a particular issuer than a diversified fund.
The following bar chart and table provide some indication of the risks of investing in the Fund by showing changes in the Fund’s performance from year to year and by showing how the Fund’s average annual returns for certain time periods compare with the average annual total returns of the S&P 500® Index, a broad-based market index, and Russell 1000® Growth Index. All returns assume reinvestment of dividends and distributions. The Fund’s past performance (before and after taxes) is not necessarily an indication of how the Fund will perform in the future. Updated performance information is available online at www.6meridianfunds.com/sxqg or by calling toll-free 866-SIXM-ETF (749-6383).
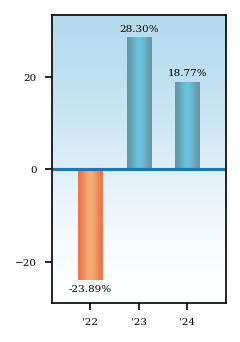
Best and Worst Quarter Returns (for the period reflected in the bar chart above)
| Return | Quarter/Year | |
| Highest Return | 13.00% | Q4/2023 |
| Lowest Return | -17.46% | Q2/2022 |
Average Annual Returns - ETC 6 Meridian Quality Growth ETF |
Label |
1 Year |
Since Inception |
Inception Date |
|---|---|---|---|---|
| ETC 6 Meridian Quality Growth ETF | Return Before Taxes | 18.77% | 7.51% | May 10, 2021 |
| ETC 6 Meridian Quality Growth ETF | Return After Taxes on Distributions | Return After Taxes on Distributions | 18.77% | 7.50% | May 10, 2021 |
| ETC 6 Meridian Quality Growth ETF | Return After Taxes on Distributions and Sale of Fund Shares | Return After Taxes on Distributions and Sale of Fund Shares | 11.11% | 5.84% | May 10, 2021 |
| S&P 500® Index (reflects no deduction for fees, expenses, or taxes) | S&P 500® Index (reflects no deduction for fees, expenses, or taxes) | 25.02% | 11.45% | May 10, 2021 |
| Russell 1000® Growth Index (reflects no deduction for fees, expenses, or taxes) | Russell 1000® Growth Index (reflects no deduction for fees, expenses, or taxes) | 33.36% | 14.64% | May 10, 2021 |
After-tax returns are calculated using the highest historical individual federal marginal income tax rates and do not reflect the impact of state and local taxes. Your actual after-tax returns will depend on your tax situation and may differ from those shown. After-tax returns shown are not relevant to investors who hold their shares of the Fund through tax-deferred arrangements, such as 401(k) plans or IRAs. In some cases, the return after taxes may exceed the return before taxes due to an assumed tax benefit from any losses on a sale of shares of the Fund at the end of the measurement period.