Pay vs Performance Disclosure
|
12 Months Ended |
|
Dec. 31, 2024
USD ($)
|
|---|
| Pay vs Performance Disclosure |
|
| Pay vs Performance Disclosure, Table |
| | | | | | | | | | | | | | | | | | | | | | | | | | | | | | Year1 | Summary Compensation Table Total Compensation for Principal Executive Officer (PEO)2 ($) | Compensation Actually Paid to PEO3 ($) | Average Summary Compensation Table Total Compensation for Non-PEO Named Executive Officers4 ($) | Average Compensation Actually Paid to Non-PEO Named Executive Officers5 ($) | Value of initial fixed $100 investment based on: | Net Income8 (in thousands) ($) | Company Selected Measure - EBITDA, as Adjusted9 (in thousands) ($) | Total Stockholder Return6 ($) | Peer Group Total Stockholder Return7 ($) | | 2024 | 2,793,546 | | 5,065,950 | | 985,804 | | 1,345,531 | | 125.26 | | 101.69 | | 143,421 | | 241,440 | |
|
| Named Executive Officers, Footnote |
Our PEO for 2024 was Jeffrey S. Thiede. Our non-PEO named executive officers for 2024 were Maximillian J Marcy, Thomas D. Nosbusch, Paul R. Sanderson and Jon B. Hunke.
|
| Peer Group Issuers, Footnote |
Represents the value of $100 invested in the company’s peer group on November 1, 2024 (the date we became an independent publicly traded company) assuming dividends are reinvested in each component issuer’s company stock in the peer group at the frequency paid. For purposes of this disclosure for 2024, our peer group was selected by our management that includes public companies within our industry. The companies in the peer group were selected to represent a broad group of publicly held corporations with operations similar to ours, and includes Comfort Systems USA, Inc., EMCOR Group Inc., IES Holdings, Inc., MYR Group, Inc., MasTec, Inc., Primoris Services Corporation and Quanta Services (Peer Group). This Peer Group is the same peer group used in the stock performance graph required by Item 201(e) of Regulation S-K included in our 2024 Annual Report on Form 10-K. For purposes of calculating the Peer Group total stockholder return, the total stockholder returns of each component issuer of the group were weighted according to the respective issuers’ stock market capitalization on November 1, 2024.
|
| PEO Total Compensation Amount |
$ 2,793,546
|
| PEO Actually Paid Compensation Amount |
$ 5,065,950
|
| Adjustment To PEO Compensation, Footnote |
To arrive at 2024 CAP for Mr. Thiede, total compensation as reported in the SCT was adjusted for the following: | | | | | | | | | | | | | | | | | | | | | | SCT Total Compensation for the PEO | $ | 2,793,546 | | | less: Reported Value of Stock Awards in the SCTa | (1,152,171) | | | plus: Year-end Fair Value of Equity Awards Granted in the Year that are Unvested | 2,017,958 | | | plus: Year-over-Year Change in Fair Value of Equity Awards Granted in Prior Years that are Unvested | 761,832 | | | | | | plus: Year-over-Year Change in Fair Value of Equity Awards Granted in Prior Years that Vested in the Year | 644,785 | | | | | | | | | | | | | | | CAP for the PEO | $ | 5,065,950 | | | |
|
| Non-PEO NEO Average Total Compensation Amount |
$ 985,804
|
| Non-PEO NEO Average Compensation Actually Paid Amount |
$ 1,345,531
|
| Adjustment to Non-PEO NEO Compensation Footnote |
To arrive at the Average 2024 CAP for our non-PEO named executive officers, total compensation as reported in the SCT was adjusted for the following: | | | | | | | | | | | | | | | | | | | | | | | | | | | | | Average of SCT Total Compensation for Non-PEO Named Executive Officers | $ | 985,804 | | | less: Reported Value of Stock Awards in the SCTa | (227,421) | | | plus: Year-end Fair Value of Equity Awards Granted in the Year that are Unvested | 398,300 | | | plus: Year-over-Year Change in Fair Value of Equity Awards Granted in Prior Years that are Unvested | 133,823 | | | | | | plus: Year-over-Year Change in Fair Value of Equity Awards Granted in Prior Years that Vested in the Year | 55,025 | | | | | | | | | | | | | | | Average CAP for the Non-PEO Named Executive Officers | $ | 1,345,531 | | | |
|
| Compensation Actually Paid vs. Total Shareholder Return |
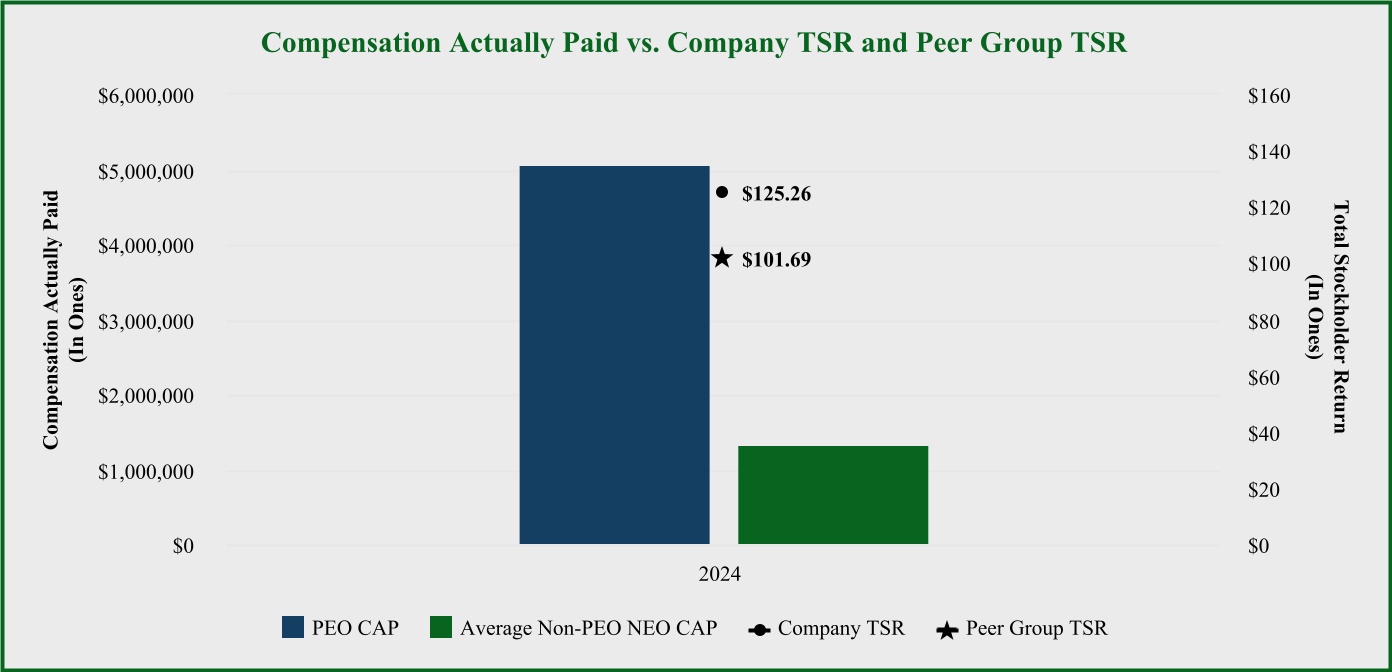
CAP vs. TSR The following chart depicts the PEO and average non-PEO named executive officer CAP compared to the company’s TSR and the Peer Group’s TSR as of December 31, 2024. The calculations of the company’s TSR and the Peer Group’s TSR are described above in footnotes 6 and 7 to the PEO and the average non-PEO named executive officer CAP tables above.
|
| Compensation Actually Paid vs. Net Income |
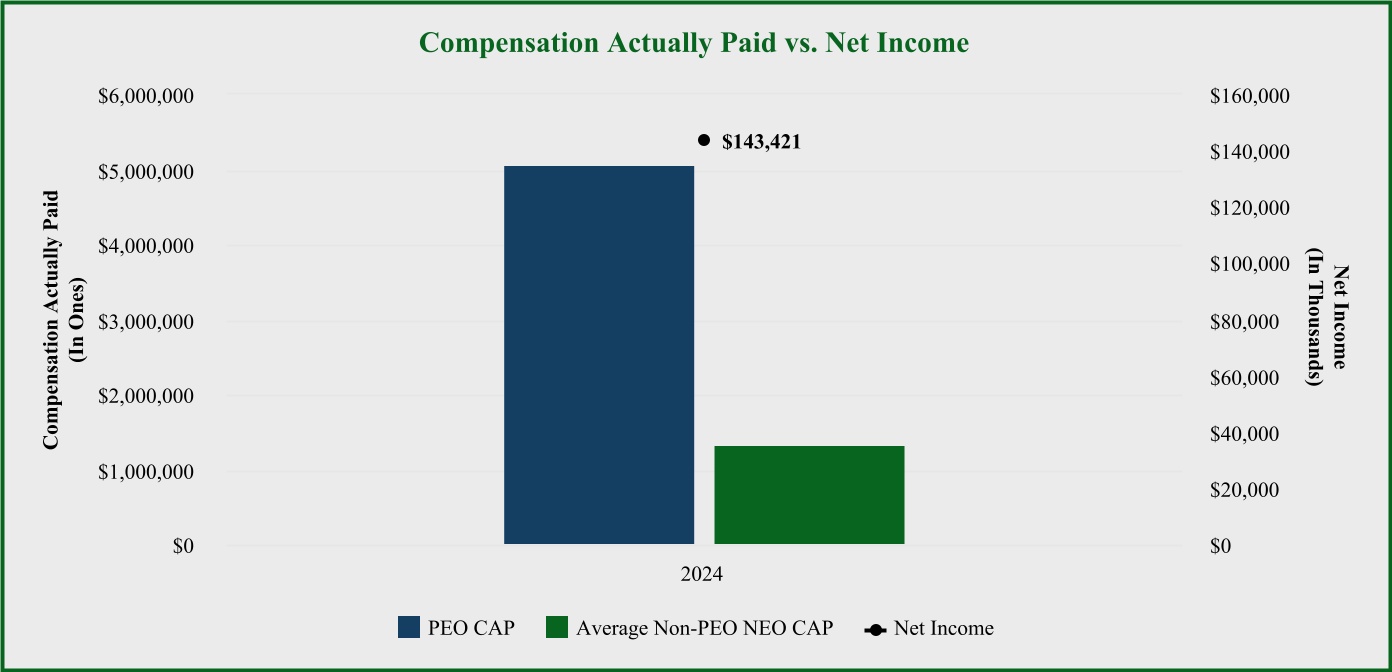
CAP vs. Net Income The following chart depicts the PEO and average non-PEO named executive officer CAP compared to the company’s net income for 2024.
|
| Compensation Actually Paid vs. Company Selected Measure |
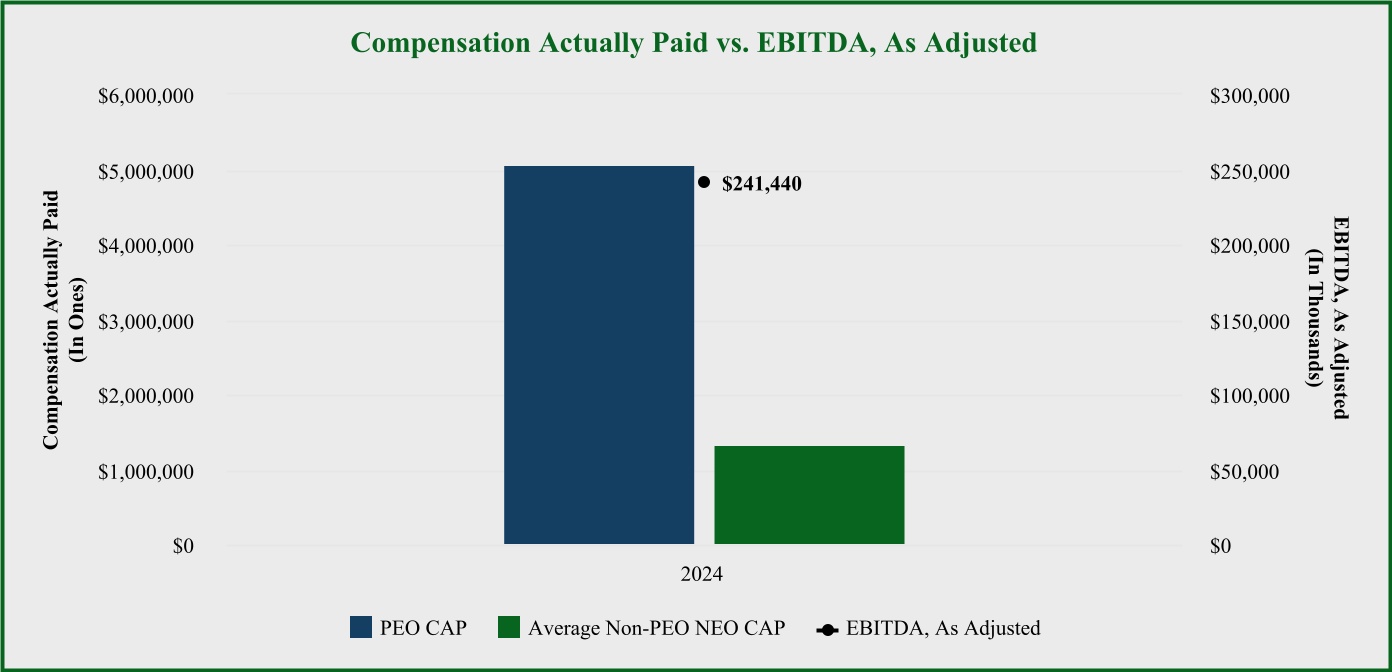
CAP vs. EBITDA, As Adjusted The following chart depicts the PEO and average non-PEO named executive officer CAP compared to the company’s EBITDA, as adjusted, for 2024.
|
| Total Shareholder Return Vs Peer Group |
CAP vs. TSR The following chart depicts the PEO and average non-PEO named executive officer CAP compared to the company’s TSR and the Peer Group’s TSR as of December 31, 2024. The calculations of the company’s TSR and the Peer Group’s TSR are described above in footnotes 6 and 7 to the PEO and the average non-PEO named executive officer CAP tables above.
|
| Tabular List, Table |
| | | | | Performance Metrics Most Closely Linked to CAP for 2024 | | Net income | | EBITDA, as adjusted | | Combined MDU Resources Business Segment Earnings, as adjusted | | | | |
|
| Total Shareholder Return Amount |
$ 125.26
|
| Peer Group Total Shareholder Return Amount |
101.69
|
| Net Income (Loss) |
$ 143,421,000
|
| Company Selected Measure Amount |
241,440,000
|
| PEO Name |
Jeffrey S. Thiede
|
| Additional 402(v) Disclosure |
As required by Section 953(a) of the Dodd-Frank Wall Street Reform and Consumer Protection Act and Item 402(v) of Regulation S-K, we are providing information regarding the Compensation Actually Paid (CAP), as defined by SEC rules, to our named executive officers versus company financial performance. As permitted by SEC rules, we are providing such disclosure for only 2024, because we were not a reporting company pursuant to Section 13(a) or 15(d) of the Exchange Act prior to such year. The CAP amounts shown in the table below do not reflect the actual amount of compensation earned by or paid to our named executive officers during the applicable year. Please refer to the “Compensation Discussion and Analysis” section in this Proxy Statement for a complete description of how executive compensation relates to company performance and how the compensation committee makes its decisions. Represents Mr. Thiede’s total compensation as shown in the Summary Compensation Table (SCT) for 2024.Represents the average total compensation of our non-PEO named executive officers as shown in the SCT for 2024.Represents value of $100 invested in company stock on November 1, 2024 (the date we became an independent publicly traded company) assuming dividends are reinvested in company stock at the frequency paid.Represents GAAP Net income reported for the company in 2024. Net income for periods prior to the Separation was attributable to MDU Resources’ construction services segment.2024 Most Important Financial Measures The financial performance measures identified as the most important measures used by the company to link PEO and non-PEO named executive officer 2024 CAP to company performance are listed below in unranked order each of which is described in more detail in the “Compensation Discussion and Analysis.” Descriptions of the Information Presented in the Pay Versus Performance Table We are providing the following graphics to illustrate the relationship between our PEO CAP and our non-PEO named executive officers’ CAP as a group and company performance, as set forth and described in and under the “Pay Versus Performance” table, including the company’s net income and EBITDA, as adjusted. In addition, we are providing a graphic to illustrate the relationship between the company’s total stockholder return (TSR) and our Peer Group’s TSR.
|
| Measure:: 1 |
|
| Pay vs Performance Disclosure |
|
| Name |
Net income
|
| Measure:: 2 |
|
| Pay vs Performance Disclosure |
|
| Name |
EBITDA, as adjusted
|
| Non-GAAP Measure Description |
EBITDA is a non-GAAP financial measure and is calculated by adding back interest expense, income taxes, depreciation and amortization to net income. EBITDA, as adjusted, is a non-GAAP financial measure and is defined as EBITDA, with adjustments for specific situations approved by the compensation committee. Potential adjustments include the effect on EBITDA from asset sales, dispositions or retirements; effect on EBITDA from transaction costs incurred for acquisitions, divestitures, mergers, spin-offs, or other strategic transactions, including differences in interest costs from those assumed in the company’s original plan; the effect on EBITDA from withdrawal liabilities relating to multiemployer pension plans; effect on EBITDA of corporate overhead allocation difference; and the effect on EBITDA of approved retention agreement costs which differ from costs included in the company’s original plan.
|
| Measure:: 3 |
|
| Pay vs Performance Disclosure |
|
| Name |
Combined MDU Resources Business Segment Earnings, as adjusted
|
| PEO | Aggregate Grant Date Fair Value of Equity Award Amounts Reported in Summary Compensation Table |
|
| Pay vs Performance Disclosure |
|
| Adjustment to Compensation, Amount |
$ (1,152,171)
|
| PEO | Year-end Fair Value of Equity Awards Granted in Covered Year that are Outstanding and Unvested |
|
| Pay vs Performance Disclosure |
|
| Adjustment to Compensation, Amount |
2,017,958
|
| PEO | Year-over-Year Change in Fair Value of Equity Awards Granted in Prior Years That are Outstanding and Unvested |
|
| Pay vs Performance Disclosure |
|
| Adjustment to Compensation, Amount |
761,832
|
| PEO | Change in Fair Value as of Vesting Date of Prior Year Equity Awards Vested in Covered Year |
|
| Pay vs Performance Disclosure |
|
| Adjustment to Compensation, Amount |
644,785
|
| Non-PEO NEO | Aggregate Grant Date Fair Value of Equity Award Amounts Reported in Summary Compensation Table |
|
| Pay vs Performance Disclosure |
|
| Adjustment to Compensation, Amount |
(227,421)
|
| Non-PEO NEO | Year-end Fair Value of Equity Awards Granted in Covered Year that are Outstanding and Unvested |
|
| Pay vs Performance Disclosure |
|
| Adjustment to Compensation, Amount |
398,300
|
| Non-PEO NEO | Year-over-Year Change in Fair Value of Equity Awards Granted in Prior Years That are Outstanding and Unvested |
|
| Pay vs Performance Disclosure |
|
| Adjustment to Compensation, Amount |
133,823
|
| Non-PEO NEO | Change in Fair Value as of Vesting Date of Prior Year Equity Awards Vested in Covered Year |
|
| Pay vs Performance Disclosure |
|
| Adjustment to Compensation, Amount |
$ 55,025
|