| FREE WRITING PROSPECTUS | ||
| FILED PURSUANT TO RULE 433 | ||
| REGISTRATION FILE NO.: 333-276033-09 | ||
| Dated April 22, 2025 | BBCMS 2025-5C34 |
|
Free Writing Prospectus Structural and Collateral Term Sheet | ||
|
BBCMS Mortgage Trust 2025-5C34
| ||
|
$783,141,474 (Approximate Mortgage Pool Balance) | ||
|
$689,164,000 (Approximate Offered Certificates) | ||
|
Barclays Commercial Mortgage Securities LLC Depositor | ||
|
Commercial Mortgage Pass-Through Certificates, Series 2025-5C34 | ||
|
Barclays Capital Real Estate Inc. Citi Real Estate Funding Inc. Argentic Real Estate Finance 2 LLC UBS AG KeyBank National Association Starwood Mortgage Capital LLC German American Capital Corporation BSPRT CMBS Finance, LLC Mortgage Loan Sellers
| ||
| Barclays | Citigroup | Deutsche Bank Securities |
| KeyBanc Capital Markets | UBS Securities LLC | |
| Co-Lead Managers and Joint Bookrunners | ||
| Bancroft
Capital, LLC Co-Manager |
Drexel Hamilton Co-Manager | |
THE INFORMATION IN THIS STRUCTURAL AND COLLATERAL TERM SHEET IS NOT COMPLETE AND MAY BE AMENDED PRIOR TO THE TIME OF SALE. THIS TERM SHEET IS NOT AN OFFER TO SELL THESE SECURITIES AND IT IS NOT A SOLICITATION OF AN OFFER TO BUY THESE SECURITIES IN ANY JURISDICTION WHERE THE OFFER OR SALE IS NOT PERMITTED. | ||
| Dated April 22, 2025 | BBCMS 2025-5C34 |
This material is for your information, and none of Barclays Capital Inc., Deutsche Bank Securities Inc., KeyBanc Capital Markets Inc., UBS Securities LLC, Citigroup Global Markets Inc., Drexel Hamilton, LLC and Bancroft Capital, LLC (the “Underwriters”) are soliciting any action based upon it. This material is not to be construed as an offer to sell or the solicitation of any offer to buy any security in any jurisdiction where such an offer or solicitation would be illegal.
The depositor has filed a registration statement (including the prospectus) with the Securities and Exchange Commission (File No. 333-276033-09) for the offering to which this communication relates. Before you invest, you should read the prospectus in the registration statement and other documents the depositor has filed with the Securities and Exchange Commission for more complete information about the depositor, the issuing entity and this offering. You may get these documents for free by visiting EDGAR on the SEC website at www.sec.gov. Alternatively, the depositor or Barclays Capital Inc., any other underwriter, or any dealer participating in this offering will arrange to send you the prospectus if you request it by calling 1-888-603-5847. The Offered Certificates referred to in these materials, and the asset pool backing them, are subject to modification or revision (including the possibility that one or more Classes of Certificates may be split, combined or eliminated at any time prior to issuance or availability of a final prospectus) and are offered on a “when, as and if issued” basis. You understand that, when you are considering the purchase of these Certificates, a contract of sale will come into being no sooner than the date on which the relevant Class has been priced and we have verified the allocation of Certificates to be made to you; any “indications of interest” expressed by you, and any “soft circles” generated by us, will not create binding contractual obligations for you or us.
Neither this document nor anything contained in this document shall form the basis for any contract or commitment whatsoever. The information contained in this document is preliminary as of the date of this document, supersedes any previous such information delivered to you and will be superseded by any such information subsequently delivered prior to the time of sale. These materials are subject to change, completion or amendment from time to time. The information should be reviewed only in conjunction with the entire offering document relating to the Commercial Mortgage Pass-Through Certificates, Series 2025-5C34 (the “Offering Document”). All of the information contained herein is subject to the same limitations and qualifications contained in the Offering Document. The information contained herein does not contain all relevant information relating to the underlying mortgage loans or mortgaged properties. Such information is described elsewhere in the Offering Document. The information contained herein will be more fully described elsewhere in the Offering Document. The information contained herein should not be viewed as projections, forecasts, predictions or opinions with respect to value. Prior to making any investment decision, prospective investors are strongly urged to read the Offering Document its entirety. Neither the Securities and Exchange Commission nor any state securities commission has approved or disapproved of these securities or determined if this free writing prospectus is truthful or complete. Any representation to the contrary is a criminal offense.
This document has been prepared by the Underwriters for information purposes only and does not constitute, in whole or in part, a prospectus for the purposes of Regulation (EU) 2017/1129 (as amended or superseded) and/or Part VI of the Financial Services and Markets Act 2000 (as amended) or other offering document.
The attached information contains certain tables and other statistical analyses (the “Computational Materials”) which have been prepared in reliance upon information furnished by the Mortgage Loan Sellers. Numerous assumptions were used in preparing the Computational Materials, which may or may not be reflected herein. As such, no assurance can be given as to the Computational Materials’ accuracy, appropriateness or completeness in any particular context; or as to whether the Computational Materials and/or the assumptions upon which they are based reflect present market conditions or future market performance. The Computational Materials should not be construed as either projections or predictions or as legal, tax, financial or accounting advice. You should consult your own counsel, accountant and other advisors as to the legal, tax, business, financial and related aspects of a purchase of these securities. Any weighted average lives, yields and principal payment periods shown in the Computational Materials are based on prepayment and/or loss assumptions, and changes in such prepayment and/or loss assumptions may dramatically affect such weighted average lives, yields and principal payment periods. In addition, it is possible that prepayments or losses on the underlying assets will occur at rates higher or lower than the rates shown in the attached Computational Materials. The specific characteristics of the securities may differ from those shown in the Computational Materials due to differences between the final underlying assets and the preliminary underlying assets used in preparing the Computational Materials. The principal amount and designation of any security described in the Computational Materials are subject to change prior to issuance. None of the Underwriters or any of their respective affiliates make any representation or warranty as to the actual rate or timing of payments or losses on any of the underlying assets or the payments or yield on the securities. The information in this presentation is based upon management forecasts and reflects prevailing conditions and management’s views as of this date, all of which are subject to change. In preparing this presentation, we have relied upon and assumed, without independent verification, the accuracy and completeness of all information available from public sources or which was provided to us by or on behalf of the Mortgage Loan Sellers or which was otherwise reviewed by us.
This document contains forward-looking statements. If and when included in this document, the words “expects”, “intends”, “anticipates”, “estimates” and analogous expressions and all statements that are not historical facts, including statements about our beliefs or expectations, are intended to identify forward-looking statements. Any forward-looking statements are made subject to risks and uncertainties which could cause actual results to differ materially from those stated. Those risks and uncertainties include, among other things, declines in general economic and business conditions, increased competition, changes in demographics, changes in political and social conditions, regulatory initiatives and changes in consumer preferences, many of which are beyond our control and the control of any other person or entity related to this offering. The forward-looking statements made in this document are made as of the date hereof. We have no obligation to update or revise any forward-looking statement.
IMPORTANT NOTICE RELATING TO AUTOMATICALLY-GENERATED EMAIL DISCLAIMERS
Any legends, disclaimers or other notices that may appear at the bottom of any email communication to which this document is attached relating to (1) these materials not constituting an offer (or a solicitation of an offer), (2) no representation that these materials are accurate or complete and may not be updated or (3) these materials possibly being confidential, are not applicable to these materials and should be disregarded. Such legends, disclaimers or other notices have been automatically generated as a result of these materials having been sent via Bloomberg or another system.
THE CERTIFICATES REFERRED TO IN THESE MATERIALS ARE SUBJECT TO MODIFICATION OR REVISION (INCLUDING THE POSSIBILITY THAT ONE OR MORE CLASSES OF CERTIFICATES MAY BE SPLIT, COMBINED OR ELIMINATED AT ANY TIME PRIOR TO ISSUANCE OR AVAILABILITY OF A FINAL PROSPECTUS) AND ARE OFFERED ON A “WHEN, AS AND IF ISSUED” BASIS.
THE UNDERWRITERS MAY FROM TIME TO TIME PERFORM INVESTMENT BANKING SERVICES FOR, OR SOLICIT INVESTMENT BANKING BUSINESS FROM, ANY COMPANY NAMED IN THESE MATERIALS. THE UNDERWRITERS AND/OR THEIR AFFILIATES OR RESPECTIVE EMPLOYEES MAY FROM TIME TO TIME HAVE A LONG OR SHORT POSITION IN ANY CERTIFICATE OR CONTRACT DISCUSSED IN THESE MATERIALS.
THE INFORMATION IN THIS STRUCTURAL AND COLLATERAL TERM SHEET IS NOT COMPLETE AND MAY BE AMENDED PRIOR TO THE TIME OF SALE. THIS TERM SHEET IS NOT AN OFFER TO SELL THESE SECURITIES AND IT IS NOT A SOLICITATION OF AN OFFER TO BUY THESE SECURITIES IN ANY JURISDICTION WHERE THE OFFER OR SALE IS NOT PERMITTED. | ||
| 2 | ||
| Structural and Collateral Term Sheet | BBCMS 2025-5C34 | |
| Indicative Capital Structure | ||
Publicly Offered Certificates
| Class | Expected Ratings (Moody’s/ Fitch / Morningstar DBRS) |
Approximate Initial Certificate Balance or Notional Amount(1) | Approximate Initial Available Certificate Balance or Notional Amount(1) | Approximate Initial Retained Certificate Balance or Notional Amount(1)(2) | Approximate Initial Credit Support(3) | Expected Weighted Avg. Life (years)(4) | Expected Principal Window(4) | Certificate Principal to Value Ratio(5) | Underwritten NOI Debt Yield(6) |
| A-1 | Aaa(sf)/AAAsf/AAA(sf) | $1,329,000 | $1,300,000 | $29,000 | 30.000% | 2.57 | 6/25-2/30 | 42.3% | 15.3% |
| A-2 | Aaa(sf)/AAAsf/AAA(sf) | (7) | (7) | (7) | 30.000% | (7) | (7) | 42.3% | 15.3% |
| A-3 | Aaa(sf)/AAAsf/AAA(sf) | (7) | (7) | (7) | 30.000% | (7) | (7) | 42.3% | 15.3% |
| X-A(8) | Aaa(sf)/AAAsf/AAA(sf) | $548,199,000 | $536,631,000 | $11,568,000 | N/A | N/A | N/A | N/A | N/A |
| A-S | Aa2(sf)/AAAsf/AAA(sf) | $64,609,000 | $63,245,000 | $1,364,000 | 21.750% | 4.92 | 4/30-4/30 | 47.3% | 13.7% |
| B | NR/AA-sf/AA(high)(sf) | $43,072,000 | $42,163,000 | $909,000 | 16.250% | 4.92 | 4/30-4/30 | 50.7% | 12.8% |
| C | NR/A-sf/A(high)(sf) | $33,284,000 | $32,581,000 | $703,000 | 12.000% | 4.97 | 4/30-5/30 | 53.2% | 12.2% |
Privately Offered Certificates(9)
| Class | Expected Ratings (Moody’s/ Fitch / Morningstar DBRS) |
Approximate Initial Certificate Balance or Notional Amount(1) | Approximate Initial Available Certificate Balance or Notional Amount(1) | Approximate Initial Retained Certificate Balance or Notional Amount(1)(2) | Approximate Initial Credit Support(3) | Expected Weighted Avg. Life (years)(4) | Expected Principal Window(4) | Certificate Principal to Value Ratio(5) | Underwritten NOI Debt Yield(6) |
| X-B(10) | NR/A-sf/AA(low)(sf) | $140,965,000 | $137,989,000 | $2,976,000 | N/A | N/A | N/A | N/A | N/A |
| X-D(11) | NR/BBB-sf/A(low)(sf) | $27,410,000 | $26,831,000 | $579,000 | N/A | N/A | N/A | N/A | N/A |
| X-F(12) | NR/BB-sf/BBB(sf) | $17,621,000 | $17,249,000 | $372,000 | N/A | N/A | N/A | N/A | N/A |
| D | NR/BBBsf/A(low)(sf) | $18,600,000 | $18,207,000 | $393,000 | 9.625% | 5.01 | 5/30-5/30 | 54.7% | 11.8% |
| E | NR/BBB-sf/BBB(high)(sf) | $8,810,000 | $8,624,000 | $186,000 | 8.500% | 5.01 | 5/30-5/30 | 55.4% | 11.7% |
| F | NR/BB-sf/BBB(low)(sf) | $17,621,000 | $17,249,000 | $372,000 | 6.250% | 5.01 | 5/30-5/30 | 56.7% | 11.4% |
| G-RR | NR/B-sf/BB(sf) | $10,768,000 | $10,540,000 | $228,000 | 4.875% | 5.01 | 5/30-5/30 | 57.6% | 11.2% |
| H-RR | NR / NR / NR | $38,178,473 | $37,372,000 | $806,473 | 0.000% | 5.01 | 5/30-5/30 | 60.5% | 10.7% |
| (1) | In the case of each such Class, subject to a permitted variance of plus or minus 5%, including in connection with any variation in the certificate balances and notional amounts of the classes comprising the VRR Interest following the calculation of the actual fair value of the ABS interests (as such term is defined in Regulation RR) issued by the issuing entity. In addition, the notional amounts of the Class X-A, Class X-B, Class X-D and Class X-F Certificates may vary depending upon the final pricing of the Classes of Principal Balance Certificates whose Certificate Balances comprise such notional amounts, and, if as a result of such pricing the pass-through rate of any Class of the Class X-A, Class X-B, Class X-D and Class X-F Certificates, as applicable, would be equal to zero at all times, such Class of Certificates will not be issued on the closing date of this securitization. |
| (2) | On the Closing Date, Argentic Real Estate Finance 2 LLC (a sponsor and an affiliate of the special servicer) will act as “retaining sponsor” (as such term is defined in the Credit Risk Retention Rules) and cause a majority-owned affiliate to purchase from the underwriters and the initial purchasers the certificates (other than the Class R certificates) with the initial certificate balances or notional amounts, as applicable, as set forth in the table above under “Approximate Initial Retained Certificate Balance or Notional Amount”, as further described in “Credit Risk Retention” in the Preliminary Prospectus. The initial retained amount of each class of certificates is subject to change based on the final pricing of all certificates and is expected to be approximately 2.11000% of the certificate balance or notional amount or percentage interest, as applicable, of each class of certificates (other than the Class R Certificates) as of the Closing Date. |
| (3) | The approximate initial credit support percentages set forth for the certificates are approximate and, for the Class A-1, Class A-2 and Class A-3 Certificates, are represented in the aggregate. |
| (4) | Assumes 0% CPR / 0% CDR and a May 13, 2025 closing date. Based on modeling assumptions as described in the Preliminary Prospectus dated April 22, 2025 (the “Preliminary Prospectus”). |
| (5) | The “Certificate Principal to Value Ratio” for any Class of Principal Balance Certificates (other than the Class A-1, Class A-2 and Class A-3 Certificates) is calculated as the product of (a) the weighted average Cut-off Date LTV Ratio for the mortgage loans, and (b) a fraction, the numerator of which is the total initial Certificate Balance of such Class of Certificates and all Classes of Principal Balance Certificates senior to such Class of Certificates and the denominator of which is the total initial Certificate Balance of all of the Principal Balance Certificates. The Class A-1, Class A-2 and Class A-3 Certificate Principal to Value Ratios are calculated in the aggregate for those Classes as if they were a single Class. Investors should note, however, that excess mortgaged property value associated with a mortgage loan will not be available to offset losses on any other mortgage loan. |
| (6) | The “Underwritten NOI Debt Yield” for any Class of Principal Balance Certificates (other than the Class A-1, Class A-2 and Class A-3 Certificates) is calculated as the product of (a) the weighted average UW NOI Debt Yield for the mortgage loans and (b) a fraction, the numerator of which is the total initial Certificate Balance of all of the Classes of Principal Balance Certificates and the denominator of which is the total initial Certificate Balance of such Class of Certificates and all Classes of Principal Balance Certificates senior to such Class of Certificates. The Underwritten NOI Debt Yield for each of the Class A-1, Class A-2 and Class A-3 Certificates is calculated in the aggregate for those Classes as if they were a single Class. Investors should note, however, that net operating income from any mortgaged property supports only the related mortgage loan and will not be available to support any other mortgage loan. |
| (7) | The exact initial certificate balances of the Class A-2 and Class A-3 Certificates are unknown and will be determined based on the final pricing of those Classes of Certificates. However, the respective initial certificate balances, expected weighted average lives and expected principal windows of the Class A-2 and Class A-3 Certificates are |
THE INFORMATION IN THIS STRUCTURAL AND COLLATERAL TERM SHEET IS NOT COMPLETE AND MAY BE AMENDED PRIOR TO THE TIME OF SALE. THIS TERM SHEET IS NOT AN OFFER TO SELL THESE SECURITIES AND IT IS NOT A SOLICITATION OF AN OFFER TO BUY THESE SECURITIES IN ANY JURISDICTION WHERE THE OFFER OR SALE IS NOT PERMITTED. | ||
| 3 | ||
| Structural and Collateral Term Sheet | BBCMS 2025-5C34 | |
| Indicative Capital Structure | ||
expected to be within the applicable ranges reflected in the following chart. The aggregate initial certificate balance of the Class A-2 and Class A-3 Certificates is expected to be approximately $546,870,000, subject to a variance of plus or minus 5%.
| Class of Certificates |
Expected Range of Approximate Initial Certificate Balance | Expected Range of Approximate Initial Available Certificate Balance | Expected Range of Approximate Initial Retained Certificate Balance | Expected Range of Weighted Avg. Life (Yrs) |
Expected Range of Principal Window | |||||
| Class A-2 | $0 - $250,000,000 | $0 - $244,725,000 | $0 - $5,275,000 | N/A – 4.87 | N/A / 2/30-4/30 | |||||
| Class A-3 | $296,870,000– $546,870,000 | $290,606,000 - $535,331,000 | $6,264,000– $11,539,000 | 4.92 – 4.90 | 4/30-4/30 / 2/30-4/30 |
| (8) | The Notional Amount of the Class X-A Certificates will be equal to the aggregate of the Certificate Balances of the Class A-1, Class A-2 and Class A-3 Certificates outstanding from time to time. |
| (9) | The Classes of Certificates set forth under “Privately Offered Certificates” are not being offered by the Preliminary Prospectus or this Term Sheet. The Class S and Class R Certificates are not shown above. |
| (10) | The Notional Amount of the Class X-B Certificates will be equal to the aggregate of the Certificate Balances of the Class A-S, Class B and Class C Certificates outstanding from time to time. |
| (11) | The Notional Amount of the Class X-D Certificates will be equal to the aggregate of the Certificate Balances of the Class D and Class E Certificates outstanding from time to time. |
| (12) | The Notional Amount of the Class X-F Certificates will be equal to the Certificate Balance of the Class F Certificates outstanding from time to time. |
THE INFORMATION IN THIS STRUCTURAL AND COLLATERAL TERM SHEET IS NOT COMPLETE AND MAY BE AMENDED PRIOR TO THE TIME OF SALE. THIS TERM SHEET IS NOT AN OFFER TO SELL THESE SECURITIES AND IT IS NOT A SOLICITATION OF AN OFFER TO BUY THESE SECURITIES IN ANY JURISDICTION WHERE THE OFFER OR SALE IS NOT PERMITTED. | ||
| 4 | ||
| Structural and Collateral Term Sheet | BBCMS 2025-5C34 | |
| Summary of Transaction Terms | ||
| Securities Offered: | $689,164,000 monthly pay, multi-class, commercial mortgage REMIC Pass-Through Certificates. |
| Co-Lead Managers and Joint Bookrunners: | Barclays Capital Inc., Deutsche Bank Securities Inc., KeyBanc Capital Markets Inc., UBS Securities LLC and Citigroup Global Markets Inc. |
| Co-Managers: | Drexel Hamilton, LLC and Bancroft Capital, LLC. |
| Mortgage Loan Sellers: | Barclays Capital Real Estate Inc. (“Barclays”) (40.5%), Citi Real Estate Funding Inc. (“CREFI”) (21.8%), Argentic Real Estate Finance 2 LLC (“AREF2”) (16.0%), UBS AG, by and through its branch office at 1285 Avenue of the Americas, New York, New York (“UBS AG”) (8.4%), KeyBank National Association (“KeyBank”) (6.2%), Starwood Mortgage Capital LLC (“SMC”) (4.1%), German American Capital Corporation (“GACC”) (1.9%) and BSPRT CMBS Finance, LLC (“BSPRT”) (1.0%). |
| Master Servicer: | Trimont LLC. |
| Special Servicer: | Argentic Services Company LP. |
| Directing Certificateholder: | Argentic Securities Income USA 2 LLC. |
| Trustee: | Computershare Trust Company, National Association. |
| Certificate Administrator: | Computershare Trust Company, National Association. |
| Operating Advisor: | Pentalpha Surveillance LLC. |
| Asset Representations Reviewer: | Pentalpha Surveillance LLC. |
| Rating Agencies: | Fitch Ratings, Inc. (“Fitch”), Moody’s Investors Service, Inc. (“Moody’s”) and DBRS, Inc. (“Morningstar DBRS”). |
| U.S. Credit Risk Retention: | For a discussion on the manner in which AREF2, as retaining sponsor, intends to satisfy the U.S. credit risk retention requirements for the Certificates, see “Credit Risk Retention” in the Preliminary Prospectus. Argentic Real Estate Finance 2 LLC, the retaining sponsor, intends to cause Argentic Securities Holdings 2 Cayman Limited, a majority-owned affiliate, to retain (i) an “eligible horizontal residual interest”, in the form of certificates which will be comprised of the Class G-RR and Class H-RR certificates (other than the portion that comprises the VRR Interest) representing approximately 2.95549% of the fair value, as of the Closing Date, of all of the ABS interests issued, and (ii) an “eligible vertical interest”, in the form of certificates representing approximately 2.11000% of the certificate balance, notional amount or percentage interest of each class of Certificates (other than the Class R certificates) in a manner that satisfies the U.S. credit risk retention requirements. Under the U.S. credit risk retention rules, Argentic Real Estate Finance 2 LLC or the applicable majority-owned affiliate will be permitted to transfer the horizontal risk retention certificates to a subsequent third-party purchaser. For additional information, see “Credit Risk Retention” in the Preliminary Prospectus. |
| EU Credit Risk Retention: | The transaction is not structured to satisfy the EU risk retention and due diligence requirements. |
| Closing Date: | On or about May 13, 2025. |
| Cut-off Date: | With respect to each mortgage loan, the related due date in May 2025, or in the case of any mortgage loan that has its first due date after May 2025, the date that would have been its due date in May 2025 under the terms of that mortgage loan if a monthly debt service payment were scheduled to be due in that month. |
| Distribution Date: | The 4th business day after the Determination Date in each month, commencing in June 2025. |
| Determination Date: | 11th day of each month, or if the 11th day is not a business day, the next succeeding business day, commencing in June 2025. |
| Assumed Final Distribution Date: | The Distribution Date in May 2030 which is the latest anticipated repayment date of the Certificates. |
| Rated Final Distribution Date: | The Distribution Date in May 2058. |
| Tax Treatment: | The Publicly Offered Certificates are expected to be treated as REMIC “regular interests” for U.S. federal income tax purposes. |
| Form of Offering: | The Class A-1, Class A-2, Class A-3, Class X-A, Class A-S, Class B and Class C Certificates (the “Publicly Offered Certificates”) will be offered publicly. The Class X-B, Class X-D, Class X-F, Class D, Class E, Class F, Class G-RR, Class H-RR, Class S and Class R Certificates (the “Privately Offered Certificates” and together with the Publicly Offered Certificates, the “Certificates”) will be offered domestically to Qualified Institutional Buyers and to Institutional Accredited Investors (other than the Class R Certificates) and to institutions that are not U.S. Persons pursuant to Regulation S. |
| SMMEA Status: | The Certificates will not constitute “mortgage related securities” for purposes of SMMEA. |
| ERISA: | The Publicly Offered Certificates are expected to be ERISA eligible. |
| Optional Termination: | On any Distribution Date on which the aggregate principal balance of the pool of mortgage loans is less than 1% of the aggregate principal balance of the mortgage loans as of the Cut-off Date (solely for the purposes of this calculation, if such right is being exercised after the distribution date in May 2030 and the Uber Headquarters mortgage loan (4.3%) is still an asset of the issuing entity, then such mortgage loan will be excluded from the then-aggregate stated principal balance of the pool of mortgage loans and from the initial pool balance), certain entities specified in the Preliminary |
THE INFORMATION IN THIS STRUCTURAL AND COLLATERAL TERM SHEET IS NOT COMPLETE AND MAY BE AMENDED PRIOR TO THE TIME OF SALE. THIS TERM SHEET IS NOT AN OFFER TO SELL THESE SECURITIES AND IT IS NOT A SOLICITATION OF AN OFFER TO BUY THESE SECURITIES IN ANY JURISDICTION WHERE THE OFFER OR SALE IS NOT PERMITTED. | ||
| 5 | ||
| Structural and Collateral Term Sheet | BBCMS 2025-5C34 | |
| Summary of Transaction Terms | ||
| Prospectus will have the option to purchase all of the remaining mortgage loans (and all property acquired through exercise of remedies in respect of any mortgage loan) at the price specified in the Preliminary Prospectus. Refer to “Pooling and Servicing Agreement—Termination; Retirement of Certificates” in the Preliminary Prospectus. | |
| Minimum Denominations: | The Publicly Offered Certificates (other than the Class X-A Certificates) will be issued in minimum denominations of $10,000 and integral multiples of $1 in excess of $10,000. The Class X-A Certificates will be issued in minimum denominations of $1,000,000 and in integral multiples of $1 in excess of $1,000,000. |
| Settlement Terms: | DTC, Euroclear and Clearstream Banking. |
| Analytics: | The transaction is expected to be modeled by Intex Solutions, Inc. and Trepp, LLC and is expected to be available on Bloomberg, L.P., Trepp, LLC, BlackRock Financial Management, Inc., Interactive Data Corp., CMBS.com, Inc., Markit Group Limited, Moody’s Analytics, MBS Data, LLC, RealInsight, LSEG, DealX, KBRA Analytics, LLC, CRED iQ and Recursion Co. |
| Risk Factors: | THE CERTIFICATES INVOLVE CERTAIN RISKS AND MAY NOT BE SUITABLE FOR ALL INVESTORS. REFER TO THE “SUMMARY OF RISK FACTORS” AND “RISK FACTORS” SECTIONS OF THE PRELIMINARY PROSPECTUS. |
THE INFORMATION IN THIS STRUCTURAL AND COLLATERAL TERM SHEET IS NOT COMPLETE AND MAY BE AMENDED PRIOR TO THE TIME OF SALE. THIS TERM SHEET IS NOT AN OFFER TO SELL THESE SECURITIES AND IT IS NOT A SOLICITATION OF AN OFFER TO BUY THESE SECURITIES IN ANY JURISDICTION WHERE THE OFFER OR SALE IS NOT PERMITTED. | ||
| 6 | ||
| Collateral Term Sheet | BBCMS 2025-5C34 | |
| Collateral Characteristics | ||
|
Mortgage Loan Seller |
Number of Mortgage Loans(1) |
Number of Mortgaged Properties(1) |
Roll-up Aggregate Cut-off Date Balance |
% of IPB |
| Barclays | 10 | 18 | $317,333,333 | 40.5% |
| CREFI | 5 | 10 | $170,500,000 | 21.8% |
| AREF2 | 8 | 14 | $125,124,350 | 16.0% |
| UBS AG | 3 | 13 | $66,000,000 | 8.4% |
| KeyBank | 7 | 7 | $48,750,000 | 6.2% |
| SMC | 3 | 3 | $32,383,790 | 4.1% |
| GACC | 2 | 2 | $15,050,000 | 1.9% |
| BSPRT | 1 | 1 | $8,000,000 | 1.0% |
| Total: | 37 | 66 | $783,141,474 | 100.0% |
| Loan Pool | ||
| Initial Pool Balance (“IPB”): | $783,141,474 | |
| Number of Mortgage Loans: | 37 | |
| Number of Mortgaged Properties: | 66 | |
| Average Cut-off Date Balance per Mortgage Loan: | $21,165,986 | |
| Weighted Average Current Mortgage Rate: | 6.82666% | |
| 10 Largest Mortgage Loans as % of IPB: | 57.9% | |
| Weighted Average Remaining Term to Maturity/ARD: | 59 months | |
| Weighted Average Seasoning: | 1 month | |
| Credit Statistics | ||
| Weighted Average UW NCF DSCR(2)(3): | 1.49x | |
| Weighted Average UW NOI Debt Yield(2)(4): | 10.7% | |
| Weighted Average Cut-off Date Loan-to-Value Ratio (“LTV”)(2)(5): | 60.5% | |
| Weighted Average Maturity Date/ARD LTV(2)(5): | 60.4% | |
| Other Statistics | ||
| % of Mortgage Loans with Additional Debt: | 9.7% | |
| % of Mortgage Loans with Single Tenants(6): | 9.9% | |
| % of Mortgage Loans secured by Multiple Properties: | 24.7% | |
| Amortization | ||
| Weighted Average Original Amortization Term(7): | 345 months | |
| Weighted Average Remaining Amortization Term(7): | 344 months | |
| % of Mortgage Loans with Interest-Only: | 92.4% | |
| % of Mortgage Loans with Interest-Only followed by ARD structure: | 4.3% | |
| % of Mortgage Loans with Amortizing Balloon: | 3.4% | |
| Lockboxes(8) | ||
| % of Mortgage Loans with Springing Lockboxes: | 52.8% | |
| % of Mortgage Loans with Hard Lockboxes: | 30.1% | |
| % of Mortgage Loans with Soft Lockboxes: | 17.1% | |
| Reserves | ||
| % of Mortgage Loans Requiring Monthly Tax Reserves: | 93.7% | |
| % of Mortgage Loans Requiring Monthly Insurance Reserves: | 66.6% | |
| % of Mortgage Loans Requiring Monthly CapEx Reserves: | 88.4% | |
| % of Mortgage Loans Requiring Monthly TI/LC Reserves(9): | 61.5% | |
| (1) | The sum of the Number of Mortgage Loans and Number of Mortgaged Properties does not equal the aggregate due to certain loans being contributed by multiple loan sellers. There are two loans with multiple loan sellers being contributed to the pool comprised of two mortgaged properties, added to the count of each applicable mortgage loan seller. |
| (2) | In the case of Loan Nos. 1, 9, 11 and 12, the UW NCF DSCR, UW NOI Debt Yield, Cut-off Date LTV and Maturity Date/ARD LTV calculations include the related Pari Passu Companion Loan(s). In the case of Loan Nos. 6 and 9, the UW NCF DSCR, UW NOI Debt Yield, Cut-off Date LTV and Maturity Date/ARD LTV calculations exclude the related Subordinate Companion Loan(s) or mezzanine loan(s). |
| (3) | For the mortgage loans that are interest-only for the entire term and accrue interest on an Actual/360 basis, the Monthly Debt Service (IO) ($) was calculated as 1/12th of the product of (i) the Original Balance ($), (ii) the Interest Rate % and (iii) 365/360. |
| (4) | In the case of Loan No. 28, the UW NOI Debt Yield is based on Cut-off Date Principal Balance after netting out a holdback reserve. Please see the Annex A-1 footnotes for further details. |
| (5) | In the case of Loan Nos. 4, 11, 14, 16, 20 and 23, the Cut-off Date LTV and the Maturity Date/ARD LTV are calculated by using an appraised value based on a value other than the “as-is” assumption. Refer to “Description of the Mortgage Pool—Assessment of Property Value and Condition” and “—Appraised Value” in the Preliminary Prospectus for additional details. |
| (6) | Excludes mortgage loans that are secured by multiple properties with multiple tenants. |
| (7) | Excludes mortgage loans that are interest-only for the entire term. |
| (8) | For a more detailed description of Lockboxes, refer to “Description of the Mortgage Pool—Certain Terms of the Mortgage Loans—Mortgaged Property Accounts” in the Preliminary Prospectus. |
| (9) | Calculated only with respect to the Cut-off Date Balance of mortgage loans secured or partially secured by office, retail, mixed use, other and industrial properties. |
THE INFORMATION IN THIS STRUCTURAL AND COLLATERAL TERM SHEET IS NOT COMPLETE AND MAY BE AMENDED PRIOR TO THE TIME OF SALE. THIS TERM SHEET IS NOT AN OFFER TO SELL THESE SECURITIES AND IT IS NOT A SOLICITATION OF AN OFFER TO BUY THESE SECURITIES IN ANY JURISDICTION WHERE THE OFFER OR SALE IS NOT PERMITTED. | ||
| 7 | ||
| Structural and Collateral Term Sheet | BBCMS 2025-5C34 | |
| Collateral Characteristics | ||
| Ten Largest Mortgage Loans | ||||||||||||
| No. | Loan Name | City, State | Mortgage Loan Seller(s) | No. of Prop. |
Cut-off Date Balance | % of IPB | Square Feet / Units / Spaces / Pads | Property Type | UW
NCF DSCR(1) |
UW
NOI Debt Yield(1) |
Cut-off Date LTV(1)(2) | Maturity Date/ARD LTV(1)(2) |
| 1 | The Wave | Brooklyn, NY | CREFI | 1 | $65,000,000 | 8.3% | 136 | Multifamily | 1.27x | 7.7% | 72.0% | 72.0% |
| 2 | WallyPark SeaTac | SeaTac, WA | CREFI | 1 | $60,600,000 | 7.7% | 1,553 | Other | 1.33x | 11.5% | 50.0% | 50.0% |
| 3 | 6500 South | Dallas, TX | Barclays | 1 | $50,000,000 | 6.4% | 536 | Multifamily | 1.34x | 9.1% | 65.4% | 65.4% |
| 4 | Ross RV Park Portfolio | Various, Various | UBS AG | 11 | $48,000,000 | 6.1% | 1,534 | Manufactured Housing | 1.42x | 11.2% | 63.2% | 63.2% |
| 5 | GM Holdings Portfolio | Philadelphia, PA | Barclays | 8 | $46,000,000 | 5.9% | 187 | Multifamily | 1.33x | 9.6% | 63.4% | 63.4% |
| 6 | Up House Apartments | Farmington, CT | Barclays | 1 | $42,500,000 | 5.4% | 221 | Multifamily | 1.43x | 8.7% | 59.8% | 59.8% |
| 7 | Aladdin Airport Parking | San Diego, CA | Barclays | 1 | $40,000,000 | 5.1% | 2,300 | Other | 2.29x | 16.0% | 42.0% | 42.0% |
| 8 | Tampa Redstone Portfolio | Tampa, FL | AREF2 | 7 | $35,800,000 | 4.6% | 402,074 | Industrial | 1.24x | 9.1% | 55.3% | 55.3% |
| 9 | Uber Headquarters | San Francisco, CA | Barclays | 2 | $33,333,333 | 4.3% | 586,208 | Office | 2.47x | 14.8% | 50.7% | 50.7% |
| 10 | Avalon 8801 | Irving, TX | Barclays | 1 | $32,000,000 | 4.1% | 212 | Multifamily | 1.26x | 8.6% | 66.1% | 66.1% |
| Top 3 Total/Weighted Average | 3 | $175,600,000 | 22.4% | 1.31x | 9.4% | 62.5% | 62.5% | |||||
| Top 5 Total/Weighted Average | 22 | $269,600,000 | 34.4% | 1.33x | 9.8% | 62.8% | 62.8% | |||||
| Top 10 Total/Weighted Average | 34 | $453,233,333 | 57.9% | 1.50x | 10.4% | 59.4% | 59.4% | |||||
| Non-Top 10 Total/Weighted Average | 32 | $329,908,141 | 42.1% | 1.48x | 11.0% | 62.1% | 61.8% | |||||
| (1) | In the case of Loan Nos. 1 and 9, the UW NCF DSCR, UW NOI Debt Yield, Cut-off Date LTV and Maturity Date/ARD LTV calculations include the related Pari Passu Companion Loan(s). |
| (2) | In the case of Loan No. 4, the Cut-off Date LTV and the Maturity Date/ARD LTV are calculated by using an appraised value based on a value other than the “as-is” assumption. Refer to “Description of the Mortgage Pool—Assessment of Property Value and Condition” and “—Appraised Value” in the Preliminary Prospectus for additional details. |
THE INFORMATION IN THIS STRUCTURAL AND COLLATERAL TERM SHEET IS NOT COMPLETE AND MAY BE AMENDED PRIOR TO THE TIME OF SALE. THIS TERM SHEET IS NOT AN OFFER TO SELL THESE SECURITIES AND IT IS NOT A SOLICITATION OF AN OFFER TO BUY THESE SECURITIES IN ANY JURISDICTION WHERE THE OFFER OR SALE IS NOT PERMITTED. | ||
| 8 | ||
| Structural and Collateral Term Sheet | BBCMS 2025-5C34 | |
| Collateral Characteristics | ||
| Pari Passu Companion Loan Summary | |||||||||
No. |
Loan Name |
Mortgage Loan Seller(s) |
Trust Cut-off Date Balance |
Total Mortgage Loan Cut-off Date Balance |
Controlling Pooling/Trust & Servicing Agreement |
Master Servicer |
Special Servicer |
Related Pari Passu Loan(s) Securitizations |
Related Pari Passu Loan(s) Original Balance |
| 1 | The Wave | CREFI | $65,000,000 | $88,000,000 | BBCMS 2025-5C34 | Trimont | Argentic | Future Securitization(s) | $23,000,000 |
| 9 | Uber Headquarters | Barclays
|
$33,333,333
|
$381,533,333 |
RIDE 2025-SHRE | Midland | Torchlight | RIDE 2025-SHRE BMARK 2025-V14 Future Securitization(s) |
$298,200,000 $30,000,000 $20,000,000 |
| 11 | NJ Asden Portfolio | CREFI
|
$30,000,000
|
$90,000,000 |
(1) | (1) | (1) | Future Securitization(s) | $60,000,000 |
| 12 | Soho House Chicago |
Barclays |
$29,000,000 |
$65,000,000 |
BBCMS 2025-5C33 | KeyBank | Greystone | BBCMS 2025-5C33 | $36,000,000 |
| (1) | In the case of Loan No. 11, until the securitization of the related controlling pari passu companion loan, the related whole loan will be serviced and administered pursuant to the BBCMS 2025-5C34 pooling and servicing agreement. Upon the securitization of the related controlling pari passu companion loan, servicing of the related whole loan will shift to the servicers under the servicing agreement with respect to such future transaction, which servicing agreement will become the controlling pooling/trust and servicing agreement. The initial controlling noteholder is one of the originators of the related whole loan or an affiliate. |
THE INFORMATION IN THIS STRUCTURAL AND COLLATERAL TERM SHEET IS NOT COMPLETE AND MAY BE AMENDED PRIOR TO THE TIME OF SALE. THIS TERM SHEET IS NOT AN OFFER TO SELL THESE SECURITIES AND IT IS NOT A SOLICITATION OF AN OFFER TO BUY THESE SECURITIES IN ANY JURISDICTION WHERE THE OFFER OR SALE IS NOT PERMITTED. | ||
| 9 | ||
| Structural and Collateral Term Sheet | BBCMS 2025-5C34 | |
| Collateral Characteristics | ||
| Additional Debt Summary |
No. |
Loan Name |
Trust |
Pari Passu Companion Loan(s) Cut-off Date Balance |
Subordinate Debt Cut-off Date Balance(1) |
Total Debt Cut-off Date Balance |
Mortgage Loan UW NCF DSCR(2) |
Total Debt UW NCF DSCR |
Mortgage
Loan |
Total Debt Cut-off Date LTV |
Mortgage Loan UW NOI Debt Yield(2) |
Total Debt UW NOI Debt Yield |
| 6 | Up House Apartments | $42,500,000 | $0 | $7,500,000 | $50,000,000 | 1.43x | 1.05x | 59.8% | 70.3% | 8.7% | 7.4% |
| 9 | Uber Headquarters | $33,333,333 | $348,200,000 | $118,466,667 | $500,000,000 | 2.47x | 1.74x | 50.7% | 66.4% | 14.8% | 11.3% |
| (1) | In the case of Loan No. 6, subordinate debt represents a related mezzanine loan. In the case of Loan No. 9, subordinate debt represents related Subordinate Companion Loans. |
| (2) | Mortgage Loan UW NCF DSCR, Mortgage Loan Cut-off Date LTV and Mortgage Loan UW NOI Debt Yield calculations include any related Pari Passu Companion Loans (if applicable) but exclude any related Subordinate Companion Loan(s) and/or mezzanine loan(s). |
THE INFORMATION IN THIS STRUCTURAL AND COLLATERAL TERM SHEET IS NOT COMPLETE AND MAY BE AMENDED PRIOR TO THE TIME OF SALE. THIS TERM SHEET IS NOT AN OFFER TO SELL THESE SECURITIES AND IT IS NOT A SOLICITATION OF AN OFFER TO BUY THESE SECURITIES IN ANY JURISDICTION WHERE THE OFFER OR SALE IS NOT PERMITTED. | ||
| 10 | ||
| Structural and Collateral Term Sheet | BBCMS 2025-5C34 | |
| Collateral Characteristics | ||
| Mortgaged Properties by Type(1) |
|
Weighted Average | |||||||||
| Property Type | Property Subtype | Number of Properties | Cut-off Date Principal Balance | % of IPB | UW NCF DSCR(2)(3) |
UW NOI Debt Yield(2)(4) |
Cut-off Date LTV(2)(5) | Maturity Date/ARD LTV(2)(5) | |
| Multifamily | Garden | 11 | $205,200,000 | 26.2 | % | 1.37x | 9.6% | 65.4% | 65.4% |
| High Rise | 7 | 95,000,000 | 12.1 | 1.30x | 8.1% | 69.1% | 69.1% | ||
| Low Rise | 7 | 69,261,000 | 8.8 | 1.39x | 9.0% | 61.2% | 61.2% | ||
| Mid Rise | 4 | 33,139,000 | 4.2 | 1.29x | 9.3% | 62.7% | 62.7% | ||
| Student Housing | 1 | 16,000,000 | 2.0 | 1.25x | 8.8% | 68.7% | 68.7% | ||
| Subtotal: | 30 | $418,600,000 | 53.5 | % | 1.35x | 9.1% | 65.5% | 65.5% | |
| Other | Parking Garage | 2 | $100,600,000 | 12.8 | % | 1.71x | 13.3% | 46.8% | 46.8% |
| Subtotal: | 2 | $100,600,000 | 12.8 | % | 1.71x | 13.3% | 46.8% | 46.8% | |
| Industrial | Warehouse / Distribution | 8 | $62,800,000 | 8.0 | % | 1.44x | 10.9% | 56.9% | 56.9% |
| Flex | 1 | 9,000,000 | 1.1 | 1.30x | 10.4% | 61.6% | 61.6% | ||
| Warehouse | 1 | 5,880,000 | 0.8 | 1.50x | 12.4% | 65.8% | 65.8% | ||
| Subtotal: | 10 | $77,680,000 | 9.9 | % | 1.43x | 11.0% | 58.1% | 58.1% | |
| Manufactured Housing | RV Park | 11 | $48,000,000 | 6.1 | % | 1.42x | 11.2% | 63.2% | 63.2% |
| Subtotal: | 11 | $48,000,000 | 6.1 | % | 1.42x | 11.2% | 63.2% | 63.2% | |
| Office | CBD | 2 | $33,333,333 | 4.3 | % | 2.47x | 14.8% | 50.7% | 50.7% |
| Medical | 1 | 7,094,350 | 0.9 | 1.60x | 14.1% | 64.5% | 61.2% | ||
| Subtotal: | 3 | $40,427,683 | 5.2 | % | 2.32x | 14.7% | 53.1% | 52.5% | |
| Mixed Use | Retail / Hospitality | 1 | $29,000,000 | 3.7 | % | 1.91x | 13.2% | 55.2% | 55.2% |
| Multifamily / Office | 1 | 7,500,000 | 1.0 | 1.29x | 8.3% | 65.2% | 65.2% | ||
| Subtotal: | 2 | $36,500,000 | 4.7 | % | 1.78x | 12.2% | 57.3% | 57.3% | |
| Retail | Anchored | 3 | $26,750,000 | 3.4 | % | 1.40x | 11.0% | 58.7% | 58.7% |
| Shadow Anchored | 1 | 4,000,000 | 0.5 | 1.89x | 14.5% | 54.1% | 54.1% | ||
| Subtotal: | 4 | $30,750,000 | 3.9 | % | 1.47x | 11.4% | 58.1% | 58.1% | |
| Hospitality | Full Service | 1 | $12,741,428 | 1.6 | % | 1.55x | 15.7% | 54.9% | 52.6% |
| Extended Stay | 1 | 6,692,363 | 0.9 | 1.61x | 16.0% | 58.2% | 53.8% | ||
| Subtotal: | 2 | $19,433,790 | 2.5 | % | 1.57x | 15.8% | 56.0% | 53.0% | |
| Self Storage | Self Storage | 2 | $11,150,000 | 1.4 | % | 1.63x | 11.2% | 57.5% | 57.5% |
| Subtotal: | 2 | $11,150,000 | 1.4 | % | 1.63x | 11.2% | 57.5% | 57.5% | |
| Total / Weighted Average: | 66 | $783,141,474 | 100.0 | % | 1.49x | 10.7% | 60.5% | 60.4% | |
| (1) | Because this table presents information relating to the mortgaged properties and not mortgage loans, the information for mortgage loans secured by more than one mortgaged property is based on allocated loan amounts. |
| (2) | In the case of Loan Nos. 1, 9, 11 and 12, the UW NCF DSCR, UW NOI Debt Yield, Cut-off Date LTV and Maturity Date/ARD LTV calculations include the related Pari Passu Companion Loan(s). In the case of Loan Nos. 6 and 9, the UW NCF DSCR, UW NOI Debt Yield, Cut-off Date LTV and Maturity Date/ARD LTV calculations exclude the related Subordinate Companion Loan(s) or mezzanine loan(s). |
| (3) | For the mortgage loans that are interest-only for the entire term and accrue interest on an Actual/360 basis, the Monthly Debt Service (IO) ($) was calculated as 1/12th of the product of (i) the Original Balance ($), (ii) the Interest Rate % and (iii) 365/360. |
| (4) | In the case of Loan No. 28, the UW NOI Debt Yield is based on Cut-off Date Principal Balance after netting out a holdback reserve. Please see the Annex A-1 footnotes for further details. |
| (5) | In the case of Loan Nos. 4, 11, 14, 16, 20 and 23, the Cut-off Date LTV and the Maturity Date/ARD LTV are calculated by using an appraised value based on a value other than the “as-is” assumption. Refer to “Description of the Mortgage Pool—Assessment of Property Value and Condition” and “—Appraised Value” in the Preliminary Prospectus for additional details. |
THE INFORMATION IN THIS STRUCTURAL AND COLLATERAL TERM SHEET IS NOT COMPLETE AND MAY BE AMENDED PRIOR TO THE TIME OF SALE. THIS TERM SHEET IS NOT AN OFFER TO SELL THESE SECURITIES AND IT IS NOT A SOLICITATION OF AN OFFER TO BUY THESE SECURITIES IN ANY JURISDICTION WHERE THE OFFER OR SALE IS NOT PERMITTED. | ||
| 11 | ||
| Structural and Collateral Term Sheet | BBCMS 2025-5C34 | |
| Collateral Characteristics | ||
| Mortgaged Properties by Location(1) |
|
Weighted Average | |||||||
|
State |
Number of Properties |
Cut-off Date Principal Balance |
% of IPB |
UW NCF DSCR(2)(3) |
UW NOI Debt Yield(2)(4) |
Cut-off Date LTV(2)(5) | Maturity Date/ARD LTV(2)(5) |
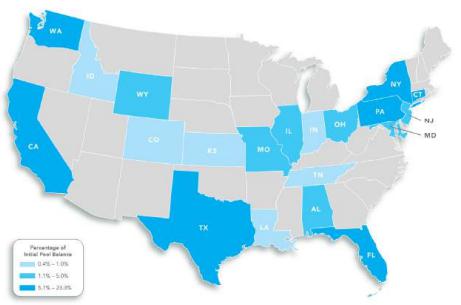
| Texas | 9 | $182,750,000 | 23.3% | 1.34x | 9.3% | 65.6% | 65.6% |
| New York | 7 | 115,900,000 | 14.8% | 1.30x | 8.5% | 67.9% | 67.9% |
| California | 4 | 86,283,333 | 11.0% | 2.24x | 14.8% | 47.3% | 47.3% |
| Pennsylvania | 11 | 77,679,181 | 9.9% | 1.37x | 10.9% | 61.8% | 61.4% |
| Washington | 2 | 61,834,100 | 7.9% | 1.33x | 11.5% | 50.3% | 50.3% |
| Florida | 8 | 44,200,000 | 5.6% | 1.24x | 9.0% | 57.5% | 57.5% |
| Connecticut | 1 | 42,500,000 | 5.4% | 1.43x | 8.7% | 59.8% | 59.8% |
| Illinois | 2 | 34,880,000 | 4.5% | 1.84x | 13.1% | 57.0% | 57.0% |
| Maryland | 2 | 34,094,350 | 4.4% | 1.69x | 13.5% | 60.1% | 59.5% |
| New Jersey | 6 | 30,000,000 | 3.8% | 1.37x | 8.9% | 62.8% | 62.8% |
| Missouri | 3 | 16,478,891 | 2.1% | 1.46x | 12.0% | 60.2% | 60.2% |
| Alabama | 1 | 9,250,000 | 1.2% | 1.55x | 11.1% | 67.5% | 67.5% |
| Ohio | 1 | 9,000,000 | 1.1% | 1.48x | 11.3% | 70.9% | 70.9% |
| Wyoming | 2 | 8,898,512 | 1.1% | 1.42x | 11.2% | 63.2% | 63.2% |
| Kansas | 1 | 6,692,363 | 0.9% | 1.61x | 16.0% | 58.2% | 53.8% |
| Colorado | 1 | 6,235,453 | 0.8% | 1.42x | 11.2% | 63.2% | 63.2% |
| Louisiana | 1 | 5,650,880 | 0.7% | 1.42x | 11.2% | 63.2% | 63.2% |
| Indiana | 2 | 4,156,969 | 0.5% | 1.42x | 11.2% | 63.2% | 63.2% |
| Tennessee | 1 | 3,507,442 | 0.4% | 1.42x | 11.2% | 63.2% | 63.2% |
| Idaho | 1 | 3,150,000 | 0.4% | 2.56x | 16.9% | 35.8% | 35.8% |
| Total / Weighted Average: | 66 | $783,141,474 | 100.0% | 1.49x | 10.7% | 60.5% | 60.4% |
| (1) | Because this table presents information relating to the mortgaged properties and not mortgage loans, the information for mortgage loans secured by more than one mortgaged property is based on allocated loan amounts. |
| (2) | In the case of Loan Nos. 1, 9, 11 and 12, the UW NCF DSCR, UW NOI Debt Yield, Cut-off Date LTV and Maturity Date/ARD LTV calculations include the related Pari Passu Companion Loan(s). In the case of Loan Nos. 6 and 9, the UW NCF DSCR, UW NOI Debt Yield, Cut-off Date LTV and Maturity Date/ARD LTV calculations exclude the related Subordinate Companion Loan(s) or mezzanine loan(s). |
| (3) | For the mortgage loans that are interest-only for the entire term and accrue interest on an Actual/360 basis, the Monthly Debt Service (IO) ($) was calculated as 1/12th of the product of (i) the Original Balance ($), (ii) the Interest Rate % and (iii) 365/360. |
| (4) | In the case of Loan No. 28, the UW NOI Debt Yield is based on Cut-off Date Principal Balance after netting out a holdback reserve. Please see the Annex A-1 footnotes for further details. |
| (5) | In the case of Loan Nos. 4, 11, 14, 16, 20 and 23, the Cut-off Date LTV and the Maturity Date/ARD LTV are calculated by using an appraised value based on a value other than the “as-is” assumption. Refer to “Description of the Mortgage Pool—Assessment of Property Value and Condition” and “—Appraised Value” in the Preliminary Prospectus for additional details. |
THE INFORMATION IN THIS STRUCTURAL AND COLLATERAL TERM SHEET IS NOT COMPLETE AND MAY BE AMENDED PRIOR TO THE TIME OF SALE. THIS TERM SHEET IS NOT AN OFFER TO SELL THESE SECURITIES AND IT IS NOT A SOLICITATION OF AN OFFER TO BUY THESE SECURITIES IN ANY JURISDICTION WHERE THE OFFER OR SALE IS NOT PERMITTED. | ||
| 12 | ||
| Structural and Collateral Term Sheet | BBCMS 2025-5C34 | |
| Collateral Characteristics | ||
| Cut-off Date Principal Balance |
|
Weighted Average | |||||||||||
| Range of Cut-off Date Principal Balances | Number of Loans | Cut-off Date Principal Balance | % of IPB | Mortgage Rate | Remaining Loan Term | UW NCF DSCR(1)(2) |
UW NOI DY(1)(3) |
Cut-off Date LTV(1)(4) |
Maturity Date/ARD LTV(1)(4) | ||
| $3,150,000 | - | $9,999,999 | 17 | $126,016,713 | 16.1% | 6.90972% | 59 | 1.48x | 11.3% | 61.9% | 61.5% |
| $10,000,000 | - | $14,999,999 | 3 | 37,591,428 | 4.8% | 7.16568% | 59 | 1.55x | 12.5% | 54.3% | 53.5% |
| $15,000,000 | - | $19,999,999 | 2 | 35,000,000 | 4.5% | 6.87943% | 59 | 1.28x | 9.1% | 70.5% | 70.5% |
| $20,000,000 | - | $29,999,999 | 4 | 101,300,000 | 12.9% | 6.90886% | 58 | 1.57x | 11.3% | 62.1% | 62.1% |
| $30,000,000 | - | $39,999,999 | 4 | 131,133,333 | 16.7% | 6.33677% | 58 | 1.59x | 10.4% | 58.5% | 58.5% |
| $40,000,000 | - | $54,999,999 | 5 | 226,500,000 | 28.9% | 6.80234% | 59 | 1.54x | 10.8% | 59.3% | 59.3% |
| $55,000,000 | - | $65,000,000 | 2 | 125,600,000 | 16.0% | 7.11621% | 59 | 1.30x | 9.5% | 61.4% | 61.4% |
| Total / Weighted Average: | 37 | $783,141,474 | 100.0% | 6.82666% | 59 | 1.49x | 10.7% | 60.5% | 60.4% | ||
| Mortgage Interest Rates |
|
Weighted Average | |||||||||||
| Range of Mortgage Interest Rates |
Number of Loans | Cut-off Date Principal Balance | % of IPB | Mortgage Rate | Remaining Loan Term | UW NCF DSCR(1)(2) |
UW NOI DY(1)(3) |
Cut-off Date LTV(1)(4) |
Maturity Date/ARD LTV(1)(4) | ||
| 5.84900 | - | 5.99900 | 4 | $146,733,333 | 18.7% | 5.90245% | 59 | 1.59x | 9.6% | 63.5% | 63.5% |
| 6.00000 | - | 6.49900 | 5 | 60,950,000 | 7.8% | 6.25162% | 59 | 1.45x | 9.6% | 60.3% | 60.3% |
| 6.50000 | - | 6.99900 | 14 | 304,900,000 | 38.9% | 6.71047% | 59 | 1.51x | 10.6% | 60.9% | 60.9% |
| 7.00000 | - | 7.49900 | 9 | 133,024,350 | 17.0% | 7.17863% | 59 | 1.45x | 11.2% | 61.4% | 61.2% |
| 7.50000 | - | 7.99900 | 4 | 76,933,790 | 9.8% | 7.64972% | 59 | 1.46x | 12.3% | 60.5% | 59.8% |
| 8.00000 | - | 8.41000 | 1 | 60,600,000 | 7.7% | 8.41000% | 60 | 1.33x | 11.5% | 50.0% | 50.0% |
| Total / Weighted Average: | 37 | $783,141,474 | 100.0% | 6.82666% | 59 | 1.49x | 10.7% | 60.5% | 60.4% | ||
| Original Term to Maturity or ARD in Months |
|
Weighted Average | |||||||||
| Original Term to Maturity or ARD in Months |
Number of Loans | Cut-off Date Principal Balance | % of IPB | Mortgage Rate | Remaining Loan Term | UW NCF DSCR(1)(2) |
UW NOI DY(1)(3) |
Cut-off Date LTV(1)(4) |
Maturity Date/ARD LTV(1)(4) |
| 60 | 37 | $783,141,474 | 100.0% | 6.82666% | 59 | 1.49x | 10.7% | 60.5% | 60.4% |
| Total / Weighted Average: | 37 | $783,141,474 | 100.0% | 6.82666% | 59 | 1.49x | 10.7% | 60.5% | 60.4% |
| Remaining Term to Maturity or ARD in Months |
| Weighted Average | |||||||||||
| Range of Remaining Term to Maturity in Months | Number of Loans | Cut-off Date Principal Balance | % of IPB | Mortgage Rate | Remaining Loan Term | UW NCF DSCR(1)(2) |
UW NOI DY(1)(3) |
Cut-off Date LTV(1)(4) |
Maturity Date/ARD LTV(1)(4) | ||
| 57 | - | 58 | 5 | $80,363,333 | 10.3% | 6.48660% | 57 | 2.07x | 13.6% | 54.1% | 54.1% |
| 59 | - | 60 | 32 | 702,778,141 | 89.7% | 6.86555% | 59 | 1.43x | 10.3% | 61.3% | 61.2% |
| Total / Weighted Average: | 37 | $783,141,474 | 100.0% | 6.82666% | 59 | 1.49x | 10.7% | 60.5% | 60.4% | ||
| (1) | In the case of Loan Nos. 1, 9, 11 and 12, the UW NCF DSCR, UW NOI Debt Yield, Cut-off Date LTV and Maturity Date/ARD LTV calculations include the related Pari Passu Companion Loan(s). In the case of Loan Nos. 6 and 9, the UW NCF DSCR, UW NOI Debt Yield, Cut-off Date LTV and Maturity Date/ARD LTV calculations exclude the related Subordinate Companion Loan(s) or mezzanine loan(s). |
| (2) | For the mortgage loans that are interest-only for the entire term and accrue interest on an Actual/360 basis, the Monthly Debt Service (IO) ($) was calculated as 1/12th of the product of (i) the Original Balance ($), (ii) the Interest Rate % and (iii) 365/360. |
| (3) | In the case of Loan No. 28, the UW NOI Debt Yield is based on Cut-off Date Principal Balance after netting out a holdback reserve. Please see the Annex A-1 footnotes for further details. |
| (4) | In the case of Loan Nos. 4, 11, 14, 16, 20 and 23, the Cut-off Date LTV and the Maturity Date/ARD LTV are calculated by using an appraised value based on a value other than the “as-is” assumption. Refer to “Description of the Mortgage Pool—Assessment of Property Value and Condition” and “—Appraised Value” in the Preliminary Prospectus for additional details. |
THE INFORMATION IN THIS STRUCTURAL AND COLLATERAL TERM SHEET IS NOT COMPLETE AND MAY BE AMENDED PRIOR TO THE TIME OF SALE. THIS TERM SHEET IS NOT AN OFFER TO SELL THESE SECURITIES AND IT IS NOT A SOLICITATION OF AN OFFER TO BUY THESE SECURITIES IN ANY JURISDICTION WHERE THE OFFER OR SALE IS NOT PERMITTED. | ||
| 13 | ||
| Structural and Collateral Term Sheet | BBCMS 2025-5C34 | |
| Collateral Characteristics | ||
| Original Amortization Term in Months |
| Weighted Average | |||||||||
| Original Amortization Term in Months |
Number of Loans | Cut-off Date Principal Balance | % of IPB | Mortgage Rate | Remaining Loan Term | UW NCF DSCR(1)(2) |
UW NOI DY(1)(3) |
Cut-off Date LTV(1)(4) |
Maturity Date/ARD LTV(1)(4) |
| Interest Only | 34 | $756,613,333 | 96.6% | 6.79809% | 59 | 1.49x | 10.5% | 60.6% | 60.6% |
| 300 | 1 | 6,692,363 | 0.9% | 7.50000% | 59 | 1.61x | 16.0% | 58.2% | 53.8% |
| 360 | 2 | 19,835,778 | 2.5% | 7.68957% | 59 | 1.57x | 15.1% | 58.3% | 55.7% |
| Total / Weighted Average: | 37 | $783,141,474 | 100.0% | 6.82666% | 59 | 1.49x | 10.7% | 60.5% | 60.4% |
| Remaining Amortization Term in Months |
| Weighted Average | |||||||||
| Remaining Amortization Term in Months | Number of Loans | Cut-off Date Principal Balance | % of IPB | Mortgage Rate | Remaining Loan Term | UW NCF DSCR(1)(2) |
UW NOI DY(1)(3) |
Cut-off Date LTV(1)(4) |
Maturity Date/ARD LTV(1)(4) |
| Interest Only | 34 | $756,613,333 | 96.6% | 6.79809% | 59 | 1.49x | 10.5% | 60.6% | 60.6% |
| 299 | 1 | 6,692,363 | 0.9% | 7.50000% | 59 | 1.61x | 16.0% | 58.2% | 53.8% |
| 359 | 2 | 19,835,778 | 2.5% | 7.68957% | 59 | 1.57x | 15.1% | 58.3% | 55.7% |
| Total / Weighted Average: | 37 | $783,141,474 | 100.0% | 6.82666% | 59 | 1.49x | 10.7% | 60.5% | 60.4% |
| Amortization Types |
|
Weighted Average | |||||||||
| Amortization Types | Number of Loans | Cut-off Date Principal Balance | % of IPB | Mortgage Rate | Remaining Loan Term | UW NCF DSCR(1)(2) |
UW NOI DY(1)(3) |
Cut-off Date LTV(1)(4) |
Maturity Date/ARD LTV(1)(4) |
| Interest Only | 33 | $723,280,000 | 92.4% | 6.84064% | 59 | 1.44x | 10.3% | 61.1% | 61.1% |
| Interest Only - ARD | 1 | 33,333,333 | 4.3% | 5.87479% | 57 | 2.47x | 14.8% | 50.7% | 50.7% |
| Amortizing Balloon | 3 | 26,528,141 | 3.4% | 7.64175% | 59 | 1.58x | 15.3% | 58.3% | 55.2% |
| Total / Weighted Average: | 37 | $783,141,474 | 100.0% | 6.82666% | 59 | 1.49x | 10.7% | 60.5% | 60.4% |
| Underwritten Net Cash Flow Debt Service Coverage Ratios(1)(2) |
| Weighted Average | |||||||||||
| Range of Underwritten Net Cash Flow Debt Service Coverage Ratios | Number of Loans | Cut-off Date Principal Balance | % of IPB | Mortgage Rate | Remaining Loan Term | UW NCF DSCR(1)(2) |
UW NOI DY(1)(3) |
Cut-off Date LTV(1)(4) |
Maturity Date/ARD LTV(1)(4) | ||
| 1.16x | - | 1.29x | 10 | $226,000,000 | 28.9% | 6.47873% | 59 | 1.26x | 8.5% | 66.3% | 66.3% |
| 1.30x | - | 1.49x | 12 | 338,650,000 | 43.2% | 7.05215% | 59 | 1.36x | 10.0% | 61.3% | 61.3% |
| 1.50x | - | 1.79x | 9 | 101,608,141 | 13.0% | 7.19993% | 59 | 1.59x | 13.0% | 58.6% | 57.8% |
| 1.80x | - | 1.99x | 2 | 33,000,000 | 4.2% | 6.75652% | 57 | 1.91x | 13.4% | 55.1% | 55.1% |
| 2.00x | - | 2.49x | 3 | 80,733,333 | 10.3% | 6.43113% | 58 | 2.34x | 15.3% | 46.9% | 46.9% |
| 2.50x | - | 2.56x | 1 | 3,150,000 | 0.4% | 6.38000% | 57 | 2.56x | 16.9% | 35.8% | 35.8% |
| Total / Weighted Average: | 37 | $783,141,474 | 100.0% | 6.82666% | 59 | 1.49x | 10.7% | 60.5% | 60.4% | ||
| (1) | In the case of Loan Nos. 1, 9, 11 and 12, the UW NCF DSCR, UW NOI Debt Yield, Cut-off Date LTV and Maturity Date/ARD LTV calculations include the related Pari Passu Companion Loan(s). In the case of Loan Nos. 6 and 9, the UW NCF DSCR, UW NOI Debt Yield, Cut-off Date LTV and Maturity Date/ARD LTV calculations exclude the related Subordinate Companion Loan(s) or mezzanine loan(s). |
| (2) | For the mortgage loans that are interest-only for the entire term and accrue interest on an Actual/360 basis, the Monthly Debt Service (IO) ($) was calculated as 1/12th of the product of (i) the Original Balance ($), (ii) the Interest Rate % and (iii) 365/360. |
| (3) | In the case of Loan No. 28, the UW NOI Debt Yield is based on Cut-off Date Principal Balance after netting out a holdback reserve. Please see the Annex A-1 footnotes for further details. |
| (4) | In the case of Loan Nos. 4, 11, 14, 16, 20 and 23, the Cut-off Date LTV and the Maturity Date/ARD LTV are calculated by using an appraised value based on a value other than the “as-is” assumption. Refer to “Description of the Mortgage Pool—Assessment of Property Value and Condition” and “—Appraised Value” in the Preliminary Prospectus for additional details. |
THE INFORMATION IN THIS STRUCTURAL AND COLLATERAL TERM SHEET IS NOT COMPLETE AND MAY BE AMENDED PRIOR TO THE TIME OF SALE. THIS TERM SHEET IS NOT AN OFFER TO SELL THESE SECURITIES AND IT IS NOT A SOLICITATION OF AN OFFER TO BUY THESE SECURITIES IN ANY JURISDICTION WHERE THE OFFER OR SALE IS NOT PERMITTED. | ||
| 14 | ||
| Structural and Collateral Term Sheet | BBCMS 2025-5C34 | |
| Collateral Characteristics | ||
| LTV Ratios as of the Cut-off Date(1)(3) |
| Weighted Average | |||||||||||
| Range of Cut-off Date LTVs |
Number of Loans | Cut-off Date Principal Balance | % of IPB | Mortgage Rate | Remaining Loan Term | UW NCF DSCR(1)(2) |
UW NOI DY(1)(3) |
Cut-off Date LTV(1)(4) |
Maturity Date/ARD LTV(1)(4) | ||
| 35.8% | - | 49.9% | 2 | $43,150,000 | 5.5% | 6.81105% | 59 | 2.31x | 16.1% | 41.5% | 41.5% |
| 50.0% | - | 54.9% | 5 | 122,574,761 | 15.7% | 7.41719% | 59 | 1.71x | 12.8% | 51.1% | 50.9% |
| 55.0% | - | 59.9% | 10 | 186,942,363 | 23.9% | 6.77019% | 59 | 1.53x | 11.1% | 57.1% | 56.9% |
| 60.0% | - | 64.9% | 6 | 149,244,350 | 19.1% | 7.03921% | 59 | 1.38x | 10.2% | 63.1% | 63.0% |
| 65.0% | - | 72.0% | 14 | 281,230,000 | 35.9% | 6.49642% | 59 | 1.30x | 8.8% | 68.5% | 68.5% |
| Total / Weighted Average: | 37 | $783,141,474 | 100.0% | 6.82666% | 59 | 1.49x | 10.7% | 60.5% | 60.4% | ||
| LTV Ratios as of the Maturity Date/ARD(1)(3) |
|
Weighted Average | |||||||||||
| Range of Maturity Date/ARD LTVs |
Number of Loans | Cut-off Date Principal Balance | % of IPB | Mortgage Rate | Remaining Loan Term | UW NCF DSCR(1)(2) |
UW NOI DY(1)(3) |
Cut-off Date LTV(1)(4) |
Maturity Date/ARD LTV(1)(4) | ||
| 35.8% | - | 49.9% | 2 | $43,150,000 | 5.5% | 6.81105% | 59 | 2.31x | 16.1% | 41.5% | 41.5% |
| 50.0% | - | 59.9% | 15 | 309,517,123 | 39.5% | 7.02641% | 59 | 1.60x | 11.8% | 54.7% | 54.5% |
| 60.0% | - | 64.9% | 6 | 149,244,350 | 19.1% | 7.03921% | 59 | 1.38x | 10.2% | 63.1% | 63.0% |
| 65.0% | - | 72.0% | 14 | 281,230,000 | 35.9% | 6.49642% | 59 | 1.30x | 8.8% | 68.5% | 68.5% |
| Total / Weighted Average: | 37 | $783,141,474 | 100.0% | 6.82666% | 59 | 1.49x | 10.7% | 60.5% | 60.4% | ||
| Prepayment Protection |
|
Weighted Average | |||||||||
| Prepayment Protection | Number of Loans | Cut-off Date Principal Balance | % of IPB | Mortgage Rate | Remaining Loan Term | UW NCF DSCR(1)(2) |
UW NOI DY(1)(3) |
Cut-off Date LTV(1)(4) |
Maturity Date/ARD LTV(1)(4) |
| Defeasance | 26 | $513,508,141 | 65.6% | 6.75321% | 59 | 1.46x | 10.5% | 62.1% | 61.9% |
| Yield Maintenance | 9 | 207,300,000 | 26.5% | 7.16752% | 59 | 1.36x | 10.1% | 59.0% | 59.0% |
| Defeasance or Yield Maintenance | 2 | 62,333,333 | 8.0% | 6.29826% | 57 | 2.21x | 14.1% | 52.8% | 52.8% |
| Total / Weighted Average: | 37 | $783,141,474 | 100.0% | 6.82666% | 59 | 1.49x | 10.7% | 60.5% | 60.4% |
| Loan Purpose |
|
Weighted Average | |||||||||
| Loan Purpose | Number of Loans | Cut-off Date Principal Balance | % of IPB | Mortgage Rate | Remaining Loan Term | UW NCF DSCR(1)(2) |
UW NOI DY(1)(3) |
Cut-off Date LTV(1)(4) |
Maturity Date/ARD LTV(1)(4) |
| Refinance | 33 | $756,161,474 | 96.6% | 6.81496% | 59 | 1.49x | 10.6% | 60.6% | 60.5% |
| Acquisition | 4 | 26,980,000 | 3.4% | 7.15475% | 59 | 1.49x | 12.2% | 60.0% | 60.0% |
| Total / Weighted Average: | 37 | $783,141,474 | 100.0% | 6.82666% | 59 | 1.49x | 10.7% | 60.5% | 60.4% |
| (1) | In the case of Loan Nos. 1, 9, 11 and 12, the UW NCF DSCR, UW NOI Debt Yield, Cut-off Date LTV and Maturity Date/ARD LTV calculations include the related Pari Passu Companion Loan(s). In the case of Loan Nos. 6 and 9, the UW NCF DSCR, UW NOI Debt Yield, Cut-off Date LTV and Maturity Date/ARD LTV calculations exclude the related Subordinate Companion Loan(s) or mezzanine loan(s). |
| (2) | For the mortgage loans that are interest-only for the entire term and accrue interest on an Actual/360 basis, the Monthly Debt Service (IO) ($) was calculated as 1/12th of the product of (i) the Original Balance ($), (ii) the Interest Rate % and (iii) 365/360. |
| (3) | In the case of Loan No. 28, the UW NOI Debt Yield is based on Cut-off Date Principal Balance after netting out a holdback reserve. Please see the Annex A-1 footnotes for further details. |
| (4) | In the case of Loan Nos. 4, 11, 14, 16, 20 and 23, the Cut-off Date LTV and the Maturity Date/ARD LTV are calculated by using an appraised value based on a value other than the “as-is” assumption. Refer to “Description of the Mortgage Pool—Assessment of Property Value and Condition” and “—Appraised Value” in the Preliminary Prospectus for additional details. |
THE INFORMATION IN THIS STRUCTURAL AND COLLATERAL TERM SHEET IS NOT COMPLETE AND MAY BE AMENDED PRIOR TO THE TIME OF SALE. THIS TERM SHEET IS NOT AN OFFER TO SELL THESE SECURITIES AND IT IS NOT A SOLICITATION OF AN OFFER TO BUY THESE SECURITIES IN ANY JURISDICTION WHERE THE OFFER OR SALE IS NOT PERMITTED. | ||
| 15 | ||
| Structural and Collateral Term Sheet | BBCMS 2025-5C34 | |
| Collateral Characteristics | ||
| Previous Securitization History(1) |
| No. | Mortgage Loan Seller | Loan Name | Location | Property Type | Cut-off Date Principal Balance | % of IPB | Previous Securitization |
| 8.01 | AREF2 | Sunstate Industrial Park | Tampa, FL | Industrial | $14,317,789 | 1.8% | AREIT 2023-CRE8 |
| 8.02 | AREF2 | Clifton Street Warehouses | Tampa, FL | Industrial | $9,840,025 | 1.3% | AREIT 2023-CRE8 |
| 8.03 | AREF2 | Parke East Business Park | Tampa, FL | Industrial | $3,593,267 | 0.5% | AREIT 2023-CRE8 |
| 8.04 | AREF2 | Anderson Road Warehouse | Tampa, FL | Industrial | $3,123,379 | 0.4% | AREIT 2023-CRE8 |
| 8.05 | AREF2 | West Crest Warehouse | Tampa, FL | Industrial | $2,985,176 | 0.4% | AREIT 2023-CRE8 |
| 8.06 | AREF2 | Bob's Barricades Warehouse | Tampa, FL | Industrial | $1,133,261 | 0.1% | AREIT 2023-CRE8 |
| 8.07 | AREF2 | Orient Warehouse | Tampa, FL | Industrial | $807,103 | 0.1% | AREIT 2023-CRE8 |
| 9.01 | Barclays | 1655 Third Street | San Francisco, CA | Office | $18,052,449 | 2.3% | BMARK 2020-IG2 |
| 9.02 | Barclays | 1725 Third Street | San Francisco, CA | Office | $15,280,884 | 2.0% | BMARK 2020-IG2 |
| 10 | Barclays | Avalon 8801 | Irving, TX | Multifamily | $32,000,000 | 4.1% | FREMF 2023-KF152 |
| 12 | Barclays | Soho House Chicago | Chicago, IL | Mixed Use | $29,000,000 | 3.7% | CSAIL 2018-CX11, UBSCM 2018-C11 |
| 13 | Barclays | CentrePointe Business Park | Landover, MD | Industrial | $27,000,000 | 3.4% | WFCM 2019-C50 |
| 14 | AREF2 | Mia West | Houston, TX | Multifamily | $24,000,000 | 3.1% | AREIT 2022-CRE7 |
| 15 | AREF2, KeyBank | Hollister Place Apartments | Houston, TX | Multifamily | $21,300,000 | 2.7% | FREMF 2023-KF153 |
| 16 | AREF2 | Mia East | Houston, TX | Multifamily | $19,000,000 | 2.4% | AREIT 2022-CRE7 |
| 18 | SMC | Spring Mountain Apartments | Corning, CA | Multifamily | $12,950,000 | 1.7% | FREMF 2015-K49 |
| 20 | AREF2, KeyBank | Porterwood Apartments | Porter, TX | Multifamily | $11,900,000 | 1.5% | FREMF 2021-KF114 |
| 23 | GACC | Arlington Village | Arlington, TX | Retail | $9,150,000 | 1.2% | CGCMT 2015-GC29 |
| 26 | AREF2 | Cutlerwood Apartments | Cutler Bay, FL | Multifamily | $8,400,000 | 1.1% | FREMF 2017-K724 |
| 27 | KeyBank | Florissant Marketplace | Florissant, MO | Retail | $8,100,000 | 1.0% | WFCM 2019-C49 |
| 29 | Barclays | Lockaway Storage - O'Connor | San Antonio, TX | Self Storage | $8,000,000 | 1.0% | COMM 2016-DC2 |
| 37 | KeyBank | Coeur d'Alene Self Storage | Coeur D’Alene, ID | Self Storage | $3,150,000 | 0.4% | JPMBB 2015-C28 |
| (1) | The table above represents the properties for which the previously existing debt was most recently securitized, based on information provided by the related borrower or obtained through searches of a third-party database. |
THE INFORMATION IN THIS STRUCTURAL AND COLLATERAL TERM SHEET IS NOT COMPLETE AND MAY BE AMENDED PRIOR TO THE TIME OF SALE. THIS TERM SHEET IS NOT AN OFFER TO SELL THESE SECURITIES AND IT IS NOT A SOLICITATION OF AN OFFER TO BUY THESE SECURITIES IN ANY JURISDICTION WHERE THE OFFER OR SALE IS NOT PERMITTED. | ||
| 16 | ||
| Structural and Collateral Term Sheet | BBCMS 2025-5C34 | |
| Structural Overview | ||
■ Assets: |
The Class A-1, Class A-2, Class A-3, Class X-A, Class X-B, Class X-D, Class X-F, Class A-S, Class B, Class C, Class D, Class E, Class F, Class G-RR, Class H-RR, Class S and Class R Certificates (collectively, the “Certificates”) will be entitled to distributions solely with respect to the mortgage loans. | |
■ Accrual: |
Each Class of Certificates (other than the Class S and Class R Certificates) will accrue interest on a 30/360 basis. The Class S and Class R Certificates will not accrue interest. | |
■ Distribution of Interest: |
On each Distribution Date, accrued interest for each Class of Certificates (other than the Class S and Class R Certificates) at the applicable pass-through rate will be distributed in the following order of priority to the extent of Available Funds (as defined in the Preliminary Prospectus): first, to the Class A-1, Class A-2, Class A-3, Class X-A, Class X-B, Class X-D and Class X-F Certificates (the “Senior Certificates”), on a pro rata basis, based on the interest entitlement for each such Class on such date, and then to the Class A-S, Class B, Class C, Class D, Class E, Class F, Class G-RR and Class H-RR Certificates, in that order, in each case until the interest entitlement for such date payable to each such Class is paid in full. The pass-through rate applicable to each of the Class A-1, Class A-2, Class A-3, Class A-S, Class B, Class C, Class D, Class E, Class F, Class G-RR and Class H-RR Certificates (collectively, the “Principal Balance Certificates”) on each Distribution Date, will be a per annum rate equal to one of (i) a fixed rate, (ii) the weighted average of the net mortgage rates on the mortgage loans (in each case adjusted, if necessary, to accrue on the basis of a 360-day year consisting of twelve 30-day months), (iii) the lesser of a specified fixed pass-through rate and the rate described in clause (ii) above or (iv) the rate described in clause (ii) above less a specified percentage. The pass-through rate for the Class X-A Certificates for any Distribution Date will be a per annum rate equal to the excess, if any, of (a) the weighted average of the net mortgage rates on the mortgage loans (in each case adjusted, if necessary, to accrue on the basis of a 360-day year consisting of twelve 30-day months), over (b) the weighted average of the pass-through rates on the Class A-1, Class A-2 and Class A-3 Certificates for the related Distribution Date, weighted on the basis of their respective Certificate Balances outstanding immediately prior to that Distribution Date. The pass-through rate for the Class X-B Certificates for any Distribution Date will be a per annum rate equal to the excess, if any, of (a) the weighted average of the net mortgage rates on the mortgage loans (in each case adjusted, if necessary, to accrue on the basis of a 360-day year consisting of twelve 30-day months), over (b) the weighted average of the pass-through rates on the Class A-S, Class B and Class C Certificates for the related Distribution Date, weighted on the basis of their respective Certificate Balances outstanding immediately prior to that Distribution Date. The pass-through rate for the Class X-D Certificates for any Distribution Date will be a per annum rate equal to the excess, if any, of (a) the weighted average of the net mortgage rates on the mortgage loans (in each case adjusted, if necessary, to accrue on the basis of a 360-day year consisting of twelve 30-day months), over (b) the weighted average of the pass-through rates on the Class D and Class E Certificates for the related Distribution Date, weighted on the basis of their respective Certificate Balances outstanding immediately prior to that Distribution Date. The pass-through rate for the Class X-F Certificates for any Distribution Date will be a per annum rate equal to the excess, if any, of (a) the weighted average of the net mortgage rates on the mortgage loans (in each case adjusted, if necessary, to accrue on the basis of a 360-day year consisting of twelve 30-day months), over (b) the pass-through rate on the Class F Certificates for the related Distribution Date. The Class S Certificates will not have a pass-through rate. On each Distribution Date, any excess interest collected in respect of any mortgage loan in the trust with an anticipated repayment date, solely to the extent received from the related borrower during the related collection period, will be distributed to the holders of the Class S Certificates. See “Description of the Certificates—Distributions” in the Preliminary Prospectus. | |
■ Distribution of Principal:
|
On any Distribution Date prior to the Cross-Over Date, the payments in respect of principal of the Principal Balance Certificates will be distributed: first, to the Class A-1 Certificates, until the Certificate Balance of such Class is reduced to zero, second, to the Class A-2 Certificates, until the Certificate Balance of such Class is reduced to zero, third, to the Class A-3 Certificates, until the Certificate Balance of |
THE INFORMATION IN THIS STRUCTURAL AND COLLATERAL TERM SHEET IS NOT COMPLETE AND MAY BE AMENDED PRIOR TO THE TIME OF SALE. THIS TERM SHEET IS NOT AN OFFER TO SELL THESE SECURITIES AND IT IS NOT A SOLICITATION OF AN OFFER TO BUY THESE SECURITIES IN ANY JURISDICTION WHERE THE OFFER OR SALE IS NOT PERMITTED. | ||
| 17 | ||
| Structural and Collateral Term Sheet | BBCMS 2025-5C34 | |
| Structural Overview | ||
|
|
such Class is reduced to zero, and then to the Class A-S, Class B, Class C, Class D, Class E, Class F, Class G-RR and Class H-RR Certificates, in that order, until the Certificate Balance of each such Class is reduced to zero. On any Distribution Date on or after the Cross-Over Date, the payments in respect of principal of the Principal Balance Certificates will be distributed to the Class A-1, Class A-2 and Class A-3 Certificates, pro rata based on the Certificate Balance of each such Class until the Certificate Balance of each such Class is reduced to zero. The “Cross-Over Date” means the Distribution Date on which the aggregate Certificate Balances of the Class A-S, Class B, Class C, Class D, Class E, Class F, Class G-RR and Class H-RR Certificates have been reduced to zero as a result of the allocation of realized losses to such Classes. The Class X-A, Class X-B, Class X-D and Class X-F Certificates (the “Class X Certificates”) will not be entitled to receive distributions of principal; however, the notional amount of the Class X-A Certificates will be reduced by the aggregate amount of principal distributions, realized losses and trust fund expenses, if any, allocated to the Class A-1, Class A-2 and Class A-3 Certificates, the notional amount of the Class X-B Certificates will be reduced by the aggregate amount of principal distributions, realized losses and trust fund expenses, if any, allocated to the Class A-S, Class B and Class C Certificates, the notional amount of the Class X-D Certificates will be reduced by the aggregate amount of principal distributions, realized losses and trust fund expenses, if any, allocated to the Class D and Class E Certificates and the notional amount of the Class X-F Certificates will be reduced by the amount of principal distributions, realized losses and trust fund expenses, if any, allocated to the Class F Certificates. The Class S Certificates will have no certificate balance, notional amount, credit support, pass-through rate, rated final distribution date or rating, and will not be entitled to distributions of principal. The Class S Certificates will be entitled to distributions of excess interest collected on the mortgage loan with an anticipated repayment date solely to the extent received from the related borrower and will represent beneficial ownership of the grantor trust, as further described in “Description of the Certificates—Distributions” in the Preliminary Prospectus. | |
■ Yield
Maintenance / Fixed |
If any yield maintenance charge or prepayment premium is collected during any particular collection period with respect to any mortgage loan, then on the Distribution Date corresponding to that collection period, the Certificate Administrator will pay that yield maintenance charge or prepayment premium (net of liquidation fees or workout fees payable therefrom) in the following manner: (1) to each of the Class A-1, Class A-2 , Class A-3, Class A-S, Class B, Class C, Class D, Class E, Class F, Class G-RR and Class H-RR Certificates, the product of (a) the yield maintenance charge or prepayment premium, (b) the related Base Interest Fraction (as defined in the Preliminary Prospectus) for such Class, and (c) a fraction, the numerator of which is equal to the amount of principal distributed to such Class for that Distribution Date, and the denominator of which is the total amount of principal distributed to all Principal Balance Certificates for that Distribution Date, (2) to the Class X-A Certificates, the excess, if any, of (a) the product of (i) such yield maintenance charge or prepayment premium and (ii) a fraction, the numerator of which is equal to the amount of principal distributed to the Class A-1, Class A-2 and Class A-3 Certificates for that Distribution Date, and the denominator of which is the total amount of principal distributed to all Principal Balance Certificates for that Distribution Date, over (b) the amount of such yield maintenance charge or prepayment premium distributed to the Class A-1, Class A-2 and Class A-3 Certificates as described above, (3) to the Class X-B Certificates, the excess, if any, of (a) the product of (i) such yield maintenance charge or prepayment premium and (ii) a fraction, the numerator of which is equal to the amount of principal distributed to the Class A-S, Class B and Class C Certificates for that Distribution Date, and the denominator of which is the total amount of principal distributed to all Principal Balance Certificates for that Distribution Date, over (b) the amount of such yield maintenance charge or prepayment premium distributed to the Class A-S, Class B and Class C Certificates as described above, (4) to the Class X-D Certificates, the excess, if any, of (a) the product of (i) such yield maintenance charge or prepayment premium and (ii) a fraction, the numerator of which is equal to the amount of principal distributed to the Class D and Class E Certificates for that Distribution Date, and the denominator of which is the total amount of principal distributed to all Principal Balance Certificates for that Distribution Date, over (b) the amount of such yield maintenance charge or prepayment premium distributed to the Class D and Class E Certificates as described above, and (5) to the Class X-F Certificates, any remaining portion of such yield maintenance charge or prepayment premium not distributed as described above. No yield maintenance charges or prepayment premiums will be distributed to the Class S or Class R Certificates. |
THE INFORMATION IN THIS STRUCTURAL AND COLLATERAL TERM SHEET IS NOT COMPLETE AND MAY BE AMENDED PRIOR TO THE TIME OF SALE. THIS TERM SHEET IS NOT AN OFFER TO SELL THESE SECURITIES AND IT IS NOT A SOLICITATION OF AN OFFER TO BUY THESE SECURITIES IN ANY JURISDICTION WHERE THE OFFER OR SALE IS NOT PERMITTED. | ||
| 18 | ||
| Structural and Collateral Term Sheet | BBCMS 2025-5C34 | |
| Structural Overview | ||
■ Realized Losses: |
On each Distribution Date, the losses on the mortgage loans will be allocated first to the Class H-RR, Class G-RR, Class F, Class E, Class D, Class C, Class B and Class A-S Certificates, in that order, in each case until the Certificate Balance of all such Classes have been reduced to zero, and then, to the Class A-1, Class A-2 and Class A-3 Certificates, pro rata, based on the Certificate Balance of each such Class, until the Certificate Balance of each such Class has been reduced to zero. The notional amounts of the Class X-A, Class X-B, Class X-D and Class X-F Certificates will be reduced by the aggregate amount of realized losses allocated to Certificates that are components of the notional amounts of the Class X-A, Class X-B, Class X-D and Class X-F Certificates, respectively. Losses on each pari passu Whole Loan will be allocated, pro rata, between the related mortgage loan and the related Pari Passu Companion Loan(s), based upon their respective principal balances and with respect to any Whole Loan with one or more subordinate companion loans, first to the related Subordinate Companion Loan(s) in order of relative subordination until their principal balances have been reduced to zero and then to the related mortgage loan and any related Pari Passu Companion loans (if any), pro rata, based on their respective principal balances. | |
■ Interest Shortfalls: |
A shortfall with respect to the amount of available funds distributable in respect of interest can result from, among other sources: (a) delinquencies and defaults by borrowers; (b) shortfalls resulting from the application of appraisal reductions to reduce P&I Advances; (c) shortfalls resulting from the payment of interest on Advances made by the Master Servicer, the Special Servicer or the Trustee; (d) shortfalls resulting from the payment of Special Servicing Fees and other additional compensation that the Special Servicer is entitled to receive; (e) shortfalls resulting from extraordinary expenses of the trust, including indemnification payments payable to the Depositor, the Master Servicer, the Special Servicer, the Certificate Administrator, the Trustee, the Operating Advisor and the Asset Representations Reviewer; (f) shortfalls resulting from a modification of a mortgage loan’s interest rate or principal balance; and (g) shortfalls resulting from other unanticipated or default-related expenses of the trust. Any such shortfalls that decrease the amount of available funds distributable in respect of interest to the Certificateholders will reduce distributions to the classes of Certificates (other than the Class S and Class R Certificates) beginning with those with the lowest payment priorities, in reverse sequential order. See “Description of the Certificates—Distributions—Priority of Distributions” in the Preliminary Prospectus. | |
■ Appraisal Reduction Amounts: |
With respect to mortgage loans serviced under the Pooling and Servicing Agreement, upon the occurrence of certain trigger events with respect to a mortgage loan, which are generally tied to certain events of default under the related mortgage loan documents, the Special Servicer will be obligated to obtain an appraisal of the related mortgaged property and the Special Servicer will calculate the Appraisal Reduction Amount. The “Appraisal Reduction Amount” is generally the amount by which the current principal balance of the related mortgage loan or Serviced Whole Loan, plus outstanding advances, real estate taxes, unpaid servicing fees and certain similar amounts exceeds the sum of (a) 90% of the appraised value of the related mortgaged property, (b) the amount of any escrows and letters of credit and reserves and (c) all insurance and casualty proceeds and condemnation awards that are collateral for the related mortgage loan; over the sum as of the due date in the month of the date of determination of (a) to the extent not previously advanced, unpaid interest at the mortgage rate, (b) all P&I Advances on the mortgage loan and all servicing advances on the related mortgage loan or Serviced Whole Loan not reimbursed from the proceeds and interest on those advances, and (c) all due and unpaid real estate taxes, insurance premiums, ground rents, unpaid special servicing fees and other amounts due and unpaid. With respect to the Non-Serviced Whole Loans, any Appraisal Reduction Amount will be similarly determined pursuant to the related lead securitization trust and servicing agreement or pooling and servicing agreement, as applicable, under which the non-serviced whole loan is serviced. In general, the Appraisal Reduction Amounts that are allocated to the mortgage loans are notionally allocated to reduce, in reverse sequential order, the Certificate Balance of each Class of Principal Balance Certificates (other than the Class A-1, Class A-2 and Class A-3 Certificates) beginning with the Class H-RR Certificates for certain purposes, including certain voting rights and the determination of the Controlling Class and the determination of an Operating Advisor Consultation Event. As a result of calculating one or more Appraisal Reduction Amounts (and, in the case of any Whole Loan, to the extent allocated in the related mortgage loan), the amount of any required P&I Advance will be reduced, which will have the effect of reducing the amount of interest available to the most subordinate Class of Certificates then-outstanding (i.e., first, to the Class H-RR Certificates; second, to the Class G-RR Certificates; third, to the Class F Certificates; fourth, to the Class E Certificates; fifth, to the Class D Certificates; sixth, to the Class C |
THE INFORMATION IN THIS STRUCTURAL AND COLLATERAL TERM SHEET IS NOT COMPLETE AND MAY BE AMENDED PRIOR TO THE TIME OF SALE. THIS TERM SHEET IS NOT AN OFFER TO SELL THESE SECURITIES AND IT IS NOT A SOLICITATION OF AN OFFER TO BUY THESE SECURITIES IN ANY JURISDICTION WHERE THE OFFER OR SALE IS NOT PERMITTED. | ||
| 19 | ||
| Structural and Collateral Term Sheet | BBCMS 2025-5C34 | |
| Structural Overview | ||
Certificates; seventh, to the Class B Certificates; eighth, to the Class A-S Certificates; and finally, pro rata based on their respective interest entitlements, to the Senior Certificates). With respect to each Serviced Whole Loan, the Appraisal Reduction Amount will be notionally allocated, pro rata, between the related mortgage loan and the related serviced Pari Passu Companion Loan(s), based upon their respective principal balances. | ||
■ Master Servicer Advances: |
The Master Servicer will be required to advance certain delinquent scheduled mortgage loan payments of principal and interest and certain property protection advances, in each case, to the extent the Master Servicer deems such advances to be recoverable. At any time that an Appraisal Reduction Amount exists, the amount that would otherwise be required to be advanced by the Master Servicer in respect of delinquent payments of interest on any mortgage loan will be reduced to equal the product of (x) the interest portion of the amount that would be advanced without regard to any Appraisal Reduction Amount for that mortgage loan and (y) a fraction, the numerator of which is the then-outstanding principal balance of the mortgage loan, minus the Appraisal Reduction Amount and the denominator of which is the then-outstanding principal balance of the mortgage loan immediately prior to the related Distribution Date. The Master Servicer will not make any principal or interest advances with respect to any companion loan. | |
■ Whole Loans: |
Each of the mortgaged properties identified above under “Collateral Characteristics—Pari Passu Companion Loan Summary” secures both a mortgage loan to be included in the trust fund and one or more other mortgage loans that will not be included in the trust fund, each of which will be pari passu or subordinate in right of payment with the mortgage loan included in the trust fund. We refer to each such group of mortgage loans as a “whole loan”. Such “—Pari Passu Companion Loan Summary” section includes further information regarding the various notes in each whole loan, the holders of such notes, the lead servicing agreement for each such whole loan, and the master servicer and special servicer under such lead servicing agreement. See “Description of the Mortgage Pool—The Whole Loans” in the Preliminary Prospectus. | |
■ Liquidated Loan Waterfall: |
On liquidation of any mortgage loan, all net liquidation proceeds related to the mortgage loan will be applied (after reimbursement of advances and certain trust fund expenses) first, as a recovery of accrued interest, other than delinquent interest that was not advanced as a result of Appraisal Reduction Amounts; second, as a recovery of principal until all principal has been recovered, and then as a recovery of delinquent interest that was not advanced as a result of Appraisal Reduction Amounts. Please see “Description of the Certificates—Distributions—Application Priority of Mortgage Loan Collections or Whole Loan Collections” in the Preliminary Prospectus. | |
■ Sale of Defaulted Loans and REO Properties: |
|
The Special Servicer is required to use reasonable efforts to solicit offers for any defaulted loan or REO property (other than a non-serviced mortgage loan), if the Special Servicer determines that no satisfactory arrangements can be made for collection of delinquent payments and the sale would be in the best economic interests of the certificateholders (or, in the case of any Serviced Whole Loan, the certificateholders and any holders of the related Serviced Companion Loans, as a collective whole, taking into account the pari passu or subordinate nature of any related Serviced Companion Loan), on a net present value basis. In the case of each non-serviced mortgage loan, under certain circumstances permitted under the related intercreditor agreement, to the extent that such non-serviced mortgage loan is not sold together with the related non-serviced companion loan by the special servicer for the related Non-Serviced Whole Loans, the Special Servicer will be entitled to sell ((i) with the consent of the Directing Certificateholder if no Control Termination Event has occurred and is continuing and (ii) after consulting on a non-binding basis with the risk retention consultation party, in each case, with respect to any mortgage loan other than an Excluded Loan) such non-serviced mortgage loan if it determines in accordance with the servicing standard that such action would be in the best interests of the certificateholders. The Special Servicer is generally required to accept the highest cash offer received from any person for any defaulted loan or REO property in an amount at least equal to par plus accrued interest plus all other outstanding amounts due under such mortgage loan and any outstanding expenses of the trust relating to such mortgage loan (the “Purchase Price”) except as described in the Preliminary Prospectus. With respect to the Serviced Whole Loans, any such sale of the related defaulted loan is required to also include the related Companion Loans, if any, and the prices will be adjusted accordingly. With respect to the mortgage loans that have mezzanine debt or permit mezzanine debt in the future, the mezzanine lenders may have the option to purchase the related mortgage loan after certain events of default under such mortgage loan, and the holder of a subordinate Companion Loan may have the option to purchase the related whole loan. |
THE INFORMATION IN THIS STRUCTURAL AND COLLATERAL TERM SHEET IS NOT COMPLETE AND MAY BE AMENDED PRIOR TO THE TIME OF SALE. THIS TERM SHEET IS NOT AN OFFER TO SELL THESE SECURITIES AND IT IS NOT A SOLICITATION OF AN OFFER TO BUY THESE SECURITIES IN ANY JURISDICTION WHERE THE OFFER OR SALE IS NOT PERMITTED. | ||
| 20 | ||
| Structural and Collateral Term Sheet | BBCMS 2025-5C34 | |
| Structural Overview | ||
The Directing Certificateholder will not have a right of first refusal to purchase a defaulted loan. If the Special Servicer does not receive a cash offer at least equal to the Purchase Price, the Special Servicer may accept the first cash offer received from any person that is determined to be a fair price and will be required to take into account (in addition to the results of any appraisal, updated appraisal or narrative appraisal that it may have obtained pursuant to the Pooling and Servicing Agreement within the prior nine months), among other factors, the period and amount of the occupancy level and physical condition of the related Mortgaged Property and the state of the local economy) for such defaulted loan or REO property, if the highest offeror is a person other than a party to the Pooling and Servicing Agreement, the Directing Certificateholder, the risk retention consultation party, any sponsor, any borrower, any manager of a mortgaged property, any independent contractor engaged by the Special Servicer, with respect to a defaulted whole loan, the depositor, master servicer, special servicer (or independent contractor engaged by the Special Servicer) or the trustee for the securitization of a Companion Loan and each holder of any related Companion Loan or mezzanine loan (but only with respect to the related mortgage loan), or any known affiliate of any such person (each, an “Interested Person”). If the highest offer is made by an Interested Person, the Trustee will determine (based upon the most recent appraisal or updated appraisal conducted in accordance with the terms of the Pooling and Servicing Agreement) whether the offer constitutes a fair price for the defaulted loan or REO property provided that no offer from an Interested Person will constitute a fair price unless (A) it is the highest offer received and (B) if the offer is less than the applicable Purchase Price, at least two other offers are received from independent third parties and the Trustee may conclusively rely on the opinion of an independent appraiser or other independent expert retained by the Trustee in connection with making such determination. Neither the Trustee nor any of its affiliates may make an offer for or purchase any specially serviced mortgage loan or REO property. The Special Servicer is not required to accept the highest offer and may accept a lower offer for a defaulted loan or REO property if the Special Servicer determines, in accordance with the servicing standard (and subject to the requirements of any related intercreditor agreement), that a rejection of such offer would be in the best interests of the Certificateholders and, with respect to any Serviced Whole Loan, the holder of the related Companion Loans, as a collective whole, as if such Certificateholders and, if applicable, the related Companion Loan Holder(s) constituted a single lender) and taking into account the pari passu or subordinate nature of any Company Loan, so long as such lower offer was not made by the Special Servicer or any of its affiliates. If title to any mortgaged property is acquired by the trust fund, the Special Servicer will be required to sell such mortgaged property prior to the close of the third calendar year beginning after the year of acquisition, unless (a) the IRS grants or has not denied an extension of time to sell such mortgaged property or (b) the Special Servicer, Trustee and the Certificate Administrator receive an opinion of independent counsel to the effect that the holding of the property by the trust longer than the above-referenced three-year period will not result in the imposition of a tax on any REMIC of the trust fund or grantor trust or cause any REMIC of the trust fund to fail to qualify as a REMIC or grantor trust to fail to qualify as a grantor trust. The foregoing applies to mortgage loans serviced under the Pooling and Servicing Agreement. With respect to each Non-Serviced Whole Loan, if the special servicer under the applicable trust and servicing agreement or pooling and servicing agreement, as applicable, determines to sell the related Companion Loan(s) as described above, then the applicable special servicer will be required to sell the related non-serviced mortgage loan, included in the BBCMS 2025-5C34 Trust, and the related Companion Loan(s), as a single loan. In connection with any such sale, the then-applicable special servicer will be required to follow procedures substantially similar to those set forth above. | ||
■ Control Eligible Certificates: |
Class G-RR and Class H-RR. | |
■ Control Rights: |
The Control Eligible Certificates will have certain control rights attached to them. The “Directing Certificateholder” will be (i) with respect to a Servicing Shift Mortgage Loan, the Loan-Specific Directing Certificateholder and (ii) with respect to each Mortgage Loan (other than any Servicing Shift Mortgage Loan and any Excluded Loan), the Controlling Class Certificateholder (or its representative) selected by more than 50% of the Controlling Class Certificateholders by Certificate Balance, as determined by the certificate registrar from time to time; provided, however, that (1) absent that selection, (2) until a Directing Certificateholder is so selected or (3) upon receipt of a notice from a majority of the Controlling Class Certificateholders that a Directing Certificateholder is no longer designated, the Controlling Class Certificateholder that owns the largest aggregate Certificate Balance of the Controlling Class (or its representative) will be the Directing Certificateholder; provided, however, that (i) in the case of this clause (3), in the event no one holder owns the largest aggregate Certificate Balance of the Controlling Class, then there will be no Directing Certificateholder until appointed in accordance with the terms of the Pooling |
THE INFORMATION IN THIS STRUCTURAL AND COLLATERAL TERM SHEET IS NOT COMPLETE AND MAY BE AMENDED PRIOR TO THE TIME OF SALE. THIS TERM SHEET IS NOT AN OFFER TO SELL THESE SECURITIES AND IT IS NOT A SOLICITATION OF AN OFFER TO BUY THESE SECURITIES IN ANY JURISDICTION WHERE THE OFFER OR SALE IS NOT PERMITTED. | ||
| 21 | ||
| Structural and Collateral Term Sheet | BBCMS 2025-5C34 | |
| Structural Overview | ||
and Servicing Agreement and (ii) the certificate administrator and the other parties to the Pooling and Servicing Agreement will be entitled to assume that the identity of the Directing Certificateholder has not changed until such parties receive written notice of a replacement of the Directing Certificateholder from a party holding the requisite interest in the Controlling Class, or the resignation of the then-current Directing Certificateholder. With respect to any mortgage loan (other than any non-serviced mortgage loan or any Excluded Loan), unless a Control Termination Event has occurred and is continuing, the Directing Certificateholder will be entitled to direct the Special Servicer to take, or refrain from taking, certain actions with respect to such mortgage loan. Furthermore, the Directing Certificateholder will also have the right to receive notice and provide consent with respect to certain material actions that the Master Servicer and the Special Servicer plan on taking with respect to a mortgage loan (other than any non-serviced mortgage loan or any Excluded Loan). With respect to any mortgage loan that has or may in the future have mezzanine debt, pursuant to the related intercreditor agreement, the related mezzanine lender may have certain consent rights with respect to certain modifications related to such mortgage loan. A “Borrower Party” means a borrower, a mortgagor, a manager of a mortgaged property, an Accelerated Mezzanine Loan Lender, any other person controlling or controlled by or under common control with such borrower, mortgagor, manager or Accelerated Mezzanine Loan Lender, as applicable, or any other person owning, directly or indirectly, 25% or more of the beneficial interests in such borrower, mortgagor, manager or Accelerated Mezzanine Loan Lender, as applicable. For purposes of this definition, “control” when used with respect to any specified person means the power to direct the management and policies of such person, directly or indirectly, whether through the ownership of voting securities, by contract or otherwise and the terms “controlling” and “controlled” have meanings correlative to the foregoing. An “Accelerated Mezzanine Loan Lender” means a mezzanine lender under a mezzanine loan that has been accelerated or as to which foreclosure or enforcement proceedings have been commenced against the equity collateral pledged to secure such mezzanine loan. An “Excluded Loan” means (1) with respect to the Directing Certificateholder, a mortgage loan or Whole Loan as to which the Directing Certificateholder would otherwise be entitled to exercise control rights (not taking into account the effect of any Control Termination Event) and with respect to which, as of any date of determination, (a) the Directing Certificateholder (except for purposes of determining whether a Servicing Shift Mortgage Loan or Servicing Shift Whole Loan is an Excluded Loan with respect to the related Loan-Specific Directing Certificateholder) is a Borrower Party or (b) the holder of the majority of the Controlling Class is a Borrower Party or (2) with respect to the Risk Retention Consultation Party, a Mortgage Loan or Whole Loan with respect to which, as of any date of determination, the Risk Retention Consultation Party or the holder of the majority of the VRR Interest is a Borrower Party. As of the Closing Date, it is expected that there will be no Excluded Loans in this securitization. With respect to the Serviced Whole Loans, direction, consent and consultation rights with respect to the related Whole Loan are subject to certain consultation rights of the holder of the related Pari Passu Companion Loans or Subordinate Companion Loans pursuant to the related intercreditor agreement. With respect to any Non-Serviced Whole Loan, direction, consent and consultation rights with respect to the related Whole Loan will be exercised by the directing certificateholder or controlling class representative under the applicable trust and servicing agreement or pooling and servicing agreement (or, in the case of Non-Serviced Whole Loans with Subordinate Companion Loans, the holder of the related Subordinate Companion Loan), as applicable. | ||
■ Directing Certificateholder: |
Argentic Securities Income USA 2 LLC is expected to be appointed as the initial directing certificateholder with respect to all serviced mortgage loans (other than the Excluded Loans and any Servicing Shift Mortgage Loans). | |
■ Controlling Class: |
The “Controlling Class” will at any date of determination be the most subordinate Class of Control Eligible Certificates then outstanding that has an aggregate Certificate Balance, as notionally reduced by any Cumulative Appraisal Reduction Amounts allocable to such Class, equal to no less than 25% of the initial Certificate Balance for such Class. Each holder of a certificate of the Controlling Class is referred to herein as a “Controlling Class Certificateholder”. The Controlling Class as of the Closing Date will be the Class H-RR Certificates; provided that if at any time the principal balances of the certificates other than the Control Eligible Certificates have been reduced to zero as a result of the allocation of principal payments on the mortgage loans, then the Controlling Class will be the most subordinate Class among the Control Eligible |
THE INFORMATION IN THIS STRUCTURAL AND COLLATERAL TERM SHEET IS NOT COMPLETE AND MAY BE AMENDED PRIOR TO THE TIME OF SALE. THIS TERM SHEET IS NOT AN OFFER TO SELL THESE SECURITIES AND IT IS NOT A SOLICITATION OF AN OFFER TO BUY THESE SECURITIES IN ANY JURISDICTION WHERE THE OFFER OR SALE IS NOT PERMITTED. | ||
| 22 | ||
| Structural and Collateral Term Sheet | BBCMS 2025-5C34 | |
| Structural Overview | ||
Certificates that has an aggregate principal balance greater than zero without regard to any Cumulative Appraisal Reduction Amounts. | ||
■ Control Termination Event: |
A “Control Termination Event” will occur when the senior most Class of Control Eligible Certificates has a Certificate Balance (taking into account the application of any Cumulative Appraisal Reduction Amounts to notionally reduce the Certificate Balance of such class) of less than 25% of the initial Certificate Balance of that class; provided that a Control Termination Event will not be deemed to be continuing in the event the Certificate Balances of all Classes of Principal Balance Certificates other than the Control Eligible Certificates have been reduced to zero as a result of principal payments on the mortgage loans; and provided, further, that prior to the applicable Servicing Shift Date, no Control Termination Event may occur with respect to the Loan-Specific Directing Certificateholder related to a Servicing Shift Whole Loan and the term “Control Termination Event” will not be applicable to the Loan-Specific Directing Certificateholder related to such Servicing Shift Whole Loan. A “Cumulative Appraisal Reduction Amount” as of any date of determination, is equal to the sum of (i) all Appraisal Reduction Amounts then in effect, and (ii) with respect to any AB Modified Loan, any Collateral Deficiency Amount then in effect. The master servicer and the certificate administrator will be entitled to conclusively rely on the special servicer’s calculation or determination of any Cumulative Appraisal Reduction Amount with respect to a mortgage loan. With respect to a Non-Serviced Mortgage Loan, the special servicer, the master servicer and the certificate administrator will be entitled to conclusively rely on the calculation or determination of any Appraisal Reduction Amount or Collateral Deficiency Amount with respect to such mortgage loan performed by the applicable servicer responsible therefore pursuant to the related Non-Serviced PSA. “AB Modified Loan” means any Corrected Loan (1) that became a Corrected Loan (which includes for purposes of this definition any Non-Serviced Mortgage Loan that became a “corrected loan” (or any term substantially similar thereto) pursuant to the related Non-Serviced PSA) due to a modification thereto that resulted in the creation of an A/B note structure (or similar structure) and as to which the new junior note(s) did not previously exist or the principal amount of the new junior note(s) was previously part of either an A note held by the issuing entity or the original unmodified mortgage loan and (2) as to which an Appraisal Reduction Amount is not in effect. “Collateral Deficiency Amount” means, with respect to any AB Modified Loan as of any date of determination, the excess of (i) the Stated Principal Balance of such AB Modified Loan (taking into account the related junior note(s) and any pari passu notes included therein), over (ii) the sum of (in the case of a Whole Loan, solely to the extent allocable to the subject mortgage loan) (x) the most recent appraised value for the related Mortgaged Property or Mortgaged Properties, plus (y) solely to the extent not reflected or taken into account in such appraised value and to the extent on deposit with, or otherwise under the control of, the lender as of the date of such determination, any capital or additional collateral contributed by the related borrower at the time the mortgage loan became (and as part of the modification related to) such AB Modified Loan for the benefit of the related Mortgaged Property or Mortgaged Properties (provided that in the case of a Non-Serviced Mortgage Loan, the amounts set forth in this clause (y) will be taken into account solely to the extent relevant information is received by the special servicer), plus (z) any other escrows or reserves (in addition to any amounts set forth in the immediately preceding clause (y)) held by the lender in respect of such AB Modified Loan as of the date of such determination. The master servicer, the operating advisor and the certificate administrator will be entitled to conclusively rely on the special servicer’s calculation or determination of any Collateral Deficiency Amount. Upon the occurrence and during the continuance of a Control Termination Event, the Controlling Class will no longer have any control rights. After the occurrence and during the continuance of a Control Termination Event, the Directing Certificateholder will relinquish its right to direct certain actions of the Special Servicer and will no longer have consent rights with respect to certain actions that the Master Servicer or the Special Servicer plan on taking with respect to a mortgage loan. Following the occurrence and during the continuance of a Control Termination Event, the Directing Certificateholder will retain consultation rights with the Special Servicer with respect to certain material actions that the Special Servicer plans on taking with respect to any mortgage loan other than an Excluded Loan. Such consultation rights will continue until the occurrence of a Consultation Termination Event. |
THE INFORMATION IN THIS STRUCTURAL AND COLLATERAL TERM SHEET IS NOT COMPLETE AND MAY BE AMENDED PRIOR TO THE TIME OF SALE. THIS TERM SHEET IS NOT AN OFFER TO SELL THESE SECURITIES AND IT IS NOT A SOLICITATION OF AN OFFER TO BUY THESE SECURITIES IN ANY JURISDICTION WHERE THE OFFER OR SALE IS NOT PERMITTED. | ||
| 23 | ||
| Structural and Collateral Term Sheet | BBCMS 2025-5C34 | |
| Structural Overview | ||
■ Consultation Termination Event: |
A “Consultation Termination Event” will occur when there is no class of Control Eligible Certificates that has a then-outstanding Certificate Balance at least equal to 25% of the initial Certificate Balance of that class, in each case, without regard to the application of any Cumulative Appraisal Reduction Amounts; provided, however, that a Consultation Termination Event will not be deemed to be continuing in the event the Certificate Balances of all Classes of Principal Balance Certificates other than the Control Eligible Certificates have been reduced to zero as a result of principal payments on the mortgage loans; provided, further, that no Consultation Termination Event may occur with respect to the Loan-Specific Directing Certificateholder related to a Servicing Shift Whole Loan and the term “Consultation Termination Event” will not be applicable to the Loan-Specific Directing Certificateholder related to such Servicing Shift Whole Loan. Upon the occurrence of a Consultation Termination Event, there will be no Class of Certificates that will act as the Controlling Class and the Directing Certificateholder will have no rights under the Pooling and Servicing Agreement, other than those rights generally available to all Certificateholders. | |
■ Risk Retention Consultation Party: |
A risk retention consultation party may be appointed by the holder or holders of more than 50% of the VRR Interest by Certificate Balance. The holder of the majority of the VRR Interest will have a continuing right to appoint, remove or replace a risk retention consultation party in its sole discretion. This right may be exercised at any time and from time to time. As of the closing date, there will be no Risk Retention Consultation Party. | |
| ■ Operating Advisor Consultation Event: | An “Operating Advisor Consultation Event” will occur with respect to any mortgage loan or Serviced Whole Loan when the Certificate Balances of the Class G-RR and Class H-RR Certificates in the aggregate (taking into account the application of any Cumulative Appraisal Reduction Amounts to notionally reduce the Certificate Balances of such classes) is reduced to 25% or less of the initial Certificate Balances of such classes in the aggregate. | |
| ■ Appraised-Out Class: | Any class of Control Eligible Certificates, the Certificate Balance of which (taking into account the application of any Appraisal Reduction Amounts or Collateral Deficiency Amounts to notionally reduce the Certificate Balance of such class) that has been reduced to less than 25% of its initial Certificate Balance | |
■ Remedies Available to Holders of an Appraised-Out Class: |
Holders of the majority of an Appraised-Out Class will have the right, at their sole expense, to require the Special Servicer to order (or, with respect to a Non-Serviced Mortgage Loan, require the master servicer to request from the applicable Non-Serviced Special Servicer) a supplemental appraisal report from an MAI appraiser (selected by the Special Servicer) for any mortgage loan (or Serviced Whole Loan) that results in the Class becoming an Appraised-Out Class. Upon receipt of that supplemental appraisal, the Special Servicer will be required to determine, in accordance with the Servicing Standard, whether, based on its assessment of the supplemental appraisal, any recalculation of the Appraisal Reduction Amount or Collateral Deficiency Amount is warranted, and if so warranted, will be required to recalculate the Appraisal Reduction Amount or Collateral Deficiency Amount, as applicable, based on the supplemental appraisal and if required by such recalculation, the Appraised-Out Class will be reinstated as the Controlling Class. The holder of an Appraised-Out Class requesting a supplemental appraisal are not permitted to exercise any control or consent rights of the Controlling Class until such time, if any, as the Class is reinstated as the Controlling Class. | |
| ■ Operating Advisor: | The Operating Advisor will initially be Pentalpha Surveillance LLC. The Operating Advisor will have certain review and consultation rights relating to the performance of the Special Servicer and with respect to its actions taken in connection with the resolution and/or liquidation of specially serviced loans. With respect to each mortgage loan (other than a non-serviced mortgage loan) or Serviced Whole Loan, the Operating Advisor will be responsible for: ■ reviewing the actions of the Special Servicer with respect to any Specially Serviced Loan; ■ reviewing (i) all reports by the Special Servicer made available to Privileged Persons on the Certificate Administrator’s website and (ii) each Asset Status Report (as defined in the Preliminary Prospectus) (after the occurrence and during the continuance of an Operating Advisor Consultation Event) and Final Asset Status Report; ■ reviewing for accuracy and consistency with the Pooling and Servicing Agreement the mathematical calculations and the corresponding application of the non-discretionary portion of the applicable formulas required to be utilized in connection with Appraisal Reduction Amounts, Collateral Deficiency Amounts, Cumulative Appraisal Reduction Amounts and net present value calculations used in the Special Servicer’s |
THE INFORMATION IN THIS STRUCTURAL AND COLLATERAL TERM SHEET IS NOT COMPLETE AND MAY BE AMENDED PRIOR TO THE TIME OF SALE. THIS TERM SHEET IS NOT AN OFFER TO SELL THESE SECURITIES AND IT IS NOT A SOLICITATION OF AN OFFER TO BUY THESE SECURITIES IN ANY JURISDICTION WHERE THE OFFER OR SALE IS NOT PERMITTED. | ||
| 24 | ||
| Structural and Collateral Term Sheet | BBCMS 2025-5C34 | |
| Structural Overview | ||
determination of what course of action to take in connection with the workout or liquidation of a Specially Serviced Loan; and ■ preparing an annual report (if any mortgage loan (other than any non-serviced mortgage loan) or Serviced Whole Loan was a Specially Serviced Loan at any time during the prior calendar year or an Operating Advisor Consultation Event occurred during the prior calendar year) that sets forth whether the Operating Advisor believes, in its sole discretion exercised in good faith, that the Special Servicer is operating in compliance with the Servicing Standard with respect to its performance of its duties under the Pooling and Servicing Agreement with respect to Specially Serviced Loans (and, after the occurrence and continuance of an Operating Advisor Consultation Event (as defined below), with respect to major decisions on non-Specially Serviced Loans) during the prior calendar year on a “trust-level basis”. The Operating Advisor will identify (1) which, if any, standards the Operating Advisor believes, in its sole discretion exercised in good faith, the Special Servicer has failed to comply with and (2) any material deviations from the Special Servicer’s obligations under the Pooling and Servicing Agreement with respect to the resolution or liquidation of any Specially Serviced Loan or REO Property (other than with respect to any REO Property related to any Non-Serviced Mortgage Loan). In preparing any Operating Advisor Annual Report (as defined in the Preliminary Prospectus), the Operating Advisor will not be required to report on instances of non-compliance with, or deviations from, the Servicing Standard or the Special Servicer’s obligations under the Pooling and Servicing Agreement that the Operating Advisor determines, in its sole discretion exercised in good faith, to be immaterial. With respect to each mortgage loan (other than any non-serviced mortgage loan) or Serviced Whole Loan, after the Operating Advisor has received notice that an Operating Advisor Consultation Event has occurred and is continuing, in addition to the duties described above, the Operating Advisor will be required to perform the following additional duties: ■ to consult (on a non-binding basis) with the Special Servicer in respect of Asset Status Reports; and ■ to consult (on a non-binding basis) with the Special Servicer to the extent it has received a Major Decision Reporting Package with respect to Major Decisions processed by the Special Servicer. In addition, if at any time the Operating Advisor determines, in its sole discretion exercised in good faith, that (1) the Special Servicer is not performing its duties as required under the Pooling and Servicing Agreement or is otherwise not acting in accordance with the Servicing Standard and (2) the replacement of the Special Servicer would be in the best interest of the certificateholders as a collective whole, then, the Operating Advisor will have the right to recommend the replacement of the Special Servicer and will submit its formal recommendation to the Trustee and the Certificate Administrator (along with its rationale, its proposed replacement special servicer and other relevant information justifying its recommendation). The Operating Advisor’s recommendation to replace the Special Servicer must be confirmed by an affirmative vote of holders of Principal Balance Certificates representing a majority of the Voting Rights (taking into account the application of any Appraisal Reduction Amounts to notionally reduce the respective Certificate Balances) of all Principal Balance Certificates whose holders voted on the matter (provided that the holders of the Principal Balance Certificates that so voted on the matter (i) hold Principal Balance Certificates representing at least 20% of the Voting Rights on an aggregate basis, and (ii) consist of at least three Certificateholders or certificate owners that are not Risk Retention Affiliated with each other). In the event the holders of Principal Balance Certificates evidencing at least a majority of a quorum of certificateholders elect to remove and replace the Special Servicer (which requisite affirmative votes must be received within 180 days of the posting of the notice of the Operating Advisor’s recommendation to replace the Special Servicer to the Certificate Administrator’s website), the Certificate Administrator will be required to receive a Rating Agency Confirmation from each of the Rating Agencies at that time. | ||
■ Replacement
of Operating |
The Operating Advisor may be terminated or removed under certain circumstances and a replacement operating advisor appointed as described in the Preliminary Prospectus. Any replacement operating advisor (or the personnel responsible for supervising the obligations of the replacement operating advisor) must be an entity (A) that is a special servicer or operating advisor on a commercial mortgage-backed securities transaction rated by the Rating Agencies (including, in the case of the Operating Advisor, this transaction) but has not been special servicer or operating advisor on a transaction for which any of the Rating Agencies has qualified, downgraded or withdrawn its rating or ratings of, one or more classes of certificates for such |
THE INFORMATION IN THIS STRUCTURAL AND COLLATERAL TERM SHEET IS NOT COMPLETE AND MAY BE AMENDED PRIOR TO THE TIME OF SALE. THIS TERM SHEET IS NOT AN OFFER TO SELL THESE SECURITIES AND IT IS NOT A SOLICITATION OF AN OFFER TO BUY THESE SECURITIES IN ANY JURISDICTION WHERE THE OFFER OR SALE IS NOT PERMITTED. | ||
| 25 | ||
| Structural and Collateral Term Sheet | BBCMS 2025-5C34 | |
| Structural Overview | ||
transaction publicly citing servicing concerns with the operating advisor in its capacity as special servicer or operating advisor on such commercial mortgage-backed securities transaction as the sole or a material factor in such rating action; (B) that can and will make the representations and warranties of the operating advisor set forth in the Pooling and Servicing Agreement; (C) that is not (and is not affiliated (including Risk Retention Affiliated) with) the Depositor, the Trustee, the Certificate Administrator, the Master Servicer, the Special Servicer, a Mortgage Loan Seller, the Directing Certificateholder, a Risk Retention Consultation Party, the Retaining Parties, any subsequent third party purchaser, a trustee, a certificate administrator, a master servicer or special servicer with respect to the securitization of a Companion Loan, or any of their respective affiliates (including Risk Retention Affiliates); (D) that has not been paid by any Special Servicer or successor special servicer any fees, compensation or other remuneration (x) in respect of its obligations under the Pooling and Servicing Agreement or (y) for the appointment or recommendation for replacement of a successor special servicer to become the Special Servicer; (E) that (x) has been regularly engaged in the business of analyzing and advising clients in commercial mortgage-backed securities matters and that has at least five years of experience in collateral analysis and loss projections and (y) has at least five years of experience in commercial real estate asset management and experience in the workout and management of distressed commercial real estate assets; and (F) that does not directly or indirectly, through one or more affiliates or otherwise, own or have derivative exposure in any interest in any certificates, any mortgage loan, any companion loan or securities backed by a companion loan or otherwise have any financial interest in the securitization transaction to which the Pooling and Servicing Agreement relates, other than in fees from its role as Operating Advisor and Asset Representations Reviewer (to the extent it also acts as the Asset Representations Reviewer). Any Operating Advisor is prohibited from making an investment in any Class of Certificates in the Trust as described in the Preliminary Prospectus. “Risk Retention Affiliate” or “Risk Retention Affiliated” means “affiliate of” or “affiliated with”, as such terms are defined in 17 C.F.R. 246.2 of the Credit Risk Retention Rules. | ||
■ Asset Representations Reviewer: |
The Asset Representations Reviewer will be required to review certain delinquent mortgage loans after a specified delinquency threshold has been exceeded and notification from the Certificate Administrator that the required percentage of Certificateholders have voted to direct a review of such delinquent mortgage loans. An “Asset Review Trigger” will occur when either (1) mortgage loans with an aggregate outstanding principal balance of 25.0% or more of the aggregate outstanding principal balance of all of the mortgage loans (including any REO Loans (or a portion of any REO Loan in the case of a Whole Loan)) held by the issuing entity as of the end of the applicable Collection Period are Delinquent Loans or (2)(A) prior to and including the second anniversary of the Closing Date at least 10 mortgage loans are Delinquent Loans and the outstanding principal balance of such Delinquent Loans in the aggregate constitutes at least 15.0% of the aggregate outstanding principal balance of all of the mortgage loans (including any REO Loans (or a portion of any REO Loan in the case of a Whole Loan)) held by the issuing entity as of the end of the applicable Collection Period or (B) after the second anniversary of the Closing Date, at least 15 mortgage loans are Delinquent Loans and the outstanding principal balance of such Delinquent Loans in the aggregate constitutes at least 20.0% of the aggregate outstanding principal balance of all of the mortgage loans (including any REO Loans (or a portion of any REO Loan in the case of a Whole Loan)) held by the issuing entity as of the end of the applicable Collection Period. Following the determination that an Asset Review Trigger has occurred, the Certificate Administrator will include in the Form 10-D relating to the distribution period in which the Asset Review Trigger occurred a description of the events that caused the Asset Review Trigger to occur. Once an Asset Review Trigger has occurred, Certificateholders evidencing not less than 5% of the aggregate Voting Rights may deliver to the Certificate Administrator a written direction requesting a vote on whether to commence an Asset Review (as defined in the Preliminary Prospectus) within 90 days after the filing of the Form 10-D reporting the occurrence of the Asset Review Trigger (an “Asset Review Vote Election”). If directed by such Certificateholders, a vote of all Certificateholders will commence and an Asset Review will occur if more than a majority of Certificateholders voting (assuming Certificateholders representing a minimum of 5% of the Voting Rights respond) vote affirmatively within 150 days of the Asset Review Vote Election. If the vote does not come to pass within such 150-day period, then no further votes will occur unless and until (A) an additional mortgage loan becomes a Delinquent Loan after the expiration of such 150 day period, (B) a new Asset Review Trigger has occurred as a result or an Asset Review Trigger is otherwise in effect, (C) the Certificate Administrator has timely received an Asset Review Vote Election after the occurrence of the events described in clauses (A) and (B) above and (D) such vote has occurred within 150 after the election described in clause (C) above. |
THE INFORMATION IN THIS STRUCTURAL AND COLLATERAL TERM SHEET IS NOT COMPLETE AND MAY BE AMENDED PRIOR TO THE TIME OF SALE. THIS TERM SHEET IS NOT AN OFFER TO SELL THESE SECURITIES AND IT IS NOT A SOLICITATION OF AN OFFER TO BUY THESE SECURITIES IN ANY JURISDICTION WHERE THE OFFER OR SALE IS NOT PERMITTED. | ||
| 26 | ||
| Structural and Collateral Term Sheet | BBCMS 2025-5C34 | |
| Structural Overview | ||
■ Replacement of the Asset Representations Reviewer: |
The Asset Representations Reviewer may be terminated and replaced without cause. Upon (i) the written direction of Certificateholders evidencing not less than 25% of the Voting Rights (without regard to the application of any Cumulative Appraisal Reduction Amounts) requesting a vote to terminate and replace the Asset Representations Reviewer with a proposed successor asset representations reviewer that is an Eligible Asset Representations Reviewer (as defined in the Preliminary Prospectus), and (ii) payment by such holders to the Certificate Administrator of the reasonable fees and expenses to be incurred by the Certificate Administrator in connection with administering such vote, the Certificate Administrator will promptly provide notice to all Certificateholders and the Asset Representations Reviewer of such request by posting such notice on its internet website, and by mailing to all Certificateholders and the Asset Representations Reviewer. Upon the written direction of Certificateholders evidencing at least 75% of a Certificateholder Quorum (without regard to the application of any Cumulative Appraisal Reduction Amounts), the Trustee will terminate all of the rights and obligations of the Asset Representations Reviewer under the Pooling and Servicing Agreement by written notice to the Asset Representations Reviewer, and the proposed successor asset representations reviewer will be appointed. | |
■ Appointment and Replacement of Special Servicer: |
The Directing Certificateholder will appoint the initial Special Servicer as of the Closing Date. Prior to the occurrence and continuance of a Control Termination Event, the Special Servicer may generally be replaced at any time and without cause by the Directing Certificateholder. If the Special Servicer obtains knowledge that it has become a Borrower Party with respect to any mortgage loan or Serviced Whole Loan (any such mortgage loan or Serviced Whole Loan, an “Excluded Special Servicer Loan”), the Special Servicer will be required to resign as Special Servicer of that Excluded Special Servicer Loan. Prior to the occurrence and continuance of a Control Termination Event, if the applicable Excluded Special Servicer Loan is not also an Excluded Loan as to the Directing Certificateholder or the holder of the majority of the Controlling Class, the Directing Certificateholder or the Controlling Class Certificateholder on its behalf will be required to appoint (and may remove and replace with or without cause) a successor special servicer that is not a Borrower Party in accordance with the terms of the Pooling and Servicing Agreement (an “Excluded Special Servicer”) for the related Excluded Special Servicer Loan. After the occurrence and during the continuance of a Control Termination Event or if at any time the applicable Excluded Special Servicer Loan is also an Excluded Loan as to the Directing Certificateholder or the holder of the majority of the Controlling Class, the resigning Special Servicer will be required to use reasonable efforts to select the related Excluded Special Servicer. Upon the occurrence and during the continuance of a Control Termination Event, the Directing Certificateholder will no longer have the right to replace the Special Servicer and such replacement will occur based on a vote of holders of the related voting eligible Classes of Certificates as described below. The Operating Advisor may also recommend the replacement of the Special Servicer at any time as described in “Operating Advisor” above. | |
■ Replacement of Special Servicer by Vote of Certificateholders: |
After the occurrence and during the continuance of a Control Termination Event, upon (a) the written direction of holders of Principal Balance Certificates evidencing not less than 25% of the Voting Rights (taking into account the application of any Cumulative Appraisal Reduction Amounts to notionally reduce the Certificate Balances of Classes to which such Cumulative Appraisal Reduction Amounts are allocable) of the Principal Balance Certificates requesting a vote to replace the Special Servicer with a replacement special servicer, (b) payment by such requesting holders to the Certificate Administrator of all reasonable fees and expenses to be incurred by the Certificate Administrator in connection with administering such vote and (c) delivery by such holders to the Certificate Administrator and the Trustee of written confirmations from each Rating Agency that the appointment of such replacement special servicer will not result in a downgrade, withdrawal or qualification of the Certificates (which confirmations will be obtained at the expense of such holders), the Certificate Administrator will be required to post such notice on its Internet website, and by mail conduct the solicitation of votes of all Certificates in such regard, which such vote must occur within 180 days of the posting of such notice. Upon the written direction of holders of Principal Balance Certificates evidencing at least 66-2/3% of a Certificateholder Quorum, the Trustee will immediately replace the Special Servicer with a qualified replacement special servicer designated by such holders of Certificates. A “Certificateholder Quorum” means, in connection with any solicitation of votes in connection with the replacement of the Special Servicer or the Asset Representations Reviewer described above, the holders of Certificates evidencing at least 50% of the aggregate Voting Rights (taking into account the application of realized losses and, other than with respect to the termination of |
THE INFORMATION IN THIS STRUCTURAL AND COLLATERAL TERM SHEET IS NOT COMPLETE AND MAY BE AMENDED PRIOR TO THE TIME OF SALE. THIS TERM SHEET IS NOT AN OFFER TO SELL THESE SECURITIES AND IT IS NOT A SOLICITATION OF AN OFFER TO BUY THESE SECURITIES IN ANY JURISDICTION WHERE THE OFFER OR SALE IS NOT PERMITTED. | ||
| 27 | ||
| Structural and Collateral Term Sheet | BBCMS 2025-5C34 | |
| Structural Overview | ||
the Asset Representations Reviewer, the application of any Cumulative Appraisal Reduction Amounts to notionally reduce the Certificate Balance of the Certificates) of all Principal Balance Certificates on an aggregate basis. With respect to each Serviced Whole Loan, the holders of the related Pari Passu Companion Loans, under certain circumstances following a servicer termination event with respect to the Special Servicer, will be entitled to direct the Trustee (and the Trustee will be required) to terminate the Special Servicer solely with respect to such Serviced Whole Loan. A replacement special servicer will be selected by the Trustee or, prior to a Control Termination Event, by the Directing Certificateholder; provided, however, that any successor special servicer appointed to replace the Special Servicer with respect to such Whole Loan can generally not be the person (or its affiliate) that was terminated at the direction of the holder of the related Pari Passu Companion Loan. With respect to any Non-Serviced Whole Loan, the BBCMS 2025-5C34 trust as holder of the related mortgage loan has similar termination rights in the event of a servicer termination event with respect to the special servicer under the applicable trust and servicing agreement or pooling and servicing agreement, as applicable, as described above, which may be exercised by the Directing Certificateholder prior to the Control Termination Event. However, the successor special servicer will be selected pursuant to the applicable trust and servicing agreement or pooling and servicing agreement, as applicable, by the related directing holder prior to a control event under such trust and servicing agreement or pooling and servicing agreement, as applicable. The Master Servicer and Special Servicer are entitled to certain fees in connection with the servicing and administration of the mortgage loans as more fully described in “Pooling and Servicing Agreement—Servicing and Other Compensation and Payment of Expenses” in the Preliminary Prospectus. | ||
■ Dispute Resolution Provisions: |
Each Mortgage Loan Seller will be subject to the dispute resolution provisions set forth in the Pooling and Servicing Agreement to the extent those provisions are triggered with respect to any mortgage loan sold to the Depositor by a Mortgage Loan Seller and such Mortgage Loan Seller will be obligated under the related mortgage loan purchase agreement to comply with all applicable provisions and to take part in any mediation or arbitration proceedings that may result. Generally, in the event that a request to repurchase a mortgage loan (a “Repurchase Request”) is not “Resolved” (as defined below) within 180 days after the related Mortgage Loan Seller receives such Repurchase Request (a “Resolution Failure”), then the Enforcing Servicer (as defined below) will be required to send a notice to the “Initial Requesting Certificateholder” (if any) indicating the Enforcing Servicer’s intended course of action with respect to the Repurchase Request. If (a) the Enforcing Servicer’s intended course of action with respect to the Repurchase Request does not involve pursuing further action to exercise rights against the related Mortgage Loan Seller with respect to the Repurchase Request and the Initial Requesting Certificateholder, if any, or any other Certificateholder or Certificate Owner wishes to exercise its right to refer the matter to mediation (including non-binding arbitration) or arbitration, or (b) the Enforcing Servicer’s intended course of action is to pursue further action to exercise rights against the related Mortgage Loan Seller with respect to the Repurchase Request but the Initial Requesting Certificateholder, if any, or any other Certificateholder or Certificate Owner does not agree with the dispute resolution method selected by the Enforcing Servicer, then the Initial Requesting Certificateholder, if any, or such other Certificateholder or Certificate Owner may deliver a written notice to the Enforcing Servicer indicating its intent to exercise its right to refer the matter to either mediation or arbitration. The Enforcing Servicer will be required to consult with any Certificateholder or Certificate Owner that delivers a notice of its intent to exercise its dispute resolution rights (a “Requesting Certificateholder”) so that a Requesting Certificateholder may consider the views of the Enforcing Servicer as to the claims underlying the Repurchase Request and possible dispute resolution methods. If a Requesting Certificateholder elects to exercise its right to refer the matter to either mediation or arbitration, then it will become the party responsible for enforcing the Repurchase Request and must promptly submit the matter to mediation (including nonbinding arbitration) or arbitration. Failure to make an election to exercise that right or failure to begin the elected form of proceedings within the certain timeframe set forth in the Pooling and Servicing Agreement will generally waive the Certificateholders’ or Certificate Owners’ rights with respect to the related Repurchase Request. The “Enforcing Servicer” will be the Special Servicer. “Resolved” means, with respect to a Repurchase Request, (i) that the related Material Defect has been cured, (ii) the related mortgage loan has been repurchased in accordance with the related mortgage loan purchase agreement, (iii) a mortgage loan has been substituted for the |
THE INFORMATION IN THIS STRUCTURAL AND COLLATERAL TERM SHEET IS NOT COMPLETE AND MAY BE AMENDED PRIOR TO THE TIME OF SALE. THIS TERM SHEET IS NOT AN OFFER TO SELL THESE SECURITIES AND IT IS NOT A SOLICITATION OF AN OFFER TO BUY THESE SECURITIES IN ANY JURISDICTION WHERE THE OFFER OR SALE IS NOT PERMITTED. | ||
| 28 | ||
| Structural and Collateral Term Sheet | BBCMS 2025-5C34 | |
| Structural Overview | ||
related mortgage loan in accordance with the related mortgage loan purchase agreement, (iv) the applicable Mortgage Loan Seller makes a Loss of Value Payment (as defined in the Preliminary Prospectus), (v) a contractually binding agreement is entered into between the Enforcing Servicer, on behalf of the issuing entity, and the related Mortgage Loan Seller that settles the related Mortgage Loan Seller’s obligations under the related mortgage loan purchase agreement, or (vi) the related mortgage loan is no longer property of the issuing entity as a result of a sale or other disposition in accordance with the Pooling and Servicing Agreement. | ||
■ Investor Communications: |
The Certificate Administrator is required to include on any Form 10-D any request received from a Certificateholder to communicate with other Certificateholders related to Certificateholders exercising their rights under the terms of the Pooling and Servicing Agreement. Any Certificateholder wishing to communicate with other Certificateholders regarding the exercise of its rights under the terms of the Pooling and Servicing Agreement should deliver a written request signed by an authorized representative of the requesting investor to the Certificate Administrator at the address below: Computershare Trust Company, National Association 9062 Old Annapolis Road Columbia, Maryland 21045 Attention: Corporate Trust Administration Group – BBCMS Mortgage Trust 2025-5C34 With a copy to: trustadministrationgroup@computershare.com | |
■ Master Servicer and Special Servicer Compensation: |
The Master Servicer is entitled to a fee (the “Servicing Fee”) payable monthly from interest received in respect of each mortgage loan, any related REO loan and any related Serviced Companion Loan that will accrue at the related servicing fee rate described in the Preliminary Prospectus. The Special Servicer is also entitled to a fee (the “Special Servicing Fee”) with respect to each specially serviced loan and REO loan (other than a non-serviced mortgage loan) at the special servicing fee rate described in the Preliminary Prospectus. In addition to the Servicing Fee, Special Servicing Fee and certain other fees described below, the Master Servicer and Special Servicer are entitled to retain and share certain additional servicing compensation, including assumption application fees, assumption fees, defeasance fees and certain Excess Modification Fees and consent fees with respect to the mortgage loans. The Special Servicer may also be entitled to either a Workout Fee or Liquidation Fee, but not both, from recoveries in respect of any particular mortgage loan. An “Excess Modification Fee” with respect to any mortgage loan (other than a non-serviced mortgage loan) or Serviced Whole Loan is the sum of (A) the excess, if any, of (i) any and all Modification Fees with respect to a mortgage loan or Serviced Whole Loan, over (ii) all unpaid or unreimbursed additional expenses described in the Preliminary Prospectus (excluding Special Servicing Fees, Workout Fees and Liquidation Fees) outstanding with respect to the related mortgage loan or Serviced Whole Loan, and reimbursed from such Modification Fees and (B) expenses previously paid or reimbursed from Modification Fees as described in clause (A), which expenses have subsequently been recovered from the related borrower or otherwise. With respect to the Master Servicer and Special Servicer, the Excess Modification Fees collected and earned by such servicer from the related borrower (taken in the aggregate with any other Excess Modification Fees collected and earned by such servicer from the related borrower within the prior 12 months of the collection of the current Excess Modification Fees) will be subject to a cap of 1.0% of the outstanding principal balance of the related mortgage loan or Serviced Whole Loan, as applicable, on the closing date of the related modification, extension, waiver or amendment. A “Modification Fee” with respect to any mortgage loan (other than a non-serviced mortgage loan) or Serviced Companion Loan is generally any fee with respect to a modification, extension, waiver or amendment of any mortgage loan and/or related Serviced Companion Loan (other than all assumption fees, assumption application fees, consent fees, loan service transaction fees, defeasance fees, Special Servicing Fees, Liquidation Fees or Workout Fees). A “Workout Fee” will generally be payable with respect to each corrected loan and will be calculated at a rate of 1.00% of payments (other than penalty charges and Excess Interest) of principal and interest on the respective mortgage loan for so long as it remains a corrected loan, subject to a maximum of $1,000,000 in the aggregate with respect to any particular corrected loan. After receipt by the Special Servicer of Workout Fees with respect to a corrected loan in an amount equal to $25,000, any Workout Fees in excess of such amount will be reduced by the Excess Modification Fee Amount; provided that in the event the Workout Fee, collected over the course of such workout calculated at the Workout Fee Rate is less than $25,000, then the Special Servicer will be entitled to an amount from the final payment on the related corrected loan (including any related Serviced Companion Loan) that would result in the total Workout Fees |
THE INFORMATION IN THIS STRUCTURAL AND COLLATERAL TERM SHEET IS NOT COMPLETE AND MAY BE AMENDED PRIOR TO THE TIME OF SALE. THIS TERM SHEET IS NOT AN OFFER TO SELL THESE SECURITIES AND IT IS NOT A SOLICITATION OF AN OFFER TO BUY THESE SECURITIES IN ANY JURISDICTION WHERE THE OFFER OR SALE IS NOT PERMITTED. | ||
| 29 | ||
| Structural and Collateral Term Sheet | BBCMS 2025-5C34 | |
| Structural Overview | ||
payable to the Special Servicer in respect of that corrected loan (including any related Serviced Companion Loan) equal to $25,000. The “Excess Modification Fee Amount” for any corrected loan is an amount equal to the aggregate of any Excess Modification Fees paid by or on behalf of the related borrower with respect to the related mortgage loan (including the related Serviced Companion Loan) and received and retained by the Master Servicer or the Special Servicer, as applicable, as additional servicing compensation within the prior 12 months of the related modification, waiver, extension or amendment resulting in the mortgage loan or REO loan being a corrected loan, but only to the extent those fees have not previously been deducted from a Workout Fee or Liquidation Fee. A “Liquidation Fee” will generally be payable with respect to each specially serviced loan or REO property (except with respect to any non-serviced mortgage loan) as to which the Special Servicer obtains a full or partial recovery of the related asset). The Liquidation Fee for each specially serviced mortgage loan will be payable at a rate of 1.0% of the liquidation proceeds (exclusive of default interest) subject to a maximum of $1,000,000; provided, however, that no Liquidation Fee will be less than $25,000. The Liquidation Fees will be reduced by the amount of any Excess Modification Fees received by the Special Servicer with respect to the related mortgage loan (including a Serviced Companion Loan) or REO property as additional compensation within the prior 12 months, but only to the extent those fees have not previously been deducted from a Workout Fee or Liquidation Fee. Similar fees to those described above will be payable to the applicable special servicer for the Non-Serviced Whole Loans under the related trust and servicing agreement or pooling and servicing agreement, as applicable. Subject to certain limited exceptions, in connection with its duties under the Pooling and Servicing Agreement, the Special Servicer and its affiliates are prohibited from receiving or retaining any compensation (other than compensation specifically provided for under the Pooling and Servicing Agreement) from anyone in connection with the disposition, workout or foreclosure of any mortgage loan, the management or disposition of any REO property, or the performance of any other special servicing duties under the Pooling and Servicing Agreement. In the event the Special Servicer does receive any such compensation, it will be required to disclose those fees to the Certificate Administrator who will include it as part of the statement to Certificateholders. In addition, no Liquidation Fee will be payable to the Special Servicer if a mortgage loan or Serviced Whole Loan becomes a specially serviced loan only because of a maturity default and the related liquidation proceeds are received within 90 days following the related maturity date as a result of the related mortgage loan or Serviced Whole Loan being refinanced or otherwise repaid in full. | ||
■ Deal Website: |
The Certificate Administrator will maintain a deal website to which certain persons will have access to certain information including, but not limited to the following, which will be posted: ■ special notices, ■ summaries of any final asset status reports, ■ appraisals in connection with Appraisal Reduction Events (as defined in the Preliminary Prospectus) plus any second appraisals ordered, ■ an “Investor Q&A Forum,” ■ a voluntary investor registry, and ■ SEC EDGAR filings. |
THE INFORMATION IN THIS STRUCTURAL AND COLLATERAL TERM SHEET IS NOT COMPLETE AND MAY BE AMENDED PRIOR TO THE TIME OF SALE. THIS TERM SHEET IS NOT AN OFFER TO SELL THESE SECURITIES AND IT IS NOT A SOLICITATION OF AN OFFER TO BUY THESE SECURITIES IN ANY JURISDICTION WHERE THE OFFER OR SALE IS NOT PERMITTED. | ||
| 30 | ||
| Structural and Collateral Term Sheet | BBCMS 2025-5C34 | |
| No. 1 – The Wave | ||
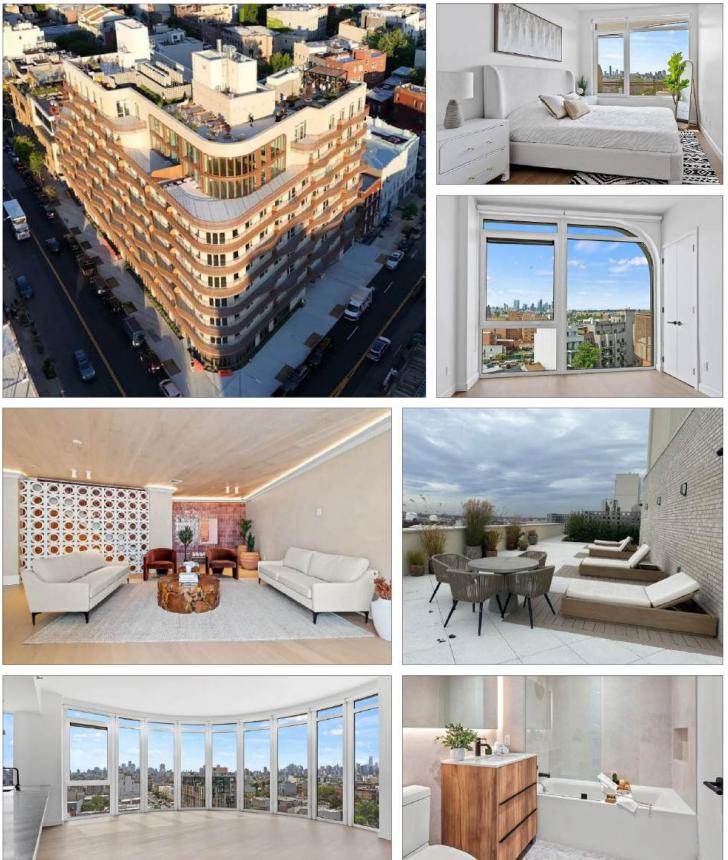
THE INFORMATION IN THIS STRUCTURAL AND COLLATERAL TERM SHEET IS NOT COMPLETE AND MAY BE AMENDED PRIOR TO THE TIME OF SALE. THIS TERM SHEET IS NOT AN OFFER TO SELL THESE SECURITIES AND IT IS NOT A SOLICITATION OF AN OFFER TO BUY THESE SECURITIES IN ANY JURISDICTION WHERE THE OFFER OR SALE IS NOT PERMITTED. | ||
| 31 | ||
| Structural and Collateral Term Sheet | BBCMS 2025-5C34 | |
| No. 1 – The Wave | ||
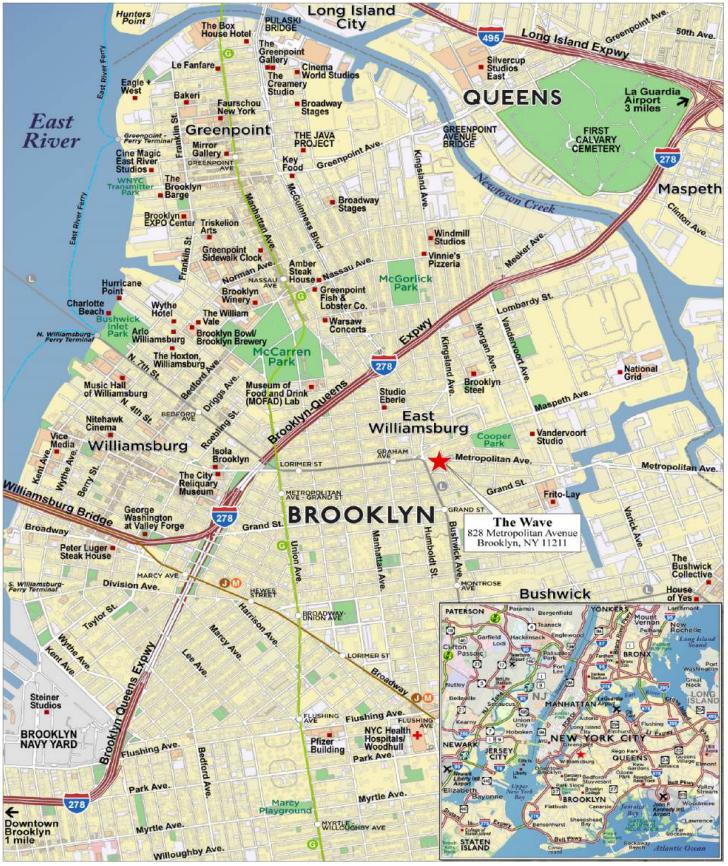
THE INFORMATION IN THIS STRUCTURAL AND COLLATERAL TERM SHEET IS NOT COMPLETE AND MAY BE AMENDED PRIOR TO THE TIME OF SALE. THIS TERM SHEET IS NOT AN OFFER TO SELL THESE SECURITIES AND IT IS NOT A SOLICITATION OF AN OFFER TO BUY THESE SECURITIES IN ANY JURISDICTION WHERE THE OFFER OR SALE IS NOT PERMITTED. | ||
| 32 | ||
| Structural and Collateral Term Sheet | BBCMS 2025-5C34 | |
| No. 1 – The Wave | ||
| Mortgage Loan Information | Property Information | |||
| Mortgage Loan Seller: | CREFI | Single Asset / Portfolio: | Single Asset | |
| Original Principal Balance(1): | $65,000,000 | Title: | Fee | |
| Cut-off Date Principal Balance(1): | $65,000,000 | Property Type – Subtype: | Multifamily – High Rise | |
| % of Pool by IPB: | 8.3% | Net Rentable Area (Units)(5): | 136 | |
| Loan Purpose: | Refinance | Location: | Brooklyn, NY | |
| Borrower: | Upton Metropolitan, LLC | Year Built / Renovated: | 2024 / NAP | |
| Borrower Sponsor: | Joel Wertzberger | Occupancy(5): | 95.6% | |
| Interest Rate: | 5.91000% | Occupancy Date: | 3/6/2025 | |
| Note Date: | 4/2/2025 | 4th Most Recent NOI (As of)(6): | NAV | |
| Maturity Date: | 4/6/2030 | 3rd Most Recent NOI (As of)(6): | NAV | |
| Interest-only Period: | 60 months | 2nd Most Recent NOI (As of)(6): | NAV | |
| Original Term: | 60 months | Most Recent NOI (As of)(6): | NAV | |
| Original Amortization: | None | UW Economic Occupancy: | 94.4% | |
| Amortization Type: | Interest Only | UW Revenues: | $7,606,122 | |
| Call Protection(2): | L(25),D(28),O(7) | UW Expenses: | $842,740 | |
| Lockbox / Cash Management: | Springing | UW NOI(7): | $6,763,382 | |
| Additional Debt(1): | Yes | UW NCF(7): | $6,711,854 | |
| Additional Debt Balance(1): | $23,000,000 | Appraised Value / Per Unit: | $122,300,000 / $899,265 | |
| Additional Debt Type(1): | Pari Passu | Appraisal Date: | 11/21/2024 | |
| Escrows and Reserves(3) | Financial Information(1) | |||||
| Initial | Monthly | Initial Cap | Cut-off Date Loan / Unit(5): | $647,059 | ||
| Taxes: | $13,061 | $6,443 | N/A | Maturity Date Loan / Unit(5): | $647,059 | |
| Insurance: | $9,619 | $9,619 | N/A | Cut-off Date LTV: | 72.0% | |
| Replacement Reserves: | $0 | $3,012 | N/A | Maturity Date LTV: | 72.0% | |
| Other(4): | $6,404,148 | $0 | N/A | UW NCF DSCR: | 1.27x | |
| UW NOI Debt Yield: | 7.7% | |||||
| Sources and Uses | |||||||
| Sources | Proceeds | % of Total | Uses | Proceeds | % of Total | ||
| Whole Loan(1) | $88,000,000 | 100.0% | Loan Payoff | $63,617,572 | 72.3 | % | |
| Borrower Sponsor Equity | 13,732,874 | 15.6 | |||||
| Upfront Reserves | 6,426,828 | 7.3 | |||||
| Closing Costs(8) | 4,222,725 | 4.8 | |||||
| Total Sources | $88,000,000 | 100.0% | Total Uses | $88,000,000 | 100.0 | % | |
| (1) | The Wave Mortgage Loan (as defined below) is part of a whole loan evidenced by two pari passu promissory notes with an aggregate outstanding principal balance as of the Cut-off Date of $88,000,000 (“The Wave Whole Loan”). The Financial Information in the chart above reflects The Wave Whole Loan. |
| (2) | Defeasance of The Wave Whole Loan is permitted at any time after the earlier to occur of (a) the end of the two-year period commencing on the closing date of the securitization of the last promissory note representing a portion of The Wave Whole Loan to be securitized and (b) April 2, 2029. The assumed defeasance lockout period of 25 payments is based on the anticipated closing date of the BBCMS 2025-5C34 securitization in May 2025. The actual lockout period may be longer. |
| (3) | See “Escrows and Reserves” below for further discussion of reserve information. |
| (4) | Other reserves include an approximately $79,148 gap rent reserve for five residential units with executed lease start dates between June 2025 and July 2025 and a $6,325,000 retail space holdback reserve which will be released upon the execution of a retail lease at a minimum annual rent of $500,000 with no outs for a minimum term of ten years. |
| (5) | Net Rentable Area, Occupancy, Cut-off Date Loan / Unit and Maturity Date Loan / Unit are based on the multifamily component of The Wave Property (as defined below) and exclude 14,250 square feet of commercial space which was not occupied as of origination. |
| (6) | Historical NOI information is not available because The Wave Property was recently constructed in 2024. |
| (7) | As of origination, a letter of intent had been signed for the commercial space for which $513,000 of annual commercial rental income has been underwritten. There can be no assurance the letter of intent will be converted to a lease or that rent will be received for the commercial space. |
| (8) | Closing Costs include a rate buydown fee of $2,640,000. |
THE INFORMATION IN THIS STRUCTURAL AND COLLATERAL TERM SHEET IS NOT COMPLETE AND MAY BE AMENDED PRIOR TO THE TIME OF SALE. THIS TERM SHEET IS NOT AN OFFER TO SELL THESE SECURITIES AND IT IS NOT A SOLICITATION OF AN OFFER TO BUY THESE SECURITIES IN ANY JURISDICTION WHERE THE OFFER OR SALE IS NOT PERMITTED. | ||
| 33 | ||
| Structural and Collateral Term Sheet | BBCMS 2025-5C34 | |
| No. 1 – The Wave | ||
The Loan. The Wave mortgage loan (“The Wave Mortgage Loan”) is secured by the borrower’s fee interest in a Class A, nine-story, 136-unit high rise multifamily building with 14,250 square feet of commercial space located in the East Williamsburg neighborhood of Brooklyn, New York (“The Wave Property”). The Wave Whole Loan is evidenced by two pari passu promissory notes with an aggregate outstanding principal balance as of the Cut-off Date of $88,000,000. The Wave Whole Loan has an initial term of five years, is interest-only for the full term and accrues interest at a fixed rate of 5.91000% per annum on an Actual/360 basis. The Wave Mortgage Loan is evidenced by the controlling Note A-1 with an outstanding principal balance as of the Cut-off Date of $65,000,000.
The relationship between the holders of The Wave Whole Loan is governed by a co-lender agreement as described under “Description of the Mortgage Pool—The Whole Loans—The Serviced Pari Passu Whole Loans” in the Preliminary Prospectus. The Wave Whole Loan will be serviced under the pooling and servicing agreement for the BBCMS 2025-5C34 securitization trust. See “The Pooling and Servicing Agreement” in the Preliminary Prospectus.
| Whole Loan Summary | ||||
| Note | Original Balance | Cut-off Date Balance | Note Holder | Controlling Piece |
| A-1 | $65,000,000 | $65,000,000 | BBCMS 2025-5C34 | Yes |
| A-2(1) | $23,000,000 | $23,000,000 | CREFI | No |
| Whole Loan | $88,000,000 | $88,000,000 | ||
| (1) | Expected to be contributed to one or more future securitization trusts. |
The Property. The Wave Property is a recently constructed, 136-unit, nine-story, Class A, high-rise multifamily property. The Wave Property was completed in 2024 and is located on an approximately 0.53-acre site, and in addition to the multifamily space, The Wave Property features 14,250 square feet of commercial space, a 22-car parking garage and 22 storage units. Amenities at The Wave Property include a fitness center, business center, concierge/doorman, and rooftop area. The commercial space at The Wave Property includes 8,050 square feet of ground floor retail, 2,700 square feet of lower-level space, and 3,500 square feet of rooftop space. As of origination, the commercial rental space was not occupied but a letter of intent had been signed for the entirety of the space for which $513,000 of such annual commercial income has been underwritten. There can be no assurance the letter of intent will be converted to a lease or that rent will be received for the commercial space.
The unit mix at The Wave Property consists of 12 studio units, 74 one-bedroom units, and 50 two-bedroom units. Unit amenities at The Wave Property include full appliance packages including a dishwasher, electric stove/oven, refrigerator/freezer, and in-unit washer/dryers. As of March 6, 2025, the multifamily units at The Wave Property were 95.6% leased.
The Wave Property benefits from a 35-year 421-a Affordable New York Housing Tax Exemption Program exemption. To qualify for the tax exemption, at least 25% of the units at The Wave Property must be leased as “affordable units.” For the first 25 years of such exemption, 100% of the projected assessed value of The Wave Property improvements on the tax lot will be exempt from real estate taxes and for the remaining 10 years of the exemption 25.74% (the percentage of the units which are affordable) of such value will be exempt. In addition, the 421-a tax exemption requires that the units be rent stabilized, that at least 35 units must be restricted to tenants earning at or below 130% of AMI, and at least 10% of units be restricted to tenants at or below 40% of AMI, 10% at or below 60% of AMI and 5% at or below 130% of AMI. As of March 6, 2025, 35 units were rent stabilized accounting for 8.8% of underwritten residential base rent. Taxes were underwritten to the five-year average estimated taxes of $89,928 versus the five-year average estimated full tax liability of $2,778,183. See “Description of the Mortgage Pool—Real Estate and Other Tax Considerations” in the Preliminary Prospectus.
The borrower is subject to a Mandatory Inclusionary Housing Restrictive Declaration (the “Wave Declaration”) pursuant to which 30 of the 136 units at The Wave Property must be affordable housing units, for which the weighted average of all income bands may not exceed 60% of area median income (“AMI”), no income band may exceed 130% of AMI and at least 10% of the residential floor area within the inclusionary housing units must be affordable within a 40% of AMI income band. Under the Wave Declaration, 12 units are restricted to tenants earning not more than 40% of AMI, 13 units to tenants earning not more than 60% of AMI, and five units to tenants earning not more than 100% of AMI. In addition, to obtain additional floor area ratio, the borrower entered into a regulatory agreement (the “Wave Agreement,” and together with the Wave Declaration, the “Wave Regulatory Documents”) pursuant to which it agreed an additional two units at The Wave Property would be affordable units restricted to tenants earning not more than 80% of AMI. The
THE INFORMATION IN THIS STRUCTURAL AND COLLATERAL TERM SHEET IS NOT COMPLETE AND MAY BE AMENDED PRIOR TO THE TIME OF SALE. THIS TERM SHEET IS NOT AN OFFER TO SELL THESE SECURITIES AND IT IS NOT A SOLICITATION OF AN OFFER TO BUY THESE SECURITIES IN ANY JURISDICTION WHERE THE OFFER OR SALE IS NOT PERMITTED. | ||
| 34 | ||
| Structural and Collateral Term Sheet | BBCMS 2025-5C34 | |
| No. 1 – The Wave | ||
Wave Regulatory Documents require the affordable units to be rent stabilized. Maximum rent for each affordable unit is 30% of the related percentage of AMI. The lender entered into subordination agreements subordinating The Wave Whole Loan to the Wave Regulatory Documents. See “Description of the Mortgage Loan—Property Types—Multifamily Properties” in the Preliminary Prospectus.
The following table presents certain information relating to the multifamily unit mix at The Wave Property:
| The Wave Unit Mix(1) | |||||||
| Unit Type | # of Units | % of Total | Occupied Units | Occupancy | Average Unit Size (SF) | Average Monthly Rental Rate Per Unit | Average Monthly Market Rent Per Unit(2) |
| Studio - Fair Market | 9 | 6.6% | 9 | 100.0% | 369 | $3,583 | $3,800 |
| Studio - Affordable | 3 | 2.2% | 3 | 100.0% | 367 | $1,951 | $1,951 |
| 1 Bedroom - Fair Market | 55 | 40.4% | 55 | 100.0% | 504 | $4,636 | $4,600 |
| 1 Bedroom - Affordable | 19 | 14.0% | 19 | 100.0% | 521 | $1,310 | $1,310 |
| 2 Bedroom - Fair Market | 37 | 27.2% | 33 | 89.2% | 786 | $7,083 | $6,800 |
| 2 Bedroom - Affordable | 13 | 9.6% | 11 | 84.6% | 770 | $1,797 | $2,057 |
| Total/Wtd. Avg. | 136 | 100.0% | 130 | 95.6% | 596 | $4,396 | $4,384 |
| (1) | Based on the underwritten rent roll dated March 6, 2025. |
| (2) | Source: Appraisal. |
Appraisal. According to the appraisal, The Wave Property had an “as-is” appraised value of $122,300,000 as of November 21, 2024. The table below shows the appraisal’s “as-is” conclusions.
| The Wave(1) | ||
| Property | Value | Capitalization Rate |
| The Wave | $122,300,000 | 5.50% |
| (1) | Source: Appraisal |
Environmental. According to the Phase I environmental site assessment dated November 19, 2024, there was no evidence of any recognized environmental conditions at The Wave Property.
The following table presents certain information relating to the current multifamily occupancy of The Wave Property:
| Current Occupancy(1) | |
| Current(2) | |
| The Wave | 95.6% |
| (1) | Historical occupancy information is not available as The Wave Property was recently constructed in 2024. |
| (2) | Current occupancy represents multifamily occupancy as of March 6, 2025. |
THE INFORMATION IN THIS STRUCTURAL AND COLLATERAL TERM SHEET IS NOT COMPLETE AND MAY BE AMENDED PRIOR TO THE TIME OF SALE. THIS TERM SHEET IS NOT AN OFFER TO SELL THESE SECURITIES AND IT IS NOT A SOLICITATION OF AN OFFER TO BUY THESE SECURITIES IN ANY JURISDICTION WHERE THE OFFER OR SALE IS NOT PERMITTED. | ||
| 35 | ||
| Structural and Collateral Term Sheet | BBCMS 2025-5C34 | |
| No. 1 – The Wave | ||
The following table presents certain information relating to the Underwritten Net Cash Flow of The Wave Property:
| Underwritten Net Cash Flow | |||
| Underwritten | Per Unit(1) | %(2) | |
| Base Rent - Residential | $6,857,712 | $50,424 | 94.4% |
| Potential Income from Vacant Units | 410,076 | $3,015 | 5.6% |
| Gross Potential Income - Residential | $7,267,788 | $53,440 | 100.0% |
| Other Income – Residential(3) | 235,410 | $1,731 | 3.2% |
| Net Rental Income | $7,503,198 | $55,171 | 103.2% |
| (Vacancy / Credit Loss) | (410,076) | ($3,015) | (5.6%) |
| Total Effective Gross Income - Residential | $7,093,122 | $52,155 | 97.6% |
| Base Rent - Commercial | $540,000 | $38 | 100.0% |
| Potential Income from Vacant Units | 0 | $0 | 0.0% |
| Gross Potential Income - Commercial | $540,000 | $38 | 100.0% |
| Other Income – Commercial | 0 | $0 | 0.0% |
| Net Rental Income - Commercial(4) | $540,000 | $38 | 100.0% |
| (Vacancy / Credit Loss) | (27,000) | ($2) | (5.0%) |
| Effective Gross Income - Commercial | $513,000 | $36 | 95.0% |
| Total Effective Gross Income | $7,606,122 | $55,927 | 100.0% |
| Real Estate Taxes(5) | 89,928 | $661 | 1.2% |
| Insurance | 109,929 | $808 | 1.4% |
| Management Fee | 228,184 | $1,678 | 3.0% |
| Other Expenses(6) | 414,699 | $3,049 | 5.5% |
| Total Expenses | $842,740 | $6,197 | 11.1% |
| Net Operating Income | $6,763,382 | $49,731 | 88.9% |
| Replacement Reserves - Residential | 34,000 | $250 | 0.4% |
| Replacement Reserves - Commercial | 2,138 | $0.15 | 0.0% |
| Normalized TI/LC | 15,390 | $113 | 0.2% |
| Net Cash Flow | $6,711,854 | $49,352 | 88.2% |
| (1) | The per unit column is based on total multifamily units (136 units) for all line items except for commercial items which are based on total commercial SF at The Wave Property (14,250 SF). |
| (2) | The % column represents percentage of Gross Potential Income for all corresponding revenue lines (i.e. residential vs commercial) and represents percentage of Total Effective Gross Income for the remainder of the fields. |
| (3) | Other Income - Residential includes parking and storage income as well as amenity fees. |
| (4) | No lease is currently in place for the commercial space. As of origination, a letter of intent had been signed for the commercial space for which $513,000 of annual commercial rental income has been underwritten. There can be no assurance the letter of intent will be converted to a lease or that rent will be received for the commercial space. |
| (5) | The Wave Property benefits from a 421a tax abatement. Real Estate Taxes were underwritten to the five-year average estimated taxes of $89,928 versus the five-year average estimated full tax liability of $2,778,183. See “Description of the Mortgage Pool—Real Estate and Other Tax Considerations” in the Preliminary Prospectus. |
| (6) | Other Expenses consist of payroll and benefits, repairs and maintenance, utilities, and general and administrative expenses. |
THE INFORMATION IN THIS STRUCTURAL AND COLLATERAL TERM SHEET IS NOT COMPLETE AND MAY BE AMENDED PRIOR TO THE TIME OF SALE. THIS TERM SHEET IS NOT AN OFFER TO SELL THESE SECURITIES AND IT IS NOT A SOLICITATION OF AN OFFER TO BUY THESE SECURITIES IN ANY JURISDICTION WHERE THE OFFER OR SALE IS NOT PERMITTED. | ||
| 36 | ||
| Structural and Collateral Term Sheet | BBCMS 2025-5C34 | |
| No. 1 – The Wave | ||
The Market. The Wave Property is located at 828 Metropolitan Avenue, in the East Williamsburg multifamily submarket of Brooklyn, New York. Primary access to the neighborhood is provided by Bushwick Avenue with public transportation provided by the L subway line located approximately two blocks from The Wave Property. The Wave Property is located across the street from Cooper Park and is approximately 0.4-miles, 0.7-miles, and 0.7-miles away from Brooklyn Steel, The Brooklyn Monarch, and McCarren Park, respectively.
According to a third-party market research report, The Wave Property is located in the Williamsburg multifamily submarket of the New York metropolitan multifamily market. As of March 10, 2025, the Williamsburg multifamily submarket had total inventory of 42,283 units, a vacancy rate of 3.9%, asking rent of $4,467 per unit and positive net absorption of 196 units. Furthermore, according to a third-party market research report, The Wave Property is located within the North Brooklyn Retail submarket which, as of March 10, 2025, had inventory of 51,832,546 square feet, a vacancy rate of 2.9% and asking rent of $55.14 per square foot.
According to the appraisal, the 2024 population within the 11211 zip code of Brooklyn was 67,467. The 2024 average household income within the neighborhood was $152,842.
The following table presents certain information relating to comparable multifamily properties to The Wave Property:
| Multifamily Rent Comparables(1) | ||||||
| Property Name / Address | Distance from Subject | Year Built / Renovated | Number of Units |
Unit Type |
Average Unit Size | Average Rent Per Unit |
|
The Wave(2) 828 Metropolitan Avenue Brooklyn, NY 11211
|
-
|
2024 / NAP
|
136
|
Studio - Fair Market | 369 SF | $3,583 |
| 1 Bedroom - Fair Market | 504 SF | $4,636 | ||||
| 2 Bedroom - Fair Market | 786 SF | $7,083 | ||||
|
597 Grand Street Brooklyn, NY, 11211
|
0.4 mi
|
2023 / NAP
|
134
|
Studio | 400 SF | $3,772 |
| 1 BR / 1 BA | 600 SF | $4,326 | ||||
| 2 BR / 2 BA | 900 SF | $6,818 | ||||
|
130 Hope Street Brooklyn, NY, 11211
|
0.6 mi
|
2022 / NAP
|
144
|
Studio | 400 SF | $3,762 |
| 1 BR / 1 BA | 570 SF | $4,889 | ||||
| 2 BR / 2 BA | 850 SF | $6,519 | ||||
| 3 BR / 2 BA | 1,000 SF | $7,952 | ||||
|
123 Hope Street Brooklyn, NY, 11211
|
0.6 mi
|
2017 / NAP
|
136
|
Studio | 535 SF | $3,525 |
| 1 BR / 1 BA | 650 SF | $4,150 | ||||
| 2 BR / 1 BA | 906 SF | $5,725 | ||||
|
125 Borinquen Place Brooklyn, NY, 11211 |
0.7 mi
|
2017 / NAP
|
133
|
1 BR / 1 BA | 708 SF | $3,936 |
| 2 BR / 1 BA | 984 SF | $4,846 | ||||
|
275 Lorimer Street Brooklyn, NY, 11206
|
0.8 mi
|
2023 / NAP
|
270
|
Studio | 500 SF | $4,150 |
| 1 BR / 1 BA | 600 SF | $4,700 | ||||
| 2 BR / 1 BA | 850 SF | $4,800 | ||||
| 2 BR / 2 BA | 900 SF | $6,500 | ||||
| 3 BR / 2 BA | 1,100 SF | $6,500 | ||||
| (1) | Source: Appraisal. |
| (2) | Based on the underwritten rent roll dated March 6, 2025. |
The Borrower. The borrower is Upton Metropolitan, LLC, a New York limited liability company and single purpose entity having at least one independent director in its organizational structure. Legal counsel to the borrower delivered a non-consolidation opinion in connection with the origination of The Wave Whole Loan.
The Borrower Sponsor. The borrower sponsor and non-recourse carveout guarantor is Joel Wertzberger. Joel Wertzberger is the founder and chief executive officer of Hamilton Eastman, a real estate holding company based in Brooklyn which has multiple additional brands including Joyland Group and Joyland Management LLC.
Property Management. The Wave Property is managed by Joyland Management LLC, a borrower-affiliated management company.
THE INFORMATION IN THIS STRUCTURAL AND COLLATERAL TERM SHEET IS NOT COMPLETE AND MAY BE AMENDED PRIOR TO THE TIME OF SALE. THIS TERM SHEET IS NOT AN OFFER TO SELL THESE SECURITIES AND IT IS NOT A SOLICITATION OF AN OFFER TO BUY THESE SECURITIES IN ANY JURISDICTION WHERE THE OFFER OR SALE IS NOT PERMITTED. | ||
| 37 | ||
| Structural and Collateral Term Sheet | BBCMS 2025-5C34 | |
| No. 1 – The Wave | ||
Escrows and Reserves. At origination of The Wave Whole Loan, the borrower deposited approximately (i) $13,061 into a reserve account for real estate taxes, (ii) $9,619 into a reserve account for insurance premiums, (iii) $6,325,000 into an earnout reserve account related to the retail space, and (iv) $79,148 into a reserve account for gap rent.
Tax Escrows – On a monthly basis, the borrower is required to deposit into a real estate tax reserve 1/12th of the property taxes that the lender estimates will be payable over the next-ensuing 12-month period (initially estimated to be approximately $6,443).
Insurance Escrows – If the liability or casualty policies maintained by the borrower do not constitute an approved blanket or umbrella policy or the lender requires the borrower to obtain a separate policy, the borrower is required to deposit into an insurance reserve, on a monthly basis, 1/12th of the amount which would be sufficient to pay the insurance premiums due for the renewal of coverage afforded by such policies (initially estimated to be approximately $9,619).
Replacement Reserves – On a monthly basis, the borrower is required to deposit approximately $3,012 into a replacement reserve.
Retail Space Earnout Reserve – The funds in the retail space reserve will be released to the borrower only if the borrower has satisfied the following conditions by April 6, 2027 (the “Release Deadline”): (a) the borrower has delivered a signed lease or leases for all or a portion of the retail space with terms and provisions reasonably acceptable to the lender and customary and usual for the market in which The Wave Property is located, which terms must include annual rent of at least $500,000, a term of not less than 10 years and a third party tenant not affiliated with the borrower; (b) such lease or leases must have no remaining conditions to effectiveness; (c) the applicable tenant(s) are paying full unabated rent (other than any market free rent period that is discernible in length and which has been reserved for with the lender); (d) if such lease or leases requires the borrower to perform or pay for any work or leasing commissions, any such amounts have been paid and certain other requirements have been satisfied in connection with such work, and (e) no Trigger Period (as defined below) exists. If such conditions are not satisfied by the Release Deadline, funds in the retail space reserve are required to continue to be held by the lender as collateral for The Wave Whole Loan and not released to the borrower.
Lockbox / Cash Management. The Wave Whole Loan is structured with a springing lockbox and springing cash management. On the first occurrence of a Trigger Period, the borrower is required to establish a lender-controlled lockbox account, and is thereafter required to deposit, or cause the property manager to immediately deposit, all revenue received by the borrower or the property manager into such lockbox. Within five days after the first occurrence of a Trigger Period, the borrower is required to deliver a notice to all commercial tenants at The Wave Property directing them to remit rent and all other sums due under the applicable lease directly to the lender-controlled lockbox account. In addition, upon the first occurrence of a Trigger Period, the lender is required to establish a lender-controlled cash management account. All funds deposited into the lockbox are required to be transferred on each business day to, or at the direction of, the borrower, unless a Trigger Period exists and the lender elects (in its sole and absolute discretion) to deliver a restricted account notice to the institution maintaining the lockbox account, in which case all funds in the lockbox account are required to be swept on each business day to the lender-controlled cash management account to be applied and disbursed in accordance with The Wave Whole Loan documents, and all excess cash flow funds remaining in the cash management account after the application of such funds in accordance with The Wave Whole Loan documents are required to be held by the lender in an excess cash flow reserve account as additional collateral for The Wave Whole Loan. Upon the cure of the applicable Trigger Period, so long as no other Trigger Period exists, the lender is required to return any amounts remaining on deposit in the excess cash flow reserve account to the borrower. Upon an event of default under The Wave Whole Loan documents, the lender may apply funds in the accounts to the debt in such priority as it may determine.
“Trigger Period” means a period (A) commencing upon the earliest of (i) the occurrence and continuance of an event of default under The Wave Whole Loan documents and (ii) the debt service coverage ratio being less than 1.15x and (B) expiring upon (x) with regard to clause (i) above, the cure (if applicable) of such event of default under The Wave Whole Loan documents and (y) with regard to clause (ii) above, the date that the debt service coverage ratio is equal to or greater than 1.15x for two consecutive calendar quarters.
Subordinate and Mezzanine Debt. None.
Permitted Future Subordinate or Mezzanine Debt. Not permitted.
THE INFORMATION IN THIS STRUCTURAL AND COLLATERAL TERM SHEET IS NOT COMPLETE AND MAY BE AMENDED PRIOR TO THE TIME OF SALE. THIS TERM SHEET IS NOT AN OFFER TO SELL THESE SECURITIES AND IT IS NOT A SOLICITATION OF AN OFFER TO BUY THESE SECURITIES IN ANY JURISDICTION WHERE THE OFFER OR SALE IS NOT PERMITTED. | ||
| 38 | ||
| Structural and Collateral Term Sheet | BBCMS 2025-5C34 | |
| No. 1 – The Wave | ||
Partial Release. Not permitted.
Ground Lease. None.
THE INFORMATION IN THIS STRUCTURAL AND COLLATERAL TERM SHEET IS NOT COMPLETE AND MAY BE AMENDED PRIOR TO THE TIME OF SALE. THIS TERM SHEET IS NOT AN OFFER TO SELL THESE SECURITIES AND IT IS NOT A SOLICITATION OF AN OFFER TO BUY THESE SECURITIES IN ANY JURISDICTION WHERE THE OFFER OR SALE IS NOT PERMITTED. | ||
| 39 | ||
| Structural and Collateral Term Sheet | BBCMS 2025-5C34 | |
| No. 2 – WallyPark SeaTac | ||
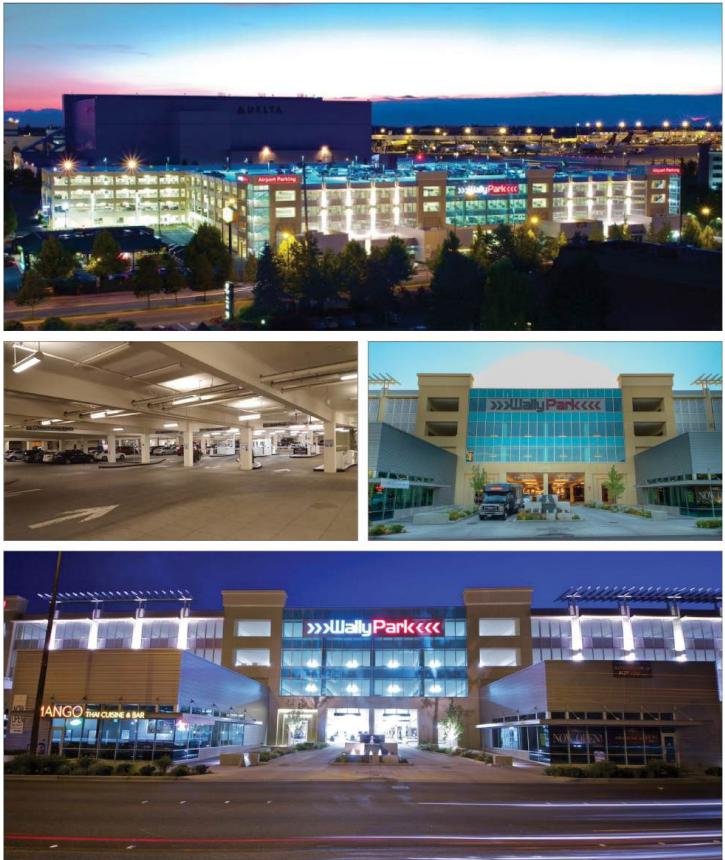
THE INFORMATION IN THIS STRUCTURAL AND COLLATERAL TERM SHEET IS NOT COMPLETE AND MAY BE AMENDED PRIOR TO THE TIME OF SALE. THIS TERM SHEET IS NOT AN OFFER TO SELL THESE SECURITIES AND IT IS NOT A SOLICITATION OF AN OFFER TO BUY THESE SECURITIES IN ANY JURISDICTION WHERE THE OFFER OR SALE IS NOT PERMITTED. | ||
| 40 | ||
| Structural and Collateral Term Sheet | BBCMS 2025-5C34 | |
| No. 2 – WallyPark SeaTac | ||
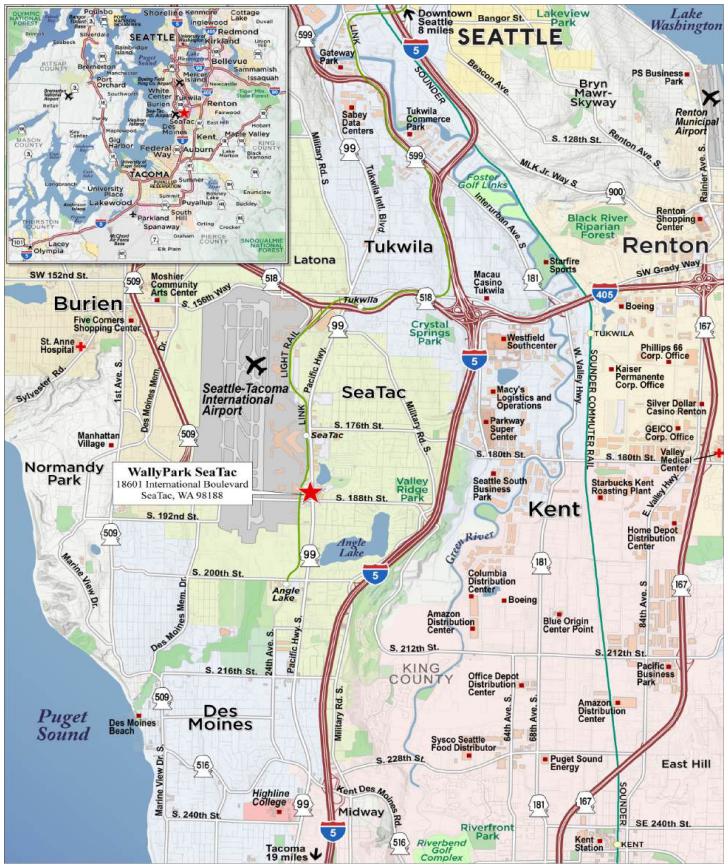
THE INFORMATION IN THIS STRUCTURAL AND COLLATERAL TERM SHEET IS NOT COMPLETE AND MAY BE AMENDED PRIOR TO THE TIME OF SALE. THIS TERM SHEET IS NOT AN OFFER TO SELL THESE SECURITIES AND IT IS NOT A SOLICITATION OF AN OFFER TO BUY THESE SECURITIES IN ANY JURISDICTION WHERE THE OFFER OR SALE IS NOT PERMITTED. | ||
| 41 | ||
| Structural and Collateral Term Sheet | BBCMS 2025-5C34 | |
| No. 2 – WallyPark SeaTac | ||
| Mortgage Loan Information | Property Information | |||
| Mortgage Loan Seller: | CREFI | Single Asset / Portfolio: | Single Asset | |
| Original Principal Balance: | $60,600,000 | Title: | Fee | |
| Cut-off Date Principal Balance: | $60,600,000 | Property Type – Subtype: | Other - Parking Garage | |
| % of IPB: | 7.7% | Spaces(2): | 1,553 | |
| Loan Purpose: | Refinance | Location: | SeaTac, WA | |
| Borrower: | SeaTac WallyPark LLC | Year Built / Renovated: | 2010 / NAP | |
| Borrower Sponsor: | Jordan S. Simons | Occupancy: | NAP | |
| Interest Rate: | 8.41000% | Occupancy Date: | NAP | |
| Note Date: | 4/11/2025 | 4th Most Recent NOI (As of): | $5,350,877 (12/31/2022) | |
| Maturity Date: | 5/6/2030 | 3rd Most Recent NOI (As of): | $6,340,275 (12/31/2023) | |
| Interest-only Period: | 60 months | 2nd Most Recent NOI (As of): | $6,353,366 (12/31/2024) | |
| Original Term: | 60 months | Most Recent NOI (As of): | $6,535,702 (2/28/2025) | |
| Original Amortization Term: | None | UW Economic Occupancy: | 79.0% | |
| Amortization Type: | Interest Only | UW Revenues: | $10,977,320 | |
| Call Protection: | L(23),YM1(30),O(7) | UW Expenses: | $3,994,638 | |
| Lockbox / Cash Management: | Hard / Springing | UW NOI: | $6,982,682 | |
| Additional Debt: | No | UW NCF: | $6,889,279 | |
| Additional Debt Balance: | N/A | Appraised Value / Per Space(2): | $121,200,000 / $78,042 | |
| Additional Debt Type: | N/A | Appraisal Date: | 2/20/2025 | |
| Escrows and Reserves(1) | Financial Information | |||||
| Initial | Monthly | Initial Cap | Cut-off Date Loan / Space(2): | $39,021 | ||
| Taxes: | $46,678 | $46,678 | N/A | Maturity Date Loan / Space(2): | $39,021 | |
| Insurance: | $0 | Springing | N/A | Cut-off Date LTV: | 50.0% | |
| Replacement Reserves: | $0 | $6,642 | $239,115 | Maturity Date LTV: | 50.0% | |
| TI / LC: | $0 | $1,142 | N/A | UW NCF DSCR: | 1.33x | |
| UW NOI Debt Yield: | 11.5% | |||||
| Sources and Uses | ||||||||
| Sources | Proceeds | % of Total | Uses | Proceeds | % of Total | |||
| Mortgage Loan | $60,600,000 | 98.7 | % | Partnership Buyout(3) | $30,478,683 | 49.7 | % | |
| Borrower Sponsor Equity | 775,000 | 1.3 | Loan Payoff | 28,002,071 | 45.6 | |||
| Closing Costs(4) | 2,847,568 | 4.6 | ||||||
| Upfront Reserves | 46,678 | 0.1 | ||||||
| Total Sources | $61,375,000 | 100.0 | % | Total Uses | $61,375,000 | 100.0 | % | |
| (1) | See “Escrows and Reserves” below for further discussion of reserve information. |
| (2) | Spaces, Occupancy, Appraised Value / Per Space, Cut-off Date Loan / Space, and Maturity Date Loan / Space represent the parking component of the WallyPark SeaTac Property (as defined below). The WallyPark SeaTac Property also includes 13,699 square feet of retail space which, as of April 1, 2025, was 82.6% occupied. |
| (3) | At origination proceeds were used for a partnership buyout of L&R Investment Company. At origination, L&R Investment Company was the interim property manager of the WallyPark SeaTac Property. It is expected that the borrower sponsor will retain a national parking operator to manage the WallyPark SeaTac Property. There can be no assurance that this management change will be completed. |
| (4) | Closing Costs include an interest rate buydown fee of $1,212,000. |
The Loan. The WallyPark SeaTac mortgage loan (the “WallyPark SeaTac Mortgage Loan”) is secured by the borrower’s fee interest in a 1,553-space parking garage located next to the Seattle-Tacoma International Airport (“SeaTac International Airport”) in SeaTac, Washington (the “WallyPark SeaTac Property”). The WallyPark SeaTac Mortgage Loan is comprised of two promissory notes with an aggregate outstanding principal balance as of the Cut-off Date of $60,600,000. The WallyPark SeaTac Mortgage Loan was originated on April 11, 2025 by Citi Real Estate Funding Inc. (“CREFI”) and accrues interest at a fixed rate of 8.41000% per annum. The WallyPark SeaTac Mortgage Loan has an initial term of five years, is interest-only for the full term and accrues interest on an Actual/360 basis. The scheduled maturity date of the WallyPark SeaTac Mortgage Loan is May 6, 2030.
THE INFORMATION IN THIS STRUCTURAL AND COLLATERAL TERM SHEET IS NOT COMPLETE AND MAY BE AMENDED PRIOR TO THE TIME OF SALE. THIS TERM SHEET IS NOT AN OFFER TO SELL THESE SECURITIES AND IT IS NOT A SOLICITATION OF AN OFFER TO BUY THESE SECURITIES IN ANY JURISDICTION WHERE THE OFFER OR SALE IS NOT PERMITTED. | ||
| 42 | ||
| Structural and Collateral Term Sheet | BBCMS 2025-5C34 | |
| No. 2 – WallyPark SeaTac | ||
The Property. The WallyPark SeaTac Property is a 1,553-space, four-level, above-ground parking garage totaling 596,532 square feet. The WallyPark SeaTac Property was constructed in 2010 on an approximately 3.92-acre site and is located in close proximity to the SeaTac International Airport. The SeaTac International Airport serves the Pacific Northwest and is the primary transportation hub for Seattle, Washington. The SeaTac International Airport serves 37 airlines with 94 nonstop domestic and 35 international destinations. In 2024, SeaTac International Airport set a record with over 52.6 million passengers, exceeding pre-COVID levels of approximately 51.8 million passengers in 2019. In 2024, the SeaTac International Airport added eight new international services and is currently undergoing an expansion as part of its Sustainable Airport Master Plan, which includes the construction of a new terminal with 19 additional gates.
The WallyPark SeaTac Property is primarily comprised of daily parking, which accounts for 94.0% of underwritten base rent along with monthly parking which accounts for 2.6% of underwritten base rent. As of the trailing 12-month period ending February 28, 2025, the WallyPark SeaTac Property parking component was 79.0% occupied. In addition to the parking component, the WallyPark SeaTac Property features 13,699 square feet of retail space which, as of April 1, 2025, was 82.6% leased by five tenants. The retail component of the WallyPark SeaTac Property accounts for approximately 3.4% of underwritten rent.
The parking and retail portions of the WallyPark SeaTac Property are currently managed by L&R Investment Company and LR Property Management, LLC, under interim management agreements. At origination the borrower sponsor completed a partnership buyout of L&R Investment Company. It is expected that the borrower sponsor will retain a national parking operator to manage the WallyPark SeaTac Property. There can be no assurance that this management change will be completed.
Environmental. According to the Phase I environmental site assessment dated February 5, 2025, there is a controlled recognized environmental condition at the WallyPark SeaTac Property related to releases from leaking underground storage tanks operated by a gas station formerly located at the WallyPark SeaTac Property. See “Description of the Mortgage Pool—Environmental Considerations” In the Preliminary Prospectus.
The following table presents certain information relating to the historical and current occupancy of the WallyPark SeaTac Property:
| Historical Occupancy(1) | |||||
| 2021 | 2022 | 2023 | 2024 | Current(2) | |
| WallyPark SeaTac | 64.0% | 78.0% | 77.0% | 77.0% | 79.0% |
| (1) | Historical occupancies represent the average annual occupancy of each respective year. |
| (2) | Current occupancy is as of February 28, 2025. |
| Historical Passenger Traffic(1) | ||||||
| 2019 | 2020 | 2021 | 2022 | 2023 | 2024 | |
| SeaTac International Airport | 51,829,239 | 20,045,348 | 36,154,015 | 45,964,167 | 50,885,450 | 52,640,716 |
| (1) | Source: Port of Seattle |
THE INFORMATION IN THIS STRUCTURAL AND COLLATERAL TERM SHEET IS NOT COMPLETE AND MAY BE AMENDED PRIOR TO THE TIME OF SALE. THIS TERM SHEET IS NOT AN OFFER TO SELL THESE SECURITIES AND IT IS NOT A SOLICITATION OF AN OFFER TO BUY THESE SECURITIES IN ANY JURISDICTION WHERE THE OFFER OR SALE IS NOT PERMITTED. | ||
| 43 | ||
| Structural and Collateral Term Sheet | BBCMS 2025-5C34 | |
| No. 2 – WallyPark SeaTac | ||
The following table presents certain information relating to the historical operating information and Underwritten Net Cash Flow of the WallyPark SeaTac Property:
| Operating History and Underwritten Net Cash Flow | |||||||
| 2022 | 2023 | 2024 | TTM 2/28/2025 | Underwritten | Per Space | %(1) | |
| Base Rent | $8,651,796 | $9,784,703 | $10,377,640 | $10,570,251 | $10,570,251 | $6,806 | 96.3% |
| Potential Income from Vacant Units | 0 | 0 | 0 | 0 | 0 | 0 | 0.0% |
| Gross Potential Income | $8,651,796 | $9,784,703 | $10,377,640 | $10,570,251 | $10,570,251 | $6,806 | 96.3% |
| Other Income(2) | 380,027 | 358,579 | 381,357 | 383,011 | 407,070 | 262 | 3.7% |
| Net Rental Income | $9,031,823 | $10,143,282 | $10,758,997 | $10,953,262 | $10,977,320 | $7,068 | 100.0% |
| (Vacancy / Credit Loss) | 0 | 0 | 0 | 0 | 0 | 0 | 0.0% |
| Total Effective Gross Income | $9,031,823 | $10,143,282 | $10,758,997 | $10,953,262 | $10,977,320 | $7,068 | 100.0% |
| Real Estate Taxes | 506,314 | 481,047 | 532,099 | 542,343 | 533,330 | 343 | 4.9% |
| Insurance | 149,815 | 147,383 | 155,759 | 154,966 | 185,423 | 119 | 1.7% |
| Management Fee | 270,955 | 304,298 | 322,770 | 328,598 | 329,320 | 212 | 3.0% |
| Payroll & Benefits | 853,929 | 987,680 | 1,115,555 | 1,141,520 | 1,116,040 | 719 | 10.2% |
| Advertising & Marketing(3) | 950,978 | 1,104,800 | 1,382,989 | 1,333,334 | 1,004,500 | 647 | 9.2% |
| General & Administrative(3) | 649,059 | 497,407 | 599,215 | 629,278 | 543,000 | 350 | 4.9% |
| Other Expenses(4) | 299,896 | 280,393 | 297,244 | 287,522 | 283,025 | 182 | 2.6% |
| Total Expenses | $3,680,946 | $3,803,007 | $4,405,631 | $4,417,561 | $3,994,638 | 2,572 | 36.4% |
| Net Operating Income | $5,350,877 | $6,340,275 | $6,353,366 | $6,535,702 | $6,982,682 | $4,496 | 63.6% |
| Replacement Reserves | 0 | 0 | 0 | 0 | 79,705 | 51 | 0.7% |
| Normalized TI/LC | 0 | 0 | 0 | 0 | 13,699 | 9 | 0.1% |
| Net Cash Flow | $5,350,877 | $6,340,275 | $6,353,366 | $6,535,702 | $6,889,279 | $4,436 | 62.8% |
| (1) | The % column represents percentage of Net Rental Income for all revenue lines and represents percentage of Effective Gross Income for the remainder of the fields. |
| (2) | Other Income is inclusive of $398,203 of rental and recovery revenue from the retail portion of the WallyPark SeaTac Property as well as $8,867 of other miscellaneous sources of revenue. |
| (3) | The decrease in Advertising & Marketing and General & Administrative expenses from TTM 2/28/2025 to Underwritten is primarily attributable to the expected change in management to a national parking operator. There can be no assurance that this management change will be completed. |
| (4) | Other Expenses consist of repairs and maintenance and utilities expenses. |
THE INFORMATION IN THIS STRUCTURAL AND COLLATERAL TERM SHEET IS NOT COMPLETE AND MAY BE AMENDED PRIOR TO THE TIME OF SALE. THIS TERM SHEET IS NOT AN OFFER TO SELL THESE SECURITIES AND IT IS NOT A SOLICITATION OF AN OFFER TO BUY THESE SECURITIES IN ANY JURISDICTION WHERE THE OFFER OR SALE IS NOT PERMITTED. | ||
| 44 | ||
| Structural and Collateral Term Sheet | BBCMS 2025-5C34 | |
| No. 2 – WallyPark SeaTac | ||
The Market. The WallyPark SeaTac Property is located at 18601 International Boulevard in SeaTac, Washington, approximately 13.8 miles south of Seattle. SeaTac is home to SeaTac International Airport which serves as a major transportation hub for the Pacific Northwest and the primary airport for the Seattle metropolitan area. SeaTac is well-connected to major transportation routes, including Interstate 5 and State Route 518. The SeaTac International Airport serves 37 airlines with 94 nonstop domestic and 35 international destinations. In 2024, SeaTac International Airport set a record with over 52.6 million passengers, exceeding pre-COVID levels of approximately 51.8 million passengers in 2019. In 2024, SeaTac International Airport added eight new international services and is currently undergoing an expansion as part of its Sustainable Airport Master Plan, which includes the construction of a new terminal with 19 additional gates.
The appraiser identified a primary competitive set of seven properties, shown below, of which only one is a garage facility; the rest are surface parking. According to the appraisal, within the competitive set, the Doug Fox parking facility, which has 1,800 parking stalls, is expected to close due to terminal expansion and road realignment. Additionally, the Port of Seattle has recently repurposed approximately 2,500 off-airport parking spaces for port employee parking through a long-term lease of the competitive Master Park parking facilities and other nearby land.
According to the appraisal, the 2023 population within a one-, three- and five-mile radius of the WallyPark SeaTac Property was 11,413, 84,323 and 230,029, respectively. The 2023 average household income within the same radii was $84,537, $103,680 and $106,558, respectively.
The following table presents certain information relating to comparable parking properties to the WallyPark SeaTac Property:
| Rent Comparables(1) | |||
| Property Name / Address | Distance from Subject | Type of Parking | Standard Daily Rate |
|
WallyPark SeaTac 18601 International Boulevard SeaTac, WA |
- | Parking Facility - Garage | $25.95 |
| MasterPark 16826 International Boulevard SeaTac, WA |
1.4 mi | Parking Facility - Garage | $24.49 - $26.49 |
| Doug Fox Parking 2626 S 170th Street SeaTac, WA |
1.3 mi | Parking Facility - Lot | $25.45 |
| MVP Airport Parking 18831 International Boulevard SeaTac, WA |
0.3 mi | Parking Facility - Lot | $31.22 |
| Jiffy Airport Parking 18836 International Boulevard SeaTac, WA |
0.3 mi | Parking Facility - Lot | $23.22 |
| Park N Fly 17320 International Boulevard SeaTac, WA |
1.1 mi | Parking Facility - Lot | $11.72 |
| Park N Jet 18220 8th Avenue South SeaTac, WA |
1.7 mi | Parking Facility - Lot | $19.85 - $24.05 |
| TopSpot 17808 International Boulevard SeaTac, WA |
1.0 mi | Parking Facility - Lot | $21.95 |
| (1) | Source: Appraisal. |
THE INFORMATION IN THIS STRUCTURAL AND COLLATERAL TERM SHEET IS NOT COMPLETE AND MAY BE AMENDED PRIOR TO THE TIME OF SALE. THIS TERM SHEET IS NOT AN OFFER TO SELL THESE SECURITIES AND IT IS NOT A SOLICITATION OF AN OFFER TO BUY THESE SECURITIES IN ANY JURISDICTION WHERE THE OFFER OR SALE IS NOT PERMITTED. | ||
| 45 | ||
| Structural and Collateral Term Sheet | BBCMS 2025-5C34 | |
| No. 2 – WallyPark SeaTac | ||
The Borrower. The borrower is SeaTac WallyPark LLC, a Delaware limited liability company and single purpose entity having at least one independent director in its organizational structure. Legal counsel to the borrower delivered a non-consolidation opinion in connection with the origination of the WallyPark SeaTac Mortgage Loan.
The Borrower Sponsor. The borrower sponsor and the non-recourse carveout guarantor is Jordan S. Simons of JL Management. JL Management is a real estate investment and management firm with a portfolio that includes seven Wally Park airport garages spread across Denver, San Diego, Jacksonville, Orlando, and Atlanta. The firm’s portfolio also includes Millennium Garage in downtown Chicago. The lender has pre-approved a transfer of control in the borrower to a specified investment firm, which if effected would result in a change in control of the borrower and the replacement of the non-recourse carveout guarantor. There can be no assurance as to whether or not such a transfer will occur.
Property Management. The parking and retail portions of the WallyPark SeaTac Property are interim managed by L&R Investment Company and LR Property Management, LLC, respectively, each a third-party management company. At origination, proceeds from the WallyPark SeaTac Mortgage Loan were used for a partnership buyout of L&R Investment Company. It is expected that the borrower sponsor will retain a national parking operator to manage the WallyPark SeaTac Property. There can be no assurance that this management change will be completed.
Escrows and Reserves. At origination of the WallyPark SeaTac Mortgage Loan, the borrower deposited approximately $46,678 into a reserve account for real estate taxes.
Tax Escrows – On a monthly basis, the borrower is required to deposit into a real estate tax reserve 1/12th of the property taxes that the lender estimates will be payable over the next-ensuing 12-month period (initially estimated to be approximately $46,678).
Insurance Escrows – If the liability or casualty policy maintained by the borrower does not constitute an approved blanket or umbrella policy or the lender requires the borrower to obtain a separate policy, the borrower is required to deposit into an insurance reserve, on a monthly basis, 1/12th of the amount which will be sufficient to pay the insurance premiums due for the renewal of coverage afforded by such policies.
Replacement Reserve – On a monthly basis, the borrower is required to deposit approximately $6,642 into a replacement reserve; provided that the borrower's obligation to make such monthly deposits will be suspended as to any monthly payment date on which the amount then on deposit in the replacement reserve is $239,115 or more.
Leasing Reserve – On a monthly basis, the borrower is required to deposit approximately $1,142 into a reserve for future tenant improvements and leasing commissions.
Lockbox / Cash Management. The WallyPark SeaTac Mortgage Loan is structured with a hard lockbox and springing cash management. The borrower was required to establish a lender-controlled lockbox account and is thereafter required to cause all revenue received by the borrower, property manager or Pledged Entity (as defined below), as applicable, to be deposited into such lender-controlled lockbox account within three business days of receipt thereof. The borrower was required to deliver a notice to all tenants at the WallyPark SeaTac Property and all credit card companies or credit card clearing banks with which the borrower, property manager or Pledged Entity has entered into merchant’s or other credit card agreements directing them to remit rent and all other sums due under the applicable lease and all payments under the applicable credit-card processing agreement, respectively, directly to the lender-controlled lockbox account. In addition, upon the first occurrence of a Trigger Period (as defined below), the lender is required to establish a lender-controlled cash management account. All funds deposited into the lockbox are required to be transferred on each business day to, or at the direction of, the borrower, unless a Trigger Period exists, in which case all funds in the lockbox account are required to be swept on each business day to the lender-controlled cash management account to be applied and disbursed in accordance with the WallyPark SeaTac Mortgage Loan documents, and all excess cash flow funds remaining in the cash management account after the application of such funds in accordance with the WallyPark SeaTac Mortgage Loan documents are required to be held by the lender in an excess cash flow reserve account as additional collateral for the WallyPark SeaTac Mortgage Loan. Upon the cure of the applicable Trigger Period, so long as no other Trigger Period exists, the lender is required to return any amounts remaining on deposit in the excess cash flow reserve account to the borrower. Upon an event of default under the WallyPark SeaTac Mortgage Loan documents, the lender may apply funds in the accounts to the debt in such priority as it may determine.
THE INFORMATION IN THIS STRUCTURAL AND COLLATERAL TERM SHEET IS NOT COMPLETE AND MAY BE AMENDED PRIOR TO THE TIME OF SALE. THIS TERM SHEET IS NOT AN OFFER TO SELL THESE SECURITIES AND IT IS NOT A SOLICITATION OF AN OFFER TO BUY THESE SECURITIES IN ANY JURISDICTION WHERE THE OFFER OR SALE IS NOT PERMITTED. | ||
| 46 | ||
| Structural and Collateral Term Sheet | BBCMS 2025-5C34 | |
| No. 2 – WallyPark SeaTac | ||
“Trigger Period” means a period (A) commencing upon the earliest of (i) the occurrence and continuance of an event of default under the WallyPark SeaTac Mortgage Loan documents and (ii) the debt service coverage ratio being less than 1.20x for one calendar quarter and (B) expiring upon (x) with regard to clause (i) above, the cure (if applicable) of such event of default under the WallyPark SeaTac Mortgage Loan documents and (y) with regard to clause (ii) above, the date that the debt service coverage ratio is equal to or greater than 1.20x for one calendar quarter.
Notwithstanding the foregoing, a Trigger Period will not be deemed to exist under clause (A) (ii) above if the borrower provides to the lender collateral in the form of cash or a letter of credit which, in either case, will serve as additional collateral for the WallyPark SeaTac Mortgage Loan, in an amount which, if deducted from the outstanding principal balance of the WallyPark SeaTac Mortgage Loan, would cause the debt service coverage ratio to be greater than or equal to 1.20x. The lender is required to return such collateral to the borrower, provided no event of default is continuing under the WallyPark SeaTac Mortgage Loan, at such time as the debt service coverage ratio is equal to or greater than 1.20x without taking into account such collateral.
Subordinate and Mezzanine Debt. None.
Permitted Future Subordinate or Mezzanine Debt. Not permitted.
Partial Release. Not permitted.
Ground Lease. None.
Pledge of Equity Interests. The borrower pledged, as additional collateral for the WallyPark SeaTac Mortgage Loan, its right, title and interest in the Pledged Entity’s equity interests.
“Pledged Entity” means SeaTac Airport Parking, LLC, a Washington limited liability company, which is required to be a special purpose entity. The Pledged Entity is owned by the borrower and owns (i) shuttle vans used in connection with the operation of the WallyPark SeaTac Property and (ii) a general business license issued by the State of Washington permitting the Pledged Entity to operate the WallyPark SeaTac Property. In addition, all credit card processing agreements relating to the WallyPark SeaTac Property have been entered into by the Pledged Entity rather than the borrower. Accordingly, all garage revenues paid by credit card (which is expected to be substantially all garage revenues) will be received by the Pledged Entity rather than by the borrower. The borrower is required to direct all credit card banks and clearing companies that have entered into credit card processing agreements with the Pledged Entity to deposit credit card receipts into the lockbox account and to cause all revenue received by the Pledged Entity to be deposited into the lockbox account.
THE INFORMATION IN THIS STRUCTURAL AND COLLATERAL TERM SHEET IS NOT COMPLETE AND MAY BE AMENDED PRIOR TO THE TIME OF SALE. THIS TERM SHEET IS NOT AN OFFER TO SELL THESE SECURITIES AND IT IS NOT A SOLICITATION OF AN OFFER TO BUY THESE SECURITIES IN ANY JURISDICTION WHERE THE OFFER OR SALE IS NOT PERMITTED. | ||
| 47 | ||
| Structural and Collateral Term Sheet | BBCMS 2025-5C34 | |
| No. 3 – 6500 South | ||
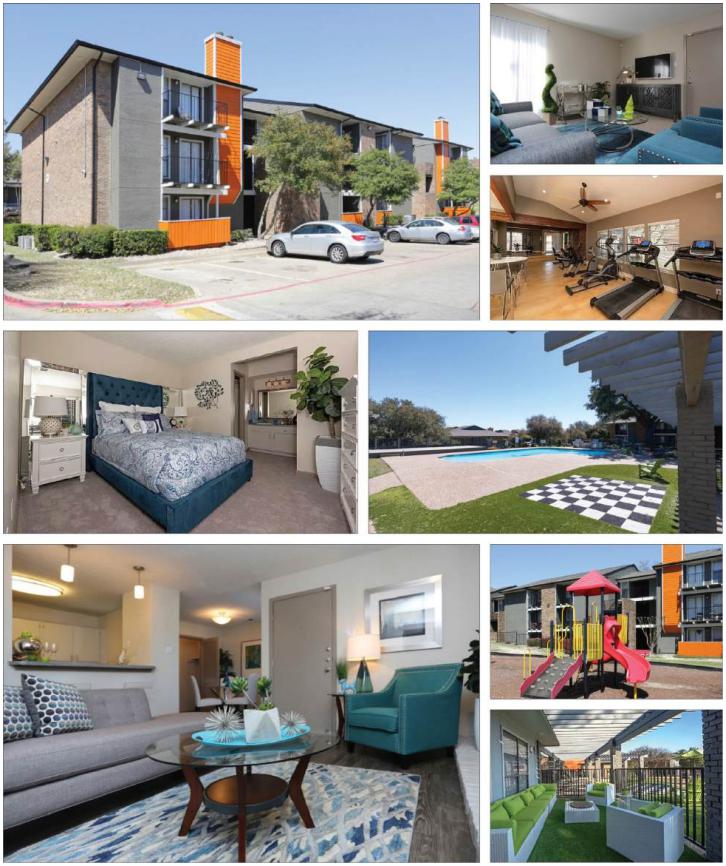
THE INFORMATION IN THIS STRUCTURAL AND COLLATERAL TERM SHEET IS NOT COMPLETE AND MAY BE AMENDED PRIOR TO THE TIME OF SALE. THIS TERM SHEET IS NOT AN OFFER TO SELL THESE SECURITIES AND IT IS NOT A SOLICITATION OF AN OFFER TO BUY THESE SECURITIES IN ANY JURISDICTION WHERE THE OFFER OR SALE IS NOT PERMITTED. | ||
| 48 | ||
| Structural and Collateral Term Sheet | BBCMS 2025-5C34 | |
| No. 3 – 6500 South | ||
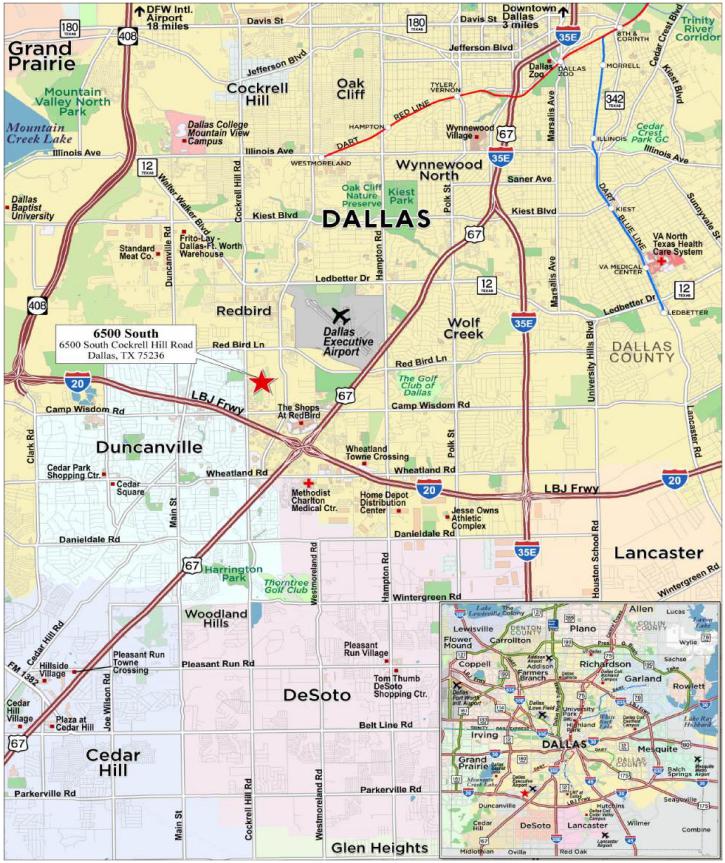
THE INFORMATION IN THIS STRUCTURAL AND COLLATERAL TERM SHEET IS NOT COMPLETE AND MAY BE AMENDED PRIOR TO THE TIME OF SALE. THIS TERM SHEET IS NOT AN OFFER TO SELL THESE SECURITIES AND IT IS NOT A SOLICITATION OF AN OFFER TO BUY THESE SECURITIES IN ANY JURISDICTION WHERE THE OFFER OR SALE IS NOT PERMITTED. | ||
| 49 | ||
| Structural and Collateral Term Sheet | BBCMS 2025-5C34 | |
| No. 3 – 6500 South | ||
| Mortgage Loan Information | Property Information | |||
| Mortgage Loan Seller: | Barclays | Single Asset / Portfolio: | Single Asset | |
| Original Principal Balance: | $50,000,000 | Title(2): | Fee / Leasehold | |
| Cut-off Date Principal Balance: | $50,000,000 | Property Type – Subtype: | Multifamily – Garden | |
| % of IPB: | 6.4% | Net Rentable Area (Units): | 536 | |
| Loan Purpose: | Refinance | Location: | Dallas, TX | |
| Borrower: | 6500 Mars Leasehold, LLC | Year Built / Renovated: | 1985 / 2024 | |
| Borrower Sponsors(1): | Srihari Reddy Gandra and Jaspreeth Kaur | Occupancy: | 89.0% | |
| Interest Rate: | 6.52000% | Occupancy Date: | 2/5/2025 | |
| Note Date: | 4/1/2025 | 4th Most Recent NOI (As of)(3): | NAV | |
| Maturity Date: | 4/6/2030 | 3rd Most Recent NOI (As of) (4): | $3,208,176 (12/31/2023) | |
| Interest-only Period: | 60 months | 2nd Most Recent NOI (As of) (4): | $4,320,795 (12/31/2024) | |
| Original Term: | 60 months | Most Recent NOI (As of): | $4,399,275 (TTM 1/31/2025) | |
| Original Amortization Term: | None | UW Economic Occupancy: | 89.5% | |
| Amortization Type: | Interest Only | UW Revenues: | $7,622,630 | |
| Call Protection: | L(24),YM1(29),O(7) | UW Expenses: | $3,062,675 | |
| Lockbox / Cash Management: | Springing | UW NOI: | $4,559,955 | |
| Additional Debt: | No | UW NCF: | $4,425,955 | |
| Additional Debt Balance: | N/A | Appraised Value / Per Unit: | $76,400,000 / $142,537 | |
| Additional Debt Type: | N/A | Appraisal Date: | 2/24/2025 | |
| Escrows and Reserves(5) | Financial Information | ||||||
| Initial | Monthly | Initial Cap | |||||
| Taxes: | $296,968 | $98,989 | N/A | Cut-off Date Loan / Unit: | $93,284 | ||
| Insurance: | $44,226 | $8,845 | N/A | Maturity Date Loan / Unit: | $93,284 | ||
| Replacement Reserves: | $1,238,658 | $11,167 | N/A | Cut-off Date LTV: | 65.4% | ||
| Immediate Repairs: | $28,375 | $0 | N/A | Maturity Date LTV: | 65.4% | ||
| PHFC Payments Reserve: | $0 | Springing | N/A | UW NCF DSCR: | 1.34x | ||
| UW NOI Debt Yield: | 9.1% | ||||||
| Sources and Uses | ||||||||
| Sources | Proceeds | % of Total | Uses | Proceeds | % of Total | |||
| Mortgage Loan | $50,000,000 | 85.6 | % | Loan Payoff | $38,742,036 | 66.4 | % | |
| Preferred Equity | 6,500,000 | 11.1 | Preferred Equity Payoff | 14,714,863 | 25.2 | |||
| Borrower Sponsor Equity | 1,886,033 | 3.2 | Closing Costs(6) | 3,320,905 | 5.7 | |||
| Upfront Reserves | 1,608,228 | 2.8 | ||||||
| Total Sources | $58,386,033 | 100.0 | % | Total Uses | $58,386,033 | 100.0 | % | |
| (1) | The 6500 South Mortgage Loan (as defined below) and the Avalon 8801 mortgage loan have related borrowers. |
| (2) | The 6500 South Property is encumbered by a 99-year ground lease as part of the PHFC Program (as defined below). The 6500 South Mortgage Loan (as defined below) is secured by the borrower’s leasehold interest and the PHFC’s (as defined below) fee interest in the 6500 South Property. See “The Property” below for further information. |
| (3) | Historical cash flows for 2022 are unavailable as the 6500 South Property was acquired in 2022. |
| (4) | The increase in 2nd Most Recent NOI from 3rd Most Recent NOI is due primarily to the completion of substantial renovations in 2024, which improved occupancy and achieved higher rents. |
| (5) | For a full description of Escrows and Reserves, see “Escrows and Reserves” below. |
| (6) | Closing Costs include a $1,875,000 rate buydown. |
The Loan. The 6500 South mortgage loan (the “6500 South Mortgage Loan”) is secured by the borrower’s leasehold interest and Pecos Housing Finance Corporation’s (“PHFC”)’s fee interest in a multifamily complex located in Dallas, Texas (the “6500 South Property”). The 6500 South Mortgage Loan accrues interest at a fixed rate of 6.52000% per annum on an Actual/360 basis with an initial term of five years and is interest-only for the full term.
THE INFORMATION IN THIS STRUCTURAL AND COLLATERAL TERM SHEET IS NOT COMPLETE AND MAY BE AMENDED PRIOR TO THE TIME OF SALE. THIS TERM SHEET IS NOT AN OFFER TO SELL THESE SECURITIES AND IT IS NOT A SOLICITATION OF AN OFFER TO BUY THESE SECURITIES IN ANY JURISDICTION WHERE THE OFFER OR SALE IS NOT PERMITTED. | ||
| 50 | ||
| Structural and Collateral Term Sheet | BBCMS 2025-5C34 | |
| No. 3 – 6500 South | ||
The Property. The 6500 South Property is a 536-unit, garden-style multifamily complex located in Dallas, Texas. The 6500 South Property, originally constructed in 1985, consists of 36 two- and three-story apartment buildings across 24.38 acres. Amenities at the 6500 South Property include a clubhouse and recreation building, three swimming pools, laundry facilities, a playground, sports courts and a fitness center. Since its acquisition in 2022, over $2.8 million dollars of capital expenditures have been spent on renovations to the 6500 South Property. Highlights of these renovations include improvements on the roofing, parking lot, security system, fire extinguishers, HVAC units, and staircases. Additionally, 346 out of the total 536 units were upgraded with new appliances, resurfaced counters, plumbing, light fixtures, and vinyl flooring.
Current occupancy at the 6500 South Property is 89.0% as of February 5, 2025. This percentage includes 24 downs units which, at the time of the appraisal report, were unavailable due to damage from a recent fire. Per property management, insurance proceeds will cover these costs and are anticipated to be received within the month. Excluding these 24 units from the occupancy calculation would result in an occupancy rate of 93.2%, as of February 5, 2025. The unit mix of the 6500 South Property includes 376 one-bedroom units and 160 two-bedroom units, with an average unit size of 715 square feet. According to the appraisal, the overall average monthly rental rate of $1,163 is slightly below the reported monthly market rental rate of $1,197.
The 6500 South Property is encumbered by a 99-year ground lease as part of the Pecos Housing Finance Corporation program (the “PHFC Program”). Pursuant to the PHFC Program’s policies, a property will qualify for a 100% real estate tax exemption if it meets certain criteria, largely relating to affordable housing. Provisions specific to the affordable housing concentration for the 6500 South Property require that, pursuant to Chapter 394 of the Texas Local Government Code, 90% of units (483 units) must be restricted at 140% Area Median Income (“AMI”), including 50% of units (268 units) at 80% AMI or less. The 6500 South Property currently complies with the AMI requirements and is pending approval from the related central appraisal district for the tax exemption. The Lender has underwritten full property taxes as if the 6500 South Property was not enrolled in the PHFC Program. It cannot be assured that the 6500 South Property will be approved for the exemption.
The following table presents certain information relating to the historical and current occupancy of the 6500 South Property:
| Historical and Current Occupancy(1) | |||
| 2022(2) | 2023 | 2024 | Current(3) |
| NAV | 90.1% | 92.5% | 89.0% |
| (1) | Historical Occupancy is as of the end of each historical year. |
| (2) | Historical cash flows for 2022 are unavailable as the 6500 South Property was acquired in 2022. |
| (3) | Current occupancy is based on the underwritten rent roll as of February 5, 2025, and includes one building totaling 24 units due to a recent fire. When excluding these 24 units, Current Occupancy is 93.2%. |
The following table presents detailed information with respect to the residential units at the 6500 South Property:
| Unit Summary(1) | |||||||||
| Unit Type | No. of Units | % of Total | Occupied Units | Occupancy % | Average Unit Size (SF) | Average Monthly Rental Rate(2) | Average Monthly Rental Rate per SF(2) | Average Monthly Market Rental Rate(2)(3) | Average Monthly Market Rental Rate per SF(2)(3) |
| 1BR / 1BA | 376 | 70.1% | 343 | 91.2% | 640 | $1,060 | $1.66 | $1,091 | $1.71 |
| 2BR / 1BA | 40 | 7.5% | 31 | 77.5% | 840 | $1,323 | $1.57 | $1,365 | $1.63 |
| 2 BR / 2BA | 120 | 22.4% | 103 | 85.8% | 911 | $1,458 | $1.60 | $1,501 | $1.65 |
| Total/Wtd. Avg. | 536 | 100.0% | 477 | 89.0% | 715 | $1,163 | $1.63 | $1,197 | $1.69 |
| (1) | Based on the underwritten rent roll as of February 5, 2025, unless otherwise indicated. |
| (2) | Average Monthly Rental Rate, Average Monthly Rental Rate per SF, Average Monthly Market Rental Rate and Average Monthly Market Rental Rate per SF are calculated based on the in-place contract rent of the Occupied Units. |
| (3) | Source: Appraisal. |
THE INFORMATION IN THIS STRUCTURAL AND COLLATERAL TERM SHEET IS NOT COMPLETE AND MAY BE AMENDED PRIOR TO THE TIME OF SALE. THIS TERM SHEET IS NOT AN OFFER TO SELL THESE SECURITIES AND IT IS NOT A SOLICITATION OF AN OFFER TO BUY THESE SECURITIES IN ANY JURISDICTION WHERE THE OFFER OR SALE IS NOT PERMITTED. | ||
| 51 | ||
| Structural and Collateral Term Sheet | BBCMS 2025-5C34 | |
| No. 3 – 6500 South | ||
The following table presents certain information relating to the operating history and underwritten cash flows of the 6500 South Property:
| Underwritten Net Cash Flow and Operating History(1) | ||||||
| 2023(2) | 2024(2) | January 2025 TTM | Underwritten | Per Unit | %(3) | |
| Gross Potential Rent | $6,550,486 | $7,266,111 | $7,323,432 | $7,547,928 | $14,081.96 | 88.6% |
| Reimbursements | 376,490 | 405,440 | 402,567 | 402,567 | 751.06 | 4.7% |
| Other Income | 397,109 | 544,177 | 542,738 | 564,815 | 1,053.76 | 6.6% |
| Net Rental Income | $7,324,084 | $8,215,728 | $8,268,737 | $8,515,310 | $15,886.77 | 100.0% |
| (Vacancy/Credit Loss) | 1,196,264 | 822,109 | 796,103 | 892,680 | 1,665.45 | 10.5% |
| Effective Gross Income | $6,127,821 | $7,393,619 | $7,472,634 | $7,622,630 | $14,221.32 | 89.5% |
| Taxes(4) | 1,112,900 | 1,168,752 | 1,168,527 | 1,153,275 | 2,151.63 | 15.1% |
| Insurance | 275,280 | 309,204 | 309,204 | 309,272 | 577.00 | 4.1% |
| Other Expenses | 1,531,465 | 1,594,868 | 1,595,628 | 1,600,128 | 2,985.31 | 21.0% |
| Total Expenses | $2,919,645 | $3,072,824 | $3,073,359 | $3,062,675 | $5,713.95 | 40.2% |
| Net Operating Income | $3,208,176 | $4,320,795 | $4,399,275 | $4,559,955 | $8,507.38 | 59.8% |
| CapEx | 0 | 0 | 0 | 134,000 | 250.00 | 1.8% |
| Net Cash Flow | $3,208,176 | $4,320,795 | $4,399,275 | $4,425,955 | $8,257.38 | 58.1% |
| (1) | Based on the underwritten rent roll dated as of February 5, 2025. |
| (2) | The increase in the 2024 Net Operating Income from the 2023 Net Operating Income is due primarily to the completion of substantial renovation in 2024, which improved occupancy and achieved higher rents. |
| (3) | % column represents percent of Net Rental Income for revenue fields and of Effective Gross Income for the remaining fields. |
| (4) | While the 6500 South Property is expected to benefit from the PHFC Program and have 100.0% abated taxes, full property taxes were underwritten. Excluding real estate taxes would increase the UW NCF DSCR from 1.34x to 1.69x and increase the UW NOI Debt Yield from 9.1% to 11.4%. |
Environmental. According to the Phase I environmental assessment dated December 11, 2024, there was no evidence of any recognized environmental conditions at the 6500 South Property.
The Market. The 6500 South Property is located in Dallas, Texas within the Dallas/Fort Worth multifamily market and the Redbird submarket. Primary access to the 6500 South Property is provided by Interstate 20, which runs through the Dallas-Fort Worth metroplex to the Louisiana state line, as well as U.S. 67, which runs from the U.S.-Mexico border to the Arkansas state line. Interstate 20 and U.S. 67 can be accessed approximately 1 mile south and 2 miles east of the subject property, respectively. The 6500 South Property is approximately a 30-minute drive to both the Dallas Central Business District and the Fort Worth Central Business District, and a 25-minute drive to the Dallas/Fort Worth International Airport. American Airlines, which is headquartered in Fort Worth, is a major employer in the subject area. American Airlines employs over 10,000 people within the Dallas area, primarily due to the Dallas/Fort Worth International Airport being American Airlines’ largest hub airport. The wider Dallas-Plano-Irving, TX metro area experiences substantial employment demand, with the unemployment rate as of November 2024 having stayed steadily at 3.8%, which is slightly below national averages.
According to the appraisal, as of the fourth quarter of 2024, the Redbird multifamily submarket had an inventory of 3,642 units, a vacancy rate of 7.8% and asking rent per unit of $1,273. Since the fourth quarter of 2023, the vacancy rate decreased from 8.8% and asking rent per unit increased slightly from $1,238. The appraisal notes that the average vacancy rate for the Redbird submarket is lower than that of the overall Dallas/Fort Worth market, which as of the fourth quarter of 2024 was 11.2%. According to the appraisal, historic performance and growth trends in the surrounding subject area indicate that property values are anticipated to increase in the near future.
The 2024 population within a one-, three- and five-mile radius from the 6500 South Property is 13,493, 91,386 and 244,593, respectively. The 2024 median household income within the same radii is $39,931, $50,216 and $54,176, respectively. Since 2020, population within a 1-mile radius of the 6500 South Property has increased, while populations within a 3- and 5- mile radius of the subject property have decreased. According to the appraisal, these trends are expected to continue over the course of the next five years.
THE INFORMATION IN THIS STRUCTURAL AND COLLATERAL TERM SHEET IS NOT COMPLETE AND MAY BE AMENDED PRIOR TO THE TIME OF SALE. THIS TERM SHEET IS NOT AN OFFER TO SELL THESE SECURITIES AND IT IS NOT A SOLICITATION OF AN OFFER TO BUY THESE SECURITIES IN ANY JURISDICTION WHERE THE OFFER OR SALE IS NOT PERMITTED. | ||
| 52 | ||
| Structural and Collateral Term Sheet | BBCMS 2025-5C34 | |
| No. 3 – 6500 South | ||
The following table presents certain information relating to comparable multifamily rentals to the 6500 South Property:
|
Comparable Multifamily Rental Summary(1) | ||||||
| Property Name / Property Address | Year Built / Renovated | Occupancy | # of Units | Average Unit Size (SF) | Average Monthly Rent ($/month) | Average Monthly Rent ($/SF) |
|
6500 South 6500 South Cockrell Hill Road Dallas, TX |
1985 / 2024 | 89.0% | 536 | 715 | $1,163(2) | $1.63(2) |
|
4060 Preferred Place 4060 Preferred Place Dallas, TX |
1985 / 2018 | 95.0% | 232 | 714 | $1,075 | $1.50 |
|
Las Ventanas 605 North Alexander Avenue Duncanville, TX |
1970 / 1996 | 91.0% | 158 | 851 | $1,449 | $1.70 |
|
Paxton 6910 South Cockrell Hill Road Dallas, TX |
1983 / 2023 | 92.0% | 270 | 752 | $1,161 | $1.54 |
|
Westmoor 7575 South Westmoreland Road Dallas, TX |
1984 / 2018 | 92.0% | 350 | 811 | $1,191 | $1.47 |
|
Cedar Glen 6363 West Camp Wisdom Road Dallas, TX |
1986 / 2018 | 93.0% | 218 | 863 | $1,290 | $1.49 |
|
The Monet Apartments 3900 Investor Drive Dallas, TX |
1983 / 2017 | 95.0% | 256 | 787 | $1,208 | $1.53 |
| (1) | Source: Appraisal, except for the 6500 South Property, which information is based on the underwritten rent roll dated February 5, 2025. |
| (2) | Represents the average in-place rents of occupied units. |
The Borrower. The borrower is 6500 Mars Leasehold, LLC, a Delaware limited liability company and newly formed special purpose entity with one independent director. Legal counsel to the borrower provided a non-consolidation opinion in connection with the origination of the 6500 South Mortgage Loan.
The Borrower Sponsors. The borrower sponsors and non-recourse carveout guarantors are Srihari Reddy Gandra and Jaspreeth Kaur. Srihari Reddy Gandra and Jaspreeth Kaur have over 20 combined years of real estate experience, and are co-founders of Sahara Equity LLC, a real estate investment firm that specializes in acquisitions and management of multifamily properties across the Dallas/Fort Worth metroplex. Since its creation, Sahara Equity LLC has accumulated a portfolio consisting of 17 multifamily properties and over $250 million of assets.
Property Management. The 6500 South Property is managed by Meticulous Management, LLC d.b.a Mars Residential, an affiliate of the borrower sponsors.
Escrows and Reserves. At origination, the borrower deposited into escrow (i) approximately $296,968 for real estate taxes, (ii) approximately $44,226 for insurance premiums, (iii) $1,238,658 for capital expenditures and (iv) $28,375 for immediate repairs.
Tax Escrows – The borrower is required to escrow 1/12th of the annual estimated tax payments on a monthly basis, which currently equates to $98,989.48.
The borrower will not be required to make monthly tax reserve payments from and after the date (y) the tax exemption is formally granted by the applicable central appraisal district and (z) the borrower provides the lender on an annual basis a copy of the tax bill or other written evidence to verify that the tax exemption is in place and no property taxes are due.
Insurance Escrow – In the event that the borrower does not maintain an acceptable blanket policy, the borrower is required to escrow 1/12th of the annual estimated insurance premiums on a monthly basis. The 6500 South Property is currently under a blanket policy for property coverage but not liability coverage, thus the monthly insurance escrow is in place (which currently equates to $8,845).
Replacement Reserve – On a monthly basis, the borrower is required to escrow approximately $11,167 for replacement reserves ($250 per unit annually).
THE INFORMATION IN THIS STRUCTURAL AND COLLATERAL TERM SHEET IS NOT COMPLETE AND MAY BE AMENDED PRIOR TO THE TIME OF SALE. THIS TERM SHEET IS NOT AN OFFER TO SELL THESE SECURITIES AND IT IS NOT A SOLICITATION OF AN OFFER TO BUY THESE SECURITIES IN ANY JURISDICTION WHERE THE OFFER OR SALE IS NOT PERMITTED. | ||
| 53 | ||
| Structural and Collateral Term Sheet | BBCMS 2025-5C34 | |
| No. 3 – 6500 South | ||
PHFC Payments Reserve – The lender is required to maintain a subaccount (the “PHFC Payments Subaccount”) as a reserve for the PHFC payments. Neither the borrower nor the lender is required to make monthly deposits under the PHFC Program documents in the PHFC Payments Subaccount so long as (i) no event of default under the 6500 South Mortgage Loan documents has occurred and is continuing, (ii) the borrower delivers to lender sufficient evidence that the PHFC payments due under the PHFC Program documents are paid on or prior to the applicable due date and (iii) the DSCR (as defined below) is greater than or equal to 1.34x and the net cash flow debt yield is greater than or equal to 8.85%. To the extent deposits are required, the borrower will be required to pay to the lender an amount that is estimated by the lender to be sufficient to pay the next monthly or annual installment of the PHFC payments due under the PHFC Program documents, and the lender will transfer such amounts to the PHFC Payments Subaccount. Provided no event of default has occurred or is continuing, the lender will apply the remaining funds in the PHFC Payments Subaccount to make the PHFC payments required by the borrower under the PHFC Program documents.
The 6500 South Mortgage loan is structured with recourse to the borrower sponsors up to the amount of any property taxes due because of the 6500 South Mortgage Property not receiving the full tax exemption or because of the termination of the PHFC Program documents.
Lockbox / Cash Management. The 6500 South Mortgage Loan is structured with a springing lockbox and springing cash management. From and after the occurrence of a Cash Management Period (as defined below), the borrower is required to establish and maintain a lockbox account, and will cause all rents received by the property manager or borrower with respect to the 6500 South Property to be deposited into such lockbox account within three business days of receipt. During a Cash Management Period, funds deposited into the lockbox account are to be swept on a daily basis into a cash management account, and disbursed in accordance with the 6500 South Mortgage Loan documents, which includes reserving remaining available cash in an excess cash flow reserve account.
A “Cash Management Period” will commence upon the earliest of the following: (i) the stated maturity date of April 6, 2030, (ii) the occurrence of an event of default under the 6500 South Mortgage Loan documents or (iii) the net cash flow debt service coverage ratio (“NCF DSCR”) is less than 1.15x for two consecutive calendar quarters.
A Cash Management Period will end, with regard to: (a) clause (i) above, the stated maturity date has not occurred, (b) clause (ii) above, upon the cure of such event of default and (c) clause (iii) above, upon the NCF DSCR being equal to or greater than 1.20x for two consecutive calendar quarters.
Subordinate and Mezzanine Debt. None.
Permitted Future Mezzanine Debt. Not permitted.
Partial Release. Not permitted.
Ground Lease. At origination, (i) the borrower entered into a ground lease as ground lessee with PHFC as ground lessor, and (ii) Tarillas 6500 South, LLC was appointed as the managing member of the borrower (0.01% membership interest). Pursuant to the ground lease, which is scheduled to terminate on March 31, 2124 with no extensions, and other documents and agreements entered in relation to the tax exemption, the borrower is required to pay:
| (i) | a one-time closing fee of $250,000 due at origination of the 6500 South Mortgage Loan, |
| (ii) | an annual savings fee equal to 10% of the 2025 real estate taxes with 2.0% annual increases, which is initially $115,327, and |
| (iii) | an annual compliance fee of $100 per unit with 2.0% annual increases which is initially $53,600. |
The borrower may terminate the ground lease at any time upon (i) delivery of written notice of such termination no later than thirty days prior to the date of termination, and (ii) payment of a $100 termination fee. However, PHFC holds the right, as outlined in the PHFC Program documents, to purchase the 6500 South Property or the borrower’s fee interest (the “Acquisition Option”), within the thirty-day period prior to the early termination of the ground lease. If PHFC chooses not to exercise the Acquisition Option, PHFC must convey the fee interest back to the borrower and the ground lease will be terminated.
THE INFORMATION IN THIS STRUCTURAL AND COLLATERAL TERM SHEET IS NOT COMPLETE AND MAY BE AMENDED PRIOR TO THE TIME OF SALE. THIS TERM SHEET IS NOT AN OFFER TO SELL THESE SECURITIES AND IT IS NOT A SOLICITATION OF AN OFFER TO BUY THESE SECURITIES IN ANY JURISDICTION WHERE THE OFFER OR SALE IS NOT PERMITTED. | ||
| 54 | ||
| Structural and Collateral Term Sheet | BBCMS 2025-5C34 | |
| No. 4 – Ross RV Park Portfolio | ||
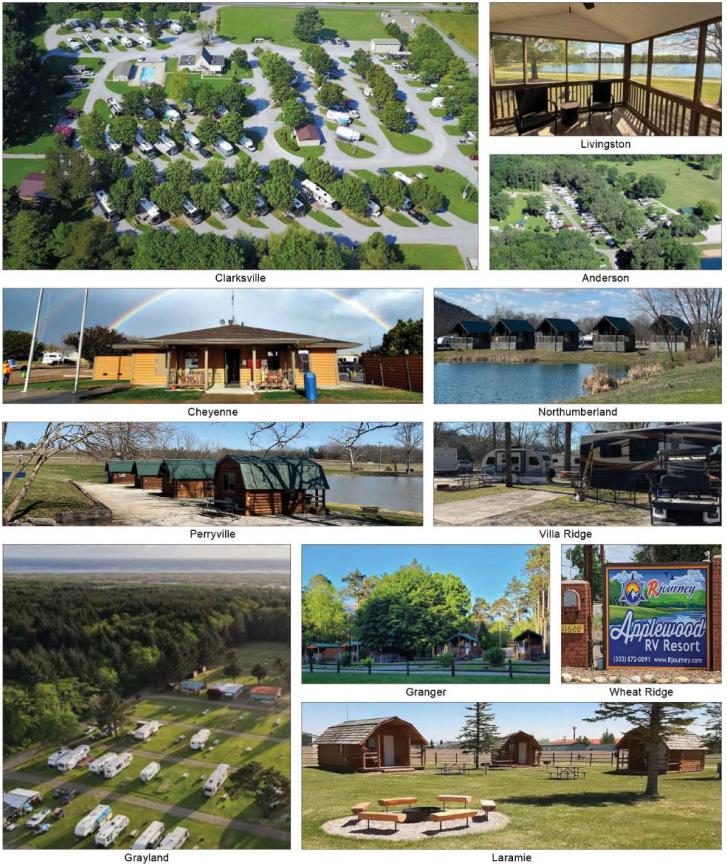
THE INFORMATION IN THIS STRUCTURAL AND COLLATERAL TERM SHEET IS NOT COMPLETE AND MAY BE AMENDED PRIOR TO THE TIME OF SALE. THIS TERM SHEET IS NOT AN OFFER TO SELL THESE SECURITIES AND IT IS NOT A SOLICITATION OF AN OFFER TO BUY THESE SECURITIES IN ANY JURISDICTION WHERE THE OFFER OR SALE IS NOT PERMITTED. | ||
| 55 | ||
| Structural and Collateral Term Sheet | BBCMS 2025-5C34 | |
| No. 4 – Ross RV Park Portfolio | ||
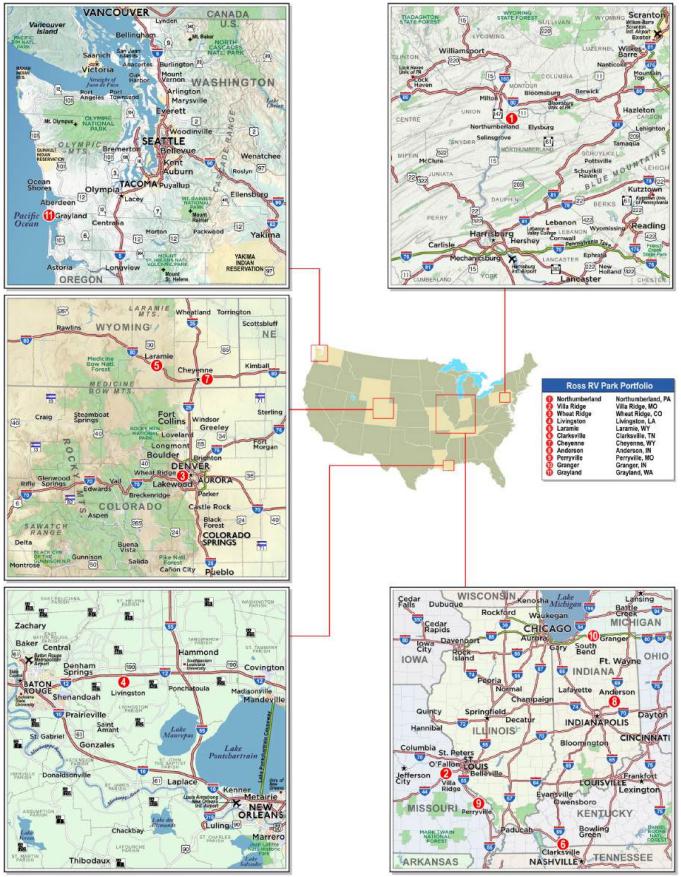
THE INFORMATION IN THIS STRUCTURAL AND COLLATERAL TERM SHEET IS NOT COMPLETE AND MAY BE AMENDED PRIOR TO THE TIME OF SALE. THIS TERM SHEET IS NOT AN OFFER TO SELL THESE SECURITIES AND IT IS NOT A SOLICITATION OF AN OFFER TO BUY THESE SECURITIES IN ANY JURISDICTION WHERE THE OFFER OR SALE IS NOT PERMITTED. | ||
| 56 | ||
| Structural and Collateral Term Sheet | BBCMS 2025-5C34 | |
| No. 4 – Ross RV Park Portfolio | ||
| Mortgage Loan Information | Property Information | |||
| Mortgage Loan Seller: | UBS AG | Single Asset / Portfolio: | Portfolio | |
| Original Principal Balance: | $48,000,000 | Title: | Fee | |
| Cut-off Date Principal Balance: | $48,000,000 | Property Type – Subtype: | Manufactured Housing – RV Park | |
| % of IPB: | 6.1% | Net Rentable Area (Pads): | 1,534 | |
| Loan Purpose: | Refinance | Location: | Various, Various | |
| Borrowers(1): | Various | Year Built / Renovated: | Various / Various | |
| Borrower Sponsors(1): | Various | Occupancy: | 49.6% | |
| Interest Rate: | 7.60000% | Occupancy Date: | 2/28/2025 | |
| Note Date: | 4/10/2025 | 4th Most Recent NOI (As of)(2): | NAV | |
| Maturity Date: | 4/6/2030 | 3rd Most Recent NOI (As of)(3): | $4,465,388 (12/31/2023) | |
| Interest-only Period: | 60 months | 2nd Most Recent NOI (As of)(3): | $5,585,589 (12/31/2024) | |
| Original Term: | 60 months | Most Recent NOI (As of): | $5,646,391 (TTM 2/28/2025) | |
| Original Amortization Term: | None | UW Economic Occupancy: | 44.4% | |
| Amortization Type: | Interest Only | UW Revenues: | $9,642,585 | |
| Call Protection: | L(25),D(28),O(7) | UW Expenses: | $4,281,170 | |
| Lockbox / Cash Management: | Springing | UW NOI: | $5,361,416 | |
| Additional Debt: | No | UW NCF: | $5,246,366 | |
| Additional Debt Balance: | N/A | Appraised Value / Per Pad(4): | $76,000,000 / $49,544 | |
| Additional Debt Type: | N/A | Appraisal Date: | Various | |
| Escrows and Reserves(5) | Financial Information | |||||
| Initial | Monthly | Cap | Cut-off Date Loan / Pad: | $31,291 | ||
| Taxes: | $15,069 | $25,116 | N/A | Maturity Date Loan / Pad: | $31,291 | |
| Insurance: | $242,324 | $31,885 | N/A | Cut-off Date LTV(4): | 63.2% | |
| Replacement Reserves: | $0 | $9,588 | N/A | Maturity Date LTV(4): | 63.2% | |
| Immediate Repairs: | $46,375 | $0 | N/A | UW NCF DSCR: | 1.42x | |
| Other(6): | $224,500 | Various | N/A | UW NOI Debt Yield: | 11.2% | |
| Sources and Uses | |||||||
| Sources | Proceeds | % of Total | Uses | Proceeds | % of Total | ||
| Mortgage Loan | $48,000,000 | 100.0% | Loan Payoff | $44,532,750 | 92.8 | % | |
| Return of Equity | 1,509,933 | 3.1 | |||||
| Closing Costs(7) | 1,429,049 | 3.0 | |||||
| Upfront Reserves | 528,269 | 1.1 | |||||
| Total Sources | $48,000,000 | 100.0% | Total Uses | $48,000,000 | 100.0 | % | |
| (1) | See “The Borrowers” and “The Borrower Sponsors” below for more information. |
| (2) | 4th Most Recent NOI is unavailable as the borrower sponsors acquired the Ross RV Park Portfolio Properties (as defined below) between 2021 and 2022. |
| (3) | The increase from 3rd Most Recent NOI to 2nd Most Recent NOI is primarily due to the increase in occupancy from 38.9% to 49.3% during this period. |
| (4) | The appraised value includes an “As Portfolio” premium of $2,100,000. The sum of the individual values for the Ross RV Park Portfolio Properties excluding the portfolio premium is $73,900,000. Excluding the portfolio premium, the Cut-off Date LTV and Maturity Date LTV are 65.0% and 65.0%, respectively. |
| (5) | For a full description of Escrows and Reserves, please refer to “Escrows and Reserves” below. |
| (6) | Other reserves consist of (i) an upfront seasonality reserve of $200,000 and various monthly payments, (ii) an upfront water quality reserve of $18,250, (iii) an upfront secondary containment reserve of $3,750 and (iv) an upfront water deficiency correction reserve of $2,500. |
| (7) | Closing Costs include a rate buydown of $240,000. |
The Loan. The Ross RV Park Portfolio mortgage loan (the “Ross RV Park Portfolio Mortgage Loan”) has an outstanding principal balance as of the Cut-off Date of $48,000,000 and is secured by the borrowers’ fee interests in a portfolio of 11 recreational vehicle (“RV”) park properties located across eight states and totaling 1,534 pads (each, a “Ross RV Park Portfolio Property”, and collectively, the “Ross RV Park Portfolio Properties”). The Ross RV Park Portfolio Mortgage Loan has a five-year term, is interest only for the entire term and accrues interest at a fixed rate of 7.60000% per annum on an Actual/360 basis.
THE INFORMATION IN THIS STRUCTURAL AND COLLATERAL TERM SHEET IS NOT COMPLETE AND MAY BE AMENDED PRIOR TO THE TIME OF SALE. THIS TERM SHEET IS NOT AN OFFER TO SELL THESE SECURITIES AND IT IS NOT A SOLICITATION OF AN OFFER TO BUY THESE SECURITIES IN ANY JURISDICTION WHERE THE OFFER OR SALE IS NOT PERMITTED. | ||
| 57 | ||
| Structural and Collateral Term Sheet | BBCMS 2025-5C34 | |
| No. 4 – Ross RV Park Portfolio | ||
The Properties. The Ross RV Park Portfolio Properties are comprised of a portfolio of 11 RV park properties located across eight states and totaling 1,534 pads. Of the 1,534 pads, 1,333 pads (86.9% of pads) are RV sites, 111 pads (7.2% of pads) are lodging/home sites, and 90 pads (5.9% of pads) are tent sites. The Ross RV Park Portfolio Properties were built between 1900 and 2023 and encompass a combined approximately 268 acres. The weighted average occupancy for the Ross RV Park Portfolio Properties was 49.6% occupied, as of February 28, 2025. The weighted average of monthly asking rates for the Ross RV Park Portfolio Properties is $528. The borrower sponsors acquired the 11 RV park properties between 2021 and 2022 for a combined purchase price of approximately $61.0 million ($39,795 per pad). Since acquisition, the borrower sponsors have spent approximately $4.8 million ($3,150 per pad) on capital expenditures for a total cost basis of approximately $65.9 million ($42,945 per pad).
The following table presents certain information relating to the Ross RV Park Portfolio Properties:
| Portfolio Summary(1) | |||||||||||||
| Sites | |||||||||||||
| Property | State | Year Built | RV | Lodging/ Home | Tent | Total | % of Sites | Occ. %(2) | UW Base Rent per Site(3) | % UW NCF | Allocated Loan Amount “ALA” | % of ALA | “As-Is” Appraised Value |
| Northumberland | PA | 1970 | 315 | 40 | 19 | 374 | 24.4% | 33.5% | $5,002 | 18.0% | $9,937,753 | 20.7% | $15,300,000 |
| Villa Ridge | MO | 1986 | 186 | 6 | 0 | 192 | 12.5% | 64.1% | $6,216 | 13.4% | 6,365,359 | 13.3% | 9,600,000 |
| Wheat Ridge | CO | 1989 | 81 | 0 | 0 | 81 | 5.3% | 79.1% | $15,551 | 16.4% | 6,235,453 | 13.0% | 9,800,000 |
| Livingston | LA | 2003 | 137 | 5 | 0 | 142 | 9.3% | 72.5% | $6,862 | 9.3% | 5,650,880 | 11.8% | 8,100,000 |
| Laramie | WY | 1967 | 153 | 8 | 7 | 168 | 11.0% | 51.2% | $6,260 | 12.5% | 5,261,164 | 11.0% | 8,700,000 |
| Cheyenne | WY | 1900 | 50 | 6 | 17 | 73 | 4.8% | 52.2% | $10,028 | 7.7% | 3,637,348 | 7.6% | 5,600,000 |
| Clarksville | TN | 1975 | 67 | 2 | 3 | 72 | 4.7% | 72.2% | $10,439 | 7.8% | 3,507,442 | 7.3% | 5,400,000 |
| Anderson | IN | 1965 | 86 | 5 | 25 | 116 | 7.6% | 42.1% | $4,407 | 3.6% | 2,143,437 | 4.5% | 3,100,000 |
| Granger | IN | 1995 | 57 | 25 | 4 | 86 | 5.6% | 57.1% | $6,560 | 4.7% | 2,013,532 | 4.2% | 3,100,000 |
| Perryville | MO | 1972 | 122 | 9 | 0 | 131 | 8.5% | 28.9% | $3,530 | 4.0% | 2,013,532 | 4.2% | 3,300,000 |
| Grayland | WA | 1977 | 79 | 5 | 15 | 99 | 6.5% | 33.2% | $3,450 | 2.7% | 1,234,100 | 2.6% | 1,900,000 |
| Total / Wtd. Avg. | 1,333 | 111 | 90 | 1,534 | 100.0% | 49.6% | $6,332 | 100.0% | $48,000,000 | 100.0% | $76,000,000(4) | ||
| (1) | Source: Appraisals. |
| (2) | Occ. % is as of February 28, 2025. |
| (3) | UW Base Rent per Site is based on the trailing 12 months base rent through February 28, 2025. |
| (4) | “As-Is” Appraised Value includes an “As Portfolio” premium of $2,100,000. The sum of the individual values for the Ross RV Park Portfolio Properties excluding the portfolio premium is $73,900,000. |
Environmental. According to the Phase I environmental reports dated March 20, 2025 and March 31, 2025, there was no evidence of recognized environmental conditions at the Ross RV Park Portfolio Properties with the exception of the Villa Ridge mortgaged property.
The north adjoining parcel to the Villa Ridge mortgaged property, 1238 State Highway AT, was identified with a petroleum release identified in 2000. The investigation and cleanup, including soil excavation, started in 2008. Review of the February 2021 investigation documentation indicated that a request for access to the Villa Ridge mortgaged property to perform soil and groundwater sampling was made in a letter dated October 4, 2021. No documentation was made available as to whether this investigation took place. The environmental report recommended that the Villa Ridge mortgaged property provides full cooperation for access associated with the open case for the north adjoining property. See “Description of the Mortgage Pool–Mortgage Pool Characteristics–Environmental Considerations” in the Preliminary Prospectus.
THE INFORMATION IN THIS STRUCTURAL AND COLLATERAL TERM SHEET IS NOT COMPLETE AND MAY BE AMENDED PRIOR TO THE TIME OF SALE. THIS TERM SHEET IS NOT AN OFFER TO SELL THESE SECURITIES AND IT IS NOT A SOLICITATION OF AN OFFER TO BUY THESE SECURITIES IN ANY JURISDICTION WHERE THE OFFER OR SALE IS NOT PERMITTED. | ||
| 58 | ||
| Structural and Collateral Term Sheet | BBCMS 2025-5C34 | |
| No. 4 – Ross RV Park Portfolio | ||
The following table presents certain information relating to the historical and current occupancy of the Ross RV Park Portfolio Properties:
| Historical and Current Occupancy(1)(2) | |||
| Property | 2023 | 2024 | Current(3) |
| Northumberland | 24.8% | 32.9% | 33.5% |
| Villa Ridge | 56.1% | 65.3% | 64.1% |
| Wheat Ridge | 79.9% | 80.9% | 79.1% |
| Livingston | 78.1% | 74.6% | 72.5% |
| Laramie | 33.8% | 50.5% | 51.2% |
| Cheyenne | 36.8% | 49.5% | 52.2% |
| Clarksville | 33.4% | 70.6% | 72.2% |
| Anderson | 40.2% | 43.7% | 42.1% |
| Granger | 26.6% | 52.9% | 57.1% |
| Perryville | 21.4% | 27.7% | 28.9% |
| Grayland | 15.7% | 32.6% | 33.2% |
| Total/Wtd. Avg. | 38.9% | 49.3% | 49.6% |
| (1) | Based on December 31 of each respective year. |
| (2) | Historical occupancy prior to 2023 is unavailable as the Ross RV Park Portfolio Properties were acquired between 2021 and 2022. |
| (3) | Current occupancy is as of February 28, 2025. |
The following table presents certain information relating to the operating history and underwritten cash flows of the Ross RV Park Portfolio Properties:
| Operating History and Underwritten Net Cash Flow | |||||||
| 2023 | 2024 | TTM(1) | Underwritten | Per Pad | %(2) | ||
| Base Rent(3) | $8,492,342 | $9,602,660 | $9,712,782 | $9,712,782 | $6,332 | 47.2 | % |
| Vacant Income | 15,682,051 | 10,070,617 | 9,997,139 | 9,997,139 | 6,517 | 48.5 | |
| Gross Potential Rent | $24,174,394 | $19,673,277 | $19,709,922 | $19,709,922 | $12,849 | 95.7 | % |
| Total Other Income | 913,076 | 851,012 | 883,733 | 883,733 | 576 | 4.3 | |
| Net Rental Income | $25,087,470 | $20,524,289 | $20,593,654 | $20,593,654 | $13,425 | 100.0 | % |
| (Vacancy/Credit Loss) | (16,138,476) | (10,960,451) | (10,951,069) | (10,951,069) | (7,139) | (53.2 | ) |
| Effective Gross Income | $8,948,994 | $9,563,838 | $9,642,585 | $9,642,585 | $6,286 | 46.8 | % |
| Total Expenses | 4,483,606 | 3,978,249 | 3,996,195 | 4,281,170 | 2,791 | 44.4 | |
| Net Operating Income | $4,465,388 | $5,585,589 | $5,646,391 | $5,361,416 | $3,495 | 55.6 | % |
| Total Capex/RR | 0 | 0 | 0 | 115,050 | 75 | 1.2 | |
| Net Cash Flow | $4,465,388 | $5,585,589 | $5,646,391 | $5,246,366 | $3,420 | 54.4 | % |
| (1) | TTM represents the trailing 12 months ending February 28, 2025. |
| (2) | % column represents percent of Net Rental Income for all revenue lines and represents percent of Effective Gross Income for the remainder of the fields. |
| (3) | Base Rent is based on the TTM base rent through February 28, 2025. |
The Market. The Ross RV Park Portfolio Properties are located in Pennsylvania (one property; 20.7% of ALA), Wyoming (two properties; 18.5% of ALA), Missouri (two properties; 17.5% of ALA), Colorado (one property; 13.0% of ALA), Louisiana (one property; 11.8% of ALA), Indiana (two properties; 8.7% of ALA), Tennessee (one property; 7.3% of ALA) and Washington (one property; 2.6% of ALA).
THE INFORMATION IN THIS STRUCTURAL AND COLLATERAL TERM SHEET IS NOT COMPLETE AND MAY BE AMENDED PRIOR TO THE TIME OF SALE. THIS TERM SHEET IS NOT AN OFFER TO SELL THESE SECURITIES AND IT IS NOT A SOLICITATION OF AN OFFER TO BUY THESE SECURITIES IN ANY JURISDICTION WHERE THE OFFER OR SALE IS NOT PERMITTED. | ||
| 59 | ||
| Structural and Collateral Term Sheet | BBCMS 2025-5C34 | |
| No. 4 – Ross RV Park Portfolio | ||
The following table presents certain market demographic information with respect to the Ross RV Park Portfolio Properties:
| Demographic Summary(1) | |||||||
| 2025 Estimated Population | 2025 Average Household Income | ||||||
| Property | City, State | One-Mile Radius |
Three-Mile Radius | Five-Mile Radius |
One-Mile Radius | Three-Mile Radius | Five-Mile Radius |
| Northumberland | Northumberland, PA | 552 | 7,155 | 21,650 | $108,019 | $83,496 | $77,351 |
| Villa Ridge | Villa Ridge, MO | 1,065 | 6,208 | 14,092 | 98,266 | 97,989 | 95,719 |
| Wheat Ridge | Wheat Ridge, CO | 7,800 | 86,033 | 241,844 | 131,280 | 133,293 | 137,337 |
| Livingston | Livingston, LA | 649 | 4,074 | 9,616 | 93,734 | 97,606 | 87,364 |
| Laramie | Laramie, WY | 3,032 | 28,298 | 34,523 | 81,457 | 80,698 | 86,343 |
| Cheyenne | Cheyenne, WY | 30 | 2,515 | 19,868 | 116,703 | 90,101 | 68,468 |
| Clarksville | Clarksville, TN | 5,363 | 40,312 | 82,473 | 81,277 | 94,132 | 88,408 |
| Anderson | Anderson, IN | 2,211 | 19,438 | 58,429 | 78,252 | 73,018 | 65,897 |
| Granger | Granger, IN | 1,964 | 19,911 | 52,931 | 143,026 | 161,806 | 132,310 |
| Perryville | Perryville, MO | 896 | 9,696 | 12,049 | 88,689 | 79,861 | 81,792 |
| Grayland | Grayland, WA | 248 | 626 | 1,477 | 78,156 | 77,143 | 76,922 |
| Total/Wtd. Avg.(2) | 2,297 | 22,324 | 55,589 | $102,419 | $97,020 | $91,848 | |
| (1) | Source: Third-party market research reports. |
| (2) | The Wtd. Avg. figures are based on ALAs for the individual properties. |
The Borrowers. The borrowers are Laramie RV Resort, LLC, Lakeside RV Resort, LLC, Clarksville RV Resort, LLC, Cheyenne RV Resort, LLC, Pin Oak RV Resort, LLC, Applewood RV Resort, LLC, Elkhart RV Resort, LLC, Muncie RV Resort, LLC, Kenanna RV Resort, LLC, Splash Magic RV Resort LLC and Perryville RV Resort, LLC, each a limited liability company incorporated in its respective state and a single purpose entity with one independent director held at the sole member and manager level, which sole member and manager is a newly-formed Delaware limited liability company and a single purpose entity. Legal counsel to the borrowers delivered a non-consolidation opinion in connection with the origination of the Ross RV Park Portfolio Mortgage Loan.
The Borrower Sponsors. The borrower sponsors and non-recourse guarantors are (i) Tyrrell G. Ross, (ii) David T. Ross, (iii) Barbara A. Ross, (iv) Brenda A. Ross, (v) Jimmy E. Michael, (vi) Kimberly K. Michael, (vii) Kurtus A. Ross, (viii) Kurtus A. Ross, as Trustee of Kurt Ross Prime Trust, (ix) Chad D. Ross, (x) Denise R. Ross, (xi) Denise R. Ross, as Trustee of Denise Ross Gift Trust and (xii) Brenda A. Ross, as Trustee of Brenda Ross Gift Trust.
Property Management. The Ross RV Park Portfolio Properties are self-managed.
Escrows and Reserves. At origination, the borrowers deposited (i) approximately $15,069 for real estate taxes, (ii) approximately $242,324 for insurance premiums, (iii) $46,375 for immediate repairs, (iv) $200,000 for seasonality reserve funds, (v) $18,250 for water quality reserve funds, (vi) $3,750 for secondary containment reserve funds and (vii) $2,500 for water deficiency correction reserve funds.
Real Estate Taxes – On a monthly basis, the borrowers are required to deposit 1/12th of an amount that would be sufficient to pay taxes for the next ensuing 12 months, currently approximately $25,116.
Insurance – On a monthly basis, the borrowers are required to deposit 1/12th of an amount that would be sufficient to pay insurance premiums for the renewal of insurance coverages, currently approximately $31,885. Notwithstanding the above, such monthly deposits will be waived so long as, among other conditions specified in the Ross RV Park Portfolio Mortgage Loan documents, the borrowers maintain a blanket insurance policy acceptable to the lender. A blanket policy is not currently in place.
Replacement Reserve – On a monthly basis, the borrowers are required to deposit $9,588 for replacement reserves.
Seasonality Reserve – On a monthly basis, the borrowers are required to deposit (i) $200,000 on May 6, 2025, June 6, 2025, July 6, 2025 and August 6, 2025, (ii) $169,000 on September 6, 2025 and (iii) on each monthly payment date occurring during the calendar months of May, June, July, August, September and October of each year of the term of the Ross RV Park Portfolio Mortgage Loan beginning on May 6, 2026, an amount equal to the then-applicable (a) Seasonality Reserve
THE INFORMATION IN THIS STRUCTURAL AND COLLATERAL TERM SHEET IS NOT COMPLETE AND MAY BE AMENDED PRIOR TO THE TIME OF SALE. THIS TERM SHEET IS NOT AN OFFER TO SELL THESE SECURITIES AND IT IS NOT A SOLICITATION OF AN OFFER TO BUY THESE SECURITIES IN ANY JURISDICTION WHERE THE OFFER OR SALE IS NOT PERMITTED. | ||
| 60 | ||
| Structural and Collateral Term Sheet | BBCMS 2025-5C34 | |
| No. 4 – Ross RV Park Portfolio | ||
Aggregate Shortfall Amount (as defined below) divided by (b) six. A “Seasonality Reserve Aggregate Shortfall Amount” means, commencing on May 6, 2026, the product of (A) the aggregate amount of all Seasonality Reserve Monthly Shortfall Amounts (as defined below) for the immediately preceding 12 calendar month period, as calculated by the lender in June of each year, multiplied by (B) 1.20. A “Seasonality Reserve Monthly Shortfall Amount” means the amount, if any, by which gross income from operations is deficient for purposes of paying debt service, operating expenses and required monthly deposits to the reserve funds for the subject calendar month. In any month in which gross income from operations is sufficient for the purpose of satisfying all such payments, the Seasonality Reserve Monthly Shortfall Amount will be $0.
Lockbox / Cash Management. The Ross RV Park Portfolio Mortgage Loan is structured with a springing lockbox and springing cash management. Upon the occurrence of a Cash Management Trigger Event (as defined below), the borrowers will establish and maintain a lockbox account, and will cause all rents received by the borrowers or the property manager to be deposited directly into the lockbox account and the borrowers will, or will cause the property manager to, deliver (i) tenant direction letters to all existing and future non-residential tenants at the Ross RV Park Portfolio Properties to remit their rent directly to the lockbox account and (ii) deliver credit card company direction letters to all credit card companies or credit card clearing banks with which the borrowers or the property manager have entered into merchant’s agreements to deliver all receipts payable with respect to the Ross RV Park Portfolio Properties directly to the lockbox account. Any rent received by the borrowers or the property manager during a Cash Management Trigger Event is required to be deposited within one business day of receipt. During the continuance of a Cash Management Trigger Event, all funds in the lockbox account are required to be swept each business day to a lender-controlled cash management account and disbursed in accordance with the Ross RV Park Portfolio Mortgage Loan documents, and all excess funds on deposit in the cash management account (after payment of debt service and all applicable reserves and other amounts due with respect to the Ross RV Park Portfolio Mortgage Loan) will be applied as follows: (a) if a Cash Sweep Trigger Event (as defined below) has occurred and is continuing, to the lender-controlled excess cash flow account; or (b) if no Cash Sweep Trigger Event has occurred and is continuing, to an account designated by the borrowers.
A “Cash Management Trigger Event” means a period commencing upon the occurrence of (i) an event of default under the Ross RV Park Portfolio Mortgage Loan documents, (ii) any bankruptcy action involving any of the borrowers, any general partner, managing member or sole member (each, a “SPC Party”), any guarantors or the property manager, (iii) the trailing 12-month period debt service coverage ratio falling below 1.25x or (iv) the indictment for fraud or misappropriation of funds by any of the borrowers, the guarantors, or an affiliated or third-party property manager (provided that, in the case of the third-party property manager, such fraud or misappropriation is related to any of the Ross RV Park Portfolio Properties), or any director or officer of the aforementioned parties, and expiring upon (a) with respect to clause (i) above, the cure of such event of default, (b) with respect to clause (ii) above, the filing being discharged, stayed or dismissed within 45 days, and the lender’s determination that such filing does not materially affect the borrowers’, the SPC Party’s, the guarantors’ or the property manager’s monetary obligations, (c) with respect to clause (iii) above, the trailing 12-month debt service coverage ratio being at least 1.25x for two consecutive calendar quarters and (d) with respect to clause (iv) above, the dismissal of the applicable indictment with prejudice or acquittal of the applicable person, or the replacement of the property manager with a third-party property manager that constitutes a qualified property manager under the Ross RV Park Portfolio Mortgage Loan documents.
A “Cash Sweep Trigger Event” means a period commencing upon the occurrence of (i) an event of default under the Ross RV Park Portfolio Mortgage Loan documents, (ii) any bankruptcy action involving any of the borrowers, any SPC Party, the guarantors or the property manager or (iii) the trailing 12-month period debt service coverage ratio falling below 1.20x, and expiring upon (a) with respect to clause (i) above, the cure of such event of default, (b) with respect to clause (ii) above, as to an involuntary filing, the filing being discharged, stayed or dismissed within 45 days, and the lender’s determination that such filing does not materially affect the borrowers’, the SPC Party’s, the guarantors’ or the property manager’s monetary obligations or (c) with respect to clause (iii) above, the trailing 12-month debt service coverage ratio is at least 1.20x for two consecutive calendar quarters.
Subordinate and Mezzanine Debt. None.
Permitted Future Mezzanine Debt. Not permitted.
Partial Release. Not permitted.
Ground Lease. None.
THE INFORMATION IN THIS STRUCTURAL AND COLLATERAL TERM SHEET IS NOT COMPLETE AND MAY BE AMENDED PRIOR TO THE TIME OF SALE. THIS TERM SHEET IS NOT AN OFFER TO SELL THESE SECURITIES AND IT IS NOT A SOLICITATION OF AN OFFER TO BUY THESE SECURITIES IN ANY JURISDICTION WHERE THE OFFER OR SALE IS NOT PERMITTED. | ||
| 61 | ||
| Structural and Collateral Term Sheet | BBCMS 2025-5C34 | |
| No. 5 – GM Holdings Portfolio | ||
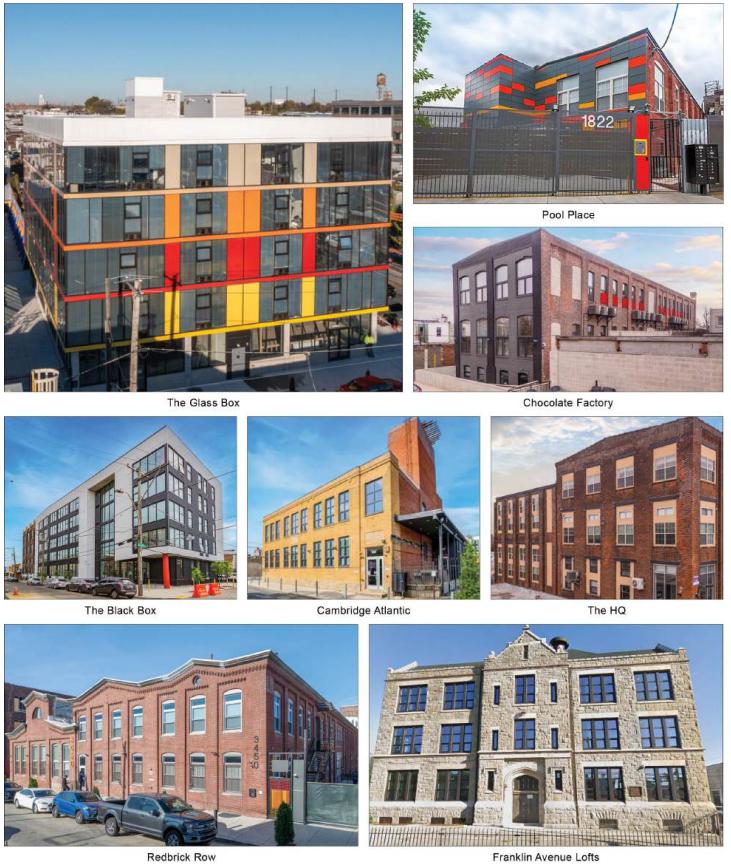
THE INFORMATION IN THIS STRUCTURAL AND COLLATERAL TERM SHEET IS NOT COMPLETE AND MAY BE AMENDED PRIOR TO THE TIME OF SALE. THIS TERM SHEET IS NOT AN OFFER TO SELL THESE SECURITIES AND IT IS NOT A SOLICITATION OF AN OFFER TO BUY THESE SECURITIES IN ANY JURISDICTION WHERE THE OFFER OR SALE IS NOT PERMITTED. | ||
| 62 | ||
| Structural and Collateral Term Sheet | BBCMS 2025-5C34 | |
| No. 5 – GM Holdings Portfolio | ||
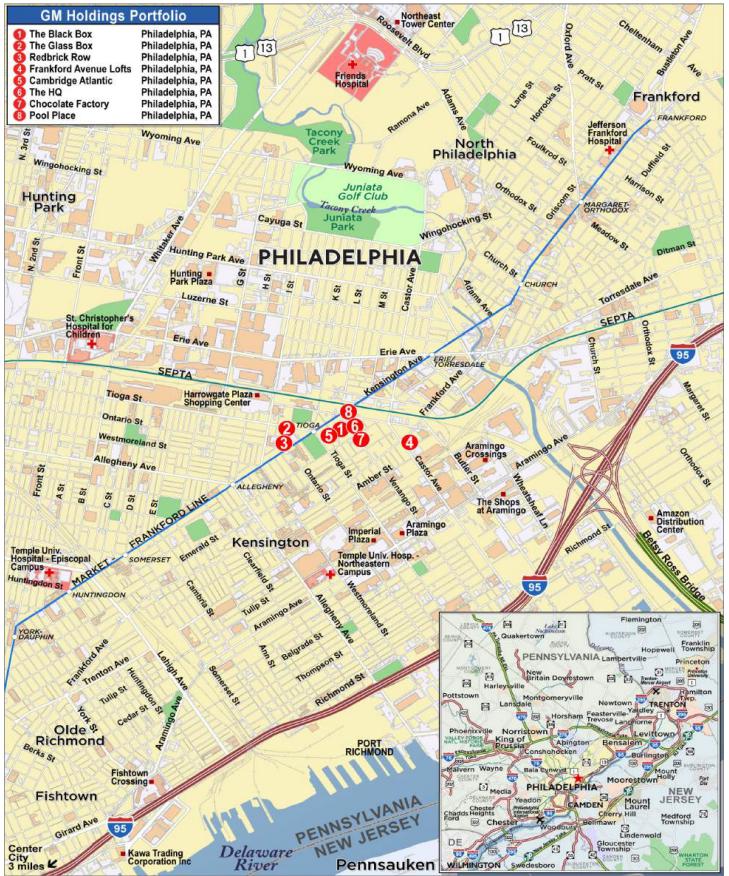
THE INFORMATION IN THIS STRUCTURAL AND COLLATERAL TERM SHEET IS NOT COMPLETE AND MAY BE AMENDED PRIOR TO THE TIME OF SALE. THIS TERM SHEET IS NOT AN OFFER TO SELL THESE SECURITIES AND IT IS NOT A SOLICITATION OF AN OFFER TO BUY THESE SECURITIES IN ANY JURISDICTION WHERE THE OFFER OR SALE IS NOT PERMITTED. | ||
| 63 | ||
| Structural and Collateral Term Sheet | BBCMS 2025-5C34 | |
| No. 5 – GM Holdings Portfolio | ||
| Mortgage Loan Information | Property Information | |||
| Mortgage Loan Seller: | Barclays | Single Asset / Portfolio: | Portfolio | |
| Original Principal Balance: | $46,000,000 | Title: | Fee | |
| Cut-off Date Principal Balance: | $46,000,000 | Property Type – Subtype: | Multifamily – Various | |
| % of IPB: | 5.9% | Net Rentable Area (Units): | 187 | |
| Loan Purpose: | Refinance | Location: | Philadelphia, PA | |
| Borrowers: | 1810 Venango Street, LLC, 1817-21 E Venango Street, LLC, 1825 East Atlantic, LLC, 1849 East Venango, LLC, 3450 J Street LLC and Archer Property Development, LLC | Year Built / Renovated: | Various / Various | |
| Borrower Sponsor: | George Manosis | Occupancy(3): | 96.8% | |
| Interest Rate: | 7.05500% | Occupancy Date: | 2/1/2025 | |
| Note Date: | 3/31/2025 | 4th Most Recent NOI (As of)(3): | NAV | |
| Maturity Date: | 4/6/2030 | 3rd Most Recent NOI (As of)(3): | NAV | |
| Interest-only Period: | 60 months | 2nd Most Recent NOI (As of)(4): | $3,013,709 (12/31/2023) | |
| Original Term: | 60 months | Most Recent NOI (As of)(4): | $4,545,614 (12/31/2024) | |
| Original Amortization Term: | None | UW Economic Occupancy: | 95.0% | |
| Amortization Type: | Interest Only | UW Revenues: | $5,316,360 | |
| Call Protection: | L(25),D(28),O(7) | UW Expenses: | $887,560 | |
| Lockbox / Cash Management: | Springing | UW NOI: | $4,428,801 | |
| Additional Debt: | No | UW NCF: | $4,382,051 | |
| Additional Debt Balance: | N/A | Appraised Value / Per Unit: | $72,600,000 / $388,235 | |
| Additional Debt Type: | N/A | Appraisal Date: | 11/22/2024 | |
| Escrows and Reserves(1) | Financial Information | ||||||
| Initial | Monthly | Initial Cap | Cut-off Date Loan / Unit: | $245,989 | |||
| Taxes: | $7,277 | $7,277 | N/A | Maturity Date Loan / Unit: | $245,989 | ||
| Insurance: | $36,161 | $18,080 | N/A | Cut-off Date LTV: | 63.4% | ||
| Replacement Reserve: | $0 | $3,896 | N/A | Maturity Date LTV: | 63.4% | ||
| Deferred Maintenance: | $37,500 | $0 | N/A | UW NCF DSCR: | 1.33x | ||
| Environmental Reserve: | $10,000 | $0 | N/A | UW NOI Debt Yield: | 9.6% | ||
| Sources and Uses | ||||||||
| Sources | Proceeds | % of Total | Uses | Proceeds | % of Total | |||
| Mortgage Loan | $46,000,000 | 99.7 | % | Loan Payoff | $44,485,420 | 96.4 | % | |
| Borrower Sponsor Equity | 124,782 | 0.3 | Closing Costs(5) | 1,548,424 | 3.4 | |||
| Upfront Reserves | 90,938 | 0.2 | ||||||
| Total Sources | $46,124,782 | 100.0 | % | Total Uses | $46,124,782 | 100.0 | % | |
| (1) | For a full description of Escrows and Reserves, see “Escrows and Reserves” below. |
| (2) | Occupancy is based on the multifamily occupancy of the GM Holdings Portfolio Properties (as defined below). The occupancy rate of the 26,586 square feet of commercial space is 96.6%. |
| (3) | 4th Most Recent NOI (As of) and 3rd Most Recent NOI (As of) are unavailable due to two of the GM Holdings Portfolio Properties being fully redeveloped in 2022 and one of the GM Holdings Portfolio Properties being fully redeveloped in 2024. |
| (4) | The increase from 2nd Most Recent NOI (As of) to Most Recent NOI (As of) is due to The Black Box Property (as defined below) being redeveloped in 2024 and starting lease up in December 2023. |
| (5) | Closing Costs includes a rate buydown of $506,000. |
THE INFORMATION IN THIS STRUCTURAL AND COLLATERAL TERM SHEET IS NOT COMPLETE AND MAY BE AMENDED PRIOR TO THE TIME OF SALE. THIS TERM SHEET IS NOT AN OFFER TO SELL THESE SECURITIES AND IT IS NOT A SOLICITATION OF AN OFFER TO BUY THESE SECURITIES IN ANY JURISDICTION WHERE THE OFFER OR SALE IS NOT PERMITTED. | ||
| 64 | ||
| Structural and Collateral Term Sheet | BBCMS 2025-5C34 | |
| No. 5 – GM Holdings Portfolio | ||
The Loan. The GM Holdings Portfolio mortgage loan (the “GM Holdings Portfolio Mortgage Loan”) has an outstanding principal balance as of the Cut-off Date of $46,000,000 and is secured by the borrowers’ fee interests in eight multifamily properties that include 187 residential units comprising of 190,529 square feet and 26,586 square feet of commercial space located in the greater Philadelphia, Pennsylvania area (“The Black Box Property,” “The Glass Box Property,” the “Redbrick Row Property,” the “Frankford Avenue Lofts Property,” the “Cambridge Atlantic Property,” “The HQ Property,” the “Chocolate Factory Property,” and the “Pool Place Property,” each an “Individual Mortgaged Property,” and together, the “GM Holdings Portfolio Properties”). The GM Holdings Portfolio Mortgage Loan accrues interest at a rate of 7.05500% per annum. The GM Holdings Portfolio Mortgage Loan has a five-year term, is interest-only for the entire term and accrues interest on an Actual/360 basis.
The Properties. The GM Holdings Portfolio Properties are comprised of eight multifamily properties that include 187 units totaling 190,529 square feet and 26,586 square feet of commercial space at four of the GM Holdings Portfolio Properties. The GM Holdings Portfolio Properties are all located in the Kensington submarket of Philadelphia, Pennsylvania. The borrower sponsors acquired the GM Holdings Portfolio Properties as older industrial buildings or vacant land and redeveloped them into their current multifamily and commercial use. The borrower sponsor acquired the GM Holdings Portfolio Properties for approximately $3.2 million and invested approximately $55.6 million on their redevelopment.
As of February 1, 2025, the GM Holdings Portfolio Properties had an overall multifamily occupancy rate of 96.8% and a commercial occupancy rate of 96.6%. All the units are market-rate units with no affordability restrictions. Three of the eight properties, The Glass Box Property, the Frankford Avenue Lofts Property and the Redbrick Row Property, have 10-year tax abatements in place with five to eight years of term remaining. These abatements are administered by the City of Philadelphia whereby a property owner receives a 10-year abatement on 100% of the value added by the construction improvements. The borrowers have submitted similar abatement applications for The Black Box Property, the Chocolate Factory Property and the Cambridge Atlantic Property, with redevelopment being considered a by-right for the abatement. It cannot be assured that these Individual Mortgaged Properties will be accepted into the abatement program and full real estate taxes were underwritten for those three Individual Mortgaged Properties.
The following table presents certain information relating to the GM Holdings Portfolio Properties:
| Portfolio Summary | |||||||||
| Property Name | Year Built / Renovated(1) | Units(2) | Occupancy %(2) |
Allocated Cut-off Date Loan Amount (“ALA”) |
% of ALA | Appraised Value(1) | % of Appraised Value(1) | UW NOI | % of UW NOI |
| The Black Box | 1930 / 2024 | 36 | 97.2% | $11,814,000 | 25.7% | $19,100,000 | 26.3% | $1,135,045 | 25.6% |
| The Glass Box | 2021 / NAP | 24 | 91.7% | $7,425,000 | 16.1% | $11,300,000 | 15.6% | $712,892 | 16.1% |
| Redbrick Row | 1930 / 2019 | 39 | 94.9% | $7,244,000 | 15.7% | $10,700,000 | 14.7% | $699,387 | 15.8% |
| Frankford Avenue Lofts | 1903 / 2022 | 33 | 97.0% | $5,506,000 | 12.0% | $8,800,000 | 12.1% | $532,456 | 12.0% |
| Cambridge Atlantic | 1910 / 2021 | 24 | 100.0% | $4,312,000 | 9.4% | $6,800,000 | 9.4% | $416,509 | 9.4% |
| The HQ | 1912 / 2018 | 5 | 100.0% | $3,800,000 | 8.3% | $6,100,000 | 8.4% | $364,294 | 8.2% |
| Chocolate Factory | 1923 / 2022 | 12 | 100.0% | $3,637,000 | 7.9% | $5,900,000 | 8.1% | $349,312 | 7.9% |
| Pool Place | 1925 / 2020 | 14 | 100.0% | $2,262,000 | 4.9% | $3,900,000 | 5.4% | $218,904 | 4.9% |
| Total/Wtd. Avg. | 187 | 96.8% | $46,000,000 | 100.0% | $72,600,000 | 100.0% | $4,428,801 | 100.0% | |
| (1) | Source: Appraisals. |
| (2) | Based on the multifamily occupancy in the underwritten rent roll dated February 1, 2025. |
The Black Box Property. The Black Box Property is a 36-unit mid rise-style multifamily building with 9,000 square feet of commercial space (16.5% of total net rentable area at the Individual Mortgaged Property) located in the Harrowgate neighborhood of Philadelphia, Pennsylvania. The Black Box Property was originally constructed in 1930 as an industrial property and was redeveloped into a multifamily property in 2024 for a total redevelopment cost of approximately $15.1 million. Common amenities include a fitness center, lounge, rooftop deck and gated parking. The unit mix includes 1 one-bedroom/one-bathroom, 10 one-bedroom/1.5 bathroom and 25 two-bedroom/2.5 bathroom floorplans, with an average unit size of 1,267 square feet. The commercial portion of The Black Box Property contains 13 commercial spaces ranging in
THE INFORMATION IN THIS STRUCTURAL AND COLLATERAL TERM SHEET IS NOT COMPLETE AND MAY BE AMENDED PRIOR TO THE TIME OF SALE. THIS TERM SHEET IS NOT AN OFFER TO SELL THESE SECURITIES AND IT IS NOT A SOLICITATION OF AN OFFER TO BUY THESE SECURITIES IN ANY JURISDICTION WHERE THE OFFER OR SALE IS NOT PERMITTED. | ||
| 65 | ||
| Structural and Collateral Term Sheet | BBCMS 2025-5C34 | |
| No. 5 – GM Holdings Portfolio | ||
size from 500 to 3,000 square feet. The Black Box features 35 tenant parking spaces and 11 garage parking spaces. As of February 1, 2025, The Black Box Property was 97.2% occupied for the multifamily units and 94.4% occupied for the commercial space.
| The Black Box Property Unit Mix | ||||||||
| Unit Type | Units(1) | % of Units(1) | Occupancy(1) | Average Unit Size(1) | Average Rent Per Unit(1) | Average Rent Per SF(1) | Market Rent Per Unit(2) | Market Rent Per SF(2) |
| 1BR / 1BA | 1 | 2.8% | 100.0% | 1,599 | $1,800 | $1.13 | NAV | NAV |
| 1BR / 1.5BA | 10 | 27.8% | 100.0% | 1,133 | $2,560 | $2.26 | $2,500 | $2.11 |
| 2BR / 2.5BA | 25 | 69.4% | 96.0% | 1,308 | $2,721 | $2.08 | $2,656 | $2.04 |
| Total/Wtd. Avg. | 36 | 100.0% | 97.2% | 1,267 | $2,648 | $2.10 | $2,611 | $2.06 |
| (1) | Based on the underwritten rent roll dated February 1, 2025. |
| (2) | Source: Appraisal. |
The Glass Box Property. The Glass Box Property is a 24-unit mid rise-style multifamily building with 3,786 square feet of commercial space (13.4% of total net rentable area at the Individual Mortgaged Property) located in the Harrowgate neighborhood of Philadelphia, Pennsylvania. The Glass Box Property was built in 2021. The Glass Box Property is adjacent to the Redbrick Row Property, and the sponsor re-developed the two properties for a combined construction cost of approximately $18.9 million. Common amenities include a rooftop deck and shared access to the fitness center and courtyard at the Redbrick Row Property. The unit mix includes 24 two-bedroom/two-bathroom floorplans, with an average unit size of 1,016 square feet. The commercial portion of The Glass Box Property contains two commercial spaces which are 1,500 and 2,286 square feet. As of February 1, 2025, The Glass Box Property was 91.7% occupied for the multifamily units and 100.0% occupied for the commercial space.
| The Glass Box Property Unit Mix | ||||||||
| Unit Type | Units(1) | % of Units(1) | Occupancy(1) | Average Unit Size(1) | Average Rent Per Unit(1) | Average Rent Per SF(1) | Market Rent Per Unit(2) | Market Rent Per SF(2) |
| 2BR / 2BA | 24 | 100.0% | 91.7% | 1,016 | $2,374 | $2.35 | $2,400 | $2.36 |
| Total/Wtd. Avg. | 24 | 100.0% | 91.7% | 1,016 | $2,374 | $2.35 | $2,400 | $2.36 |
| (1) | Based on the underwritten rent roll dated February 1, 2025. |
| (2) | Source: Appraisal. |
THE INFORMATION IN THIS STRUCTURAL AND COLLATERAL TERM SHEET IS NOT COMPLETE AND MAY BE AMENDED PRIOR TO THE TIME OF SALE. THIS TERM SHEET IS NOT AN OFFER TO SELL THESE SECURITIES AND IT IS NOT A SOLICITATION OF AN OFFER TO BUY THESE SECURITIES IN ANY JURISDICTION WHERE THE OFFER OR SALE IS NOT PERMITTED. | ||
| 66 | ||
| Structural and Collateral Term Sheet | BBCMS 2025-5C34 | |
| No. 5 – GM Holdings Portfolio | ||
The Redbrick Row Property. The Redbrick Row Property is a 39-unit low rise-style multifamily building located in the Harrowgate neighborhood of Philadelphia, Pennsylvania. The Redbrick Row Property was originally constructed in 1930 as an industrial property and was redeveloped into a multifamily property in 2019. The Redbrick Row Property is adjacent to The Glass Box Property, and the borrower sponsor re-developed the two properties for a combined construction cost of approximately $18.9 million. Common amenities include a courtyard, fitness center and access to an off-site gated parking lot owned by the borrower sponsor with access provided via easement (which is not part of the collateral for the GM Holdings Portfolio Mortgage Loan). The unit mix includes 12 one-bedroom/one-bathroom, 26 one-bedroom/1.5 bathroom and 1 two-bedroom/2.5-bathroom floorplans, with an average unit size of 964 square feet. As of February 1, 2025, Redbrick Row Property was 94.9% occupied.
| Redbrick Row Property Unit Mix | ||||||||
| Unit Type | Units(1) | % of Units(1) | Occupancy(1) | Average Unit Size(1) | Average Rent Per Unit(1) | Average Rent Per SF(1) | Market Rent Per Unit(2) | Market Rent Per SF(2) |
| 1BR / 1BA | 12 | 30.8% | 91.7% | 838 | $1,661 | $1.98 | $1,675 | $2.00 |
| 1BR / 1.5BA | 26 | 66.7% | 96.2% | 1,017 | $1,944 | $1.92 | $1,950 | $1.92 |
| 2BR / 2.5BA | 1 | 2.6% | 100.0% | 1,120 | $2,000 | $1.79 | $2,200 | $1.96 |
| Total/Wtd. Avg. | 39 | 100.0% | 94.9% | 964 | $1,861 | $1.93 | $1,872 | $1.95 |
| (1) | Based on the underwritten rent roll dated February 1, 2025. |
| (2) | Source: Appraisal. |
The Frankford Avenue Lofts Property. The Frankford Avenue Lofts Property is a 33-unit low rise-style multifamily building located in the Harrowgate neighborhood of Philadelphia, Pennsylvania. The Frankford Avenue Lofts Property was originally constructed as a school in 1903 and redeveloped to its current multifamily use in 2022 by the borrower sponsor for construction costs of approximately $7.3 million. Common amenities include a lounge on each floor and an on-site gated parking lot with 40 surface parking spaces. The unit mix includes 8 one-bedroom/one-bathroom and 25 one-bedroom/1.5-bathroom floorplans, with an average unit size of 801 square feet. As of February 1, 2025, the Frankford Avenue Lofts Property was 97.0% occupied.
| Frankford Avenue Lofts Property Unit Mix | ||||||||
| Unit Type | Units(1) | % of Units(1) | Occupancy(1) | Average Unit Size(1) | Average Rent Per Unit(1) | Average Rent Per SF(1) | Market Rent Per Unit(2) | Market Rent Per SF(2) |
| 1BR / 1BA | 8 | 24.2% | 87.5% | 718 | $1,614 | $2.36 | $1,650 | $2.30 |
| 1BR / 1.5BA | 25 | 75.8% | 100.0% | 827 | $1,770 | $2.14 | $1,775 | $2.15 |
| Total/Wtd. Avg. | 33 | 100.0% | 97.0% | 801 | $1,736 | $2.19 | $1,745 | $2.19 |
| (1) | Based on the underwritten rent roll dated February 1, 2025. |
| (2) | Source: Appraisal. |
THE INFORMATION IN THIS STRUCTURAL AND COLLATERAL TERM SHEET IS NOT COMPLETE AND MAY BE AMENDED PRIOR TO THE TIME OF SALE. THIS TERM SHEET IS NOT AN OFFER TO SELL THESE SECURITIES AND IT IS NOT A SOLICITATION OF AN OFFER TO BUY THESE SECURITIES IN ANY JURISDICTION WHERE THE OFFER OR SALE IS NOT PERMITTED. | ||
| 67 | ||
| Structural and Collateral Term Sheet | BBCMS 2025-5C34 | |
| No. 5 – GM Holdings Portfolio | ||
The Cambridge Atlantic Property. The Cambridge Atlantic Property is a 24-unit low rise-style multifamily building located in the Harrowgate neighborhood of Philadelphia, Pennsylvania. The Cambridge Atlantic Property was originally constructed as an industrial building in 1910 and redeveloped to its current multifamily use in 2021 by the borrower sponsor for construction costs of approximately $5.0 million. Common amenities include a lounge area, courtyard and a gated parking lot with 28 parking spaces. The unit mix includes 24 one-bedroom/1.5-bathroom floorplans, with an average unit size of 934 square feet. As of February 1, 2025, the Cambridge Atlantic Property was 100.0% occupied.
| The Cambridge Atlantic Property Unit Mix | ||||||||
| Unit Type | Units(1) | % of Units(1) | Occupancy(1) | Average Unit Size(1) | Average Rent Per Unit(1) | Average Rent Per SF(1) | Market Rent Per Unit(2) | Market Rent Per SF(2) |
| 1BR / 1.5BA | 24 | 100.0% | 100.0% | 934 | $1,904 | $2.04 | $1,925 | $2.06 |
| Total/Wtd. Avg. | 24 | 100.0% | 100.0% | 934 | $1,904 | $2.04 | $1,925 | $2.06 |
| (1) | Based on the underwritten rent roll dated February 1, 2025. |
| (2) | Source: Appraisal. |
The HQ Property. The HQ Property is a low rise-style multifamily property with 5 units totaling 11,940 SF of multifamily space (51.2% of total net rentable area at the Individual Mortgaged Property) and 10,950 square feet of creative office space (48.8% of total net rentable area at the Individual Mortgaged Property). The HQ Property is located in the Harrowgate neighborhood of Philadelphia, Pennsylvania. The HQ Property contains five multifamily units totaling 11,490 square feet and 10,950 feet of commercial space. The HQ Property was originally constructed as an industrial building in 1912 and renovated to its current use by the borrower sponsor in 2018 with construction costs of approximately $3.2 million. The multifamily unit mix includes one one-bedroom/one-bathroom, one one-bedroom/1.5 bathroom, one two-bedroom/two-bathroom and two two-bedroom/2.5-bathroom floorplans, with an average unit size of 2,298 square feet. The commercial portion of The HQ Property contains 30 spaces ranging in size from 200 to 2,500 square feet. As of February 1, 2025, the multifamily portion of The HQ Property was 100.0% occupied and the commercial space was 97.7% occupied.
| The HQ Property Unit Mix | ||||||||
| Unit Type | Units(1) | % of Units(1) | Occupancy(1) | Average Unit Size(1) | Average Rent Per Unit(1) | Average Rent Per SF(1) | Market Rent Per Unit(2) | Market Rent Per SF(2) |
| 1BR / 1BA | 1 | 20.0% | 100.0% | 2,170 | $2,200 | $1.01 | $2,000 | $0.92 |
| 1BR / 1.5BA | 1 | 20.0% | 100.0% | 2,150 | $1,600 | $0.74 | $2,100 | $0.98 |
| 2BR / 2BA | 1 | 20.0% | 100.0% | 2,500 | $1,900 | $0.76 | $2,300 | $0.92 |
| 2BR / 2.5BA | 2 | 40.0% | 100.0% | 2,335 | $2,500 | $1.07 | $2,400 | $1.03 |
| Total/Wtd. Avg. | 5 | 100.0% | 100.0% | 2,298 | $2,140 | $0.93 | $2,240 | $0.98 |
| (1) | Based on the underwritten rent roll dated February 1, 2025. |
| (2) | Source: Appraisal. |
THE INFORMATION IN THIS STRUCTURAL AND COLLATERAL TERM SHEET IS NOT COMPLETE AND MAY BE AMENDED PRIOR TO THE TIME OF SALE. THIS TERM SHEET IS NOT AN OFFER TO SELL THESE SECURITIES AND IT IS NOT A SOLICITATION OF AN OFFER TO BUY THESE SECURITIES IN ANY JURISDICTION WHERE THE OFFER OR SALE IS NOT PERMITTED. | ||
| 68 | ||
| Structural and Collateral Term Sheet | BBCMS 2025-5C34 | |
| No. 5 – GM Holdings Portfolio | ||
The Chocolate Factory Property. The Chocolate Factory Property is a 12-unit low rise-style multifamily building with 2,850 square feet of commercial space (24.8% of total net rentable area at the Individual Mortgaged Property) located in the Harrowgate neighborhood of Philadelphia, Pennsylvania. The Chocolate Factory Property was originally constructed as an industrial building in 1923 and redeveloped to its current multifamily use in 2022 by the borrower sponsor for construction costs of approximately $4.0 million. Common amenities include an outdoor patio and a gated parking lot with 39 parking spaces. The unit mix includes 12 one-bedroom/1.5-bathroom floorplans, with an average unit size of 722 square feet. There are 16 creative office commercial spaces at the Chocolate Factory Property ranging in size from 150 to 250 square feet. As of February 1, 2025, the multifamily portion of the Chocolate Factory Property was 100.0% occupied and the commercial space was 94.7% occupied.
| The Chocolate Factory Property Unit Mix | ||||||||
| Unit Type | Units(1) | % of Units(1) | Occupancy(1) | Average Unit Size(1) | Average Rent Per Unit(1) | Average Rent Per SF(1) | Market Rent Per Unit(2) | Market Rent Per SF(2) |
| 1BR / 1.5BA | 12 | 100.0% | 100.0% | 722 | 1,883 | $2.61 | $1,875 | $2.60 |
| Total/Wtd. Avg. | 12 | 100.0% | 100.0% | 722 | 1,883 | $2.61 | $1,875 | $2.60 |
| (1) | Based on the underwritten rent roll dated February 1, 2025. |
| (2) | Source: Appraisal. |
The Pool Place Property. The Pool Place Property is a 14-unit low rise-style multifamily building located in the Harrowgate neighborhood of Philadelphia, Pennsylvania. The Pool Place Property was originally constructed as an industrial building in 1925 and redeveloped to its current multifamily use in 2020 by the borrower sponsor for construction costs of approximately $2.3 million. Common amenities include a courtyard, fitness center and gated parking lot containing 15 parking spaces. The unit mix includes 13 one-bedroom/1.5-bathroom and one one-bedroom/two-bathroom floorplans, with an average unit size of 994 square feet. As of February 1, 2025, the Pool Place Property was 100.0% occupied.
| The Pool Place Property Unit Mix | ||||||||
| Unit Type | Units(1) | % of Units(1) | Occupancy(1) | Average Unit Size(1) | Average Rent Per Unit(1) | Average Rent Per SF(1) | Market Rent Per Unit(2) | Market Rent Per SF(2) |
| 1BR / 1.5BA | 13 | 92.9% | 100.0% | 948 | $1,729 | $1.82 | $1,800 | $1.90 |
| 1BR / 2BA | 1 | 7.1% | 100.0% | 1,597 | $2,400 | $1.50 | $2,400 | $1.50 |
| Total/Wtd. Avg. | 14 | 100.0% | 100.0% | 994 | $1,777 | $1.80 | $1,843 | $1.87 |
| (1) | Based on the underwritten rent roll dated February 1, 2025. |
| (2) | Source: Appraisal. |
Environmental. According to the Phase I environmental assessments dated January 8, 2025 and January 9, 2025, there was no evidence of any recognized environmental conditions at the GM Holdings Portfolio Properties. The borrowers reserved $10,000 into an environmental reserve at loan origination for a drum removal at the Cambridge Atlantic Property that is not considered a recognized environmental condition.
THE INFORMATION IN THIS STRUCTURAL AND COLLATERAL TERM SHEET IS NOT COMPLETE AND MAY BE AMENDED PRIOR TO THE TIME OF SALE. THIS TERM SHEET IS NOT AN OFFER TO SELL THESE SECURITIES AND IT IS NOT A SOLICITATION OF AN OFFER TO BUY THESE SECURITIES IN ANY JURISDICTION WHERE THE OFFER OR SALE IS NOT PERMITTED. | ||
| 69 | ||
| Structural and Collateral Term Sheet | BBCMS 2025-5C34 | |
| No. 5 – GM Holdings Portfolio | ||
The following table presents certain information relating to the historical and current occupancy of the residential units of the GM Holdings Portfolio Properties:
| Historical and Current Occupancy(1) | ||||
| Property Name | 2022 | 2023 | 2024 | Current(2) |
| The Black Box | NAV(3) | 8.6%(3) | 100.0% | 97.2% |
| The Glass Box | 100.0% | 95.8% | 95.8% | 91.7% |
| Redbrick Row | 97.4% | 97.4% | 97.4% | 94.9% |
| Frankford Avenue Lofts | 66.7%(4) | 93.9% | 97.0% | 97.0% |
| Cambridge Atlantic | 100.0% | 95.8% | 95.8% | 100.0% |
| The HQ | 100.0% | 100.0% | 100.0% | 100.0% |
| Chocolate Factory | 91.7% | 100.0% | 100.0% | 100.0% |
| Pool Place | 100.0% | 100.0% | 100.0% | 100.0% |
| Portfolio Total | 91.4%(3)(4) | 97.0%(3) | 97.8% | 96.8% |
| (1) | Historical occupancies are as of December 31 of each respective year. |
| (2) | Current Occupancy is as of February 1, 2025. |
| (3) | The Black Box was redeveloped in 2024 and started lease up in December 2023. Portfolio Total 2022 and 2023 occupancy exclude The Black Box Property. |
| (4) | The Frankford Avenue Lofts began lease up in September 2022. |
The following table presents certain information relating to the operating history and underwritten cash flows of the GM Portfolio Properties:
| Operating History and Underwritten Net Cash Flow(1) | ||||||
| 2023(2) | 2024(2) | Underwritten | Per Unit | %(3) | ||
| Gross Potential Rent | $4,013,569 | $5,530,272 | $4,630,680 | $24,763 | 82.7 | % |
| Parking Revenue | 2,700 | 18,000 | 20,600 | 110 | 0.4 | |
| Other Income(4) | 1,250 | 15,250 | 944,889 | 5,053 | 16.9 | |
| Gross Potential Income | $4,017,519 | $5,563,522 | $5,596,169 | $29,926 | 100.0 | % |
| (Vacancy/Collection Loss) | (551,509) | (443,723) | (279,809) | (1,496) | (5.0 | ) |
| Effective Gross Income | $3,466,010 | $5,119,799 | $5,316,360 | $28,430 | 95.0 | % |
| Management Fee | $0 | $0 | $159,491 | $853 | 3.0 | % |
| Taxes | 35,593 | 36,431 | 87,321 | 467 | 1.6 | |
| Insurance | 121,464 | 161,422 | 216,966 | 1,160 | 4.1 | |
| Other Expenses(5) | 295,245 | 376,332 | 423,782 | 2,266 | 8.0 | |
| Total Expenses | $452,302 | $574,185 | $887,560 | $4,746 | 16.7 | % |
| Net Operating Income | $3,013,709 | $4,545,614 | $4,428,801 | $23,683 | 83.3 | % |
| Total TI/LC, Capex/RR | 0 | 0 | $46,750 | $250 | 0.9 | |
| Net Cash Flow | $3,013,709 | $4,545,614 | $4,382,051 | $23,433 | 82.4 | % |
| (1) | Based on the underwritten rent roll dated February 1, 2025. |
| (2) | The increase in Net Operating Income from 2023 to 2024 is due to The Black Box being redeveloped in 2024 and starting to lease up in December 2023. |
| (3) | % column represents percent of Gross Potential Income for revenue fields and represents percent of Effective Gross Income for the remaining fields. |
| (4) | Other Income consists of commercial income and other miscellaneous fees. |
| (5) | Other Expenses consists of utilities, repairs and maintenance and general and administrative expenses. |
The Markets. The GM Holdings Portfolio Properties are all located within the greater Philadelphia area, approximately five miles from Center City Philadelphia and all located within approximately 0.5 miles of each other. Public transportation is provided by Southeastern Pennsylvania Transit Authority (SEPTA) and rail lines provide quick access to Center City Philadelphia. Major employers in the immediate area include Coca Cola, several Philadelphia charter schools, Temple University Health System, St. Christopher’s Hospital for Children and Cardone Industries. Prominent employers in Center City Philadelphia include Comcast Corp (global headquarters), Aramark, Cigna and Thomas Jefferson University and Health System.
THE INFORMATION IN THIS STRUCTURAL AND COLLATERAL TERM SHEET IS NOT COMPLETE AND MAY BE AMENDED PRIOR TO THE TIME OF SALE. THIS TERM SHEET IS NOT AN OFFER TO SELL THESE SECURITIES AND IT IS NOT A SOLICITATION OF AN OFFER TO BUY THESE SECURITIES IN ANY JURISDICTION WHERE THE OFFER OR SALE IS NOT PERMITTED. | ||
| 70 | ||
| Structural and Collateral Term Sheet | BBCMS 2025-5C34 | |
| No. 5 – GM Holdings Portfolio | ||
According to the appraisal, the GM Holdings Portfolio Properties are located in the Kensington apartment submarket. As of the third quarter of 2024, the Kensington apartment submarket has an inventory of 1,963, a vacancy rate of 12.1% and average rental rates of $1,492 per unit. According to the appraisal, the third quarter 2024 vacancy and asking rents within a 1.5-mile radius of the GM Holdings Portfolio Properties were 4.6% and $1,168, respectively.
According to the appraisal, the estimated 2024 population within a 0.25-, 0.50- and one-mile radius of The Glass Box Property, the Redbrick Row Property, the Cambridge Atlantic Property and the Pool Place Property is 4,955, 18,726 and 56,318, respectively. The estimated 2024 average household income within the same radii is $43,505, $47,274 and $56,733, respectively. The estimated 2024 population within the same radii of The Black Box Property, The HQ Property and the Chocolate Factory Property is 4,254, 13,412 and 50,018, respectively. The estimated 2024 average household income within the same radii is $47,770, $55,788 and $60,185, respectively. The estimated 2024 population within the same radii of the Frankford Lofts Property is 2,435, 7,842 and 43,637, respectively. The estimated 2024 average household income within the same radii is $46,045, $43,721 and $64,332, respectively.
THE INFORMATION IN THIS STRUCTURAL AND COLLATERAL TERM SHEET IS NOT COMPLETE AND MAY BE AMENDED PRIOR TO THE TIME OF SALE. THIS TERM SHEET IS NOT AN OFFER TO SELL THESE SECURITIES AND IT IS NOT A SOLICITATION OF AN OFFER TO BUY THESE SECURITIES IN ANY JURISDICTION WHERE THE OFFER OR SALE IS NOT PERMITTED. | ||
| 71 | ||
| Structural and Collateral Term Sheet | BBCMS 2025-5C34 | |
| No. 5 – GM Holdings Portfolio | ||
The following table presents certain information relating to comparable multifamily rental properties to the GM Holdings Portfolio Properties:
| Comparable Multifamily Rental Summary(1) | |||||||
| Property Address | Year Built / Renovated | Multifamily Occupancy | # Units | Unit Mix | Average SF per Unit | Average Rent per SF | Average Rent per Unit |
|
The Black Box(2) 1810 East Venango Street Philadelphia, PA 19134 |
1930 / 2024 | 97.2% | 36 |
1BR / 1BA 1BR / 1.5BA 2BR / 2.5BA |
1,599 1,133 1,308 |
$1.13 $2.26 $2.08 |
$1,800 $2,560 $2,721 |
|
The Glass Box(2) 3460 J Street Philadelphia, PA 19134 |
2021 / NAP | 91.7% | 24 | 2BR / 2BA | 1,016 | $2.35 | $2,374 |
|
Redbrick Row(2) 3450 J Street Philadelphia, PA 19134 |
1930 / 2019 | 94.9% | 39 |
1BR / 1BA 1BR / 1.5BA 2BR / 2.5BA |
838 1,017 1,120 |
$1.98 $1.92 $1.79 |
$1,661 $1,944 $2,000 |
|
Frankford Avenue Lofts(2) 3701 Frankford Avenue Philadelphia, PA 19124 |
1903 / 2022 | 97.0% | 33 |
1BR / 1BA 1BR / 1.5BA |
718 827 |
$2.36 $2.14 |
$1,614 $1,770 |
|
Cambridge Atlantic(2) 1825 East Atlantic Street Philadelphia, PA 19134 |
1910 / 2021 | 100.0% | 24 | 1BR / 1.5BA | 934 | $2.04 | $1,904 |
|
The HQ(2) 1817 East Venango Street Philadelphia, PA 19134 |
1912 / 2018 | 100.0% | 5 |
1BR / 1BA 1BR / 1.5BA 2BR / 2BA 2BR / 2.5BA |
2,170 2,150 2,500 2,335 |
$1.01 $0.74 $0.76 $1.07 |
$2,200 $1,600 $1,900 $2,500 |
|
Chocolate Factory(2) 1849 East Venango Street Philadelphia, PA 19134 |
1923 / 2022 | 100.0% | 12 | 1BR / 1.5BA | 722 | $2.61 | $1,883 |
|
Pool Place(2) 1822 East Glenwood Avenue Philadelphia, PA 19134 |
1925 / 2020 | 100.0% | 14 |
1BR / 1.5BA 1BR / 2BA |
948 1,597 |
$1.82 $1.50 |
$1,729 $2,400 |
|
JCentrel Lofts 3400 J Street Philadelphia, PA |
1901 / NAV | 96.0% | 116 |
1BR / 1BA 1BR / 2BA 2BR / 2BA 3BR / 2BA 5BR / 3BA |
1,159 1,402 1,302 1,429 1,988 |
$1.26 $1.57 $1.49 $1.65 $2.01 |
$1,465 $2,201 $1,937 $2,362 $3,987 |
|
The PennReading 2046 East Lehigh Avenue Philadelphia, PA |
2020 / NAV | 95.0% | 21 |
1BR / 1BA 2BR / 1BA |
553 774 |
$2.49 $2.04 |
$1,378 $1,581 |
|
Hagert & York 1920 East Hagert Street Philadelphia, PA |
2023 / NAV | 71.0% | 294 |
0BR / 1BA 1BR / 1BA 2BR / 2BA |
635 796 814 |
$2.33 $2.32 $2.95 |
$1,480 $1,847 $2,404 |
|
The Palm Flats 1868 Frankford Avenue Philadelphia, PA |
2022 / NAV | 100.0% | 21 |
1BR / 1BA 2BR / 2BA |
733 1,032 |
$2.44 $2.23 |
$1,789 $2,297 |
|
2559 Amber Street 2559-77 Amber Street Philadelphia, PA |
2019 / NAV | 95.0% | 31 |
1BR / 1BA 2BR / 2BA |
700 843 |
$2.05 $2.03 |
$1,438 $1,710 |
|
The Belgrade 2636 Belgrade Street Philadelphia, PA |
2021 / NAV | 87.0% | 20 |
1BR / 1BA 2BR / 2BA |
500 745 |
$3.62 $3.42 |
$1,808 $2,545 |
| (1) | Source: Appraisals, unless otherwise indicated. |
| (2) | Information for the GM Holdings Portfolio Properties obtained from the underwritten rent roll dated February 1, 2025. |
THE INFORMATION IN THIS STRUCTURAL AND COLLATERAL TERM SHEET IS NOT COMPLETE AND MAY BE AMENDED PRIOR TO THE TIME OF SALE. THIS TERM SHEET IS NOT AN OFFER TO SELL THESE SECURITIES AND IT IS NOT A SOLICITATION OF AN OFFER TO BUY THESE SECURITIES IN ANY JURISDICTION WHERE THE OFFER OR SALE IS NOT PERMITTED. | ||
| 72 | ||
| Structural and Collateral Term Sheet | BBCMS 2025-5C34 | |
| No. 5 – GM Holdings Portfolio | ||
The Borrowers. The borrowers are 1810 Venango Street, LLC, 1817-21 E Venango Street, LLC, 1825 East Atlantic, LLC, 1849 East Venango, LLC, 3450 J Street LLC and Archer Property Development, LLC, each a Pennsylvania limited company and special purpose entity with two independent directors in its organizational structure. Legal counsel to the borrowers provided a non-consolidation opinion in connection with the origination of the GM Holdings Portfolio Mortgage Loan. The GM Holdings Portfolio Mortgage Loan will be recourse to the borrower sponsor in an amount equal to 20.0% of the GM Holdings Portfolio Mortgage Loan.
The Borrower Sponsor. The borrower sponsor and non-recourse carve-out guarantor is George Manosis, an owner, operator and developer of real estate holdings in the greater Philadelphia area. George Manosis is the president and owner of GM Holdings, LLC, a property management company focused on the Fishtown, Harrowgate, Kensington, Northern Liberties and Port Richmond neighborhoods of Philadelphia. George Manosis disclosed that he pled guilty to one account of felony bribery in 2005 due to his former plumbing business making payments to plumbing inspectors. Manosis also disclosed two prior foreclosure actions, each of which were ultimately dismissed. See “Description of the Mortgage Pool—Loan Purpose; Default History, Bankruptcy Issues and Other Proceedings” in the Preliminary Prospectus for additional information regarding the borrower sponsor.
Property Management. The GM Holdings Portfolio Properties are managed by GM Holdings, LLC, an affiliate of the borrower sponsor.
Escrows and Reserves. At origination, the borrowers were required to deposit into escrow (i) $37,500 for immediate repairs, (ii) $10,000 for an environmental reserve, (iii) approximately $36,161 for insurance premiums, and (iv) approximately $7,277 for tax reserves.
Tax Escrows – On a monthly basis, the borrowers are required to escrow 1/12th of the annual estimated tax payments, which currently is approximately $7,277.
Insurance Escrows – On a monthly basis, the borrowers are required to escrow 1/12th of the annual estimated insurance payments, which currently is approximately $18,080.
Replacement Reserves – On a monthly basis, the borrowers are required to escrow approximately $3,896 for replacement reserves ($250 per unit annually).
Lockbox / Cash Management. The GM Holdings Portfolio Mortgage Loan is structured with a springing lockbox and springing cash management. The GM Holdings Portfolio Mortgage Loan requires that upon the occurrence and during the continuance a Trigger Period (as defined below), the borrowers are required to establish and maintain a lockbox account and the property manager will be required to deposit all rents and other revenue from the GM Holdings Portfolio Properties into the lockbox account. Provided that no event of default under the GM Holdings Portfolio Mortgage Loan documents has occurred, funds held in the lockbox account will be distributed to the borrowers according to the GM Holdings Portfolio Mortgage Loan documents and if a Cash Sweep Trigger Event (as defined below) exists than all excess cash flow will be reserved into the excess cash reserve account. After the occurrence of an event of default under the GM Holdings Portfolio Mortgage Loan documents, all funds in the lockbox account will be swept by the lender on each business day and applied at the lender’s discretion.
A “Trigger Period” will commence upon the earliest of: (i) the occurrence of an event of default under the GM Holdings Portfolio Mortgage Loan documents, (ii) the date on which the debt service coverage ratio (“DSCR”) is less than 1.20x for one calendar quarter and (iii) a Cash Sweep Trigger Event (as defined below). A Trigger Period will expire upon, with respect to clause (i), the cure of such event of default, with respect to clause (ii), the DSCR being greater than or equal to 1.20x for one calendar quarter, and, with respect to clause (iii), a Cash Sweep Cure (as defined below).
A “Cash Sweep Trigger Event” will commence upon the earliest of (i) an event of default under the GM Holdings Portfolio Mortgage Loan documents, (ii) the insolvency of the borrower or manager or (iii) the DSCR being less than 1.20x for two consecutive calendar quarters. A “Cash Sweep Cure” will occur upon, with respect to clause (i), the acceptance by the lender and cure of such event of default, with respect to clause (ii), a qualified manager assuming management of the GM Holdings Portfolio Properties pursuant to a replacement management agreement and, with respect to clause (iii), the DSCR being greater than or equal to 1.25x for two consecutive calendar quarters.
Subordinate Debt and Mezzanine Debt. None.
THE INFORMATION IN THIS STRUCTURAL AND COLLATERAL TERM SHEET IS NOT COMPLETE AND MAY BE AMENDED PRIOR TO THE TIME OF SALE. THIS TERM SHEET IS NOT AN OFFER TO SELL THESE SECURITIES AND IT IS NOT A SOLICITATION OF AN OFFER TO BUY THESE SECURITIES IN ANY JURISDICTION WHERE THE OFFER OR SALE IS NOT PERMITTED. | ||
| 73 | ||
| Structural and Collateral Term Sheet | BBCMS 2025-5C34 | |
| No. 5 – GM Holdings Portfolio | ||
Permitted Future Mezzanine Debt. Not permitted.
Partial Release. At any time after the date that is the earlier of (i) three years from the date the GM Holdings Portfolio Mortgage Loan origination date, which is March 31, 2028, and (ii) two years from the closing date of the securitization that includes the last note to be securitized, the borrowers may, from time to time in one or more occurrences, obtain a release of an Individual Mortgaged Property in connection with a partial prepayment, subject to satisfaction of conditions set forth in the GM Holdings Portfolio Mortgage Loan documents including, among others: (i) no event of default has occurred and is continuing; (ii) the borrowers pay to the lender a partial release amount equal to the greater of (a) 100% of the net sales proceeds for the mortgaged property to be released or (b) 120% of the applicable allocated loan amount for the mortgaged property to be released; (iii) after giving effect to the release, (a) the DSCR is not less than the greater of the DSCR on (1) the loan origination date and (2) the date immediately prior to the release, (b) the debt yield is not less than the greater of the debt yield on (1) the loan origination date and (2) the date immediately prior to the release and (c) the loan-to-value ratio is not greater than the lesser of the loan-to-value ratio on (1) the loan origination date and (2) the date immediately prior to the release; (iv) rating agency confirmation; and (v) other conditions as set forth in the GM Holdings Portfolio Mortgage Loan documents. The partial release amount will be applied to the outstanding principal balance of the GM Holdings Portfolio Mortgage Loan.
Ground Lease. None.
THE INFORMATION IN THIS STRUCTURAL AND COLLATERAL TERM SHEET IS NOT COMPLETE AND MAY BE AMENDED PRIOR TO THE TIME OF SALE. THIS TERM SHEET IS NOT AN OFFER TO SELL THESE SECURITIES AND IT IS NOT A SOLICITATION OF AN OFFER TO BUY THESE SECURITIES IN ANY JURISDICTION WHERE THE OFFER OR SALE IS NOT PERMITTED. | ||
| 74 | ||
| Structural and Collateral Term Sheet | BBCMS 2025-5C34 | |
| No. 6 – Up House Apartments | ||
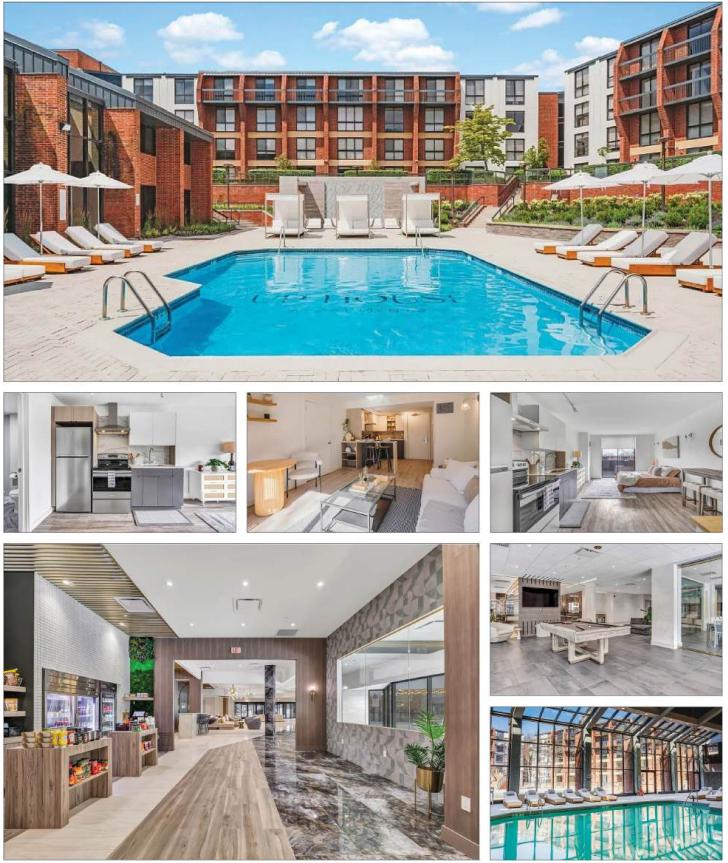
THE INFORMATION IN THIS STRUCTURAL AND COLLATERAL TERM SHEET IS NOT COMPLETE AND MAY BE AMENDED PRIOR TO THE TIME OF SALE. THIS TERM SHEET IS NOT AN OFFER TO SELL THESE SECURITIES AND IT IS NOT A SOLICITATION OF AN OFFER TO BUY THESE SECURITIES IN ANY JURISDICTION WHERE THE OFFER OR SALE IS NOT PERMITTED. | ||
| 75 | ||
| Structural and Collateral Term Sheet | BBCMS 2025-5C34 | |
| No. 6 – Up House Apartments | ||
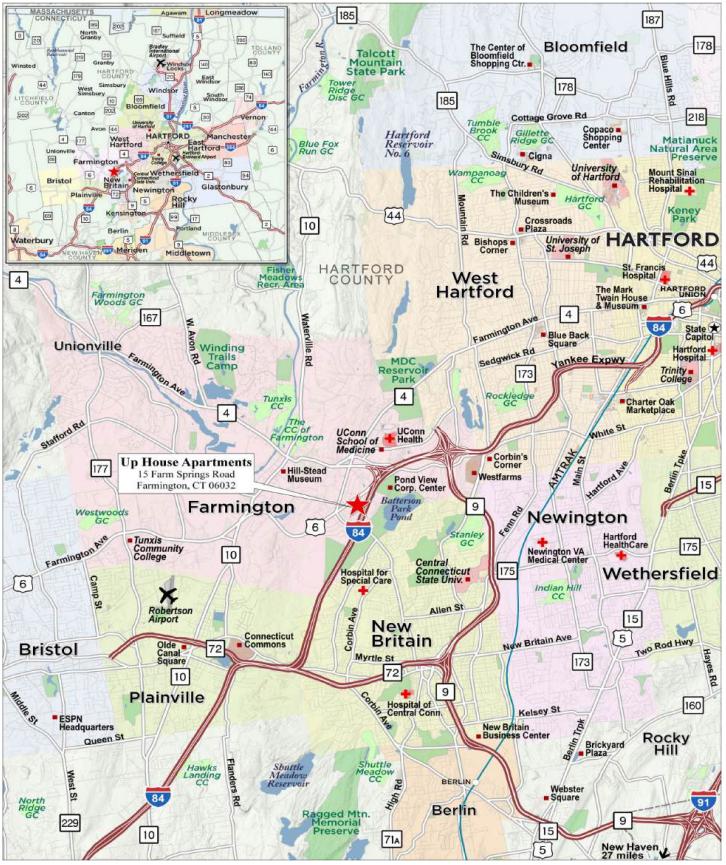
THE INFORMATION IN THIS STRUCTURAL AND COLLATERAL TERM SHEET IS NOT COMPLETE AND MAY BE AMENDED PRIOR TO THE TIME OF SALE. THIS TERM SHEET IS NOT AN OFFER TO SELL THESE SECURITIES AND IT IS NOT A SOLICITATION OF AN OFFER TO BUY THESE SECURITIES IN ANY JURISDICTION WHERE THE OFFER OR SALE IS NOT PERMITTED. | ||
| 76 | ||
| Structural and Collateral Term Sheet | BBCMS 2025-5C34 | |
| No. 6 – Up House Apartments | ||
| Mortgage Loan Information | Property Information | |||
| Mortgage Loan Seller: | Barclays | Single Asset / Portfolio: | Single Asset | |
| Original Principal Balance: | $42,500,000 | Title: | Fee | |
| Cut-off Date Principal Balance: | $42,500,000 | Property Type – Subtype: | Multifamily – Low Rise | |
| % of IPB: | 5.4% | Net Rentable Area (Units): | 221 | |
| Loan Purpose: | Refinance | Location: | Farmington, CT | |
| Borrowers: | 15 Farm Springs LP, GF 8 Farm Springs LLC and 264 Farm Springs LLC | Year Built / Renovated: | 1981 / 2023 | |
| Borrower Sponsors: | Yechezkel Landau and Shlomo Tress | Occupancy: | 95.5% | |
| Interest Rate: | 5.92000% | Occupancy Date: | 3/27/2025 | |
| Note Date: | 3/31/2025 | 4th Most Recent NOI (As of)(2): | NAV | |
| Maturity Date: | 4/6/2030 | 3rd Most Recent NOI (As of)(3): | $30,662 (12/31/2023) | |
| Interest-only Period: | 60 months | 2nd Most Recent NOI (As of)(3): | $2,267,036 (12/31/2024) | |
| Original Term: | 60 months | Most Recent NOI (As of)(3): | $2,515,093 (TTM 2/28/2025) | |
| Original Amortization Term: | None | UW Economic Occupancy: | 95.5% | |
| Amortization Type: | Interest Only | UW Revenues: | $5,843,027 | |
| Call Protection: | L(25),D(28),O(7) | UW Expenses: | $2,150,269 | |
| Lockbox / Cash Management: | Springing | UW NOI(3): | $3,692,757 | |
| Additional Debt: | Yes | UW NCF: | $3,637,286 | |
| Additional Debt Balance: | $7,500,000 | Appraised Value / Per Unit: | $71,100,000 / $321,719 | |
| Additional Debt Type: | Mezzanine | Appraisal Date: | 2/21/2025 | |
| Escrows and Reserves(1) | Financial Information | ||||||
| Initial | Monthly | Initial Cap | Mortgage Loan | Total Loan | |||
| Taxes: | $137,333 | $45,778 | N/A | Cut-off Date Loan / Unit: | $192,308 | $226,244 | |
| Insurance: | $85,481 | $12,212 | N/A | Maturity Date Loan / Unit: | $192,308 | $226,244 | |
| Replacement Reserves: | $0 | $4,623 | N/A | Cut-off Date LTV: | 59.8% | 70.3% | |
| TI/LC Reserves: | $0 | Springing | N/A | Maturity Date LTV: | 59.8% | 70.3% | |
| Deferred Maintenance: | $8,100 | $0 | N/A | UW NCF DSCR: | 1.43x | 1.05x | |
| UW NOI Debt Yield: | 8.7% | 7.4% | |||||
| Sources and Uses | ||||||||
| Sources | Proceeds | % of Total | Uses | Proceeds | % of Total | |||
| Mortgage Loan | $42,500,000 | 85.0 | % | Loan Payoff | $41,056,784 | 82.1 | % | |
| Mezzanine Loan | 7,500,000 | 15.0 | Closing Costs(4) | 4,616,510 | 9.2 | |||
| Return of Equity | 4,095,792 | 8.2 | ||||||
| Upfront Reserves | 230,914 | 0.5 | ||||||
| Total Sources | $50,000,000 | 100.0 | % | Total Uses | $50,000,000 | 100.0 | % | |
| (1) | For a full description of Escrows and Reserves, see “Escrows and Reserves” below. |
| (2) | 4th Most Recent NOI is unavailable as the Up House Apartments Property (as defined below) was being redeveloped from hotel to multifamily usage and the lease up commenced in 2023. |
| (3) | The increases in historical net operating income are attributed to the lease up of the Up House Apartments Property following its conversion from hotel to multifamily usage. The 221 units came online in various phases from February 2023 to August 2024. |
| (4) | Closing Costs include an interest rate buydown of $2,958,500. |
The Loan. The Up House Apartments mortgage loan (the “Up House Apartments Mortgage Loan”) has an outstanding principal balance as of the Cut-off Date of $42,500,000 and is secured by the borrowers’ fee interest in a low rise multifamily property located in Farmington, Connecticut (the “Up House Apartments Property”). The Up House Apartments Mortgage Loan has a five-year term, is interest-only for the full term and accrues interest at a fixed rate of 5.92000% per annum on an Actual/360 basis.
THE INFORMATION IN THIS STRUCTURAL AND COLLATERAL TERM SHEET IS NOT COMPLETE AND MAY BE AMENDED PRIOR TO THE TIME OF SALE. THIS TERM SHEET IS NOT AN OFFER TO SELL THESE SECURITIES AND IT IS NOT A SOLICITATION OF AN OFFER TO BUY THESE SECURITIES IN ANY JURISDICTION WHERE THE OFFER OR SALE IS NOT PERMITTED. | ||
| 77 | ||
| Structural and Collateral Term Sheet | BBCMS 2025-5C34 | |
| No. 6 – Up House Apartments | ||
The Up House Apartments mezzanine loan (the “Up House Apartments Mezzanine Loan”) has an outstanding principal balance of $7,500,000 as of the Cut-off Date and, together with the Up House Apartments Mortgage Loan, has an aggregate outstanding principal balance of $50,000,000 (the “Up House Apartments Total Loan”). The Up House Apartments Mezzanine Loan is coterminous with the Up House Apartments Mortgage Loan and accrues interest at a fixed rate of 12.000% per annum on an Actual/360 basis.
The Property. The Up House Apartments Property is a 221-unit, low rise multifamily property located in Farmington, Connecticut. The Up House Apartments Property was originally utilized as a hotel. Upon acquisition by the borrower sponsors in 2021, the Up House Apartments Property began its conversion from a hotel to luxury multifamily property. The borrower sponsors reported a total cost basis of $52.9 million which includes the acquisition price of approximately $23.8 million and approximately $17 million invested by the borrower sponsors on the conversion from hotel to multifamily. There were various phases involved in the redevelopment of the Up House Apartments Property with the first group of units coming online in February 2023 and the final units coming online in August 2024.
The Up House Apartments Property consists of one one-story building and one three-story building. Units feature finishes with granite countertops, stainless steel appliances, vinyl plan flooring and tile in kitchen and living areas and in-unit laundry. Community amenities include heated indoor and outdoor pools, fitness center, Peloton room, yoga studio, wellness center, business center, clubhouse, dog park, electric vehicle charging station and a golf simulator. There is a subterranean parking garage with 100 parking spaces in addition to 412 surface parking spaces. The Up House Apartments Property also includes a 6,000 square foot restaurant and bar, leased through November 2028, and a 7,500 square feet of indoor recreation space which is leased to a third party, through November 2026, and utilizes the space for pickleball and indoor soccer. As of March 27, 2025, the Up House Apartments Property was 95.5% occupied.
The following table presents certain information relating to the historical and current occupancy of the Up House Apartments Property:
| Historical and Current Occupancy | ||
| 2023(1)(2)(3) | 2024(1)(2) | Current(4) |
| 65.6% | 78.3% | 95.5% |
| (1) | Historical Occupancy represents the average occupancy of each respective year. |
| (2) | 2023 and 2024 occupancy were lower as the Up House Apartments Property was being redeveloped from hotel to multifamily usage. |
| (3) | 2023 occupancy takes into account 11 months as the lease up of the Up House Property commenced in February 2023. |
| (4) | Current occupancy is based on the underwritten rent roll dated as of March 27, 2025. |
The following table presents certain information relating to the lease up of the Up House Apartments Property:
| Up House Apartments Lease Up (2023)(1) | |||||||||||
| Year | ‘23 | ‘23 | ‘23 | ‘23 | ‘23 | ‘23 | ‘23 | ‘23 | ‘23 | ‘23 | ‘23 |
| Month | Feb | Mar | Apr | May | Jun | Jul | Aug | Sep | Oct | Nov | Dec |
| Available | 52 | 52 | 52 | 92 | 92 | 92 | 148 | 148 | 148 | 148 | 148 |
| Leased | 9 | 21 | 28 | 42 | 66 | 87 | 102 | 114 | 125 | 124 | 125 |
| Occ. | 17.3% | 40.4% | 53.8% | 45.7% | 71.7% | 94.6% | 68.9% | 77.0% | 84.5% | 83.8% | 84.5% |
| (1) | Sourced from information provided by the borrower sponsors. |
| Up House Apartments Lease Up (2024 - Present)(1) | |||||||||||||
| Year | ‘24 | ‘24 | ‘24 | ‘24 | ‘24 | ‘24 | ‘24 | ‘24 | ‘24 | ‘24 | ‘24 | ‘24 | ‘25 |
| Month | Jan | Feb | Mar | Apr | May | Jun | Jul | Aug | Sep | Oct | Nov | Dec | Jan |
| Available | 154 | 154 | 183 | 183 | 210 | 210 | 210 | 210 | 221 | 221 | 221 | 221 | 221 |
| Leased | 124 | 124 | 128 | 131 | 143 | 154 | 157 | 172 | 182 | 182 | 192 | 193 | 200 |
| Occ. | 80.5% | 80.5% | 69.9% | 71.6% | 68.1% | 73.3% | 74.8% | 81.9% | 82.4% | 82.4% | 86.9% | 87.3% | 90.5% |
| (1) | Sourced from information provided by the borrower sponsors. |
THE INFORMATION IN THIS STRUCTURAL AND COLLATERAL TERM SHEET IS NOT COMPLETE AND MAY BE AMENDED PRIOR TO THE TIME OF SALE. THIS TERM SHEET IS NOT AN OFFER TO SELL THESE SECURITIES AND IT IS NOT A SOLICITATION OF AN OFFER TO BUY THESE SECURITIES IN ANY JURISDICTION WHERE THE OFFER OR SALE IS NOT PERMITTED. | ||
| 78 | ||
| Structural and Collateral Term Sheet | BBCMS 2025-5C34 | |
| No. 6 – Up House Apartments | ||
The following table presents detailed information with respect to the units at the Up House Apartments Property:
| Unit Summary(1) | ||||||||||
| Unit Type | No. of Units | % of Total | Occupied Units | Occupancy % | Average Unit Size (SF) | Average Monthly Rental Rate | Average Monthly Rental Rate per SF | Average Monthly Market Rental Rate(2) | Average Monthly Market Rental Rate per SF(2) | |
| Studio | 42 | 19.0 | % | 42 | 100.0% | 352 | $1,569 | $4.46 | $1,600 | $4.55 |
| 1 BR / 1BA | 164 | 74.2 | % | 154 | 93.9% | 630 | $2,175 | $3.45 | $2,100 | $3.26 |
| 2 BR / 2BA | 15 | 6.8 | % | 15 | 100.0% | 909 | $3,044 | $3.35 | $2,900 | $3.63 |
| Total/Wtd. Avg. | 221 | 100.0 | % | 211 | 95.5% | 596 | $2,116 | $3.55 | $2,057 | $3.54 |
| (1) | Based on the underwritten rent roll as of March 27, 2025, unless otherwise indicated. |
| (2) | Source: Appraisal. |
The following table presents certain information relating to the operating history and underwritten cash flows of the Up House Apartments Property:
| Operating History and Underwritten Net Cash Flow | |||||||
| 2023(1) | 2024(1) | TTM(1)(2) | Underwritten | Per Unit | %(3) | ||
| Gross Potential Rent | $2,895,609 | $4,964,542 | $5,193,090 | $5,300,016 | $23,982 | 86.7 | % |
| Reimbursements | 157,246 | 346,099 | 367,670 | 462,600 | 2,093 | 7.6 | |
| Other Income | 76,335 | 245,440 | 275,512 | 353,612 | 1,600 | 5.8 | |
| Net Rental Income | $3,129,190 | $5,556,081 | $5,836,272 | $6,116,228 | $27,675 | 100.0 | % |
| (Vacancy/Credit Loss) | (1,412,977) | (1,336,161) | (1,266,389) | (273,201) | (1,236) | (4.5 | ) |
| Effective Gross Income | $1,716,213 | $4,219,920 | $4,569,883 | $5,843,027 | $26,439 | 95.5 | % |
| Taxes | 487,301 | 497,154 | 515,880 | 553,334 | 2,504 | 9.5 | |
| Insurance | 80,627 | 115,720 | 126,706 | 146,538 | 663 | 2.5 | |
| Utilities | 584,857 | 596,095 | 645,881 | 645,881 | 2,923 | 11.1 | |
| Total Expenses | $1,685,551 | $1,952,884 | $2,054,789 | $2,150,269 | $9,730 | 36.8 | % |
| Net Operating Income | $30,662 | $2,267,036 | $2,515,093 | $3,692,757 | $16,709 | 63.2 | % |
| Capex | 0 | 0 | 0 | 55,471 | 251 | 0.9 | |
| Net Cash Flow | $30,662 | $2,267,036 | $2,515,093 | $3,637,286 | $16,458 | 62.3 | % |
| (1) | The increases throughout historical Net Operating Income are attributed to the lease up of the Up House Apartments Property following its conversion from hotel to multifamily usage. The first 52 units came online in February 2023 with all units coming online in August 2024. The Up House Apartments Property is now 95.5% occupied based on the rent roll as of March 27, 2025. |
| (2) | TTM represents the trailing 12-month period ending February 28, 2025. |
| (3) | % column represents percent of Net Rental Income for revenue fields and of Effective Gross Income for the remaining fields. |
Environmental. According to the Phase I environmental assessment dated February 25, 2025, there was no evidence of any recognized environmental conditions at the Up House Apartments Property.
The Market. The Up House Apartments Property is located in Farmington, Connecticut within the Hartford multifamily market. Hartford features a strong insurance and financial center base with a manufacturing sector that includes several Fortune 500 companies such as Barnes Group and United Technologies Corporation. According to the appraisal, Hartford is also recognized as one United States’ regions with the best telecommunication infrastructure, which has been a factor in attracting large data processing and telecommunications business to the city. The Up House Apartments Property is located 11.7 miles from downtown Hartford, which is an approximately 20-minute drive, and is located approximately 20 miles south of Bradley International Airport. Additionally, both New York City and Boston are two-hour car rides from the Up House Apartments Property.
According to the appraisal, as of the end of 2024, the Hartford multifamily market had an inventory of 46,629 units, a vacancy rate of 3.3% and asking rent per unit of $1,540. The Up House Apartments Property is part of the North/West Hartford multifamily submarket, which had an inventory of 8,705 units, a vacancy rate of 1.8% and asking rent per unit of $1,707 as
THE INFORMATION IN THIS STRUCTURAL AND COLLATERAL TERM SHEET IS NOT COMPLETE AND MAY BE AMENDED PRIOR TO THE TIME OF SALE. THIS TERM SHEET IS NOT AN OFFER TO SELL THESE SECURITIES AND IT IS NOT A SOLICITATION OF AN OFFER TO BUY THESE SECURITIES IN ANY JURISDICTION WHERE THE OFFER OR SALE IS NOT PERMITTED. | ||
| 79 | ||
| Structural and Collateral Term Sheet | BBCMS 2025-5C34 | |
| No. 6 – Up House Apartments | ||
of the end of 2024. Asking rents for both the market and submarket each have a compounded annual growth rate of 3.4% since 2015. The market and submarket have both demonstrated declining vacancy rates since 2015 with both the market and submarket being at their lowest vacancy rates in the past decade.
The 2024 population within a one-, three- and five-mile radius from the Up House Apartments Property is 3,806, 59,463 and 173,606, respectively. The 2024 average household income within the same radii is $151,902, $108,038 and $119,726, respectively.
The following table presents certain information relating to comparable multifamily rental properties to the Up House Apartments Property:
| Competitive Rental Summary(1) | |||||||
| Property Name / Property Address | Year Built / Renovated | Occupancy | # of Units | Unit Mix | Average SF per Unit | Average Rent per SF | Average Rent per Unit |
|
Up House Apartments(2) 15 Farm Springs Road Farmington, CT |
1981 / 2023 | 95.5% | 221 |
Studio / 1 BA 1 BR / 1 BA 2 BR / 2 BA |
352 630 909 |
$4.46 $3.45 $3.35 |
$1,569 $2,175 $3,044 |
|
The Residences at 299 299 Colt Highway Farmington, CT |
2014 / NAP | 98.0% | 120 |
1 BR / 1 BA 2 BR / 2 BA |
859 1,268 |
$2.86 $2.55 |
$2,460 $3,230 |
|
The Brit 267 Main Street New Britain, CT |
2024 / NAP | 30.0% | 107 |
Studio / 1 BA 1 BR / 1 BA 2 BR / 2 BA |
502 704 1,016 |
$3.36 $3.06 $2.75 |
$1,686 $2,157 $2,797 |
|
Bishops Place 2432 Albany Avenue Hartford, CT |
2016 / NAP | 95.0% | 64 |
Studio / 1 BA 1 BR / 1 BA 2 BR / 2 BA |
521 840 1,203 |
$3.76 $3.05 $2.48 |
$1,960 $2,560 $2,985 |
|
Heirloom Flats 700 Bloomfield Avenue Bloomfield, CT |
2017 / NAP | 96.0% | 215 |
Studio / 1BA 1BR / 1BA 2BR / 2BA 3BR / 2BA |
567 756 1,054 1,523 |
$3.40 $2.94 $2.62 $2.13 |
$1,929 $2,221 $2,764 $3,246 |
|
One Park 1 Park Road West Hartford, CT |
2023 / NAP | 91.0% | 292 |
Studio / 1BA 1 BR / 1 BA 2 BR / 2 BA 3 BR / 2 BA |
500 804 1,178 1,300 |
$4.05 $3.20 $3.03 $3.22 |
$2,025 $2,575 $3,565 $4,191 |
| (1) | Source: Appraisal, unless otherwise indicated. |
| (2) | Occupancy, Average SF per Unit, Average Rent per SF and Average Rent per Unit for the Up House Apartments Property are based on the underwritten rent roll as of March 27, 2025. |
The Borrowers. The borrowers are 15 Farm Springs LP, GF 8 Farm Springs LLC and 264 Farm Springs LLC, each a Delaware limited partnership or limited liability company and special purpose entity with one independent director. Legal counsel to each of the borrowers provided a non-consolidation opinion in connection with the origination of the Up House Apartments Mortgage Loan.
The Borrower Sponsors. The borrower sponsors and non-recourse carveout guarantors are Shlomo Tress (“Tress”) and Yechezkel Landau (“Landau”). Tress and Landau are both principals of CSRE Group which was founded in 2004. The CSRE Group is a real estate acquisition and management company with a portfolio comprised of over 3,500 multifamily units and over $200 million of assets under management.
Property Management. The Up House Apartments Property is managed by CS Acquisition Group LLC d/b/a CS Management, an affiliate of the borrower sponsors.
THE INFORMATION IN THIS STRUCTURAL AND COLLATERAL TERM SHEET IS NOT COMPLETE AND MAY BE AMENDED PRIOR TO THE TIME OF SALE. THIS TERM SHEET IS NOT AN OFFER TO SELL THESE SECURITIES AND IT IS NOT A SOLICITATION OF AN OFFER TO BUY THESE SECURITIES IN ANY JURISDICTION WHERE THE OFFER OR SALE IS NOT PERMITTED. | ||
| 80 | ||
| Structural and Collateral Term Sheet | BBCMS 2025-5C34 | |
| No. 6 – Up House Apartments | ||
Escrows and Reserves. At origination, the borrowers were required to deposit into escrow $137,333 for taxes, approximately $85,481 for insurance premiums and $8,100 for deferred maintenance.
Tax Escrows – The borrowers are required to escrow 1/12th of the annual estimated tax payments on a monthly basis, which currently equates to approximately $45,778.
Insurance Escrows – The borrowers are required to escrow 1/12th of the annual estimated insurance premiums on a monthly basis, which currently equates to approximately $12,212.
Replacement Reserves – The borrowers are required to escrow approximately $4,623 on a monthly basis for replacement reserves ($251 per unit annually).
TI/LC Reserves – During an event of default the borrowers will be required to escrow approximately $563 on a monthly basis for tenant improvements and leasing commissions.
Lockbox / Cash Management. The Up House Apartments Mortgage Loan is structured with a springing lockbox and springing cash management. Upon the occurrence of a Trigger Period (as defined below), the borrowers are required to establish a lockbox account and cause all rents received by the property manager with respect to the Up House Apartments Property to be deposited into such lockbox account within one business day of receipt. Upon and during the continuance of a Trigger Period, all funds in the lockbox account are required to be swept on each business day into a lender-controlled cash management account and applied and disbursed in accordance with the Up House Apartments Mortgage Loan documents. In lieu of a cash flow sweep, in the event of a Low DSCR Event (as defined below), fixed monthly deposits of approximately $14,571 will be required, which represents the difference between a 1.05x NCF DSCR (as defined below) and a 1.00x NCF DSCR.
A “Low DSCR Event” means any period commencing on the last day of any calendar quarter during with the NCF DSCR for the Up House Apartments Property is less than 1.00x and ending on the last day of any two consecutive calendar quarters thereafter for each of which the NCF DSCR is greater than or equal to 1.05x.
A “Trigger Period” will commence upon the earliest of the following: (i) the occurrence of an event of default or a mezzanine loan event of default, which will continue until such event of default is cured, (ii) the occurrence of any bankruptcy action of the borrower, which will not be cured and (iii) a Low DSCR Event.
“NCF DSCR” means the net cash flow debt service coverage ratio based on the aggregate annual debt service of the Up House Apartments Total Loan.
Subordinate Debt and Mezzanine Debt. The Up House Apartments Mezzanine Loan has an outstanding principal balance of $7,500,000 as of the Cut-off date, accrues interest at a rate of 12.000% and is coterminous with the Up House Apartments Mortgage Loan. The Up House Apartments Mezzanine Loan is secured by the borrower sponsors’ direct equity interests in the borrowers and is interest-only for the entire term. The Up House Apartments Mezzanine Loan was sold to Axonic Alternative Income Fund on April 3, 2025.
Permitted Future Mezzanine Debt. Not permitted.
Partial Release. Not permitted.
Ground Lease. None.
THE INFORMATION IN THIS STRUCTURAL AND COLLATERAL TERM SHEET IS NOT COMPLETE AND MAY BE AMENDED PRIOR TO THE TIME OF SALE. THIS TERM SHEET IS NOT AN OFFER TO SELL THESE SECURITIES AND IT IS NOT A SOLICITATION OF AN OFFER TO BUY THESE SECURITIES IN ANY JURISDICTION WHERE THE OFFER OR SALE IS NOT PERMITTED. | ||
| 81 | ||
| Structural and Collateral Term Sheet | BBCMS 2025-5C34 | |
| No. 7 – Aladdin Airport Parking | ||
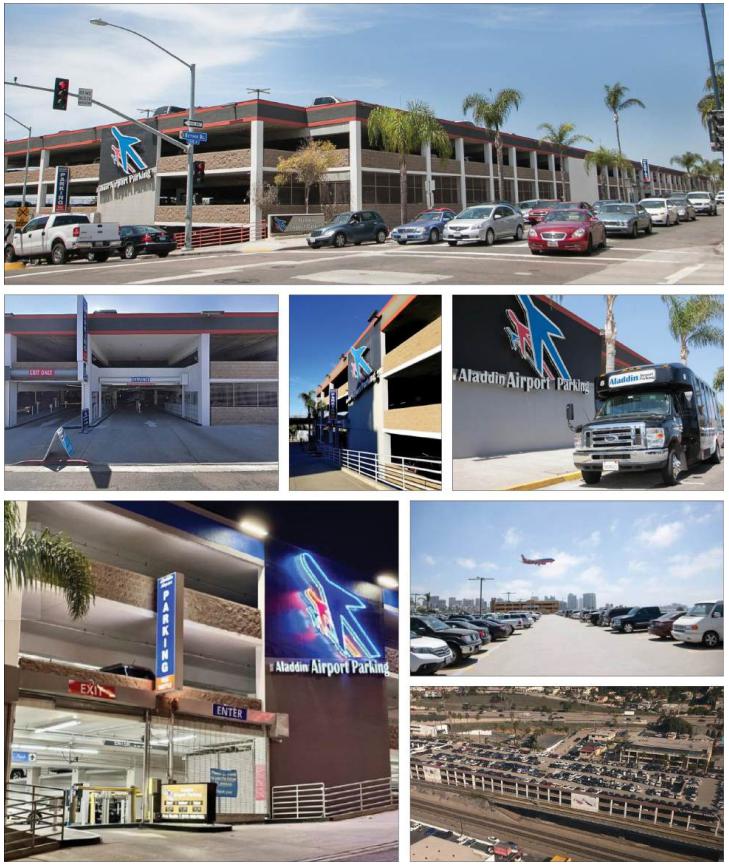
THE INFORMATION IN THIS STRUCTURAL AND COLLATERAL TERM SHEET IS NOT COMPLETE AND MAY BE AMENDED PRIOR TO THE TIME OF SALE. THIS TERM SHEET IS NOT AN OFFER TO SELL THESE SECURITIES AND IT IS NOT A SOLICITATION OF AN OFFER TO BUY THESE SECURITIES IN ANY JURISDICTION WHERE THE OFFER OR SALE IS NOT PERMITTED. | ||
| 82 | ||
| Structural and Collateral Term Sheet | BBCMS 2025-5C34 | |
| No. 7 – Aladdin Airport Parking | ||
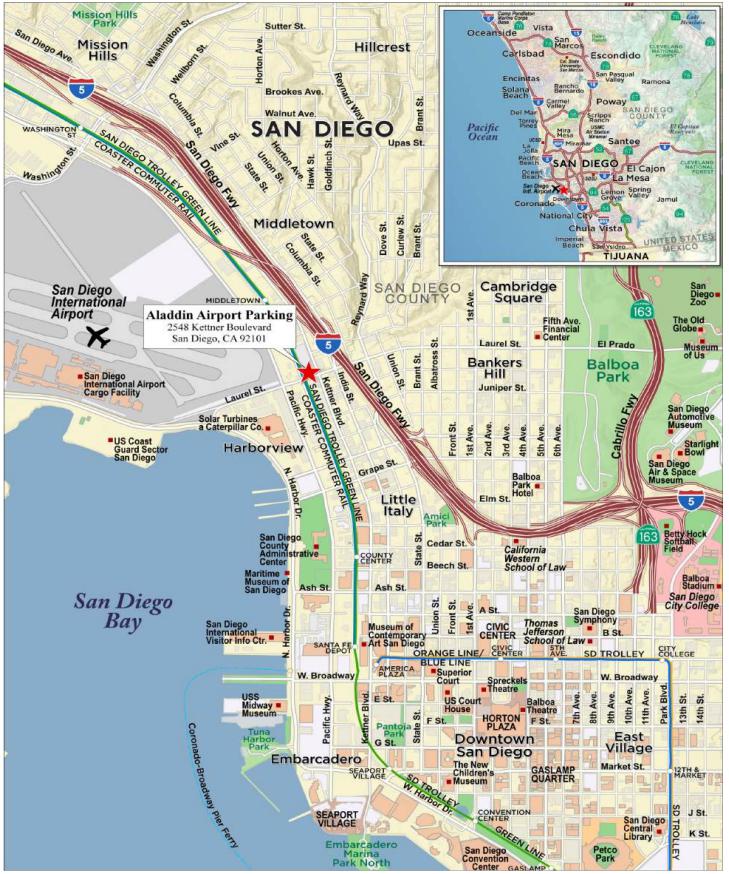
THE INFORMATION IN THIS STRUCTURAL AND COLLATERAL TERM SHEET IS NOT COMPLETE AND MAY BE AMENDED PRIOR TO THE TIME OF SALE. THIS TERM SHEET IS NOT AN OFFER TO SELL THESE SECURITIES AND IT IS NOT A SOLICITATION OF AN OFFER TO BUY THESE SECURITIES IN ANY JURISDICTION WHERE THE OFFER OR SALE IS NOT PERMITTED. | ||
| 83 | ||
| Structural and Collateral Term Sheet | BBCMS 2025-5C34 | |
| No. 7 – Aladdin Airport Parking | ||
| Mortgage Loan Information | Property Information | |||
| Mortgage Loan Seller: | Barclays | Single Asset / Portfolio: | Single Asset | |
| Original Principal Balance: | $40,000,000 | Title: | Fee | |
| Cut-off Date Principal Balance: | $40,000,000 | Property Type – Subtype: | Other – Parking Garage | |
| % of IPB: | 5.1% | Spaces: | 2,300 | |
| Loan Purpose: | Refinance | Location: | San Diego, CA | |
| Borrowers: | Aladdin Parking, L.P. and Aladdin Airport Parking LLC | Year Built / Renovated: | 1987 / 2012 | |
| Borrower Sponsors(1): | Various | Occupancy: | NAP | |
| Interest Rate: | 6.84500% | Occupancy Date: | NAP | |
| Note Date: | 4/1/2025 | 4th Most Recent NOI (As of): | NAV | |
| Maturity Date: | 4/6/2030 | 3rd Most Recent NOI (As of)(3): | $7,074,806 (12/31/2022) | |
| Interest-only Period: | 60 months | 2nd Most Recent NOI (As of)(3): | $7,517,556 (12/31/2023) | |
| Original Term: | 60 months | Most Recent NOI (As of)(3): | $6,492,138 (12/31/2024) | |
| Original Amortization Term: | None | UW Economic Occupancy: | 62.3% | |
| Amortization Type: | Interest Only | UW Revenues: | $11,556,220 | |
| Call Protection: | L(25),D(28),O(7) | UW Expenses: | $5,151,234 | |
| Lockbox / Cash Management: | Soft / Springing | UW NOI: | $6,404,986 | |
| Additional Debt: | No | UW NCF: | $6,347,486 | |
| Additional Debt Balance: | N/A | Appraised Value / Per Space: | $95,300,000 / $41,435 | |
| Additional Debt Type: | N/A | Appraisal Date: | 3/8/2025 | |
| Escrows and Reserves(2) | Financial Information | |||||
| Initial | Monthly | Cap | Cut-off Date Loan / Space: | $17,391 | ||
| Taxes: | $36,833 | $36,833 | N/A | Maturity Date Loan / Space: | $17,391 | |
| Insurance: | $65,063 | $13,013 | N/A | Cut-off Date LTV: | 42.0% | |
| Replacement Reserves: | $0 | $4,792 | N/A | Maturity Date LTV: | 42.0% | |
| Required Repairs: | $9,375 | $0 | N/A | UW NCF DSCR: | 2.29x | |
| Low Debt Yield Reserve: | $0 | Springing | N/A | UW NOI Debt Yield: | 16.0% | |
| Sources and Uses | ||||||||
| Sources | Proceeds | % of Total | Uses | Proceeds | % of Total | |||
| Mortgage Loan | $40,000,000 | 97.6 | % | Loan Payoff(4) | $40,281,384 | 98.3 | % | |
| Borrower Sponsor Equity | 992,636 | 2.4 | Closing Costs | 599,982 | 1.5 | |||
| Upfront Reserves | 111,271 | 0.3 | ||||||
| Total Sources | $40,992,636 | 100.0 | % | Total Uses | $40,992,636 | 100.0 | % | |
| (1) | The Borrower Sponsors are Administrative Trust Under the Anthony Vincent Zehenni Trust, dated December 8, 1982, Non-Exempt Trust for the Benefit of Jennifer Lynn Zehenni Under the Anthony Vincent Zehenni Trust, dated December 8, 1982, as amended and Non-Exempt Trust for the Benefit of Anthony Vincent Zehenni, Jr. Under the Anthony Vincent Zehenni Trust dated December 8, 1982, as amended. |
| (2) | For a full description of Escrows and Reserves, see “Escrows and Reserves” below. |
| (3) | 3rd Most Recent NOI and 2nd Most Recent NOI were higher than Most Recent NOI due to onsite parking in Terminal 1 of the San Diego Airport being taken offline for construction from November 2021 to August 2024 which benefited the Aladdin Airport Parking Property. Additionally, one of the demand drivers at the Aladdin Airport Parking Property is cruise ship passenger parking, and San Diego cruise ship volume was down to approximately 265,000 passengers for the 2024-2025 season from approximately 531,000 passengers in the 2022-2023 season. |
| (4) | Loan Payoff includes a $5,000,000 payoff which consists of principal and interest payments made by the borrower sponsors from December 2024 through March 2025. |
The Loan. The Aladdin Airport Parking mortgage loan (the “Aladdin Airport Parking Mortgage Loan”) has an outstanding principal balance as of the Cut-off Date of $40,000,000 and is secured by the borrowers’ fee interest in a 2,300-space parking garage located in San Diego, California (the “Aladdin Airport Parking Property”). The Aladdin Airport Parking Mortgage Loan has a 5-year term, is interest-only for the entire term and accrues interest at a rate of 6.84500% per annum on an Actual/360 basis.
THE INFORMATION IN THIS STRUCTURAL AND COLLATERAL TERM SHEET IS NOT COMPLETE AND MAY BE AMENDED PRIOR TO THE TIME OF SALE. THIS TERM SHEET IS NOT AN OFFER TO SELL THESE SECURITIES AND IT IS NOT A SOLICITATION OF AN OFFER TO BUY THESE SECURITIES IN ANY JURISDICTION WHERE THE OFFER OR SALE IS NOT PERMITTED. | ||
| 84 | ||
| Structural and Collateral Term Sheet | BBCMS 2025-5C34 | |
| No. 7 – Aladdin Airport Parking | ||
The Property. The Aladdin Airport Parking Property is a five-story parking garage structure consisting of 2,300 parking spaces located in San Diego, California, immediately west of the San Diego Airport and approximately 0.5 miles from the Port of San Diego. The Aladdin Airport Parking Property was first constructed in 1987 and was substantially renovated in 2012, resulting in an additional 502 parking spaces, and expanding the building area by 154,858 square feet across a total 2.88 acres of land. In 2014, San Diego revised its parking standards, reducing the minimum stall depth from 22 feet to 20 feet. The updated regulations allowed ownership to restripe the parking spots to maximize efficiency in the space, increasing the total parking spots at the time from 2,044 to its current 2,300 parking spaces, 38 of which are dedicated to electric vehicle parking. The Aladdin Airport Parking Property also offers charging stations for electric vehicles.
The Aladdin Airport Parking Property offers a number of services, including automated parking services, on-site valet, shuttle services, and car washing. The parking garage and complimentary shuttle services are accessible 24/7, with shuttles running to and from the Aladdin Airport Parking Property and the San Diego Airport every 10-15 minutes. Additionally, the Aladdin Airport Parking Property offers 24/7 shuttle service to the Port of San Diego, which is a departure hub for cruise ships. The 5 Freeway is located immediately east of the Aladdin Airport Parking Property with several access points nearby, giving the property good local and regional access.
The following table presents certain information relating to the operating history and underwritten cash flows of the Aladdin Airport Parking Property:
| Operating History and Underwritten Net Cash Flow | ||||||
| 2022(1) | 2023(1) | 2024 | Underwritten | Per Space | %(2) | |
| Total Leased Rent | $11,109,016 | $12,226,724 | $11,556,220 | $11,556,220 | $5,024 | 62.3% |
| Vacancy Gross Up | 0 | 0 | 0 | 6,993,090 | $3,040 | 37.7% |
| Gross Potential Rental Income | $11,109,016 | $12,226,724 | $11,556,220 | $18,549,310 | $8,065 | 100.0% |
| Less: Vacancy Gross Up | 0 | 0 | 0 | 6,993,090 | $3,040 | 37.7% |
| Effective Gross Income | $11,109,016 | $12,226,724 | $11,556,220 | $11,556,220 | $5,024 | 62.3% |
| Repairs and Maintenance | $164,852 | $428 | $13,863 | $13,863 | $6 | 0.1% |
| Real Estate Taxes | 407,214 | 414,118 | 424,410 | 460,000 | $200 | 4.0% |
| Insurance | 83,107 | 103,564 | 100,704 | 156,150 | $68 | 1.4% |
| Other Expenses(3) | 3,379,038 | 4,191,059 | 4,525,105 | 4,521,220 | $1,966 | 39.1% |
| Total Expenses | $4,034,210 | $4,709,168 | $5,064,082 | $5,151,234 | $2,240 | 44.6% |
| Net Operating Income | $7,074,806 | $7,517,556 | $6,492,138 | $6,404,986 | $2,785 | 55.4% |
| Replacement Reserves | 0 | 0 | 0 | 57,500 | $25 | 0.5% |
| Net Cash Flow | $7,074,806 | $7,517,556 | $6,492,138 | $6,347,486 | $2,760 | 54.9% |
| (1) | 2022 and 2023 Net Operating Income were higher than Most Recent NOI due to onsite parking in Terminal 1 of the San Diego Airport being taken offline for construction from November 2021 to August 2024. Additionally, one of the demand drivers at the Aladdin Airport Parking Property is cruise ship passenger parking, and San Diego cruise ship volume was down to approximately 265,000 passengers for the 2024-2025 season from approximately 531,000 passengers in the 2022-2023 season. |
| (2) | % column represents the percent of Gross Potential Rental Income for revenue lines and the percent of Effective Gross Income for all remaining fields. |
| (3) | Other expenses include management fee, repairs and maintenance and parking expenses. |
Environmental. According to the Phase I environmental report dated December 11, 2024, there was no evidence of recognized environmental conditions at the Aladdin Airport Parking Property.
The Market. The Aladdin Airport Parking Property is located in San Diego, California within the San Diego-Chula Vista-Carlsbad MSA (“San Diego MSA”). The San Diego Airport is located immediately west of the subject property, which is situated 2.6 miles northwest of downtown San Diego. The San Diego Airport is the third busiest airport in California in terms of passenger traffic and reported its busiest year ever for 2024 with over 25 million passengers traveling through the airport’s terminals. The increase in passenger traffic at the San Diego Airport can be attributed to expansion to both the airport’s facilities as well as its flight options, which during the last year added two new airlines and services to new nonstop destinations. Additionally, the San Diego Airport’s Terminal 1 is going through substantial renovation and will open in two phases. The first phase includes the construction of a 19-gate terminal directly east of the existing terminal and 2,834 new parking spaces, which are scheduled to open by the end of summer 2025. Subsequently, the existing terminal will be demolished with plans to build 11 new gates in its place. The second phase is projected to be completed in 2028 and is expected to include 2,396 additional spaces.
THE INFORMATION IN THIS STRUCTURAL AND COLLATERAL TERM SHEET IS NOT COMPLETE AND MAY BE AMENDED PRIOR TO THE TIME OF SALE. THIS TERM SHEET IS NOT AN OFFER TO SELL THESE SECURITIES AND IT IS NOT A SOLICITATION OF AN OFFER TO BUY THESE SECURITIES IN ANY JURISDICTION WHERE THE OFFER OR SALE IS NOT PERMITTED. | ||
| 85 | ||
| Structural and Collateral Term Sheet | BBCMS 2025-5C34 | |
| No. 7 – Aladdin Airport Parking | ||
The Aladdin Airport Parking Property is located approximately 0.5 miles from the Port of San Diego, offering 24/7 shuttle service from the garage. Following a low traffic 2024-2025 cruise season of 265,000 passengers, traffic is anticipated to increase for the 2025-2026 cruise season. Most recently, Norwegian Cruise Line and Royal Caribbean announced they would each be adding San Diego as a home port starting in the 2025-2026 and 2026-2027 cruise seasons, respectively. The Port of San Diego projects 389,000 passengers for the 2025-2026 cruise season and 615,000 cruise passengers for the 2026-2027 season.
According to the appraisal, the estimated 2024 population within a one-, three- and five-mile radius of the Aladdin Airport Parking Property was 25,335, 193,144 and 456,032, respectively, and the 2024 average household income within the same radii was $150,110, $133,873 and $128,028, respectively. The appraisal also reported that median age in the San Diego MSA as of 2024 was 38, with its largest population group in the 20-29 range and the smallest population in the 80+ range, which could indicate the younger population may be more likely to drive and travel by plane. Economic and demographic trends in the surrounding area, as well as the increasingly high volume of passenger traffic at the San Diego Airport, indicates that travel trends and airport parking demand are likely to remain prominent in the San Diego MSA.
The following table presents certain passenger volume information with respect to the San Diego Airport:
| Yearly 12-Month Passenger Traffic(1) | |||||||
| 2018 | 2019 | 2020 | 2021 | 2022 | 2023 | 2024 | |
| Domestic | 23,196,417 | 24,163,175 | 8,991,533 | 15,392,406 | 22,353,392 | 22,809,584 | 24,240,208 |
| International | 1,044,447 | 1,053,772 | 247,349 | 21,099 | 879,575 | 897,525 | 1,002,169 |
| Total Passengers | 24,240,864 | 25,216,947 | 9,238,882 | 15,413,505 | 23,232,967 | 23,707,109 | 25,242,377 |
| % Change / Year | N/A | 4.0% | (63.4%) | 66.8% | 50.7% | 2.0% | 6.5% |
| (1) | Source: Appraisal. |
The following table presents a comparison of the parking rates near the Aladdin Airport Parking Property:
| Comparable Parking Rates(1) | ||
| Name / Property Location | Spaces | Price Per Space |
| Aladdin Airport Parking | 2,300 |
Roof - $21.00 Covered - $23.00 Valet - $30.00 |
| San Park / Terminals 1 & 2 | 6,105 |
General - $38.00 Valet - $60.00 |
| San Diego Airport Lot | 363 | $18.00 |
| Fox RAC | 300 | $20.00 |
| Park Shuttle Ride | 375 | $24.95 |
| Wally Park | 766 | $24.95 |
| Laurel Travel Center | 428 | $19.00 |
| Wyndham Hotel | 200 | $24.00 |
| Sheraton | 300 | $20.00 |
| (1) | Source: Appraisal. |
The Borrower. The borrowers are Aladdin Parking, L.P., a California limited partnership, and Aladdin Airport Parking LLC, a California limited liability company, each a recycled single purpose entity with one independent director. Legal counsel to the borrowers delivered a non-consolidation opinion in connection with the origination of the Aladdin Airport Parking Mortgage Loan.
The Borrower Sponsors. The borrower sponsors and non-recourse carveout guarantors are three irrevocable trusts: Administrative Trust Under the Anthony Vincent Zehenni Trust, dated December 8, 1982 (“ZAT Sponsor”), Non-Exempt Trust for the Benefit of Jennifer Lynn Zehenni Under the Anthony Vincent Zehenni Trust, dated December 8, 1982, as amended (the “Jennifer Trust Sponsor”) and Non-Exempt Trust for the Benefit of Anthony Vincent Zehenni, Jr. Under the Anthony Vincent Zehenni Trust dated December 8, 1982, as amended (the “Anthony Trust Sponsor,” and collectively the “Sponsors”). The Anthony Trust Sponsor developed the Aladdin Airport Parking Property in 1987 and has operated it since its construction. Anthony Vincent Zehenni founded Aladdin Developers, Inc. in 1961, a real estate development and investment company located in West Hollywood, California. Aladdin Developers, Inc. has participated in a large range of activities over the past 60 years, including land development, commercial property investment and infrastructure projects.
THE INFORMATION IN THIS STRUCTURAL AND COLLATERAL TERM SHEET IS NOT COMPLETE AND MAY BE AMENDED PRIOR TO THE TIME OF SALE. THIS TERM SHEET IS NOT AN OFFER TO SELL THESE SECURITIES AND IT IS NOT A SOLICITATION OF AN OFFER TO BUY THESE SECURITIES IN ANY JURISDICTION WHERE THE OFFER OR SALE IS NOT PERMITTED. | ||
| 86 | ||
| Structural and Collateral Term Sheet | BBCMS 2025-5C34 | |
| No. 7 – Aladdin Airport Parking | ||
Property Management. The Aladdin Airport Parking Property is managed by SP Plus Corporation (“Parking Manager”). SP Plus Corporation is one of the largest parking lot operators in the world, and has over 65 years of airport specific parking experience. SP Plus Corporation manages parking properties in over 100 major cities and has over 16,000 employees across the United States and Europe.
Escrows and Reserves. At origination, the borrowers deposited approximately (i) $36,833 for real estate taxes, (ii) $65,063 for insurance premiums and (iii) $9,375 for required repairs.
Tax Escrows – On a monthly basis, the borrowers are required to deposit 1/12th of an amount that would be sufficient to pay taxes for the next ensuing 12 months (currently equivalent to approximately $36,833 a month).
Insurance Escrows – On a monthly basis, if there is no approved blanket policy in place, the borrowers are required to deposit 1/12th of an amount that would be sufficient to pay insurance premiums for the next ensuing 12 months (currently equivalent to approximately $13,013 a month). As of origination, there was not an approved blanket policy in place.
Replacement Reserve – On a monthly basis, the borrowers are required to deposit approximately $4,792 for replacement reserves.
Low Debt Yield Reserve – If the borrowers elect to cure a Trigger Period (as defined below) arising due to the occurrence of a Low Debt Yield Event (as defined below) via delivery of a Low Debt Yield Event Deposit Election, on each payment date and until satisfaction of a Low Debt Yield cure, the borrower will be required to deposit $150,000 for low debt yield reserves (a “Low Debt Yield Event Deposit Election”). $150,000 per month is equivalent to excess cash flow based on a NCF DSCR of approximately 1.64x.
Lockbox / Cash Management. The Aladdin Airport Parking Mortgage Loan is structured with a soft lockbox and springing cash management. The borrowers are required to cause all rents and revenue of any kind from the Aladdin Airport Parking Property to be transmitted directly by the Parking Manager into a lender-controlled lockbox account within one business day of receipt. Upon the occurrence and during the continuance of a Trigger Period (as defined below), the lender, on behalf of the borrowers, will establish a cash management account into which the borrower will deposit, or cause to be deposited, all sums on deposit in the lockbox account, and all excess cash flow will be reserved in the excess cash flow reserve account.
A “Trigger Period” will commence upon (i) an event of default under the Aladdin Parking Mortgage Loan documents or (ii) the debt yield being less than 11% for one calendar quarter (a “Low Debt Yield Event”), and ends upon (a) regarding clause (i) above, the cure of such event of default and (b) regarding clause (ii) above, the debt yield being equal to or greater than 11% for one calendar quarter (“a “Low Debt Yield Event Cure”).
If a Trigger Period occurs as a result of a Low Debt Yield Event, the borrowers have the right to cure or prevent the commencement of the Trigger Period by delivering written notice to the lender of their election to make monthly deposits of $150,000 into a reserve fund until such Low Debt Yield Event is cured.
Subordinate and Mezzanine Debt. None.
Permitted Future Mezzanine Debt. Not permitted.
Partial Release. Not permitted.
Ground Lease. None.
THE INFORMATION IN THIS STRUCTURAL AND COLLATERAL TERM SHEET IS NOT COMPLETE AND MAY BE AMENDED PRIOR TO THE TIME OF SALE. THIS TERM SHEET IS NOT AN OFFER TO SELL THESE SECURITIES AND IT IS NOT A SOLICITATION OF AN OFFER TO BUY THESE SECURITIES IN ANY JURISDICTION WHERE THE OFFER OR SALE IS NOT PERMITTED. | ||
| 87 | ||
| Structural and Collateral Term Sheet | BBCMS 2025-5C34 | |
| No. 8 – Tampa Redstone Portfolio | ||
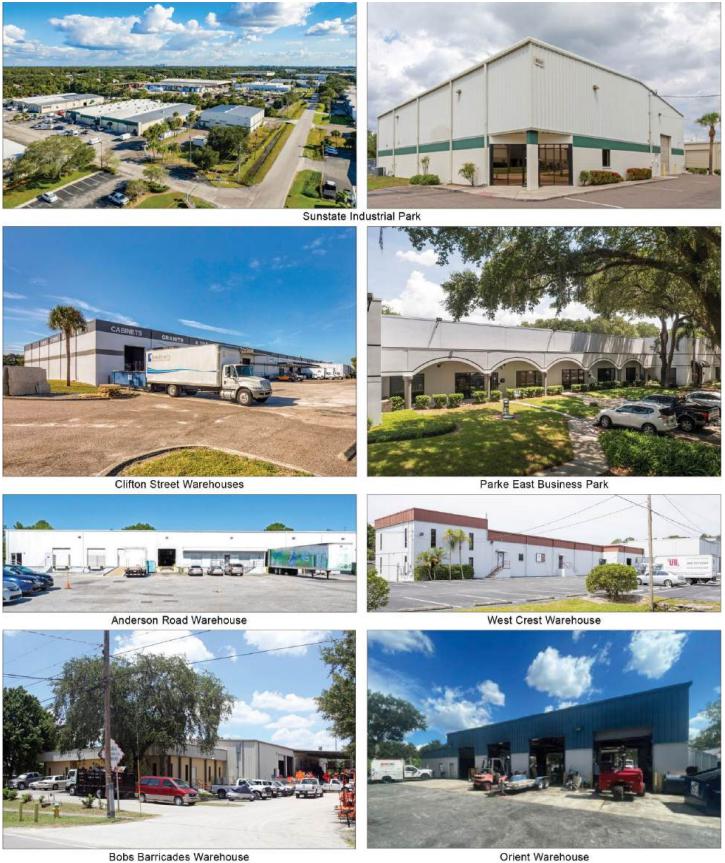
THE INFORMATION IN THIS STRUCTURAL AND COLLATERAL TERM SHEET IS NOT COMPLETE AND MAY BE AMENDED PRIOR TO THE TIME OF SALE. THIS TERM SHEET IS NOT AN OFFER TO SELL THESE SECURITIES AND IT IS NOT A SOLICITATION OF AN OFFER TO BUY THESE SECURITIES IN ANY JURISDICTION WHERE THE OFFER OR SALE IS NOT PERMITTED. | ||
| 88 | ||
| Structural and Collateral Term Sheet | BBCMS 2025-5C34 | |
| No. 8 – Tampa Redstone Portfolio | ||
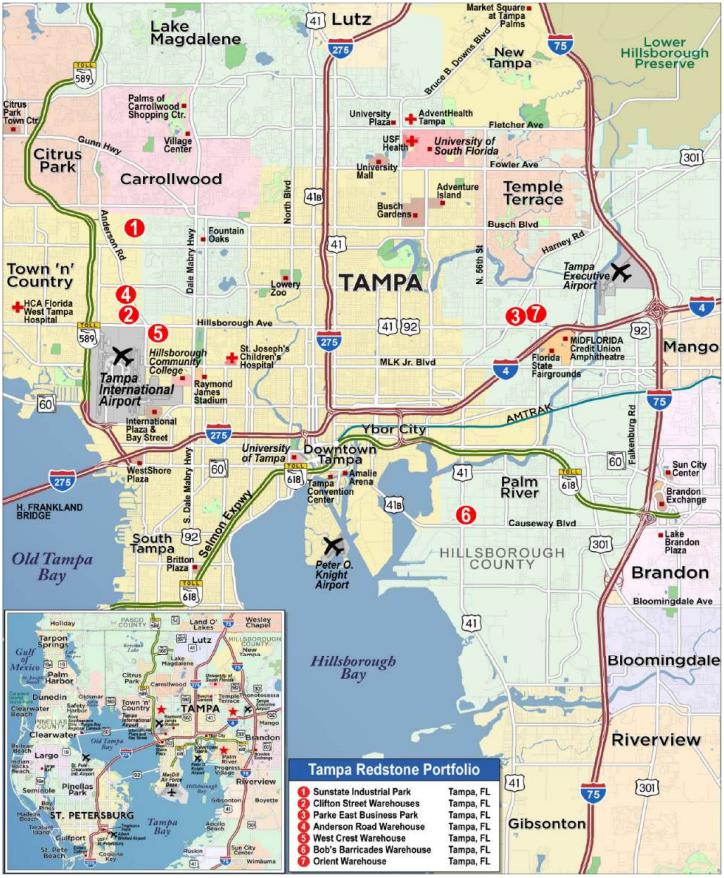
THE INFORMATION IN THIS STRUCTURAL AND COLLATERAL TERM SHEET IS NOT COMPLETE AND MAY BE AMENDED PRIOR TO THE TIME OF SALE. THIS TERM SHEET IS NOT AN OFFER TO SELL THESE SECURITIES AND IT IS NOT A SOLICITATION OF AN OFFER TO BUY THESE SECURITIES IN ANY JURISDICTION WHERE THE OFFER OR SALE IS NOT PERMITTED. | ||
| 89 | ||
| Structural and Collateral Term Sheet | BBCMS 2025-5C34 | |
| No. 8 – Tampa Redstone Portfolio | ||
| Mortgage Loan Information | Property Information | |||
| Mortgage Loan Seller: | AREF2 | Single Asset / Portfolio: | Portfolio | |
| Original Principal Balance: | $35,800,000 | Title: | Fee | |
| Cut-off Date Principal Balance: | $35,800,000 | Property Type - Subtype: | Industrial - Warehouse/Distribution | |
| % of IPB: | 4.6% | Net Rentable Area (SF): | 402,074 | |
| Loan Purpose: | Refinance | Location: | Tampa, FL | |
| Borrowers(1): | Various | Year Built / Renovated: | Various / NAP | |
| Borrower Sponsor: | Joseph J. Sitt | Occupancy: | 95.6% | |
| Interest Rate: | 6.70400% | Occupancy Date: | Various | |
| Note Date: | 3/25/2025 | 4th Most Recent NOI (As of)(3): | NAV | |
| Maturity Date: | 4/6/2030 | 3rd Most Recent NOI (As of)(4): | $2,505,818 (12/31/2023) | |
| Interest-only Period: | 60 months | 2nd Most Recent NOI (As of)(4): | $3,124,195 (12/31/2024) | |
| Original Term: | 60 months | Most Recent NOI (As of): | $3,168,923 (TTM 1/31/2025) | |
| Original Amortization Term: | None | UW Occupancy: | 95.0% | |
| Amortization Type: | Interest Only | UW Revenues: | $4,863,896 | |
| Call Protection: | L(25),D(31),O(4) | UW Expenses: | $1,607,782 | |
| Lockbox / Cash Management: | Hard / Springing | UW NOI: | $3,256,114 | |
| Additional Debt: | No | UW NCF: | $3,014,870 | |
| Additional Debt Balance: | N/A | Appraised Value / Per SF: | $64,760,000 / $161 | |
| Additional Debt Type: | N/A | Appraisal Date: | 2/27/2025 | |
| Escrows and Reserves(2) | Financial Information | |||||
| Initial | Monthly | Initial Cap | Cut-off Date Loan / SF: | $89 | ||
| Taxes: | $256,737 | $51,347 | N/A | Maturity Date Loan / SF: | $89 | |
| Insurance: | $0 | Springing | N/A | Cut-off Date LTV: | 55.3% | |
| Replacement Reserve: | $450,000 | $5,026 | N/A | Maturity Date LTV: | 55.3% | |
| Immediate Repairs: | $119,637 | $0 | N/A | UW NCF DSCR: | 1.24x | |
| Rollover Reserve: | $700,000 | $16,753 | N/A | UW NOI Debt Yield: | 9.1% | |
| Environmental Reserve: | $350,000 | $0 | N/A | |||
| Sources and Uses | |||||||
| Sources | Proceeds | % of Total | Uses | Proceeds | % of Total | ||
| Mortgage Loan | $35,800,000 | 100.0% | Loan Payoff | $32,155,579 | 89.8 | % | |
| Upfront Reserves | 1,876,374 | 5.2 | |||||
| Closing Costs(5) | 1,596,876 | 4.5 | |||||
| Return of Equity | 171,171 | 0.5 | |||||
| Total Sources | $35,800,000 | 100.0% | Total Uses | $35,800,000 | 100.0 | % | |
| (1) | See “The Borrowers” below for more information. |
| (2) | For a full description of Escrows and Reserves, see “Escrows and Reserves” below. |
| (3) | 4th Most Recent NOI is not available because the borrower sponsors acquired the Tampa Redstone Portfolio Properties (as defined below) in August 2022. |
| (4) | The increase in 2nd Most Recent NOI from 3rd Most Recent NOI is primarily due to an increase in gross rental collections from $10.00 per square foot to $11.81 per square foot as rolling leases were converted from modified gross to triple net reimbursement structures and base rents were increased on below-market leases. |
| (5) | Closing Costs include a rate buydown fee of $750,000. |
The Loan. The Tampa Redstone Portfolio mortgage loan (the “Tampa Redstone Portfolio Mortgage Loan”) has an outstanding principal balance as of the Cut-off Date of $35,800,000 and is secured by the borrowers’ fee interests in seven industrial warehouse/distribution properties located in Tampa, Florida. The Tampa Redstone Portfolio Mortgage Loan has a five-year term, is interest-only for the entire term and accrues interest at a fixed rate of 6.70400% per annum on an Actual/360 basis.
THE INFORMATION IN THIS STRUCTURAL AND COLLATERAL TERM SHEET IS NOT COMPLETE AND MAY BE AMENDED PRIOR TO THE TIME OF SALE. THIS TERM SHEET IS NOT AN OFFER TO SELL THESE SECURITIES AND IT IS NOT A SOLICITATION OF AN OFFER TO BUY THESE SECURITIES IN ANY JURISDICTION WHERE THE OFFER OR SALE IS NOT PERMITTED. | ||
| 90 | ||
| Structural and Collateral Term Sheet | BBCMS 2025-5C34 | |
| No. 8 – Tampa Redstone Portfolio | ||
The Properties. The Tampa Redstone Portfolio Mortgage Loan is secured by seven industrial properties totaling 402,074 square feet located in Tampa, Florida (the “Sunstate Industrial Park Property”, the “Clifton Street Warehouses Property”, the “Parke East Business Park Property”, the “Anderson Road Warehouse Property”, the “West Crest Warehouse Property”, the “Bob’s Barricades Warehouse Property” and the “Orient Warehouse Property”, and together, the “Tampa Redstone Portfolio Properties”). The Tampa Redstone Portfolio Properties are summarized in the table below.
| Portfolio Summary | |||||||||
| Property Name | Location(1) | SF(1) | Occupancy(1) | Allocated Cut-off Date Loan Amount (“ALA”) | % of ALA | Appraised Value(2) | Appraised Value per SF(2) | Average In-Place Base Rent PSF(1) | Average Market Base Rent PSF(2) |
| Sunstate Industrial Park | Tampa, FL | 170,236 | 89.5% | $14,317,789 | 40.0% | $25,900,000 | $152 | $9.13 | $12.04 |
| Clifton Street Warehouses | Tampa, FL | 114,614 | 100.0% | 9,840,025 | 27.5% | 17,800,000 | $155 | $8.58 | $10.78 |
| Parke East Business Park | Tampa, FL | 31,419 | 100.0% | 3,593,267 | 10.0% | 6,500,000 | $207 | $12.66 | $14.50 |
| Anderson Road Warehouse | Tampa, FL | 30,000 | 100.0% | 3,123,379 | 8.7% | 5,650,000 | $188 | $13.03 | $12.50 |
| West Crest Warehouse | Tampa, FL | 35,005 | 100.0% | 2,985,176 | 8.3% | 5,400,000 | $154 | $7.10 | $12.00 |
| Bob's Barricades Warehouse | Tampa, FL | 15,300 | 100.0% | 1,133,261 | 3.2% | 2,050,000 | $134 | $7.65 | $10.50 |
| Orient Warehouse | Tampa, FL | 5,500 | 100.0% | 807,103 | 2.3% | 1,460,000 | $265 | $18.00 | $18.00 |
| Total / Wtd. Avg. | 402,074 | 95.6% | $35,800,000 | 100.0% | $64,760,000 | $161 | $9.44 | $11.93 | |
| (1) | Information based on the underwritten rent rolls dated March 25, 2025 and March 31, 2025. The Average In-Place Base Rent PSF includes contractual rent steps through February 2026. |
| (2) | Information obtained from the appraisals. |
The borrower sponsor acquired the Tampa Redstone Portfolio Properties in August 2022 for an aggregate purchase price of approximately $37.3 million. Since acquisition, the borrower sponsor has invested approximately $1.1 million in capital improvements across the portfolio including roof replacements at two of the properties and asphalt pavement at six properties, among other repairs. Additionally, $569,637 was reserved at origination of the Tampa Redstone Portfolio Mortgage Loan to be used for immediate repairs, roof upgrades and awning replacements. Since acquisition in 2022, the borrower sponsor has increased the net operating income from $2.1 million in the trailing twelve months (“TTM”) ending June 30, 2022 to $3.2 million in the TTM ending January 31, 2025 by increasing rents on below-market leases and converting modified gross leases to triple-net reimbursement structures. In-place base rents have increased from $7.57 per square foot as of March 2023 to $9.44 per square foot as of March 2025. The expense reimbursement ratio increased from 53.9% in the TTM ending June 30, 2022 to 89.9% in the TTM ending January 31, 2025. The weighted average in-place rent of $9.44 remains approximately 21% below the appraiser’s concluded weighted average market rent for the portfolio of $11.93.
The Sunstate Industrial Park Property is a 170,236 square foot warehouse/distribution industrial property located approximately 9.4 miles northwest of downtown Tampa. The Sunstate Industrial Park Property consists of six buildings ranging in size from 7,740 to 42,697 square feet constructed between 1975 and 2008. The improvements include approximately 12.1% of the square footage built out as office space, nine dock-height loading doors, 34 grade-level loading doors and 16- to 26-foot clear heights. The site features 292 surface parking spaces, resulting in a parking ratio of approximately 1.7 spaces per 1,000 square feet of net rentable area (“NRA”). As of March 31, 2025, the Sunstate Industrial Park Property was 89.5% occupied by 12 tenants.
The Clifton Street Warehouses Property is a 114,614 square foot warehouse/distribution property located approximately 7.1 miles northwest of downtown Tampa. The Clifton Street Warehouses Property consists of two single-story buildings constructed in 1967 and 2008. The improvements include approximately 20-foot clear heights, nine dock-height loading doors, two grade-level loading doors and 10.3% of the square footage built out as office space. The site features 178 surface parking spaces, resulting in a parking ratio of approximately 1.6 spaces per 1,000 square feet of NRA. As of March 31, 2025, the Clifton Street Warehouse Property was 100.0% occupied by five tenants.
The Parke East Business Park Property is a 31,419 square foot warehouse/distribution industrial property located approximately 6.7 miles northeast of downtown Tampa. The Parke East Business Park Property consists of one single-
THE INFORMATION IN THIS STRUCTURAL AND COLLATERAL TERM SHEET IS NOT COMPLETE AND MAY BE AMENDED PRIOR TO THE TIME OF SALE. THIS TERM SHEET IS NOT AN OFFER TO SELL THESE SECURITIES AND IT IS NOT A SOLICITATION OF AN OFFER TO BUY THESE SECURITIES IN ANY JURISDICTION WHERE THE OFFER OR SALE IS NOT PERMITTED. | ||
| 91 | ||
| Structural and Collateral Term Sheet | BBCMS 2025-5C34 | |
| No. 8 – Tampa Redstone Portfolio | ||
story building constructed in 1986. The improvements include approximately 38.6% of the square footage built out as office space, eight dock-height loading doors, five grade-level loading doors and 18-foot clear heights. The site features 51 surface parking spaces, resulting in a parking ratio of approximately 1.6 spaces per 1,000 square feet of NRA. As of March 31, 2025, the Parke East Business Park Property was 100.0% occupied by six tenants.
The Anderson Road Warehouse Property is a 30,000 square foot warehouse/distribution industrial property located approximately 7.6 miles northwest of downtown Tampa. The Anderson Road Warehouse Property consists of one single-story building constructed in 1969. The improvements include approximately 10.7% of the square footage built out as office space, six dock-height loading doors and 20 to 26-foot clear heights. The site features 30 surface parking spaces, resulting in a parking ratio of 1.0 spaces per 1,000 square feet of NRA. As of March 31, 2025, the Anderson Road Warehouse Property was 100.0% occupied by two tenants.
The West Crest Warehouse Property is a 35,005 square foot warehouse/distribution industrial property located approximately 6.4 miles northwest of downtown Tampa. The West Crest Warehouse Property consists of one single-story building constructed in 1972. The improvements include approximately 16.0% of the square footage built out as office space, nine dock-height loading doors and 18 to 26-foot clear heights. The site features 36 surface parking spaces, resulting in a parking ratio of approximately 1.0 space per 1,000 square feet of NRA. Approximately 5,750 square feet of the parking area is ground leased to a single tenant. Such portion of the parking area is leased on a month-to-month basis and the tenant’s annual rent under the ground lease is $7,800. The leased parking area is located on the southern portion of the parking lot and is used for outdoor storage. As of March 31, 2025, the West Crest Warehouse Property was 100.0% occupied by three tenants (excluding the ground lease tenant).
The Bob’s Barricades Warehouse Property is a 15,300 square foot warehouse/distribution industrial property located approximately 5.5 miles southeast of downtown Tampa. The Bob’s Barricades Warehouse Property consists of one single-story building constructed in 1988. The improvements include approximately 16.1% of the square footage built out as office space, two dock-height loading doors and one grade-level loading door and 18-foot clear heights. The site features 10 surface parking spaces, resulting in a parking ratio of approximately 0.7 space per 1,000 square feet of NRA. As of March 25, 2025, the Bob’s Barricades Warehouse Property was 100.0% occupied by a single tenant, Bob’s Barricades Inc., which has been a tenant at the Bob’s Barricades Warehouse Property since June 2007. The current lease expires in August 2026.
The Orient Warehouse Property is a 5,500 square foot warehouse/distribution industrial property in Tampa, Florida, located approximately 7.3 miles northeast of downtown Tampa. The Orient Warehouse Property consists of one single-story building constructed in 2001. The improvements include approximately 27.3% of the square footage built out as office space, eight grade-level loading doors and 18-foot clear heights. The site features nine surface parking spaces, resulting in a parking ratio of approximately 1.6 spaces per 1,000 square feet of NRA. As of March 25, 2025, the Orient Warehouse Property was 100.0% occupied by a single tenant, Drake Lawn & Pest Control, which has a current lease expiration in February 2034.
As of March 25, 2025 and March 31, 2025, the Tampa Redstone Portfolio Properties were 95.6% leased by 31 tenants, in the aggregate. Leases at the Tampa Redstone Portfolio Properties have historically been signed for shorter terms, with lease terms typically ranging from two to five years. 18 tenants comprising 278,398 square feet (69.2% of NRA) have been in occupancy since April 2020.
| Historical and Current Occupancy(1) | |||
| 2022 | 2023 | 2024 | Current(2) |
| 98.2% | 95.6% | 97.2% | 95.6% |
| (1) | Historical occupancies are as of December 31 of each respective year. |
| (2) | Current occupancy is based on the underwritten rent rolls dated March 25, 2025 and March 31, 2025. |
THE INFORMATION IN THIS STRUCTURAL AND COLLATERAL TERM SHEET IS NOT COMPLETE AND MAY BE AMENDED PRIOR TO THE TIME OF SALE. THIS TERM SHEET IS NOT AN OFFER TO SELL THESE SECURITIES AND IT IS NOT A SOLICITATION OF AN OFFER TO BUY THESE SECURITIES IN ANY JURISDICTION WHERE THE OFFER OR SALE IS NOT PERMITTED. | ||
| 92 | ||
| Structural and Collateral Term Sheet | BBCMS 2025-5C34 | |
| No. 8 – Tampa Redstone Portfolio | ||
Major Tenants.
J&J Mission Critical, LLC (42,212 square feet; 10.5% of NRA; 9.4% of underwritten base rent): Founded in 2017 and based in Tampa, Florida, J&J Mission Critical, LLC (“J&J”) is a management, scientific, and technical consulting services company that specializes in providing consulting for mission-critical facilities, including data centers and other high-reliability environments. J&J commenced its lease at the Clifton Street Warehouses Property in November 2018 and renewed in April 2024 to its current expiration in March 2029. J&J has no renewal options and no termination options.
Superior Pool Products LLC (35,000 square feet; 8.7% of NRA; 6.3% of underwritten base rent): Superior Pool Products, LLC (“SPP”) is part of SCP Distributors LLC, the world's largest wholesale distributor of swimming pool supplies, equipment and related leisure products. SPP offers products such as pool construction materials, replacement parts, pool fencing and pool care products. SPP has occupied space at the Sunstate Industrial Property since May 2002 when it commenced its initial lease for 17,500 square feet. Since its initial lease, SPP has expanded its premises twice for a total current footprint of 35,000 square feet. SPP most recently renewed its lease in December 2020 for an additional seven years to its current expiration in November 2027. SPP has one, five-year renewal option remaining and no termination options.
Noland Properties Inc. (27,437 square feet; 6.8% of NRA; 8.2% of underwritten base rent): Noland Properties Inc. (“Noland”), a subsidiary of Winsupply, is a wholesale distributor of plumbing, heating, air conditioning, refrigeration, electrical and industrial supplies. Noland has been a tenant at the Clifton Street Warehouse Property since July 2013 when it signed its initial lease for 18,424 square feet. Noland expanded its premises by 9,013 square feet in 2017, for a total current footprint of 27,437 square feet, and most recently renewed for an additional five years in October 2023 to its current expiration in September 2028. Noland has no renewal options and no termination options.
The following table presents a summary of the tenants at the Tampa Redstone Portfolio Properties:
| Top Tenant Summary(1) | |||||||
| Tenant |
Ratings Moody’s/S&P/Fitch |
Net Rentable Area (SF) |
% of Total NRA |
UW Base Rent PSF(2) | UW Base Rent(2) |
% of Total UW Base Rent(2) |
Lease Expiration Date |
| J&J Mission Critical, LLC | NR/NR/NR | 42,212 | 10.5% | $8.06 | $340,224 | 9.4% | 3/31/2029 |
| Superior Pool Products LLC | NR/NR/NR | 35,000 | 8.7 | $6.56 | 229,680 | 6.3 | 11/30/2027 |
| Noland Properties Inc. | NR/NR/NR | 27,437 | 6.8 | $10.83 | 297,159 | 8.2 | 9/30/2028 |
| The Fulfillment Lab Inc. | NR/NR/NR | 23,433 | 5.8 | $6.60 | 154,656 | 4.3 | 10/31/2025 |
| Home Pride Cabinets Inc. | NR/NR/NR | 22,177 | 5.5 | $12.26 | 271,840 | 7.5 | 7/31/2026 |
| DS Services of America Inc. | NR/NR/NR | 18,000 | 4.5 | $13.00 | 234,000 | 6.5 | 3/31/2026 |
| All My Sons Moving & Storage of Orlan | NR/NR/NR | 15,880 | 3.9 | $6.47 | 102,768 | 2.8 | 10/31/2026 |
| T&A Truck Specialists Inc. | NR/NR/NR | 15,750 | 3.9 | $7.14 | 112,440 | 3.1 | 12/31/2026 |
| Bob's Barricades Inc. | NR/NR/NR | 15,300 | 3.8 | $7.65 | 117,120 | 3.2 | 8/31/2026 |
| M&F Home Solutions LLC | NR/NR/NR | 12,675 | 3.2 | $5.54 | 70,200 | 1.9 | 7/31/2031 |
| Ten Largest Tenants | 227,864 | 56.7% | $8.47 | $1,930,086 | 53.2% | ||
| Remaining Occupied | 156,367 | 38.9 | $10.85 | 1,697,274 | 46.8 | ||
| Total Occupied | 384,231 | 95.6% | $9.44 | $3,627,360 | 100.0% | ||
| Vacant Space | 17,843 | 4.4 | |||||
| Collateral Total | 402,074 | 100.0% | |||||
| (1) | Based on the underwritten rent rolls dated March 25, 2025 and March 31, 2025. |
| (2) | UW Base Rent, UW Base Rent PSF and % of Total UW Base Rent are inclusive of contractual rent steps underwritten through February 2026. |
THE INFORMATION IN THIS STRUCTURAL AND COLLATERAL TERM SHEET IS NOT COMPLETE AND MAY BE AMENDED PRIOR TO THE TIME OF SALE. THIS TERM SHEET IS NOT AN OFFER TO SELL THESE SECURITIES AND IT IS NOT A SOLICITATION OF AN OFFER TO BUY THESE SECURITIES IN ANY JURISDICTION WHERE THE OFFER OR SALE IS NOT PERMITTED. | ||
| 93 | ||
| Structural and Collateral Term Sheet | BBCMS 2025-5C34 | |
| No. 8 – Tampa Redstone Portfolio | ||
The following table presents information relating to the tenant rollover schedule at the Tampa Redstone Portfolio Properties:
| Lease Rollover Schedule(1) | |||||||||
| Year | Number of Leases Expiring | Net Rentable Area Expiring | % of NRA Expiring | UW Base Rent Expiring(2) | % of UW Base Rent Expiring(2) | Cumulative Net Rentable Area Expiring | Cumulative % of NRA Expiring | Cumulative UW Base Rent Expiring(2) | Cumulative % of UW Base Rent Expiring(2) |
| Vacant | NAP | 17,843 | 4.4% | NAP | NAP | 17,843 | 4.4% | NAP | NAP |
| MTM & 2025 | 4 | 35,173 | 8.7 | $257,748 | 7.1% | 53,016 | 13.2% | $257,748 | 7.1% |
| 2026 | 13 | 144,804 | 36.0 | 1,382,149 | 38.1 | 197,820 | 49.2% | $1,639,897 | 45.2% |
| 2027 | 6 | 76,057 | 18.9 | 670,935 | 18.5 | 273,877 | 68.1% | $2,310,831 | 63.7% |
| 2028 | 3 | 45,991 | 11.4 | 495,094 | 13.6 | 319,868 | 79.6% | $2,805,925 | 77.4% |
| 2029 | 3 | 64,031 | 15.9 | 652,235 | 18.0 | 383,899 | 95.5% | $3,458,160 | 95.3% |
| 2030 | 0 | 0 | 0.0 | 0 | 0.0 | 383,899 | 95.5% | $3,458,160 | 95.3% |
| 2031 | 1 | 12,675 | 3.2 | 70,200 | 1.9 | 396,574 | 98.6% | $3,528,360 | 97.3% |
| 2032 | 0 | 0 | 0.0 | 0 | 0.0 | 396,574 | 98.6% | $3,528,360 | 97.3% |
| 2033 | 0 | 0 | 0.0 | 0 | 0.0 | 396,574 | 98.6% | $3,528,360 | 97.3% |
| 2034 | 1 | 5,500 | 1.4 | 99,000 | 2.7 | 402,074 | 100.0% | $3,627,360 | 100.0% |
| 2035 & Beyond | 0 | 0 | 0.0 | 0 | 0.0 | 402,074 | 100.0% | $3,627,360 | 100.0% |
| Total / Wtd. Avg. | 31 | 402,074 | 100.0% | $3,627,360 | 100.0% | ||||
| (1) | Based on the underwritten rent rolls dated March 25, 2025 and March 31, 2025. |
| (2) | UW Base Rent Expiring, % of UW Base Rent Expiring, Cumulative UW Base Rent Expiring and Cumulative % of UW Base Rent Expiring are inclusive of contractual rent steps underwritten through February 2026. |
Environmental. According to the Phase I environmental reports dated between March 4, 2025 and March 5, 2025, there was evidence of three recognized environmental conditions (each, a “REC”) at the Sunstate Industrial Park Property. The respective report identified two RECs arising from subsurface contamination and one REC relating to the potential release of PFOA/PFAS in groundwater. There was no evidence of any recognized environmental conditions at the remaining properties. See “Description of the Mortgage Pool—Environmental Considerations” in the Preliminary Prospectus.
THE INFORMATION IN THIS STRUCTURAL AND COLLATERAL TERM SHEET IS NOT COMPLETE AND MAY BE AMENDED PRIOR TO THE TIME OF SALE. THIS TERM SHEET IS NOT AN OFFER TO SELL THESE SECURITIES AND IT IS NOT A SOLICITATION OF AN OFFER TO BUY THESE SECURITIES IN ANY JURISDICTION WHERE THE OFFER OR SALE IS NOT PERMITTED. | ||
| 94 | ||
| Structural and Collateral Term Sheet | BBCMS 2025-5C34 | |
| No. 8 – Tampa Redstone Portfolio | ||
The following table presents certain information relating to the operating history and underwritten cash flows of the Tampa Redstone Portfolio Properties:
| Operating History and Underwritten Cash Flow | ||||||
| 2023 | 2024 | TTM(1) | Underwritten | Per Square Foot |
%(2) | |
| Base Rent | $2,919,553 | $3,309,610 | $3,333,567 | $3,423,749 | $8.52 | 66.9% |
| Rent Steps | 0 | 0 | 0 | 203,611 | 0.51 | 4.0 |
| Recovery Income | 1,099,516 | 1,439,498 | 1,472,581 | 1,294,081 | 3.22 | 25.3 |
| Vacancy Gross Up | 0 | 0 | 0 | 198,450 | 0.49 | 3.9 |
| Gross Potential Rent | $4,019,069 | $4,749,108 | $4,806,148 | $5,119,890 | $12.73 | 100.0% |
| Vacancy and Credit Loss | 0 | 0 | 0 | (255,995) | (0.64) | (5.0) |
| Effective Gross Income | $4,019,069 | $4,749,108 | $4,806,148 | $4,863,896 | $12.10 | 95.0% |
| Total Expenses | 1,513,251 | 1,624,913 | 1,637,225 | 1,607,782 | 4.00 | 33.1 |
| Net Operating Income(3) | $2,505,818 | $3,124,195 | $3,168,923 | $3,256,114 | $8.10 | 66.9% |
| Capital Expenditures | 0 | 0 | 0 | 40,207 | 0.10 | 0.8 |
| TI/LC | 0 | 0 | 0 | 201,037 | 0.50 | 4.1 |
| Net Cash Flow | $2,505,818 | $3,124,195 | $3,168,923 | $3,014,870 | $7.50 | 62.0% |
| (1) | TTM column reflects the trailing 12 months ending January 31, 2025. |
| (2) | % column represents percent of Gross Potential Rent for revenue lines and percent of Effective Gross Income for all remaining fields. |
| (3) | The increase in 2024 net operating income from 2023 net operating income is primarily due to an increase in gross rental collections from $10.00 per square foot to $11.81 per square foot as rolling leases were converted from modified gross to triple net reimbursement structures and base rents were increased on below-market leases. |
The Markets. The Tampa Redstone Portfolio Properties are all located within 10 miles of downtown Tampa, Florida within Hillsborough County. Hillsborough County has a population of 1,552,366 and a median household income of $76,222 as of 2024. The top three industries in Hillsborough County include healthcare / social assistance, retail trade and professional / scientific / technical services.
The Sunstate Industrial Park Property, the Clifton Street Warehouse Property, the Anderson Road Warehouse Property and the West Crest Warehouse Property are all located in the Westshore / Airport industrial submarket, adjacent to Tampa International Airport. According to the appraisal, as of the fourth quarter of 2024, the Westshore/Airport warehouse submarket had approximately 19.7 million square feet of warehouse inventory, had a vacancy rate of 5.9% and an average rent of $13.76 per square foot.
The Parke East Business Park Property, the Bob’s Barricades Warehouse Property and the Orient Warehouse Property are all located in the East Side warehouse submarket. According to the appraisal, as of the fourth quarter of 2024, the East Side warehouse submarket had approximately 60.3 million square feet of warehouse inventory, had a vacancy rate of 3.9%, and an average rent of $12.64 per square foot.
THE INFORMATION IN THIS STRUCTURAL AND COLLATERAL TERM SHEET IS NOT COMPLETE AND MAY BE AMENDED PRIOR TO THE TIME OF SALE. THIS TERM SHEET IS NOT AN OFFER TO SELL THESE SECURITIES AND IT IS NOT A SOLICITATION OF AN OFFER TO BUY THESE SECURITIES IN ANY JURISDICTION WHERE THE OFFER OR SALE IS NOT PERMITTED. | ||
| 95 | ||
| Structural and Collateral Term Sheet | BBCMS 2025-5C34 | |
| No. 8 – Tampa Redstone Portfolio | ||
The following table presents certain information relating to comparable industrial leases for the Tampa Redstone Portfolio Properties:
| Comparable Industrial Rental Summary(1) | |||||||
| Property/Location | Year Built / Renovated | Gross Building Area (SF) | Tenant Size (SF) | Tenant Name | Annual Base Rent PSF | Commencement | Lease Term (Years) |
|
Clifton Street Warehouses Tampa, FL |
1967, 2008 / NAP | 114,614(2) | 42,212(2) | J&J Mission Critical, LLC | $8.06(2) | Apr-24(2) | 5.0(2) |
|
Tampa 7007 Tampa, FL |
1981 / NAP | 94,354 | 28,666 | Direct Impact Logistics | $12.95 | Mar-24 | 3.2 |
|
Tampa Airport Distribution Center #1 Tampa, FL |
1999 / NAP | 101,407 | 21,055 | Parts Authority, LLC | $12.95 | Jan-25 | 5.0 |
|
Tampa Distribution Center - Building 2 Tampa, FL |
1973 / NAP | 140,000 | 45,000 | General Insulation | $10.35 | Nov-24 | 5.2 |
|
Tampa East Industrial Portfolio Tampa, FL |
1972 / 1987 | 513,491 | 48,000 | Border States Industries, Inc. | $10.50 | Mar-24 | 5.0 |
| (1) | Source: Appraisal, unless otherwise indicated. |
| (2) | Based on the underwritten rent roll dated March 25, 2025 and March 31, 2025. Annual Base Rent PSF includes contractual rent steps through February 2026. |
The Borrowers. The borrowers are Thor Tampa Portfolio LLC, Thor Tampa Portfolio II LLC and Thor Tampa Portfolio III LLC, each a Delaware limited liability company and special purpose entity with one independent director, as tenants-in-common. Legal counsel to the borrowers provided a non-consolidation opinion in connection with the origination of the Tampa Redstone Portfolio Mortgage Loan.
The Borrower Sponsor. The borrower sponsor and non-recourse carve-out guarantor is Joseph J. Sitt. Joseph J. Sitt is the chairman of Thor Equities, a global institutional real estate investment company founded in 1986 that owns assets in the North America, Europe and Latin America. Thor Equities manages a portfolio of approximately 50 million square feet across $20 billion worth of assets.
Property Management. The Tampa Redstone Portfolio Properties are managed by Thor Management Company LLC, an affiliate of the borrowers.
Escrows and Reserves. At origination, the borrowers deposited approximately $256,737 for real estate taxes, $450,000 for replacement reserves, $119,637 for immediate repairs, $700,000 for rollover reserves and $350,000 for environmental reserves.
Tax Escrows – On a monthly basis, the borrowers are required to escrow 1/12th of the estimated annual real estate tax payments, which currently equates to approximately $51,347.
Insurance Escrows – On a monthly basis, the borrowers are required to escrow 1/12th of the annual estimated insurance payments. Such reserve has been conditionally waived so long as no event of default under the Tampa Redstone Portfolio Mortgage Loan documents has occurred and is continuing, the borrower maintains a blanket policy meeting the requirements of the Tampa Redstone Portfolio Mortgage Loan documents and the borrowers provide evidence of the renewal of any such blanket insurance policy prior to the expiration thereof and receipts for the payment of the applicable premiums.
Replacement Reserve – On a monthly basis, the borrowers are required to escrow $5,026 for replacement reserves.
Rollover Reserve – On a monthly basis, the borrowers are required to escrow $16,753 monthly for tenant improvements and leasing commissions.
Lockbox / Cash Management. The Tampa Redstone Portfolio Mortgage Loan is structured with a hard lockbox and springing cash management. The borrowers are required to cause all rents to be transmitted directly by the tenants at the Tampa Redstone Portfolio Properties into a lender-controlled lockbox account. In addition, the borrowers are required to
THE INFORMATION IN THIS STRUCTURAL AND COLLATERAL TERM SHEET IS NOT COMPLETE AND MAY BE AMENDED PRIOR TO THE TIME OF SALE. THIS TERM SHEET IS NOT AN OFFER TO SELL THESE SECURITIES AND IT IS NOT A SOLICITATION OF AN OFFER TO BUY THESE SECURITIES IN ANY JURISDICTION WHERE THE OFFER OR SALE IS NOT PERMITTED. | ||
| 96 | ||
| Structural and Collateral Term Sheet | BBCMS 2025-5C34 | |
| No. 8 – Tampa Redstone Portfolio | ||
cause all rents received by the borrowers or the property manager, as applicable, to be deposited into such lockbox account within two business days of receipt. All amounts in the lockbox account are remitted on a daily basis to the borrowers at any time other than during the continuance of a Cash Management Period (as defined below). Upon the occurrence and during the continuance of a Cash Management Period, all amounts are required to be remitted to a lender-controlled cash management account on a daily basis to be applied and disbursed in accordance with the Tampa Redstone Portfolio Mortgage Loan documents. During the continuance of a Cash Management Period, all available cash remaining after the required applications and disbursements will be held in a lender-controlled subaccount; provided, that during a Cash Management Period continuing solely as a result of a Trigger Lease Sweep Period (as defined below), all available cash will be held in a special rollover reserve subaccount.
A “Cash Management Period” will commence upon the occurrence of any of the following: (i) the stated maturity date, (ii) an event of default under the Tampa Redstone Portfolio Mortgage Loan documents, (iii) if, as of the last day of any calendar quarter, the net cash flow debt service coverage ratio (“NCF DSCR”) is less than 1.15x, (iv) the occurrence of a Trigger Lease Sweep Period, and expiring upon, (1) the Tampa Redstone Portfolio Mortgage Loan has been repaid in full or (2) the stated maturity date has not occurred and with respect to (a) clause (ii) above, such event of default is no longer continuing and no other event of default has occurred and is continuing, (b) clause (iii) above, the date that the NCF DSCR, as calculated in accordance with the Tampa Redstone Portfolio Mortgage Loan documents, is equal to or greater than 1.20x for two consecutive calendar quarters and (c) clause (iv) above, the termination of such Trigger Lease Sweep Period.
A “Trigger Lease Sweep Period” commences upon the earlier to occur of any of the following: (i) the date that is six months prior to the end of the term of any Trigger Lease (as defined below) or the date the applicable trigger tenant gives notice; (ii) the date required under a Trigger Lease by which the applicable tenant is required to give notice of its exercise of a renewal option thereunder (and such renewal has not been so exercised) or the date the applicable trigger tenant gives notice; (iii) any Trigger Lease with respect to 25% or more of is surrendered, cancelled or terminated prior to its then-current expiration date or any tenant under a Trigger Lease gives notice of its intention to terminate, surrender or cancel its Trigger Lease; (iv) any tenant under a Trigger Lease will discontinue its business in any material portion of its premises (i.e., “goes dark”) (v) the occurrence and continuance (beyond any applicable notice and cure periods) of a default under any Trigger Lease by the applicable tenant thereunder; or (vi) the occurrence of an insolvency or bankruptcy proceeding, among other things, by any tenant under a Trigger Lease, its parent company or the lease guarantor under a Trigger Lease, as described in the Tampa Redstone Portfolio Mortgage Loan documents (a “Trigger Tenant Insolvency Proceeding”).
A Trigger Lease Sweep Period ends upon the earlier to occur of (x) the lender’s determination that sufficient funds have been accumulated in the special rollover reserve subaccount to pay for all anticipated expenses in connection with the re-letting of the space under the applicable lease(s) that gave rise to the subject Trigger Lease Sweep Period, including brokerage commissions and tenant improvements, and any anticipated shortfalls of payments required during any period of time that rents are insufficient as a result of down-time or free rent periods, which the parties agreed will be $300,000 with respect to the J&J Mission Critical lease, and (y) any of the following events: with respect to a matter described in (1) clauses (i), (ii), (iii) or (iv) above, upon the earlier to occur of the date on which (A) the subject tenant irrevocably exercises any renewal or extension option (or otherwise enters into an extension agreement with the borrower that is acceptable to the lender) with respect to all of the space demised under its Trigger Lease, (B) all of the space demised under the subject Trigger Lease that gave rise to the subject Trigger Lease Sweep Period has been fully leased pursuant to a replacement lease or leases approved by the lender, and all approved leasing expenses (and any other expenses in connection with the re-tenanting of such space) have been paid in full; (2) clause (v) above, (A) if the subject tenant default has been cured and no other tenant default has occurred for a period of six consecutive months following such cure; or (B) all of the space demised under the subject Trigger Lease that gave rise to the subject Trigger Lease Sweep Period has been fully leased pursuant to a replacement lease or leases approved by the lender, and all approved leasing expenses (and any other expenses in connection with the re-tenanting of such space) have been paid in full; or (3) clause (vi) above, (A) the applicable Trigger Lease Insolvency Proceeding has terminated and the applicable Trigger Lease has been affirmed, assumed or assigned in a manner reasonably satisfactory to the lender; or (B) all of the space demised under the subject Trigger Lease that gave rise to the subject Trigger Lease Sweep Period has been fully leased pursuant to a replacement lease or leases approved by the lender, and all approved leasing expenses (and any other expenses in connection with the re-tenanting of such space) have been paid in full.
A “Trigger Lease” means the J&J Mission Critical lease and any other lease which covers 40,000 or more rentable square feet at the Tampa Redstone Portfolio Properties.
THE INFORMATION IN THIS STRUCTURAL AND COLLATERAL TERM SHEET IS NOT COMPLETE AND MAY BE AMENDED PRIOR TO THE TIME OF SALE. THIS TERM SHEET IS NOT AN OFFER TO SELL THESE SECURITIES AND IT IS NOT A SOLICITATION OF AN OFFER TO BUY THESE SECURITIES IN ANY JURISDICTION WHERE THE OFFER OR SALE IS NOT PERMITTED. | ||
| 97 | ||
| Structural and Collateral Term Sheet | BBCMS 2025-5C34 | |
| No. 8 – Tampa Redstone Portfolio | ||
Subordinate and Mezzanine Debt. None.
Permitted Future Mezzanine Debt. Not Permitted.
Partial Release. Not permitted.
Ground Lease. None.
THE INFORMATION IN THIS STRUCTURAL AND COLLATERAL TERM SHEET IS NOT COMPLETE AND MAY BE AMENDED PRIOR TO THE TIME OF SALE. THIS TERM SHEET IS NOT AN OFFER TO SELL THESE SECURITIES AND IT IS NOT A SOLICITATION OF AN OFFER TO BUY THESE SECURITIES IN ANY JURISDICTION WHERE THE OFFER OR SALE IS NOT PERMITTED. | ||
| 98 | ||
| Structural and Collateral Term Sheet | BBCMS 2025-5C34 | |
| No. 9 – Uber Headquarters | ||
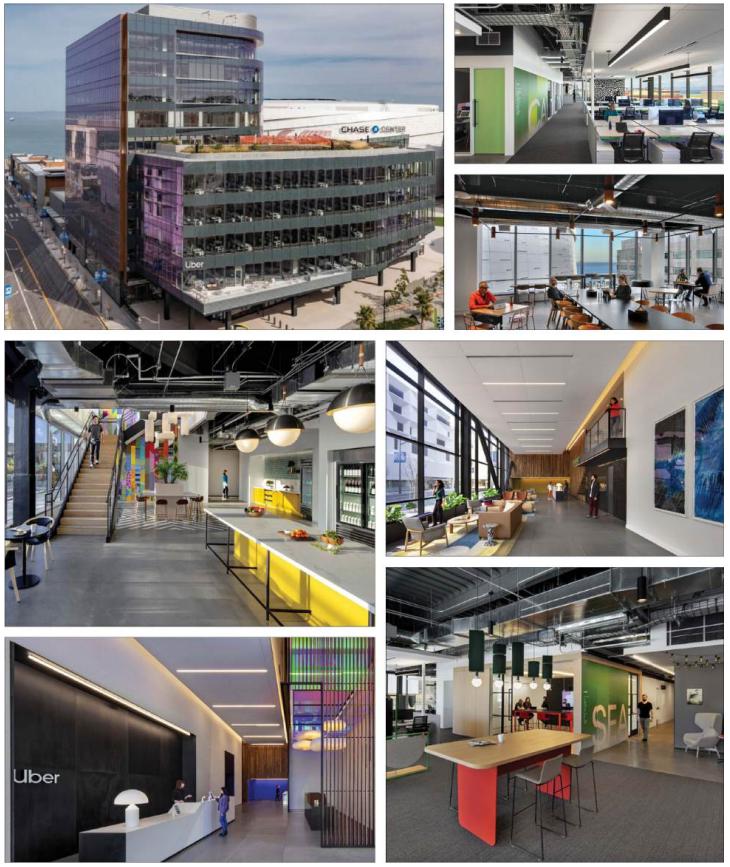
THE INFORMATION IN THIS STRUCTURAL AND COLLATERAL TERM SHEET IS NOT COMPLETE AND MAY BE AMENDED PRIOR TO THE TIME OF SALE. THIS TERM SHEET IS NOT AN OFFER TO SELL THESE SECURITIES AND IT IS NOT A SOLICITATION OF AN OFFER TO BUY THESE SECURITIES IN ANY JURISDICTION WHERE THE OFFER OR SALE IS NOT PERMITTED. | ||
| 99 | ||
| Structural and Collateral Term Sheet | BBCMS 2025-5C34 | |
| No. 9 – Uber Headquarters | ||
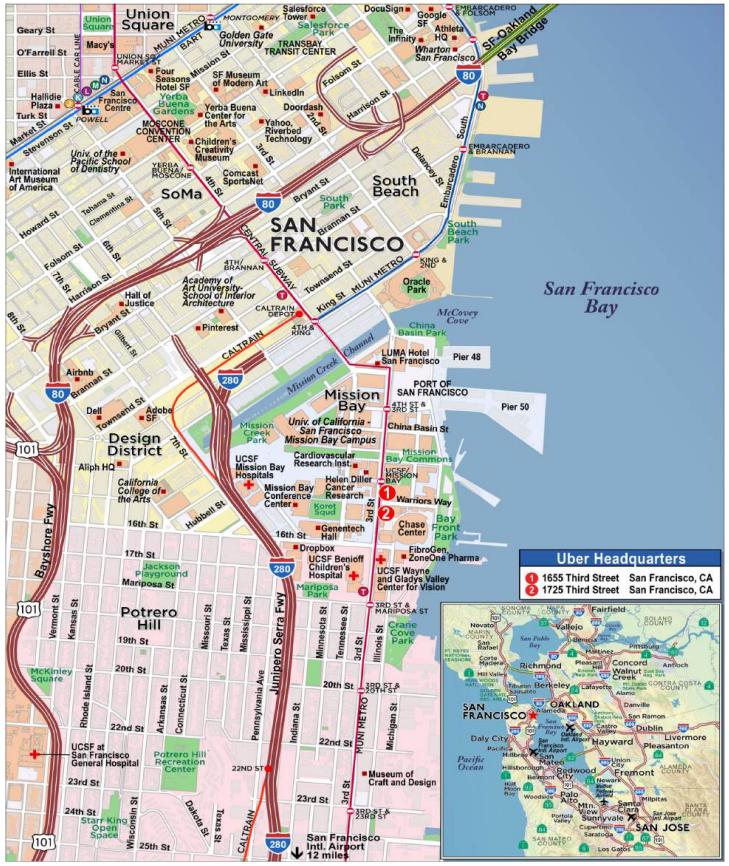
THE INFORMATION IN THIS STRUCTURAL AND COLLATERAL TERM SHEET IS NOT COMPLETE AND MAY BE AMENDED PRIOR TO THE TIME OF SALE. THIS TERM SHEET IS NOT AN OFFER TO SELL THESE SECURITIES AND IT IS NOT A SOLICITATION OF AN OFFER TO BUY THESE SECURITIES IN ANY JURISDICTION WHERE THE OFFER OR SALE IS NOT PERMITTED. | ||
| 100 | ||
| Structural and Collateral Term Sheet | BBCMS 2025-5C34 | |
| No. 9 – Uber Headquarters | ||
| Mortgage Loan Information | Property Information | |||
| Mortgage Loan Seller: | Barclays | Single Asset / Portfolio: | Portfolio | |
| Original Principal Balance(1): | $33,333,333 | Title: | Fee | |
| Cut-off Date Principal Balance(1): | $33,333,333 | Property Type – Subtype: | Office – CBD | |
| % of IPB: | 4.3% | Net Rentable Area (SF): | 586,208 | |
| Loan Purpose: | Refinance | Location: | San Francisco, CA | |
| Borrowers: | ECOP Tower I Owner LLC and ECOP Tower II Owner LLC | Year Built / Renovated: | 2019 / NAP | |
| Borrower Sponsors(2): | GSW ECOP LLC, GSW Real Estate Office Corp., ARE-San Francisco No. 55, LLC and Zwaschen, LLC | Occupancy: | 100.0% | |
| Interest Rate(3): | 5.87479028853782% | Occupancy Date: | 3/10/2025 | |
| Note Date: | 2/10/2025 | 4th Most Recent NOI (As of): | $41,347,402 (12/31/2021) | |
| Maturity Date(4): | 2/10/2030 | 3rd Most Recent NOI (As of): | $41,812,889 (12/31/2022) | |
| Interest-only Period: | 60 months | 2nd Most Recent NOI (As of): | $42,985,012 (12/31/2023) | |
| Original Term: | 60 months | Most Recent NOI (As of)(7): | $43,875,478 (12/31/2024) | |
| Original Amortization Term: | None | UW Economic Occupancy: | 97.1% | |
| Amortization Type: | Interest Only - ARD | UW Revenues: | $80,617,829 | |
| Call Protection(5): | L(24),YM1(3),DorYM1(26),O(7) | UW Expenses: | $24,264,058 | |
| Lockbox / Cash Management: | Hard / Springing | UW NOI(7): | $56,353,771 | |
| Additional Debt(1): | Yes | UW NCF: | $56,236,530 | |
| Additional Debt Balance(1): | $348,200,000 / $118,466,667 | Appraised Value / Per SF: | $753,000,000 / $1,285 | |
| Additional Debt Type(1): | Pari Passu / Subordinate Debt | Appraisal Date: | 12/6/2024 | |
| Escrows and Reserves(6) | Financial Information(1) | ||||||
| Initial | Monthly | Initial Cap | Senior Loan | Whole Loan | |||
| Taxes: | $0 | Springing | N/A | Cut-off Date Loan / SF: | $651 | $853 | |
| Insurance: | $0 | Springing | N/A | Maturity Date Loan / SF: | $651 | $853 | |
| Replacement Reserve: | $0 | Springing | N/A | Cut-off Date LTV: | 50.7% | 66.4% | |
| Other: | $1,243,750 | Springing | N/A | Maturity Date LTV: | 50.7% | 66.4% | |
| UW NCF DSCR: | 2.47x | 1.74x | |||||
| UW NOI Debt Yield: | 14.8% | 11.3% | |||||
| Sources and Uses | ||||||||
| Sources | Proceeds | % of Total | Uses | Proceeds | % of Total | |||
| Senior Loan(1) | $381,533,333 | 62.8 | % | Loan Payoff | $602,337,656 | 99.1 | % | |
| Subordinate Loan(1) | 118,466,667 | 19.5 | Closing Costs | 4,136,880 | 0.7 | |||
| Borrower Sponsor Equity | 107,718,286 | 17.7 | Upfront Reserves | 1,243,750 | 0.2 | |||
| Total Sources | $607,718,286 | 100.0 | % | Total Uses | $607,718,286 | 100.0 | % | |
| (1) | The Uber Headquarters mortgage loan (the “Uber Headquarters Mortgage Loan”) is part of a whole loan (the “Uber Headquarters Whole Loan”), which is evidenced by six senior pari passu promissory notes and two junior pari passu promissory notes with an aggregate principal balance as of the Cut-off Date of $500,000,000. |
| (2) | Uber Headquarters, an affiliate of the sole tenant, Uber (as defined below), is affiliated with one of the related borrower sponsors. |
| (3) | Interest Rate represents the weighted average interest rate of component A, component B and component C of the Uber Headquarters Mortgage Loan and the related senior pari passu companion notes, weighted on the basis of their respective principal balances. See “Description of the Mortgage Pool—Certain Calculations and Definitions—Definitions” in the Preliminary Prospectus. The interest rate of the B-Note of the Uber Headquarters Whole Loan is 7.95007131200079%. |
| (4) | Maturity Date is represented by the anticipated repayment date of February 10, 2030 with a final maturity of February 10, 2035. |
| (5) | Defeasance of the Uber Headquarters Whole Loan is permitted after the date that is the earlier of (i) two years from the closing date of the securitization that includes the last note to be securitized and (ii) March 10, 2028. The assumed defeasance lockout period is based on the anticipated closing date of the BBCMS 2025-5C34 securitization in May 2025. The actual defeasance lockout period may be longer. |
| (6) | See “Escrows and Reserves” below. |
| (7) | The increase between Most Recent NOI (As of) and UW NOI is primarily driven by underwriting the present value of contractual rent step increments for Uber's investment-grade credit rating though the lease term which resulted in approximately $12.5 million of additional revenue. |
The Loan. The Uber Headquarters mortgage loan is secured by the borrowers’ fee interest in a 586,208 square foot office property located in San Francisco, California (the “Uber Headquarters Property”). The Uber Headquarters Whole Loan is evidenced by six senior pari passu promissory notes with an aggregate outstanding principal balance as of the Cut-off Date of $381,533,333 (the “Uber Headquarters Senior Loan”) and two junior pari passu promissory notes with an aggregate outstanding principal balance of $118,466,667 (together with the Uber Headquarters Senior Loan, the “Uber Headquarters
THE INFORMATION IN THIS STRUCTURAL AND COLLATERAL TERM SHEET IS NOT COMPLETE AND MAY BE AMENDED PRIOR TO THE TIME OF SALE. THIS TERM SHEET IS NOT AN OFFER TO SELL THESE SECURITIES AND IT IS NOT A SOLICITATION OF AN OFFER TO BUY THESE SECURITIES IN ANY JURISDICTION WHERE THE OFFER OR SALE IS NOT PERMITTED. | ||
| 101 | ||
| Structural and Collateral Term Sheet | BBCMS 2025-5C34 | |
| No. 9 – Uber Headquarters | ||
Whole Loan”). The Uber Headquarters Whole Loan has a five-year term and is interest-only for the full term with an anticipated repayment date of February 10, 2030 (the “ARD”) and a final maturity date of February 10, 2035. The Uber Headquarters Senior Loan accrues interest at a fixed rate of 5.87479028853782% per annum on an Actual/360 basis, and the Uber Headquarters Whole Loan accrues at a fixed rate of 6.36649354041383% per annum on an Actual/360 basis. On or after the ARD, the interest rate of the Uber Headquarters Whole Loan will be the greater of (i) the initial interest rate plus 2.00% per annum or (ii) the 5-year U.S. Treasury rate plus (a) 2.03% plus (b) 2.00% per annum. The Uber Headquarters Mortgage Loan is evidenced by the non-controlling Notes A-2-C1 and A-2-C2 with an aggregate outstanding principal balance as of the Cut-off Date of $33,333,333.
The relationship between the holders of the Uber Headquarters Whole Loan is governed by a co-lender agreement as described under “Description of the Mortgage Pool—The Whole Loans—The Non-Serviced A/B Whole Loan” in the Preliminary Prospectus. The Uber Headquarters Whole Loan will be serviced under the trust and servicing agreement for the RIDE 2025-SHRE securitization trust. See “The Pooling and Servicing Agreement” in the Preliminary Prospectus.
The table below identifies the promissory notes that comprise the Uber Headquarters Whole Loan:
| Whole Loan Summary | ||||
| Note | Original Balance | Cut-off Date Balance | Note Holder | Controlling Piece |
| A-1-S1 | $178,920,000 | $178,920,000 | RIDE 2025-SHRE | Yes |
| A-1-C1 | 30,000,000 | 30,000,000 | Benchmark 2025-V14 | No |
| A-1-C2(1) | 20,000,000 | 20,000,000 | Goldman Sachs Bank USA | No |
| A-2-S1 | 119,280,000 | 119,280,000 | RIDE 2025-SHRE | No |
| A-2-C1 | 20,000,000 | 20,000,000 | BBCMS 2025-5C34 | No |
| A-2-C2 | 13,333,333 | 13,333,333 | BBCMS 2025-5C34 | No |
| B-1 | 71,080,000 | 71,080,000 | RIDE 2025-SHRE | No |
| B-2 | 47,386,667 | 47,386,667 | RIDE 2025-SHRE | No |
| Whole Loan | $500,000,000 | $500,000,000 | ||
| (1) | Expected to be contributed to one or more future securitization(s). |
The Property. The Uber Headquarters Property, located in the tech-centric Mission Bay neighborhood of San Francisco, is a Class A trophy office property consisting of two LEED Gold certified towers totaling 586,208 square feet. The two office towers were completed in 2019 and each consists of two condominium units – a retail condominium unit and an office condominium unit (the “Units”). Only the Units (and not the retail condominiums units or parking garage) are collateral for the Uber Headquarters Whole Loan. The Borrowers do not own the retail condominium units or the parking garage, but the Property includes easements benefiting the Uber Headquarters Property that permit Uber Technologies, Inc. (“Uber”) to use parking spaces in the parking garage. The Units serve as the consolidated headquarters of Uber. Uber executed 20-year leases for each of the Units prior to completion of the Uber Headquarters Property, and the Uber Headquarters Property was developed as an urban campus with floor-to-ceiling window systems, open desk configurations, wellness suites, a fitness room, several cafés, and landscaped roof terraces with views of the bay.
The Uber Headquarters Property is 100.0% leased to Uber, and affiliates of the borrower sponsors have continuously owned and operated the Uber Headquarters Property since it was developed in 2019. The leases for the 1655 Third Street building and 1725 Third Street building expire in October 2039 and September 2039, respectively, resulting in a combined weighted average remaining lease term of approximately 14.4 years. Both leases commenced in 2019 on a triple-net basis, and the current annual rental rate is $77.61 PSF with 3.0% annual rent escalations. Each lease is structured with a 14-year extension option and no termination options other than customary lease provisions related to casualty or condemnation. Uber has reported utilization at the Uber Headquarters Property of 100.0% with nearly 80.0% of employees in office on anchor days, Tuesday and Thursday, with peak attendance increasing approximately 45.0% over the past 12 months.
The borrower sponsors spent approximately $607.2 million on the acquisition and development of the Uber Headquarters Property, which was delivered in 2019, and an additional $52.2 million on tenant improvements and leasing commissions. Currently, the borrower sponsors have a collective cost basis of approximately $674.5 million and contributed approximately $107.7 million of cash equity to facilitate the refinance of this origination transaction.
THE INFORMATION IN THIS STRUCTURAL AND COLLATERAL TERM SHEET IS NOT COMPLETE AND MAY BE AMENDED PRIOR TO THE TIME OF SALE. THIS TERM SHEET IS NOT AN OFFER TO SELL THESE SECURITIES AND IT IS NOT A SOLICITATION OF AN OFFER TO BUY THESE SECURITIES IN ANY JURISDICTION WHERE THE OFFER OR SALE IS NOT PERMITTED. | ||
| 102 | ||
| Structural and Collateral Term Sheet | BBCMS 2025-5C34 | |
| No. 9 – Uber Headquarters | ||
Sole Tenant. Uber (586,208 square feet, 100.0% of NRA; 100.0% of underwritten base rent; NYSE: UBER). Uber was founded in 2009 and is headquartered in San Francisco, California. Uber is a multinational company known for its advancements in the transportation network industry. Uber established a ride-sharing business model and has diversified into fields such as food delivery with Uber Eats, freight transportation with Uber Freight, and has developed autonomous vehicles and aerial ridesharing. Uber underwent an IPO in 2019 and has since expanded its operations to over 10,000 cities in 70 countries worldwide servicing more than approximately 171.0 million monthly active users. Uber’s fourth quarter 2024 revenue was approximately $12.0 billion, and Uber’s total market capitalization is approximately $144.86 billion as of April 8, 2025.
Environmental. According to the Phase I environmental assessment dated December 23, 2024, there is no evidence of a recognized environmental condition at the Uber Headquarters Property.
The following table presents certain information relating to the historical and current occupancy of the Uber Headquarters Property:
| Historical and Current Occupancy | |||
| 2021(1) | 2022(1) | 2023(1) | Current(2) |
| 100.0% | 100.0% | 100.0% | 100.0% |
| (1) | Historical Occupancies are as of December 31 of each respective year. |
| (2) | Current Occupancy is as of March 10, 2025. |
The following table presents certain information relating to the sole tenant based on the net rentable area of the Uber Headquarters Property:
| Top Tenant Summary(1) | ||||||||
| Tenant | Ratings Fitch |
Net Rentable Area (SF) | % of Total NRA |
UW Base Rent PSF(2) | UW Base Rent(2) | % of Total UW Base Rent(2) |
Lease
Expiration Date | |
| Uber (1655) | Baa2/BBB-/BBB | 317,660 | 54.2 | % | $77.61 | $24,654,672 | 54.2% | 10/31/2039 |
| Uber (1725) | Baa2/BBB-/BBB | 268,548 | 45.8 | $77.61 | 20,842,923 | 45.8 | 9/30/2039 | |
| Occupied Collateral Total / Wtd. Avg. | 586,208 | 100.0 | % | $77.61 | $45,497,596 | 100.0% | ||
| Vacant Space | 0 | 0.0 | ||||||
| Collateral Total | 586,208 | 100.0 | % | |||||
| (1) | Based on the underwritten rent roll dated March 10, 2025. |
| (2) | UW Base Rent PSF, UW Base Rent and % of Total UW Base Rent include contractual rent steps through January 2026. |
THE INFORMATION IN THIS STRUCTURAL AND COLLATERAL TERM SHEET IS NOT COMPLETE AND MAY BE AMENDED PRIOR TO THE TIME OF SALE. THIS TERM SHEET IS NOT AN OFFER TO SELL THESE SECURITIES AND IT IS NOT A SOLICITATION OF AN OFFER TO BUY THESE SECURITIES IN ANY JURISDICTION WHERE THE OFFER OR SALE IS NOT PERMITTED. | ||
| 103 | ||
| Structural and Collateral Term Sheet | BBCMS 2025-5C34 | |
| No. 9 – Uber Headquarters | ||
The following table presents certain information relating to the tenant lease expirations at the Uber Headquarters Property:
| Lease Rollover Schedule(1)(2) | ||||||||||||
| Year | Number of Leases Expiring | Net Rentable Area Expiring | % of NRA Expiring | UW Base Rent Expiring(3) | % of UW Base Rent Expiring(3) | Cumulative Net Rentable Area Expiring | Cumulative % of NRA Expiring | Cumulative UW Base Rent Expiring(3) | Cumulative % of UW Base Rent Expiring(3) | |||
| Vacant | NAP | 0 | 0.0 | % | NAP | NA | P | 0 | 0.0% | NAP | NAP | |
| 2025 & MTM | 0 | 0 | 0.0 | $0 | 0.0 | % | 0 | 0.0% | $0 | 0.0% | ||
| 2026 | 0 | 0 | 0.0 | $0 | 0.0 | % | 0 | 0.0% | $0 | 0.0% | ||
| 2027 | 0 | 0 | 0.0 | $0 | 0.0 | % | 0 | 0.0% | $0 | 0.0% | ||
| 2028 | 0 | 0 | 0.0 | $0 | 0.0 | % | 0 | 0.0% | $0 | 0.0% | ||
| 2029 | 0 | 0 | 0.0 | $0 | 0.0 | % | 0 | 0.0% | $0 | 0.0% | ||
| 2030 | 0 | 0 | 0.0 | $0 | 0.0 | % | 0 | 0.0% | $0 | 0.0% | ||
| 2031 | 0 | 0 | 0.0 | $0 | 0.0 | % | 0 | 0.0% | $0 | 0.0% | ||
| 2032 | 0 | 0 | 0.0 | $0 | 0.0 | % | 0 | 0.0% | $0 | 0.0% | ||
| 2033 | 0 | 0 | 0.0 | $0 | 0.0 | % | 0 | 0.0% | $0 | 0.0% | ||
| 2034 | 0 | 0 | 0.0 | $0 | 0.0 | % | 0 | 0.0% | $0 | 0.0% | ||
| 2035 & Beyond | 2 | 586,208 | 100.0 | $45,497,596 | 100.0 | % | 586,208 | 100.0% | $45,497,596 | 100.0% | ||
| Total | 2 | 586,208 | 100.0 | % | $45,497,596 | 100.0 | % | |||||
| (1) | Based on the underwritten rent roll dated March 10, 2025. |
| (2) | Certain leases may have termination options that are exercisable prior to the originally stated expiration date of the lease and that are not considered in this Lease Rollover Schedule. |
| (3) | UW Base Rent Expiring, % of UW Base Rent Expiring, Cumulative UW Base Rent Expiring and Cumulative % of UW Base Rent Expiring include rent steps through January 2026. |
THE INFORMATION IN THIS STRUCTURAL AND COLLATERAL TERM SHEET IS NOT COMPLETE AND MAY BE AMENDED PRIOR TO THE TIME OF SALE. THIS TERM SHEET IS NOT AN OFFER TO SELL THESE SECURITIES AND IT IS NOT A SOLICITATION OF AN OFFER TO BUY THESE SECURITIES IN ANY JURISDICTION WHERE THE OFFER OR SALE IS NOT PERMITTED. | ||
| 104 | ||
| Structural and Collateral Term Sheet | BBCMS 2025-5C34 | |
| No. 9 – Uber Headquarters | ||
The following table presents certain information relating to the operating history and underwritten cash flows of the Uber Headquarters Property:
| Operating History and Underwritten Cash Flow(1) | ||||||
| 2021 | 2022 | 2023 | 2024(2) | UW(2) | UW Per SF | |
| Base Rental Revenue | $39,563,030 | $40,749,920 | $41,972,418 | $43,231,590 | $45,497,596 | $77.61 |
| Credit Tenant Rent Steps(3) | 0 | 0 | 0 | 0 | 12,503,761 | $21.33 |
| Total Reimbursement Revenue | 15,391,575 | 18,286,743 | 18,722,994 | 21,559,960 | 22,345,379 | $38.12 |
| Parking Income | 2,175,500 | 2,250,302 | 2,346,360 | 2,427,674 | 2,491,440 | $4.25 |
| Credit Tenant Parking Steps | 0 | 0 | 0 | 0 | 171,294 | $0.29 |
| Potential Gross Revenue | $57,130,105 | $61,286,965 | $63,041,772 | $67,219,224 | $83,009,470 | $141.60 |
| Less Vacancy & Credit Loss | 0 | 0 | 0 | 0 | (2,391,641) | ($4.08) |
| Effective Gross Income | $57,130,105 | $61,286,965 | $63,041,772 | $67,219,224 | $80,617,829 | $137.52 |
| Real Estate Taxes | 7,635,224 | 7,490,524 | 7,941,737 | 8,072,854 | 8,131,942 | $13.87 |
| Insurance | 975,676 | 1,399,895 | 1,545,981 | 2,658,435 | 2,597,270 | $4.43 |
| Utilities | 1,458,827 | 1,547,485 | 1,589,736 | 2,475,967 | 2,756,107 | $4.70 |
| Repairs & Maintenance | 1,800,244 | 3,108,761 | 2,299,951 | 3,568,882 | 3,300,296 | $5.63 |
| Management Fee | 791,261 | 814,998 | 839,449 | 864,632 | 909,952 | $1.55 |
| Payroll | 641,702 | 1,010,679 | 1,210,779 | 1,072,940 | 1,442,814 | $2.46 |
| General and Administrative | 705,929 | 2,017,233 | 2,146,287 | 2,189,162 | 2,313,593 | $3.95 |
| Other Expenses | 1,773,840 | 2,084,501 | 2,482,840 | 2,440,874 | 2,812,084 | $4.80 |
| Total Expenses | $15,782,703 | $19,474,076 | $20,056,760 | $23,343,746 | $24,264,058 | $41.39 |
| Net Operating Income | $41,347,402 | $41,812,889 | $42,985,012 | $43,875,478 | $56,353,771 | $96.13 |
| Replacement Reserves | 0 | 0 | 0 | 0 | 117,242 | $0.20 |
| TI/LC | 0 | 0 | 0 | 0 | 0 | $0.00 |
| Net Cash Flow | $41,347,402 | $41,812,889 | $42,985,012 | $43,875,478 | $56,236,530 | $95.93 |
| (1) | Based on the underwritten rent roll dated March 10, 2025 and inclusive of contractual rent steps through January 2026. |
| (2) | The increase between 2024 Net Operating Income and UW Net Operating Income is primarily driven by the inclusion of credit tenant rent steps. |
| (3) | Reflects present value of contractual rent step increments for Uber's investment-grade credit rating though the lease term. Contractual rent steps are approximately 3.0% per year until the last year of the lease term when rent is reduced to approximately $4.4 million. |
The Market. The Uber Headquarters Property is located within the Mission Bay micro-market of San Francisco, adjacent to the Chase Center, home of the Golden State Warriors NBA team. Mission Bay is a hub for technology companies and has experienced growth over the past decade with the development of Chase Center and the University of California San Francisco medical campus. Driven by the AI industry, many firms have recently taken occupancy in Mission Bay, including Cisco, Visa, OpenAI, CRISPR, Bayer, FibroGen, DropBox, and Kaiser Permanente. The Uber Headquarters Property also benefits from regional, national, and international connectively through the major thoroughfares located within two miles (US-101, I-280), a Caltrain stop located one minute away, and San Francisco International Airport, which is approximately 12.7 miles from the Uber Headquarters Property.
As of the third quarter of 2024, the Mission Bay submarket occupancy rate of 74.2% was slightly lower than the overall San Francisco market occupancy rate of 74.5%. Additionally, the submarket asking rent as of the third quarter of 2024 was $60.56 per square foot. According to the appraisal, as of the end of 2024, the average household income within a one-, three- and five-mile radius of the Uber Headquarters Property was $253,266, $193,227 and $202,592, respectively. The 2024 population within the same radii was 32,638, 404,610 and 690,064, respectively.
THE INFORMATION IN THIS STRUCTURAL AND COLLATERAL TERM SHEET IS NOT COMPLETE AND MAY BE AMENDED PRIOR TO THE TIME OF SALE. THIS TERM SHEET IS NOT AN OFFER TO SELL THESE SECURITIES AND IT IS NOT A SOLICITATION OF AN OFFER TO BUY THESE SECURITIES IN ANY JURISDICTION WHERE THE OFFER OR SALE IS NOT PERMITTED. | ||
| 105 | ||
| Structural and Collateral Term Sheet | BBCMS 2025-5C34 | |
| No. 9 – Uber Headquarters | ||
The following table presents certain information relating to comparable office rentals for the Uber Headquarters Property:
| Comparable Office Rentals(1) | |||||||
| Property Name / Location | Net Rentable Area (SF) | Occupancy | Tenant Name | Tenant Space | Base Rent | Lease Date | Lease Term (Yrs) |
|
Uber Headquarters(2) 1655 & 1725 Third Street San Francisco, CA |
586,208 | 100.0% | Uber | Office | $77.61 |
9-2019 10-2019 |
20.0 |
|
1090 Dr. Maya Angelou Lane San Francisco, CA |
70,000 | NAV | Golden State Warriors | Office | $75.00 | Apr-2025 | 10.0 |
|
500 Terry Francois Blvd. San Francisco, CA |
234,537 | NAV | Cisco | Office | $57.00 | Apr-2024 | 7.5 |
|
1455-1515 3rd Street San Francisco, CA |
486,600 | NAV | OpenAI | Office | $66.00 | Mar-2024 | 10.0 |
|
1090 Dr. Maya Angelou Lane San Francisco, CA |
30,378 | NAV | Capgemini | Office | $82.00 | Oct-2023 | 11.0 |
|
1800 Owens Street San Francisco, CA |
133,896 | NAV | VIR Biotechnology | Office | $76.20 | Jan-2022 | 12.0 |
| (1) | Source: Appraisal. |
| (2) | Based on the underwritten rent roll dated March 10, 2025 for the Uber Headquarters Property. |
The Borrowers. The borrowers are ECOP Tower I Owner LLC and ECOP Tower II Owner LLC, each a Delaware limited liability company and special purpose entity with two independent directors in its organizational structure. Legal counsel to the borrowers delivered a non-consolidation opinion in connection with the origination of the Uber Headquarters Whole Loan.
The Borrower Sponsors. The borrower sponsors are a joint venture between affiliates of Alexandria Real Estate Equities, Inc., Golden State Group, LLC and Uber. Founded in 1994, Alexandria Real Estate Equities, Inc. (NYSE: ARE) (“Alexandria”) is an S&P 500 company headquartered in Pasadena, California. Alexandria is a mission-driven, life science real estate investment trust. Alexandria is the owner, operator, and developer of collaborative Megacampus ecosystems in AAA life science innovation cluster locations, including Greater Boston, the San Francisco Bay Area, San Diego, Seattle, Maryland, Research Triangle, and New York City. As of December 31, 2024, Alexandria has a total market capitalization of $29.0 billion and is listed on the S&P 500. As of December 31, 2024, Alexandria’s asset base in North America includes approximately 39.8 million square feet of operating properties and 4.4 million RSF of Class A/A+ properties undergoing construction. The occupancy percentage of Alexandria’s operating properties in North America was 94.6% as of December 31, 2024.
Golden State Group LLC wholly owns Golden State Warriors LLC, which owns and operates the Golden State Warriors, a National Basketball Association franchise that plays in the Western Conference. Established in 1946 in Philadelphia, the Warriors franchise moved to the San Francisco Bay Area in 1962 and have won six NBA championships, including four since 2015. The team plays its home games at Chase Center, which is adjacent to the Uber Headquarters Property.
For information on Uber, please refer to the “Sole Tenant” section above.
Property Management. The Uber Headquarters Property is managed by ARE-San Francisco No. 68, LLC, a Delaware limited liability company.
Escrows and Reserves. At origination of the Uber Headquarters Whole Loan, the borrowers deposited approximately $1,243,750 for deferred maintenance.
Tax Reserve – The borrowers are not required to make monthly tax deposits of 1/12th of estimated annual taxes so long as no Cash Sweep Event (as defined below) has occurred and is continuing and/or so long as the Uber lease is in effect and requires Uber to pay such taxes and such taxes are paid prior to delinquency.
THE INFORMATION IN THIS STRUCTURAL AND COLLATERAL TERM SHEET IS NOT COMPLETE AND MAY BE AMENDED PRIOR TO THE TIME OF SALE. THIS TERM SHEET IS NOT AN OFFER TO SELL THESE SECURITIES AND IT IS NOT A SOLICITATION OF AN OFFER TO BUY THESE SECURITIES IN ANY JURISDICTION WHERE THE OFFER OR SALE IS NOT PERMITTED. | ||
| 106 | ||
| Structural and Collateral Term Sheet | BBCMS 2025-5C34 | |
| No. 9 – Uber Headquarters | ||
Insurance Reserve – The borrowers are not required to make monthly insurance deposits of 1/12th of estimated annual insurance premiums so long as no Cash Sweep Event has occurred and is continuing and/or the borrowers maintain a blanket policy acceptable to the lender.
Replacement Reserves - The borrowers are not required to make monthly replacement reserve deposits of approximately $9,770 so long as no Cash Sweep Event has occurred and is continuing.
Lease Termination Reserve – The borrowers are required to make deposits of (i) all sums paid to the borrowers (net of expenses to be paid by the borrowers and excluding any fee paid to the borrowers up to $25,000 per transaction) with respect to any rejection, termination, surrender or cancellation of any lease (including any bankruptcy case) or any lease buy-out or surrender payment of any tenant (including any payment relating to unamortized tenant improvements and/or leasing commissions) and (ii) any holdover rents or use and occupancy fees paid to the borrowers from any tenant or former tenant or any security deposit retained by the borrowers following an event of default under a lease, in each case, less any amounts expended by the borrowers in connection with such transactions. Uber has no unilateral termination options.
Common Charges Reserve – The borrowers are not required to make monthly deposits of 1/12th of estimated common charges for the next 12 months as long as (i) no event of default has occurred and is continuing, (ii) the common charges are being paid by Uber or paid by the borrowers on the due date and reimbursed to the borrowers pursuant to the Uber lease and (iii) the borrowers provide reasonable evidence of payment of such common charges.
Free Rent Reserve – The borrowers may, at their election, deposit with the lender any free rent amounts or rent abatement amounts that the borrowers desire to have included in the calculation of gross income from operations.
Lockbox / Cash Management. The Uber Headquarters Whole Loan is structured with a hard lockbox and springing cash management. The borrowers and the property manager, as applicable, are required to cause all rents to be deposited directly into a lender-controlled lockbox account within three business days of receipt. Each borrower has established an account with a lockbox bank from which all amounts in such account are disbursed to the borrowers’ operating account at the end of each business day. Upon the occurrence and during the continuance of a Cash Sweep Event, all funds in the lockbox account are required to be swept each business day to a cash management account under the control of the lender to be applied and disbursed in accordance with the Uber Headquarters Whole Loan documents.
A “Cash Sweep Event” will occur upon (i) an event of default, (ii) the debt service coverage ratio of the Uber Headquarters Whole Loan being less than 1.05x at the end of any fiscal quarter, (iii) a Lease Sweep Event (as defined below), and (iv) (x) if excess cash flow projected to be available during the next succeeding collection period (the “Projected Excess Cash Amount”) is not deposited into the excess cash flow reserve on or before the payment date that is two months prior to the ARD, the payment date that is one month prior to the ARD and (y) if the Projected Excess Cash Amount has been deposited into the excess cash flow reserve on or before the payment date that is two months prior to the ARD, the ARD.
A Cash Sweep Event will end when, with respect to clause (i) above, either (a) the cure of such event of default under the Uber Headquarters Whole Loan documents, (b) the borrower satisfying all of the conditions required by California state law, including payment of all amounts required to paid thereunder, to reinstate the Uber Headquarters Whole Loan or (c) the waiver of such event of default in writing by the lender, with respect to clause (ii) above, the debt service coverage ratio of the Uber Headquarters Whole Loan being greater than or equal to 1.05x for two consecutive calendar quarters provided that no event of default is continuing and with respect to clause (iii) above, a Lease Sweep Termination Event (as defined below).
A “Lease Sweep Event” means the occurrence of one or more of the following: (i) a monetary or material non-monetary event of default by the Specified Tenant (as defined below) under its lease, (ii) the bankruptcy of the Specified Tenant, (iii) the Specified Tenant providing notice to terminate its lease or vacate the premises, (iv) the Specified Tenant going dark in at least 25% of the rentable area of both Office Towers (as defined below) (or, after a partial release, the remaining Office Tower) (v) the Specified Tenant terminates, surrenders or rejects its lease or (vi) while Uber is the Specified Tenant, Uber no longer being Investment Grade Rated (as defined below) for two consecutive calendar quarters. “Investment Grade Rated” means a rating not less than “BBB-” by S&P, not less than “BBB-” by Fitch and not less than “Baa3” by Moody’s.
A “Lease Sweep Termination Event” will occur when with respect to clause (i) above, the event of default has been cured, with respect to clause (iii) above, such notice has been rescinded, with respect to clause (iv) above, the Specified Tenant recommencing operations in the premises in which it has gone dark or the Specified Tenant subleases the premises in
THE INFORMATION IN THIS STRUCTURAL AND COLLATERAL TERM SHEET IS NOT COMPLETE AND MAY BE AMENDED PRIOR TO THE TIME OF SALE. THIS TERM SHEET IS NOT AN OFFER TO SELL THESE SECURITIES AND IT IS NOT A SOLICITATION OF AN OFFER TO BUY THESE SECURITIES IN ANY JURISDICTION WHERE THE OFFER OR SALE IS NOT PERMITTED. | ||
| 107 | ||
| Structural and Collateral Term Sheet | BBCMS 2025-5C34 | |
| No. 9 – Uber Headquarters | ||
which it has gone dark to one or more subleases and such subtenant is either paying thereunder or has accepted the applicable premises, with respect to clause (vi) above, Uber being Investment Grade Rated for two consecutive calendar quarters and if the Lease Sweep Event is caused by any reason, the borrowers delivering one or more replacement leases, which may include subleases, provided that (a) each lease is a qualified lease and reasonably approved by the lender, (b) the replacement tenants are paying full contractual rent without right of offset for at least 85% of the rent payable under the Uber lease and (c) the borrowers have delivered an officer’s certificate to the lender certifying the foregoing.
The “Specified Tenant” is Uber or any successor tenant leasing substantially all of the Uber Headquarters Property.
Subordinate and Mezzanine Debt. The subordinate debt is evidenced by non-controlling Note B-1 and Note B-2 with an aggregate Cut-off Date principal balance of $118,466,667 (the “Uber Headquarters Subordinate Companion Loan”). The Uber Headquarters Subordinate Companion Loan is coterminous with the Uber Headquarters Senior Loan and accrues interest at 7.95007131200079% per annum. The Uber Headquarters Senior Loan is senior in right of payment to the Uber Headquarters Subordinate Companion Loan. The holders of the Uber Headquarters Senior Loan and the Uber Headquarters Companion Loan have entered into a co-lender agreement which sets forth the allocation of collections on the Uber Headquarters Whole Loan.
| Subordinate Note Summary | ||||||||
| B-Note Original Principal Balance | B-Note Interest Rate | Original Term (mos.) | Original Amort. Term (mos.) | Original IO Term (mos.) | Whole Loan UW NCF DSCR | Whole Loan UW NOI DY | Whole Loan Cutoff Date LTV | |
| Uber Headquarters Subordinate Companion Loan | $118,466,667 | (1) | 60 | 0 | 60 | 1.74x | 11.3% | 66.4% |
| (1) | The B Note Interest Rate equals 7.95007131200079%. |
Permitted Future Mezzanine Debt. Not permitted.
Partial Release. Following the earlier of (i) two years from the startup date of the securitization that holds the portion of the Uber Headquarters Whole Loan last to be securitized and (ii) the third anniversary of the first payment date, March 10, 2028, the borrowers will have the right to release an individual tower of the Uber Headquarters Property (an “Office Tower”) in conjunction with either (a) a sale to a third party unaffiliated with the borrowers or borrower sponsors or (b) the consummation of the right of GSW ECOP LLC and Zwaschen, LLC, after the occurrence of certain events, to exchange their interests in one Office Tower for the other joint venture member’s interest in the other Office Tower (each, a “Tower Release”) so long as the borrowers satisfy certain conditions and no event of default has occurred and is continuing, including without limitation: (i) partial defeasance in an amount of 115% of the allocated loan amount of the Office Tower being released, (ii) the lender receiving evidence that after such release, the remaining Office Tower continues to comply with applicable laws and requirements of all leases and such released Office Tower is not necessary for access, driveways, parking, utilities or drainage of the remaining Office Tower, (iii) payment to the lender of the then current fee assessed by the servicer for such release in addition to payment of out-of-pocket costs and expenses incurred by the lender or servicer for such release, (iv) the debt service coverage ratio as calculated under the loan documents with respect to the remaining Office Tower following the release equals or is greater than the debt service coverage ratio immediately prior to the release, (v) compliance with the REMIC and condominium document requirements as set forth in the loan documents including a maximum LTV of 125%, (vi) payment of all recording charges, filing fees, taxes, or other expenses in connection therewith and (vii) confirmation that the Uber lease or one more qualified leases or other replacement leases or subleases for the remaining Office Tower will still be in effect in accordance with its terms following the release. The allocated loan amount for the Office Tower owned by ECOP Tower I Owner LLC is $270,786,744 and the allocated loan amount for the Office Tower owned by ECOP Tower II Owner LLC is $229,213,256.
Ground Lease. None.
Condominium Regime. Each of the Office Towers is subject to a separate condominium regime, and each regime is comprised of (i) the Uber Headquarters Property (“Unit A”) and (ii) a non-collateral retail component (“Unit B”). In each instance, the applicable borrower is the managing owner under the related condominium documents, holds an 89% voting interest in the related condominium association and has the right to act on behalf of such condominium association, including entering into binding contracts, procuring insurance policies and processing insurance claims. However, any major decision requires the consent of both the related borrower and the Unit B owner. In the event the related borrower and the Unit B owner are unable to agree on a major decision, either party may request that such matter be submitted to alternative dispute resolution.
THE INFORMATION IN THIS STRUCTURAL AND COLLATERAL TERM SHEET IS NOT COMPLETE AND MAY BE AMENDED PRIOR TO THE TIME OF SALE. THIS TERM SHEET IS NOT AN OFFER TO SELL THESE SECURITIES AND IT IS NOT A SOLICITATION OF AN OFFER TO BUY THESE SECURITIES IN ANY JURISDICTION WHERE THE OFFER OR SALE IS NOT PERMITTED. | ||
| 108 | ||
| Structural and Collateral Term Sheet | BBCMS 2025-5C34 | |
| No. 10 – Avalon 8801 | ||
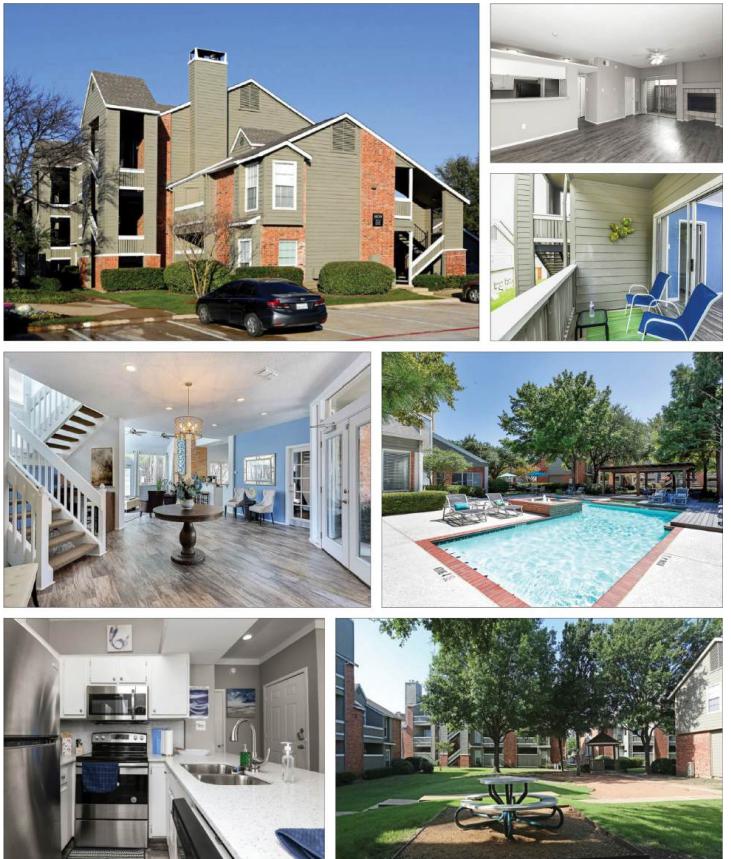
THE INFORMATION IN THIS STRUCTURAL AND COLLATERAL TERM SHEET IS NOT COMPLETE AND MAY BE AMENDED PRIOR TO THE TIME OF SALE. THIS TERM SHEET IS NOT AN OFFER TO SELL THESE SECURITIES AND IT IS NOT A SOLICITATION OF AN OFFER TO BUY THESE SECURITIES IN ANY JURISDICTION WHERE THE OFFER OR SALE IS NOT PERMITTED. | ||
| 109 | ||
| Structural and Collateral Term Sheet | BBCMS 2025-5C34 | |
| No. 10 – Avalon 8801 | ||
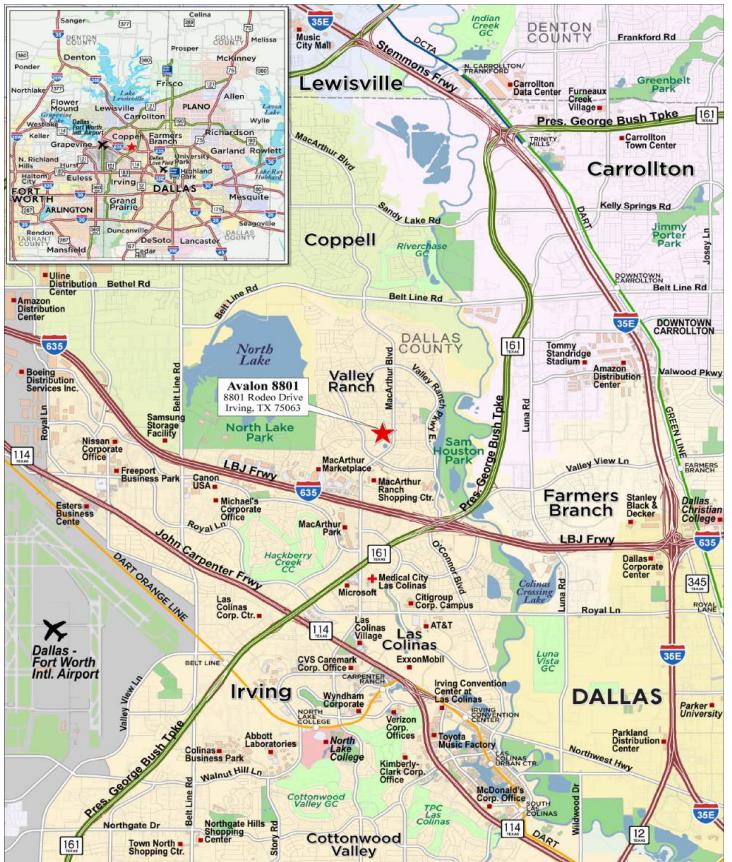
THE INFORMATION IN THIS STRUCTURAL AND COLLATERAL TERM SHEET IS NOT COMPLETE AND MAY BE AMENDED PRIOR TO THE TIME OF SALE. THIS TERM SHEET IS NOT AN OFFER TO SELL THESE SECURITIES AND IT IS NOT A SOLICITATION OF AN OFFER TO BUY THESE SECURITIES IN ANY JURISDICTION WHERE THE OFFER OR SALE IS NOT PERMITTED. | ||
| 110 | ||
| Structural and Collateral Term Sheet | BBCMS 2025-5C34 | |
| No. 10 – Avalon 8801 | ||
| Mortgage Loan Information | Property Information | |||
| Mortgage Loan Seller: | Barclays | Single Asset / Portfolio: | Single Asset | |
| Original Principal Balance: | $32,000,000 | Title(3): | Fee / Leasehold | |
| Cut-off Date Principal Balance: | $32,000,000 | Property Type – Subtype: | Multifamily - Garden | |
| % of Pool by IPB: | 4.1% | Net Rentable Area (Units): | 212 | |
| Loan Purpose: | Refinance | Location: | Irving, TX | |
| Borrower: | Avalon 8801 Leasehold, LLC | Year Built / Renovated: | 1986 / 2019 | |
| Borrower Sponsors(1): | Srihari Reddy Gandra and Jaspreeth Kaur | Occupancy: | 95.3% | |
| Interest Rate: | 6.60100% | Occupancy Date: | 2/10/2025 | |
| Note Date: | 3/25/2025 | 4th Most Recent NOI (As of): | $2,285,833 (12/31/2022) | |
| Maturity Date: | 4/6/2030 | 3rd Most Recent NOI (As of): | $2,334,314 (12/31/2023) | |
| Interest-only Period: | 60 months | 2nd Most Recent NOI (As of): | $2,722,131 (12/31/2024) | |
| Original Term: | 60 months | Most Recent NOI (As of): | $2,727,638 (TTM 1/31/2025) | |
| Original Amortization: | None | UW Economic Occupancy: | 95.0% | |
| Amortization Type: | Interest Only | UW Revenues: | $4,459,922 | |
| Call Protection: | L(24),YM1(29),O(7) | UW Expenses: | $1,712,313 | |
| Lockbox / Cash Management: | Springing | UW NOI: | $2,747,609 | |
| Additional Debt: | No | UW NCF: | $2,694,609 | |
| Additional Debt Balance: | N/A | Appraised Value / Per Unit: | $48,400,000 / $228,302 | |
| Additional Debt Type: | N/A | Appraisal Date: | 2/17/2025 | |
| Escrows and Reserves(2) | Financial Information | |||||
| Initial | Monthly | Initial Cap | Cut-off Date Loan / Unit: | $150,943 | ||
| Taxes: | $131,607 | $65,804 | N/A | Maturity Date Loan / Unit: | $150,943 | |
| Insurance: | $13,160 | $3,290 | N/A | Cut-off Date LTV: | 66.1% | |
| Replacement Reserves: | $0 | $4,417 | N/A | Maturity Date LTV: | 66.1% | |
| Deferred Maintenance: | $5,625 | $0 | N/A | UW NCF DSCR: | 1.26x | |
| PHFC Payments Reserve: | $0 | Springing | N/A | UW NOI Debt Yield: | 8.6% | |
| Sources and Uses | |||||||
| Sources | Proceeds | % of Total | Uses | Proceeds | % of Total | ||
| Mortgage Loan | $32,000,000 | 100.0% | Loan Payoff | $28,669,423 | 89.6 | % | |
| Closing Costs(4) | 2,341,615 | 7.3 | |||||
| Return of Equity | 838,570 | 2.6 | |||||
| Reserves | 150,392 | 0.5 | |||||
| Total Sources | $32,000,000 | 100.0% | Total Uses | $32,000,000 | 100.0 | % | |
| (1) | The Avalon 8801 Mortgage Loan (as defined below) and 6500 South Mortgage Loan have related borrowers. |
| (2) | For a full description of Escrows and Reserves see “Escrows and Reserves” below. |
| (3) | The Avalon 8801 Property (as defined below) is encumbered by a 99-year ground lease as part of the Pecos Housing Finance Corporation program (the “PHFC Program”). The Avalon 8801 Mortgage Loan is secured by the borrower’s leasehold interest and the Pecos Housing Finance Corporation’s (“PHFC”) fee interest in the Avalon 8801 Property. See “The Property” below for further information. |
| (4) | Closing Costs include a rate buydown fee of $1,280,000. |
The Loan. The Avalon 8801 mortgage loan (the “Avalon 8801 Mortgage Loan”) has an outstanding principal balance as of the Cut-off Date of $32,000,000 and is secured by the borrower’s leasehold interest and PHFC’s fee interest in a 212-unit garden style multifamily property located in Irving, Texas (the “Avalon 8801 Property”). The Avalon 8801 Mortgage Loan has a five-year term, is interest-only for the entire term and accrues interest at a fixed rate of 6.60100% per annum on an Actual/360 basis.
The Property. The Avalon 8801 Property is a 212-unit, garden style multifamily complex located in Irving, Texas that consists of 21 two- and three-story apartment buildings and a single-story leasing office/clubhouse building. The Avalon 8801 Property was originally constructed in 1986. Since acquiring the Avalon 8801 Property in 2019 for approximately $30.1 million, the borrower sponsors have invested approximately $3.3 million in renovations to the Avalon 8801 Property. Renovations include upgrades to the swimming pool area, clubhouse, roof, exterior siding, general building improvements and unit interior improvements such as new standard black or stainless-steel appliances, quartz countertops, cabinets and
THE INFORMATION IN THIS STRUCTURAL AND COLLATERAL TERM SHEET IS NOT COMPLETE AND MAY BE AMENDED PRIOR TO THE TIME OF SALE. THIS TERM SHEET IS NOT AN OFFER TO SELL THESE SECURITIES AND IT IS NOT A SOLICITATION OF AN OFFER TO BUY THESE SECURITIES IN ANY JURISDICTION WHERE THE OFFER OR SALE IS NOT PERMITTED. | ||
| 111 | ||
| Structural and Collateral Term Sheet | BBCMS 2025-5C34 | |
| No. 10 – Avalon 8801 | ||
doors and backsplash. 61 units have been partially upgraded with new black appliances and faux-wood vinyl flooring and an additional 73 units have been fully upgraded with new stainless-steel appliances, quartz countertops and faux-wood vinyl flooring. Since acquisition the borrower sponsors have been able to increase net operating income from approximately $1.5 million in 2020 to approximately $2.7 million as of the trailing twelve-month period ending January 2025.
The Avalon 8801 Property is encumbered by a 99-year ground lease as part of the PHFC Program. Pursuant to the program’s policies, a property will qualify for a 100% real estate tax exemption if it meets certain criteria, largely relating to affordable housing. Provisions specific to affordable housing concentration for the Avalon 8801 Property require that, pursuant to Chapter 394 of the Texas Local Government Code, 90% of units must be restricted at 140% Area Median Income (“AMI”), including 50% of units at 80% AMI or less. The Avalon 8801 Property currently complies with the AMI requirements and is pending approval from the related central appraisal district for the tax exemption. The lender has underwritten full property taxes as if the Avalon 8801 Property was not enrolled in the PHFC Program. It cannot be assured that the Avalon 8801 Property will be approved for the exemption.
The following table presents certain information relating to the unit mix at the Avalon 8801 Property:
| Unit Mix(1) | |||||||
Unit Type |
# of Units |
% of Total |
Occupied Units |
Occupancy |
Average Unit Size (SF) |
Average Monthly Rental Rate |
Monthly Market Rent per Unit(2) |
| 1BR/1BA | 78 | 36.8% | 73 | 93.6% | 705 | $1,455 | $1,504 |
| 2BR/2BA | 134 | 63.2% | 129 | 96.3% | 891 | $1,827 | $1,883 |
| Total/Wtd. Avg. | 212 | 100.0% | 202 | 95.3% | 822 | $1,692 | $1,744 |
| (1) | Source: underwritten rent roll as of February 10, 2025. |
| (2) | Source: Appraisal |
The following table presents certain information relating to the historical and current occupancy at the Avalon 8801 Property:
| Historical and Current Occupancy(1) | ||||
| 2021 | 2022 | 2023 | 2024 | Current(2) |
| 94.1% | 92.4% | 93.0% | 95.6% | 95.3% |
| (1) | Historical occupancies represent the average occupancy of each respective year. |
| (2) | Current occupancy is as of February 10, 2025. |
THE INFORMATION IN THIS STRUCTURAL AND COLLATERAL TERM SHEET IS NOT COMPLETE AND MAY BE AMENDED PRIOR TO THE TIME OF SALE. THIS TERM SHEET IS NOT AN OFFER TO SELL THESE SECURITIES AND IT IS NOT A SOLICITATION OF AN OFFER TO BUY THESE SECURITIES IN ANY JURISDICTION WHERE THE OFFER OR SALE IS NOT PERMITTED. | ||
| 112 | ||
| Structural and Collateral Term Sheet | BBCMS 2025-5C34 | |
| No. 10 – Avalon 8801 | ||
The following table presents certain information relating to the operating history and underwritten net cash flow of the Avalon 8801 Property:
| Operating History and Underwritten Net Cash Flow(1) | |||||||
| 2022 | 2023 | 2024 | TTM 1/31/2025 | Underwritten | Per Unit | %(2) | |
| Gross Potential Rent | $3,709,426 | $3,977,200 | $4,228,277 | $4,238,947 | $4,309,997 | $20,330 | 91.8% |
| Reimbursements | 301,682 | 309,965 | 363,786 | 362,951 | 365,991 | 1,726 | 7.8 |
| Parking Income | 23,090 | 17,487 | 18,376 | 18,666 | 18,666 | 88 | 0.4 |
| Net Rental Income | $4,034,198 | $4,304,652 | $4,610,439 | $4,620,564 | $4,694,654 | $22,145 | 100.0% |
| (Vacancy / Credit Loss) | (318,346) | (313,408) | (177,194) | (178,437) | (234,733) | (1,107) | (5.0) |
| Effective Gross Income | $3,715,852 | $3,991,244 | $4,433,245 | $4,442,127 | $4,459,922 | $21,037 | 95.0% |
| Real Estate Taxes(3) | 683,932 | 733,231 | 766,643 | 769,565 | 766,641 | 3,616 | 17.2 |
| Insurance | 115,269 | 159,552 | 116,598 | 112,839 | 113,054 | 533 | 2.5 |
| Utilities | 182,218 | 236,303 | 280,013 | 283,389 | 283,389 | 1,337 | 6.4 |
| Other Expenses | 448,599 | 527,844 | 547,861 | 548,695 | 549,229 | 2,591 | 12.3 |
| Total Expenses | $1,430,018 | $1,656,930 | $1,711,114 | $1,714,489 | $1,712,313 | $8,077 | 38.4% |
| Net Operating Income | $2,285,833 | $2,334,314 | $2,722,131 | $2,727,638 | $2,747,609 | $12,960 | 61.6% |
| Replacement Reserves | 0 | 0 | 0 | 0 | 53,000 | 250 | 1.2 |
| Net Cash Flow | $2,285,833 | $2,334,314 | $2,722,131 | $2,727,638 | $2,694,609 | $12,710 | 60.4% |
| (1) | Based on the underwritten rent roll as of February 10, 2025. |
| (2) | % column represents percent of (i) Net Rental Income for all revenue lines and (ii) Effective Gross Income for the remaining fields. |
| (3) | While the Avalon 8801 Property is expected to benefit from the PHFC Program and have 100.0% abated taxes, full property taxes were underwritten. Excluding real estate taxes, would increase the NCF DSCR (as defined below) from 1.26x to 1.62x and increase the UW NOI Debt Yield from 8.6% to 11.0%. |
Environmental. According to the Phase I environmental site assessment dated December 13, 2024, there was no evidence of any recognized environmental conditions at the Avalon 8801 Property.
The Market. The Avalon 8801 Property is located in Irving, Texas and is approximately 20 minutes from the Dallas Central Business District, 30 to 40 minutes from the Fort Worth Central Business District and 10 to 15 minutes from the Dallas/Fort Worth International Airport. The Avalon 8801 Property is part of the Dallas-Plano-Irving metropolitan area (the “Dallas MSA”). Job growth in the Dallas MSA has strengthened in recent months and job growth has surpassed the national rate. Some of the top ten employers in the Dallas MSA include Walmart, Lockheed Martin, AT&T, Southwest Airlines, Bank of America Corp. and JPMorgan Chase & Co. The Avalon 8801 Property is located a few blocks away from Interstate 635 which is a 37-mile partial loop around Dallas which features significant retail development in Irving.
The Valley Ranch submarket had a 7.1% vacancy rate and $1,556 asking rent per unit as of the end of 2024 which are both stronger than the Dallas/Fort Worth market vacancy rate of 11.2% and asking rent per unit of $1,532 as of the end of 2024. According to the appraisal, the 2024 population within a one-, three- and five-mile radius of the Avalon 8801 Property is 23,694, 88,869 and 214,146, respectively. The 2024 average household income within the same radii is $139,122, $153,052 and $141,279, respectively.
THE INFORMATION IN THIS STRUCTURAL AND COLLATERAL TERM SHEET IS NOT COMPLETE AND MAY BE AMENDED PRIOR TO THE TIME OF SALE. THIS TERM SHEET IS NOT AN OFFER TO SELL THESE SECURITIES AND IT IS NOT A SOLICITATION OF AN OFFER TO BUY THESE SECURITIES IN ANY JURISDICTION WHERE THE OFFER OR SALE IS NOT PERMITTED. | ||
| 113 | ||
| Structural and Collateral Term Sheet | BBCMS 2025-5C34 | |
| No. 10 – Avalon 8801 | ||
The following table presents certain information relating to comparable multifamily properties to the Avalon 8801 Property:
| Comparable Leasing Summary(1) | ||||||
| Property Address | Distance from Subject | Year Built / Renovated | Occupancy | Number of Units | Cap Rate | NOI per Unit |
|
Avalon 8801(2) 8801 Rodeo Drive Irving, TX |
NAP | 1986 / 2019 | 95.3% | 212 | 5.50% | $12,960 |
|
Lakeshore at Preston 3700 Preston Road Plano, TX |
20.8 mi | 1993 / 2022 | 93.0% | 302 | 5.00% | $10,596 |
|
Cortland Canyon Creek 850 Greenside Drive Richardson, TX |
21.6 mi | 2019 / NAV | 95.0% | 414 | 5.68% | $13,575 |
|
Reagan at Bear Creek 2001 Texas Highway 360 Euless, TX |
14.4 mi | 1998 / 2018 | 94.0% | 216 | 4.69% | $10,010 |
|
Sheridan Park at Spring Creek 2001 E Spring Creek Pkwy Plano, TX |
24.2 mi | 1999 / 2015 | 94.0% | 300 | 5.14% | $10,861 |
|
Provenza at Windhaven 4900 Windhaven Parkway The Colony, TX |
13.4 mi | 2013 / NAV | 93.0% | 324 | 5.24% | $11,326 |
|
Devi at Valley Ranch 621 Cowboys Parkway Irving, TX |
1.5 mi | 1998 / NAV | 90.0% | 267 | 5.47% | $11,667 |
|
Madison at Melrose Apartments 1520 Richardson Drive Richardson, TX |
17.3 mi | 1995 / 2021 | 91.0% | 200 | 5.66% | $12,449 |
| (1) | Source: Appraisal. |
| (2) | Occupancy, Number of Units and NOI per Unit are based on the underwritten rent roll dated February 10, 2025. |
The Borrower. The borrower is Avalon 8801 Leasehold, LLC, a Delaware limited liability company and newly formed special purpose entity with one independent director. Legal counsel to the borrower provided a non-consolidation opinion in connection with the origination of the Avalon 8801 Mortgage Loan.
The Borrower Sponsors. The borrower sponsors and non-recourse carveout guarantors are Srihari Reddy Gandra and Jaspreeth Kaur. Srihari Reddy Gandra and Jaspreeth Kaur have over 20 combined years of real estate experience, and are co-founders of Sahara Equity LLC, a real estate investment firm that specializes in acquisitions and management of multifamily properties across the Dallas/Fort Worth metroplex. Since its creation, Sahara Equity LLC has accumulated a portfolio consisting of 17 multifamily properties and over $250 million of assets.
Property Management. The Avalon 8801 Property is managed by Meticulous Management, LLC d.b.a Mars Residential, an affiliate of the borrower sponsors.
Escrows and Reserves. At origination, the borrower deposited into escrow (i) approximately $131,607 for real estate taxes, (ii) approximately $13,160 for insurance premiums and (iii) $5,625 for immediate repairs.
Tax Escrows – The borrower is required to escrow 1/12th of the annual estimated tax payments on a monthly basis, which currently equates to approximately $65,804.
The borrower will not be required to make monthly tax reserve payments from and after the date (y) the tax exemption is formally granted by the applicable central appraisal district and (z) the borrower provides the lender on an annual basis a copy of the tax bill or other written evidence to verify that the tax exemption is in place and no property taxes are due.
THE INFORMATION IN THIS STRUCTURAL AND COLLATERAL TERM SHEET IS NOT COMPLETE AND MAY BE AMENDED PRIOR TO THE TIME OF SALE. THIS TERM SHEET IS NOT AN OFFER TO SELL THESE SECURITIES AND IT IS NOT A SOLICITATION OF AN OFFER TO BUY THESE SECURITIES IN ANY JURISDICTION WHERE THE OFFER OR SALE IS NOT PERMITTED. | ||
| 114 | ||
| Structural and Collateral Term Sheet | BBCMS 2025-5C34 | |
| No. 10 – Avalon 8801 | ||
Insurance Escrow – In the event that the borrower does not maintain an acceptable blanket policy, the borrower is required to escrow 1/12th of the annual estimated insurance premiums on a monthly basis. The Avalon 8801 Property is currently under a blanket policy for property coverage but not liability coverage, thus the monthly insurance escrow is in place (which currently equates to approximately $3,290).
Replacement Reserve – On a monthly basis, the borrower is required to escrow approximately $4,417 for replacement reserves ($250 per unit annually).
PHFC Payments Reserves – The lender is required to maintain a subaccount (the “PHFC Payments Subaccount”) as a reserve for the PHFC Payments (as defined below). Neither the borrower or the lender is required to make monthly deposits under the PHFC Program documents in the PHFC Payments Subaccount so long as (i) no event of default under the Avalon 8801 Mortgage Loan documents has occurred and is continuing, (ii) the borrower delivers to lender sufficient evidence that the PHFC Payments due under the PHFC Program documents are paid on or prior to the applicable due date and (iii) the NCF DSCR is greater than or equal to 1.26x and the net cash flow debt yield is greater than or equal to 8.42%. To the extent deposits are required, the borrower will be required to pay to the lender an amount that is estimated by the lender to be sufficient to pay the next monthly or annual installment of the PHFC Payments due under the PHFC Program documents, and the lender will transfer such amounts to the PHFC Payments Subaccount. Provided no event of default has occurred or is continuing, the lender will apply the remaining funds in the PHFC Payments Subaccount to make the PHFC Payments required by the borrower under the PHFC Program documents.
The Avalon 8801 Mortgage loan is structured with recourse to the borrower sponsors up to the amount of any property taxes due because of the Avalon 8801 Property not receiving the full tax exemption or because of the termination of the PHFC Program documents.
Lockbox / Cash Management. The Avalon 8801 Mortgage Loan is structured with a springing lockbox and springing cash management. From and after the occurrence of a Cash Management Period (as defined below), the borrower is required to establish and maintain a lockbox account and will cause all rents received by the property manager or borrower with respect to the Avalon 8801 Property to be deposited into such lockbox account within three business days of receipt. During a Cash Management Period, funds deposited into the lockbox account are to be swept on a daily basis into a cash management account and disbursed in accordance with the Avalon 8801 Mortgage Loan documents, which includes reserving remaining available cash in an excess cash flow reserve account.
A “Cash Management Period” will commence upon the earliest of the following: (i) the stated maturity date of April 6, 2030, (ii) the occurrence of an event of default under the Avalon 8801 Mortgage Loan documents or (iii) the net cash flow debt service coverage ratio (“NCF DSCR”) is less than 1.15x for two consecutive calendar quarters.
A Cash Management Period will end, with regard to: (a) clause (i) above, the stated maturity date has not occurred or the loan has been repaid in full, (b) clause (ii) above, upon the cure of such event of default and (c) clause (iii) above, upon the NCF DSCR being equal to or greater than 1.20x for two consecutive calendar quarters.
Subordinate and Mezzanine Debt. None.
Permitted Future Mezzanine Debt. Not permitted.
Partial Release. Not permitted.
Ground Lease. At origination, (i) the borrower entered into a ground lease as ground lessee with PHFC as ground lessor, and (ii) Tarillas Avalon 8801, LLC was appointed as the managing member of the borrower (0.01% membership interest). Pursuant to the ground lease, which is scheduled to terminate on March 31, 2124 with no extensions, and other documents and agreements entered into relation to the tax exemption, the borrower is required to pay:
| (i) | a one-time closing fee of $200,000 due at origination of the Avalon 8801 Mortgage Loan, |
| (ii) | an annual savings fee equal to 10% of the 2025 real estate taxes with 2.0% annual increases, which is initially $76,664, and |
| (iii) | an annual compliance fee of $100 per unit with 2.0% annual increases which is initially $21,200. |
THE INFORMATION IN THIS STRUCTURAL AND COLLATERAL TERM SHEET IS NOT COMPLETE AND MAY BE AMENDED PRIOR TO THE TIME OF SALE. THIS TERM SHEET IS NOT AN OFFER TO SELL THESE SECURITIES AND IT IS NOT A SOLICITATION OF AN OFFER TO BUY THESE SECURITIES IN ANY JURISDICTION WHERE THE OFFER OR SALE IS NOT PERMITTED. | ||
| 115 | ||
| Structural and Collateral Term Sheet | BBCMS 2025-5C34 | |
| No. 10 – Avalon 8801 | ||
The borrower may terminate the ground lease at any time upon (i) delivery of written notice of such termination no later than thirty days prior to the date of termination, and (ii) payment of a $100 termination fee. However, PHFC holds the right, as outlined in the PHFC Program documents, to purchase the Avalon 8801 Property or the borrower’s fee interest (the “Acquisition Option”), within the thirty-day period prior to the early termination of the ground lease. If PHFC chooses not to exercise the Acquisition Option, PHFC must convey the fee interest back to the borrower and the ground lease will be terminated.
THE INFORMATION IN THIS STRUCTURAL AND COLLATERAL TERM SHEET IS NOT COMPLETE AND MAY BE AMENDED PRIOR TO THE TIME OF SALE. THIS TERM SHEET IS NOT AN OFFER TO SELL THESE SECURITIES AND IT IS NOT A SOLICITATION OF AN OFFER TO BUY THESE SECURITIES IN ANY JURISDICTION WHERE THE OFFER OR SALE IS NOT PERMITTED. | ||
| 116 | ||
| Structural and Collateral Term Sheet | BBCMS 2025-5C34 | |
| No. 11 – NJ Asden Portfolio | ||
| Mortgage Loan Information | Property Information | |||
| Mortgage Loan Seller: | CREFI | Single Asset / Portfolio: | Portfolio | |
| Original Principal Balance(1): | $30,000,000 | Title: | Fee | |
| Cut-off Date Principal Balance(1): | $30,000,000 | Property Type – Subtype: | Multifamily - High Rise | |
| % of Pool by IPB: | 3.8% | Net Rentable Area (Units): | 1,011 | |
| Loan Purpose: | Refinance | Location(4): | Various, NJ | |
| Borrowers(2): | Various | Year Built / Renovated(4): | Various / 2019-2024 | |
| Borrower Sponsor: | Asden (US) Inc. | Occupancy: | 96.2% | |
| Interest Rate: | 6.13000% | Occupancy Date: | 3/6/2025 | |
| Note Date: | 4/4/2025 | 4th Most Recent NOI (As of)(5): | $5,415,342 (12/31/2021) | |
| Maturity Date: | 4/6/2030 | 3rd Most Recent NOI (As of)(5): | $4,550,202 (12/31/2022) | |
| Interest-only Period: | 60 months | 2nd Most Recent NOI (As of)(5): | $6,761,467 (12/31/2023) | |
| Original Term: | 60 months | Most Recent NOI (As of)(6): | $7,162,394 (12/31/2024) | |
| Original Amortization: | None | UW Economic Occupancy: | 94.0% | |
| Amortization Type: | Interest Only | UW Revenues: | $16,810,167 | |
| Call Protection(3): | L(25),D(28),O(7) | UW Expenses: | $8,824,754 | |
| Lockbox / Cash Management: | Springing | UW NOI(6): | $7,985,413 | |
| Additional Debt(1): | Yes | UW NCF: | $7,682,207 | |
| Additional Debt Balance(1): | $60,000,000 | Appraised Value / Per Unit(7): | $143,400,000 / $141,840 | |
| Additional Debt Type(1): | Pari Passu | Appraisal Date(7): | 3/6/2025 | |
| Escrows and Reserves | |||
| Initial | Monthly | Initial Cap | |
| Taxes: | $483,686 | $241,843 | N/A |
| Insurance: | $0 | Springing | N/A |
| Replacement Reserves: | $0 | $25,267 | N/A |
| Deferred Maintenance: | $413,203 | $0 | N/A |
| Financial Information(1) | |
| Cut-off Date Loan / Unit: | $89,021 |
| Maturity Date Loan / Unit: | $89,021 |
| Cut-off Date LTV: | 62.8% |
| Maturity Date LTV: | 62.8% |
| UW NCF DSCR: | 1.37x |
| UW NOI Debt Yield: | 8.9% |
| Sources and Uses | |||||||
| Sources | Proceeds | % of Total | Uses | Proceeds | % of Total | ||
| Whole Loan(1) | $90,000,000 | 86.5 | % | Loan Payoff(8) | $97,864,638 | 94.1 | % |
| Borrower Sponsor Equity | 14,040,330 | 13.5 | Closing Costs(9) | 5,278,803 | 5.1 | ||
| Upfront Reserves | 896,889 | 0.9 | |||||
| Total Sources | $104,040,330 | 100.0 | % | Total Uses | $104,040,330 | 100.0 | % |
| (1) | The NJ Asden Portfolio Mortgage Loan (as defined below) is part of a whole loan evidenced by three pari passu promissory notes with an aggregate outstanding principal balance as of the Cut-off Date of $90,000,000 (the “NJ Asden Portfolio Whole Loan”). The information under Financial Information in the chart above is based on the aggregate outstanding principal balance as of the Cut-off Date of the NJ Asden Portfolio Whole Loan. |
| (2) | The borrowers are 44 S Munn LLC, 77 S Munn LLC, 175 Prospect LLC, 40 Washington Towers LLC, 777 W State LLC and 610 Sewall Ave Towers LLC. |
| (3) | Defeasance of the NJ Asden Portfolio Whole Loan is permitted at any time after the earlier to occur of (a) the end of the two-year period commencing on the closing date of the securitization of the last promissory note representing a portion of the NJ Asden Portfolio Whole Loan to be securitized and (b) April 4, 2029. The assumed defeasance lockout period of 25 payments is based on the anticipated closing date of the BBCMS 2025-5C34 securitization in May 2025. The actual lockout period may be longer. |
| (4) | See “Portfolio Summary” below. |
| (5) | The decrease from 4th Most Recent NOI to 3rd Most Recent NOI and subsequent increase to 2nd Most Recent NOI is primarily attributable to fluctuations in repairs and maintenance expenses. In 2021 and 2022, repairs and maintenance included heavy HVAC related costs and a security contract that was not renewed in 2023. |
| (6) | The increase from Most Recent NOI to UW NOI is primarily attributable to a reduction in payroll and benefits expense for which historical periods incorrectly included time and payment attributable to other properties the borrower sponsor owns. |
| (7) | Represents the “as portfolio” appraised value of the NJ Asden Portfolio Properties (as defined below), which reflects a portfolio premium of approximately 4.1% over the aggregate “As-Is” Appraised Values of the individual NJ Asden Portfolio Properties and is based on the extraordinary assumption that the entire portfolio is marketed to a single purchaser. The aggregate of the “As-Is” Appraised Values of the NJ Asden Portfolio Properties as of the appraisals dated between March 4, 2025 to March 6, 2025 is $137,800,000, which results in a Cut-off Date LTV and Maturity Date LTV of 65.3% each, |
| (8) | The prior loan secured by the NJ Asden Portfolio Properties in the amount of $105,000,000 was originated by New York Community Bank, which in the fourth quarter of 2024 was rebranded as Flagstar Bank. As part of Flagstar Bank’s recent restructuring efforts, the borrower sponsor agreed to buy back the prior loan at a price of $100,000,000 (a $5,000,000 discount from the outstanding balance). The loan payoff amount of $97,864,638 represents the loan payoff net of reserves. |
| (9) | Closing Costs include a rate buydown fee of $3,150,000. |
THE INFORMATION IN THIS STRUCTURAL AND COLLATERAL TERM SHEET IS NOT COMPLETE AND MAY BE AMENDED PRIOR TO THE TIME OF SALE. THIS TERM SHEET IS NOT AN OFFER TO SELL THESE SECURITIES AND IT IS NOT A SOLICITATION OF AN OFFER TO BUY THESE SECURITIES IN ANY JURISDICTION WHERE THE OFFER OR SALE IS NOT PERMITTED. | ||
| 117 | ||
| Structural and Collateral Term Sheet | BBCMS 2025-5C34 | |
| No. 11 – NJ Asden Portfolio | ||
The Loan. The NJ Asden Portfolio mortgage loan (the “NJ Asden Portfolio Mortgage Loan”) is secured by the borrowers’ fee interests in a six property, 1,011-unit high rise multifamily portfolio located in East Orange, Trenton, and Asbury Park, New Jersey (the “NJ Asden Portfolio Properties”). The NJ Asden Portfolio Whole Loan is evidenced by three pari passu promissory notes with an aggregate outstanding principal balance as of the Cut-off Date of $90,000,000. The NJ Asden Portfolio Whole Loan has an initial term of five years, is interest-only for the full term and accrues interest at a fixed rate of 6.13000% per annum on an Actual/360 basis. The NJ Asden Portfolio Mortgage Loan is evidenced by the non-controlling Note A-2 with an outstanding principal balance as of the Cut-off Date of $30,000,000.
The table below identifies the promissory notes that comprise the NJ Asden Portfolio Whole Loan. The relationship between the holders of the NJ Asden Portfolio Whole Loan is governed by a co-lender agreement as described under “Description of the Mortgage Pool—The Whole Loans—The Serviced Pari Passu Whole Loans” and “—The Non-Serviced Pari Passu Whole Loans” in the Preliminary Prospectus. The NJ Asden Portfolio Whole Loan will be serviced under the pooling and servicing agreement for the BBCMS 2025-5C34 securitization trust until the securitization of the controlling Note A-1, at which point it will be serviced under the pooling and servicing agreement for such securitization. See “The Pooling and Servicing Agreement” in the Preliminary Prospectus.
| Whole Loan Summary | ||||
| Note | Original Balance | Cut-off Date Balance | Note Holder | Controlling Piece |
| A-1(1) | $40,000,000 | $40,000,000 | CREFI | Yes |
| A-2 | $30,000,000 | $30,000,000 | BBCMS 2025-5C34 | No |
| A-3(1) | $20,000,000 | $20,000,000 | CREFI | No |
| Whole Loan | $90,000,000 | $90,000,000 | ||
| (1) | Expected to be contributed to one or more future securitization trusts. |
The Properties. The NJ Asden Portfolio Properties are comprised of six high-rise multifamily properties totaling 1,011 units located in East Orange, Asbury Park and Trenton, New Jersey. As of March 6, 2025, the NJ Asden Portfolio Properties were 96.2% occupied. Approximately 25 units across the portfolio receive Section 8 assistance. In addition, the NJ Asden Portfolio Properties are located in cities that have enacted limitations on rent increases.
The following table presents certain information relating to the NJ Asden Portfolio Properties:
| Portfolio Summary | ||||||||
|
Property Name |
Location(1) |
Year Built / Renovated(1) |
# of Units(2) |
Occ.(2) |
Allocated |
% of ALA |
% of UW NOI(2) |
Appraised Value(1) |
| Monroe Tower | Asbury Park, NJ | 1963 / 2019-2024 | 261 | 93.5% | $35,455,500 | 39.4% | 39.0% | $51,200,000 |
| Executive House | East Orange, NJ | 1965 / 2019-2024 | 228 | 96.9% | $21,435,500 | 23.8% | 23.6% | $32,500,000 |
| Washington Towers | East Orange, NJ | 1964 / 2019-2024 | 197 | 96.4% | $12,871,500 | 14.3% | 14.2% | $18,750,000 |
| Ambassador Tower | East Orange, NJ | 1960 / 2019-2024 | 161 | 97.5% | $10,561,500 | 11.7% | 11.9% | $18,500,000 |
| Lafayette House | Trenton, NJ | 1965 / 2019-2024 | 89 | 97.8% | $5,427,500 | 6.0% | 6.3% | $8,900,000 |
| Munn Heritage | East Orange, NJ | 1918 / 2019-2024 | 75 | 98.7% | $4,248,500 | 4.7% | 5.1% | $7,950,000 |
| Total/ Wtd. Avg | 1,011 | 96.2% | $90,000,000 | 100.0% | 100.0% | $143,400,000(3) | ||
| (1) | Source: Appraisals. |
| (2) | Based on the underwritten rent rolls dated March 6, 2025. |
| (3) | Total Appraised Value represents the “as portfolio” appraised value of the NJ Asden Portfolio Properties, which reflects a portfolio premium of approximately 4.1% over the aggregate “As-Is” Appraised Values of the individual NJ Asden Portfolio Properties and is based on the extraordinary assumption that the entire portfolio is marketed to a single purchaser. The aggregate of the “As-Is” Appraised Values of the NJ Asden Portfolio Properties as of the appraisals dated between March 4, 2025 to March 6, 2025 is $137,800,000. |
Monroe Tower
The Monroe Tower property consists of a 15-story, 261-unit, high-rise multifamily property located in Asbury Park, New Jersey (the “Monroe Tower Property”). The Monroe Tower Property was originally constructed in 1963 and most recently renovated from 2019 to 2024. Renovation costs totaled approximately $3,922,064 and included renovations to 120 units as well as the common areas at the Monroe Tower Property. The Monroe Tower Property has a unit mix of 176 one-bedroom units, 84 two-bedroom units, and one three-bedroom unit. Amenities at the Monroe Tower Property include an on-site laundry, an Amazon package center, and bike storage. The Monroe Tower Property also features 261 parking spaces, resulting in a parking ratio of 1.00 spaces per unit. As of March 6, 2025, the Monroe Tower Property was 93.5% leased.
THE INFORMATION IN THIS STRUCTURAL AND COLLATERAL TERM SHEET IS NOT COMPLETE AND MAY BE AMENDED PRIOR TO THE TIME OF SALE. THIS TERM SHEET IS NOT AN OFFER TO SELL THESE SECURITIES AND IT IS NOT A SOLICITATION OF AN OFFER TO BUY THESE SECURITIES IN ANY JURISDICTION WHERE THE OFFER OR SALE IS NOT PERMITTED. | ||
| 118 | ||
| Structural and Collateral Term Sheet | BBCMS 2025-5C34 | |
| No. 11 – NJ Asden Portfolio | ||
Executive House
The Executive House property consists of a 23-story, 228-unit, high-rise multifamily property located in East Orange, New Jersey (the “Executive House Property”). The Executive House Property was originally constructed in 1965 and most recently renovated from 2019 to 2024. Renovation costs totaled approximately $6,080,701 and included renovations to 101 units as well as the common areas at the Executive House Property. The Executive House Property has a unit mix of 41 studio units, 135 one-bedroom units, 39 two-bedroom units, and 13 three-bedroom units. Amenities at the Executive House Property include an on-site laundry, tennis courts, and an outdoor swimming pool. The Executive House Property also features 239 parking spaces, resulting in a parking ratio of approximately 1.05 spaces per unit. As of March 6, 2025, the Executive House Property was 96.9% leased.
Washington Towers
The Washington Towers property consists of a 14-story, 197-unit, high-rise multifamily property located in East Orange, New Jersey (the “Washington Towers Property”). The Washington Towers Property was originally constructed in 1964 and most recently renovated from 2019 to 2024. Renovation costs totaled approximately $2,237,882 and included renovations to 76 units as well as the common areas at the Washington Towers Property. The Washington Towers Property has a unit mix of 70 studio units, 98 one-bedroom units, and 29 two-bedroom units. Amenities at the Washington Towers Property include an on-site laundry and 170 parking spaces, resulting in a parking ratio of approximately 0.86 spaces per unit. As of March 6, 2025, the Washington Towers Property was 96.4% leased.
Ambassador Tower
The Ambassador Tower property consists of a nine-story, 161-unit, high-rise multifamily property located in East Orange, New Jersey (the “Ambassador Tower Property”). The Ambassador Tower Property was originally constructed in 1960 and most recently renovated from 2019 to 2024. Renovation costs totaled approximately $2,808,917 and included renovations to 47 units as well as the common areas at the Ambassador Tower Property. The Ambassador Tower Property has a unit mix of two studio units, 120 one-bedroom units, and 39 two-bedroom units. Amenities at the Ambassador Tower Property include an on-site laundry, an Amazon package center, and bike storage. The Ambassador Tower Property also features 181 parking spaces, resulting in a parking ratio of approximately 1.12 spaces per unit. As of March 6, 2025, the Ambassador Tower Property was 97.5% leased.
Lafayette House
The Lafayette House property consists of a 12-story, 89-unit, high-rise multifamily property located in Trenton, New Jersey (the “Lafayette House Property”). The Lafayette House Property was originally constructed in 1965 and most recently renovated from 2019 to 2024. Renovation costs totaled approximately $1,604,553 and included renovations to 48 units as well as the common areas at the Lafayette House Property. The Lafayette House Property has a unit mix of 67 one-bedroom units and 22 two-bedroom units. Amenities at the Lafayette House Property include an onsite laundry and electric vehicle charging stations. The Lafayette House Property also features 106 parking spaces, resulting in a parking ratio of approximately 1.19 spaces per unit. As of March 6, 2025, the Lafayette House Property was 97.8% leased.
Munn Heritage
The Munn Heritage property consists of an eight-story, 75-unit, high-rise multifamily property located in East Orange, New Jersey (the “Munn Heritage Property”). The Munn Heritage Property was originally constructed in 1918 and most recently renovated from 2019 to 2024. Renovation costs totaled approximately $1,868,887 and included renovations to 26 units as well as the common areas at the Munn Heritage Property. The Munn Heritage Property has a unit mix of 44 one-bedroom units, 17 two-bedroom units, and 14 three-bedroom units. Amenities at the Munn Heritage Property include an on-site laundry and 80 parking spaces, resulting in a parking ratio of approximately 1.07 spaces per unit. As of March 6, 2025, the Munn Heritage Property was 98.7% leased.
THE INFORMATION IN THIS STRUCTURAL AND COLLATERAL TERM SHEET IS NOT COMPLETE AND MAY BE AMENDED PRIOR TO THE TIME OF SALE. THIS TERM SHEET IS NOT AN OFFER TO SELL THESE SECURITIES AND IT IS NOT A SOLICITATION OF AN OFFER TO BUY THESE SECURITIES IN ANY JURISDICTION WHERE THE OFFER OR SALE IS NOT PERMITTED. | ||
| 119 | ||
| Structural and Collateral Term Sheet | BBCMS 2025-5C34 | |
| No. 11 – NJ Asden Portfolio | ||
The following table presents certain information relating to the multifamily unit mix at the NJ Asden Portfolio Properties:
| Portfolio Unit Mix(1) | |||||||
| Unit Type | # of Units | % of Total Units | Occupied Units | Occupancy | Average Unit Size (SF) | Average Monthly Rent Per Unit(2) | Average Monthly Market Rent Per Unit |
| Monroe Tower | |||||||
| 1BD/1BA | 173 | 66.3% | 160 | 92.5% | 688 | $1,617 | $1,900 |
| 1BD/1BA - Sec.8 | 3 | 1.1% | 3 | 100.0% | 677 | $1,425 | $1,900 |
| 2BD/2BA | 80 | 30.7% | 77 | 96.3% | 1,053 | $1,891 | $2,400 |
| 2BD/2BA - Sec.8 | 4 | 1.5% | 4 | 100.0% | 1,054 | $1,803 | $2,400 |
| 3BD/1BA | 1 | 0.4% | 0 | 0.0% | 1,065 | NAP | $2,800 |
| Property Total / Wtd Avg. | 261 | 100.0% | 244 | 93.5% | 807 | $1,704 | $2,064 |
| Executive House | |||||||
| Studio | 40 | 17.5% | 39 | 97.5% | 558(3) | $1,128 | $1,200 |
| Studio - Sec.8 | 1 | 0.4% | 1 | 100.0% | 536 | $1,175 | $1,200 |
| 1BD/1BA | 132 | 57.9% | 130 | 98.5% | 891 | $1,426 | $1,450 |
| 1BD/1BA - Sec.8 | 3 | 1.3% | 3 | 100.0% | 942 | $1,378 | $1,500 |
| 2BD/1BA | 6 | 2.6% | 6 | 100.0% | 1,198 | $1,947 | $1,950 |
| 2BD/2BA | 32 | 14.0% | 29 | 90.6% | 1,231 | $1,894 | $2,000 |
| 2BD/2BA - Sec.8 | 1 | 0.4% | 1 | 100.0% | 1,259 | $2,425 | $2,000 |
| 3BD/2BA | 12 | 5.3% | 11 | 91.7% | 1,487 | $2,318 | $2,350 |
| 3BD/2BA - Sec.8 | 1 | 0.4% | 1 | 100.0% | 1,488 | $2,387 | $2,350 |
| Property Total / Wtd Avg. | 228 | 100.0% | 221 | 96.9% | 923 | $1,501 | $1,550 |
| Washington Towers | |||||||
| Studio | 67 | 34.0% | 63 | 94.0% | 426 | $933 | $935 |
| Studio - Sec.8 | 3 | 1.5% | 3 | 100.0% | 422 | $975 | $935 |
| 1BD/1BA | 96 | 48.7% | 95 | 99.0% | 802 | $1,134 | $1,400 |
| 1BD/1BA - Sec.8 | 2 | 1.0% | 2 | 100.0% | 771 | $1,007 | $1,450 |
| 2BD/2BA | 29 | 14.7% | 27 | 93.1% | 989 | $1,188 | $1,700 |
| Property Total / Wtd Avg. | 197 | 100.0% | 190 | 96.4% | 695 | $1,071 | $1,279 |
| Ambassador Tower | |||||||
| Studio | 2 | 1.2% | 2 | 100.0% | 703 | $887 | $1,200 |
| 1BD/1BA | 117 | 72.7% | 114 | 97.4% | 867 | $1,182 | $1,417 |
| 1BD/1BA - Sec.8 | 3 | 1.9% | 3 | 100.0% | 833 | $1,067 | $1,417 |
| 2BD/1BA | 2 | 1.2% | 2 | 100.0% | 1,156 | $1,463 | $1,700 |
| 2BD/1BA - Sec.8 | 1 | 0.6% | 1 | 100.0% | 1,180 | $1,560 | $1,700 |
| 2BD/2BA | 36 | 22.4% | 35 | 97.2% | 1,141 | $1,332 | $1,700 |
| Property Total / Wtd Avg. | 161 | 100.0% | 157 | 97.5% | 931 | $1,215 | $1,483 |
| Lafayette House | |||||||
| 1BD/1BA | 64 | 71.9% | 62 | 96.9% | 804 | $1,208 | $1,475 |
| 1BD/1BA - Sec.8 | 3 | 3.4% | 3 | 100.0% | 738 | $1,110 | $1,433 |
| 2BD/2BA | 22 | 24.7% | 22 | 100.0% | 1,316 | $1,341 | $1,600 |
| Property Total / Wtd Avg. | 89 | 100.0% | 87 | 97.8% | 928 | $1,238 | $1,504 |
| Munn Heritage | |||||||
| 1BD/1BA | 44 | 58.7% | 43 | 97.7% | 834 | $1,055 | $1,400 |
| 2BD/2BA | 17 | 22.7% | 17 | 100.0% | 1,071 | $1,136 | $1,750 |
| 3BD/2BA | 14 | 18.7% | 14 | 100.0% | 1,363 | $1,430 | $2,000 |
| Property Total / Wtd Avg. | 75 | 100.0% | 74 | 98.7% | 987 | $1,145 | $1,591 |
| Portfolio Total / Wtd Avg. | 1,011 | 100.0% | 973 | 96.2% | 855 | $1,371 | $1,618 |
| (1) | Based on the underwritten rent rolls dated March 6, 2025. |
| (2) | Average Monthly Rent Per Unit is based on occupied units. |
| (3) | Average Unit Size (SF) for the studio units at the Executive House Property excludes one corporate management office for which no square feet were attributable. |
THE INFORMATION IN THIS STRUCTURAL AND COLLATERAL TERM SHEET IS NOT COMPLETE AND MAY BE AMENDED PRIOR TO THE TIME OF SALE. THIS TERM SHEET IS NOT AN OFFER TO SELL THESE SECURITIES AND IT IS NOT A SOLICITATION OF AN OFFER TO BUY THESE SECURITIES IN ANY JURISDICTION WHERE THE OFFER OR SALE IS NOT PERMITTED. | ||
| 120 | ||
| Structural and Collateral Term Sheet | BBCMS 2025-5C34 | |
| No. 11 – NJ Asden Portfolio | ||
Appraisals. According to the appraisals, the NJ Asden Portfolio Properties had an aggregate “as-is” appraised value of $137,800,000 as of the appraisals dated between March 4, 2025 and March 6, 2025. The table below shows the appraisals’ aggregate “as-is” conclusions. In addition, a portfolio appraisal determined a portfolio appraised value of $143,400,000, which reflects a portfolio premium of approximately 4.1% over the aggregate “As-Is” Appraised Values of the individual NJ Asden Portfolio Properties and is based on the extraordinary assumption that the entire portfolio is marketed to a single purchaser.
| NJ Asden Portfolio Appraised Value(1) | ||
| Property | Value | Capitalization Rate |
| Monroe Tower | $51,200,000 | 6.00% |
| Executive House | $32,500,000 | 6.00% |
| Washington Towers | $18,750,000 | 6.00% |
| Ambassador Tower | $18,500,000 | 6.00% |
| Lafayette House | $8,900,000 | 6.50% |
| Munn Heritage | $7,950,000 | 6.00% |
| Total / Wtd. Avg. | $137,800,000 | 6.03% |
| Portfolio Appraised Value | $143,400,000 | 5.75% |
| (1) | Source: Appraisals. |
Environmental. According to the Phase I environmental site assessments dated March 13, 2025, there were recognized environmental conditions at three of the NJ Asden Portfolio Properties, including (i) at the Executive House Property relating to a 20,000 gallon heating oil underground storage tank (“UST”) and a reported release, for which documentation was not available, (ii) at the Ambassador Tower Property relating to a 10,000 gallon heating oil UST for which removal documentation was not available, and (iii) at the Lafayette House Property relating to four heating oil USTs for which removal documentation was not available. See “Description of the Mortgage Pool—Mortgage Pool Characteristics—Environmental Considerations” in the Preliminary Prospectus.
The following table presents certain information relating to the historical and current multifamily occupancy of the NJ Asden Portfolio Properties:
| Historical and Current Occupancy(1) | |||||
| 2021 | 2022 | 2023 | 2024 | Current(2) | |
| NJ Asden Portfolio | 94.9% | 94.7% | 95.6% | 93.5% | 96.2% |
| (1) | Historical occupancies represent the average annual occupancy of each respective year. |
| (2) | Current occupancy represents occupancy as of the underwritten rent rolls dated March 6, 2025. |
THE INFORMATION IN THIS STRUCTURAL AND COLLATERAL TERM SHEET IS NOT COMPLETE AND MAY BE AMENDED PRIOR TO THE TIME OF SALE. THIS TERM SHEET IS NOT AN OFFER TO SELL THESE SECURITIES AND IT IS NOT A SOLICITATION OF AN OFFER TO BUY THESE SECURITIES IN ANY JURISDICTION WHERE THE OFFER OR SALE IS NOT PERMITTED. | ||
| 121 | ||
| Structural and Collateral Term Sheet | BBCMS 2025-5C34 | |
| No. 11 – NJ Asden Portfolio | ||
The following table presents certain information relating to the historical operating performance and Underwritten Net Cash Flow of the NJ Asden Portfolio Properties:
| Operating History and Underwritten Net Cash Flow | |||||||
| 2021(1) | 2022(1) | 2023(1) | 2024(2) | U/W(2) | Per Unit | %(3) | |
| Base Rent(4) | $14,623,611 | $14,937,479 | $15,686,202 | $15,839,710 | $16,010,936 | $15,837 | 95.3% |
| Potential Income from Vacant Units | 0 | 0 | 0 | 0 | 791,880 | $783 | 4.7% |
| Gross Potential Rent | $14,623,611 | $14,937,479 | $15,686,202 | $15,839,710 | $16,802,816 | $16,620 | 100.0% |
| Other Income(4)(5) | 465,811 | 445,917 | 539,113 | 629,009 | 1,015,520 | $1,004 | 6.0% |
| Net Rental Income | $15,089,422 | $15,383,396 | $16,225,314 | $16,468,719 | $17,818,336 | $17,624 | 106.0% |
| (Vacancy / Credit Loss) | ($505,985) | ($441,913) | ($296,181) | ($269,115) | ($1,008,169) | ($997) | (6.0%) |
| Total Effective Gross Income | $14,583,438 | $14,941,483 | $15,929,133 | $16,199,604 | $16,810,167 | $16,627 | 100.0% |
| Real Estate Taxes | 2,148,837 | 2,512,191 | 2,714,192 | 2,767,284 | 2,850,207 | $2,819 | 17.0% |
| Insurance | 459,472 | 605,136 | 805,709 | 803,488 | 861,115 | $852 | 5.1% |
| Management Fee | 437,503 | 448,244 | 477,874 | 485,988 | 504,305 | $499 | 3.0% |
| Payroll & Benefits(2) | 1,678,988 | 1,712,082 | 1,555,450 | 1,552,278 | 1,180,955 | $1,168 | 7.0% |
| Repairs & Maintenance(1) | 2,124,296 | 2,539,437 | 1,178,737 | 983,828 | 983,828 | $973 | 5.9% |
| Utilities | 2,036,608 | 2,290,133 | 2,131,900 | 2,196,134 | 2,196,134 | $2,172 | 13.1% |
| General & Administrative | 282,390 | 284,059 | 303,803 | 248,209 | 248,209 | $246 | 1.5% |
| Total Expenses | $9,168,096 | $10,391,281 | $9,167,667 | $9,037,209 | $8,824,754 | $8,729 | 52.5% |
| Net Operating Income | $5,415,342 | $4,550,202 | $6,761,467 | $7,162,394 | $7,985,413 | $7,899 | 47.5% |
| Replacement Reserves | 0 | 0 | 0 | 0 | 303,207 | $300 | 1.8% |
| Net Cash Flow | $5,415,342 | $4,550,202 | $6,761,467 | $7,162,394 | $7,682,207 | $7,599 | 45.7% |
| (1) | The decrease from 2021 NOI to 2022 NOI and subsequent increase to 2023 NOI is primarily attributable to fluctuations in repairs and maintenance expenses. In 2021 and 2022, repairs and maintenance included heavy HVAC related costs and a security contract that was not renewed in 2023. |
| (2) | The increase in Base Rent and Net Operating Income from 2024 to U/W is primarily attributable to a reduction in payroll and benefits expense for which historical periods incorrectly included time and payment attributable to other properties the sponsor owns. |
| (3) | The % column represents percentage of Gross Potential Rent for all revenue line items and percentage of Total Effective Gross Income for the remainder of the fields. |
| (4) | The increase in Other Income from historical periods to U/W is primarily attributable to historical periods previously including parking income in Base Rent instead of Other Income. |
| (5) | Other Income includes parking income, storage income, laundry income and pet fees. |
THE INFORMATION IN THIS STRUCTURAL AND COLLATERAL TERM SHEET IS NOT COMPLETE AND MAY BE AMENDED PRIOR TO THE TIME OF SALE. THIS TERM SHEET IS NOT AN OFFER TO SELL THESE SECURITIES AND IT IS NOT A SOLICITATION OF AN OFFER TO BUY THESE SECURITIES IN ANY JURISDICTION WHERE THE OFFER OR SALE IS NOT PERMITTED. | ||
| 122 | ||
| Structural and Collateral Term Sheet | BBCMS 2025-5C34 | |
| No. 11 – NJ Asden Portfolio | ||
The Market. The NJ Asden Portfolio Properties are located in East Orange (four properties, 54.7% of underwritten NOI), Asbury Park (one property, 39.0% of underwritten NOI), and Trenton, New Jersey (one property, 6.3% of underwritten NOI). The four properties within East Orange include the Executive House Property, Washington Towers Property, Ambassador Tower Property, and Munn Heritage Property, all of which are located within one mile of each other. The Monroe Tower Property is located in Asbury Park, and the Lafayette House Property is located in Trenton.
According to a third-party market research report, the Executive House Property, Washington Towers Property, Ambassador Tower Property, and Munn Heritage Property are all located within the Lower Essex County multifamily submarket. As of March 25, 2025, the submarket had total inventory of 26,170 units, a vacancy rate of 5.7%, and effective monthly rent per unit of $1,995.
According to a third-party market research report, the Monroe Tower Property is located within the East Monmouth multifamily submarket. As of March 25, 2025, the submarket had total inventory of 24,087 units, a vacancy rate of 3.0%, and effective monthly rent per unit of $2,212.
According to a third-party market research report, the Lafayette House Property is located within the Trenton/Hamilton/Ewing multifamily submarket. As of March 27, 2025, the submarket had total inventory of 6,715 units, a vacancy rate of 4.5%, and effective monthly rent per unit of $1,906.
According to the appraisal, the weighted average 2024 population within a one-, three- and five- mile radius of the NJ Asden Portfolio Properties was 39,236, 232,473, and 512,836, respectively. The 2024 average household income within the same radii was $95,842, $113,562, and $124,228, respectively.
The following table presents certain information relating to the demographics of the NJ Asden Portfolio Properties:
| Demographic Summary(1) | |||||||
| 2024 Population | 2024 Average Household Income | ||||||
| Property Name | Location | 1-Mile | 3-Mile | 5-Mile | 1-Mile | 3-Mile | 5-Mile |
| Monroe Tower | Asbury Park, NJ | 23,225 | 64,772 | 127,560 | $112,624 | $131,359 | $138,860 |
| Executive House | East Orange, NJ | 52,812 | 361,832 | 816,745 | $86,288 | $102,893 | $114,582 |
| Washington Towers | East Orange, NJ | 52,812 | 361,832 | 816,745 | $86,288 | $102,893 | $114,582 |
| Ambassador Tower | East Orange, NJ | 52,812 | 361,832 | 816,745 | $86,288 | $102,893 | $114,582 |
| Lafayette House | Trenton, NJ | 20,297 | 145,881 | 255,384 | $74,979 | $96,115 | $117,495 |
| Munn Heritage | East Orange, NJ | 52,812 | 361,832 | 816,745 | $86,288 | $102,893 | $114,582 |
| Wtd. Avg. (based on UW NOI) | 39,236 | 232,473 | 512,836 | $95,842 | $113,562 | $124,228 | |
| (1) | Source: Appraisals. |
THE INFORMATION IN THIS STRUCTURAL AND COLLATERAL TERM SHEET IS NOT COMPLETE AND MAY BE AMENDED PRIOR TO THE TIME OF SALE. THIS TERM SHEET IS NOT AN OFFER TO SELL THESE SECURITIES AND IT IS NOT A SOLICITATION OF AN OFFER TO BUY THESE SECURITIES IN ANY JURISDICTION WHERE THE OFFER OR SALE IS NOT PERMITTED. | ||
| 123 | ||
| Structural and Collateral Term Sheet | BBCMS 2025-5C34 | |
| No. 11 – NJ Asden Portfolio | ||
The following table presents certain information relating to multifamily properties comparable to the NJ Asden Portfolio Properties:
| Multifamily Rent Comparables(1) | ||||||
| Property Address | Distance from Subject | Year Built / Renovated | Number of Units | Unit Type | Average Unit Size (SF) | Average Monthly Rent per Unit |
| Monroe Tower(2) | - | 1963 / 2019-2024 | 261 | 1BR/1BA | 688 SF | $1,613 |
| 2BR/2BA | 1,054 SF | $1,887 | ||||
| 3BR/1BA | 1,065 SF | NAP | ||||
| 550 Cookman 550 Cookman Avenue Asbury Park, NJ |
0.3 mi | 1938 / NAV | 31 | 1BR/1BA | 912 SF | $2,255 |
| 2BR/2BA | 1,188 SF | $2,753 | ||||
| 3BR/2BA | 1,708 SF | $3,150 | ||||
| Frederick Douglas Apartments 1026 Mattison Avenue Asbury Park, NJ |
0.5 mi | 1971 / NAV | 90 | 1BR/1BA | 667 SF | $1,778 |
| 2BR/1BA | 1,000 SF | $1,988 | ||||
| Ocean Gate Arms 151 Stockton Avenue Ocean Grove, NJ |
0.9 mi | 1963 / NAV | 26 | 1BR/1BA | 562 SF | $1,423 |
| 2BR/1BA | 650 SF | $1,661 | ||||
| Executive House(2) | - | 1965 / 2019-2024 | 228 | Studio | 558 SF(3) | $1,129 |
| 1BR/1BA | 892 SF | $1,425 | ||||
| 2BR/1BA | 1,198 SF | $1,947 | ||||
| 2BR/2BA | 1,232 SF | $1,912 | ||||
| 3BR/2BA | 1,487 SF | $2,323 | ||||
| Washington Towers(2) | - | 1964 / 2019-2024 | 197 | Studio | 426 SF | $935 |
| 1BR/1BA | 801 SF | $1,132 | ||||
| 2BR/2BA | 989 SF | $1,188 | ||||
| Ambassador Tower(2) | - | 1960 / 2019-2024 | 161 | Studio | 703 SF | $887 |
| 1BR/1BA | 866 SF | $1,179 | ||||
| 2BR/1BA | 1,164 SF | $1,495 | ||||
| 2BR/2BA | 1,141 SF | $1,332 | ||||
| Munn Heritage(2) | - | 1918 / 2019-2024 | 75 | 1BR/1BA | 834 SF | $1,055 |
| 2BR/2BA | 1,071 SF | $1,136 | ||||
| 3BR/2BA | 1,363 SF | $1,430 | ||||
| 120 S Harrison St 120 South Harrison Street East Orange, NJ |
0.8 mi(4) | 1930 / NAV | 44 | 1BR/1BA | 750 SF | $2,000 |
| 2BR/1BA | 1,000 SF | $2,388 | ||||
| 3BR/1BA | 1,500 SF | $2,836 | ||||
| 60 North Arlington 60 North Arlington Avenue East Orange, NJ |
0.9 mi(4) | 1920 / NAV | 52 | 1BR/1BA | 450 SF | $1,350 |
| 2BR/1BA | 1,065 SF | $1,550 | ||||
| 3BR/1BA | 1,379 SF | $1,900 | ||||
| 179 South Harrison 179 South Harrison Street East Orange, NJ |
1.0 mi(4) | 1924 / NAV | 50 | 1BR/1BA | 900 SF | $1,800 |
| 2BR/1BA | 1,175 SF | $2,150 | ||||
| 3BR/1BA | 1,450 SF | $2,605 | ||||
| Lafayette House(2) | - | 1965 / 2019-2024 | 89 | 1BR/1BA | 801 SF | $1,203 |
| 2BR/2BA | 1,316 SF | $1,341 | ||||
| Sanhican Commons 9 & 11 Sanhican Drive Trenton, NJ |
0.9 mi | 1950 / NAV | 16 | 1BR/1BA | 720 SF | $1,100 |
| 2BR/1BA | 960 SF | $1,275 | ||||
| Beechwood Gardens 225 Beechwood Avenue Trenton, NJ |
1.2 mi | 1964 / NAV | 62 | 1BR/1BA | 700 SF | $1,250 |
| 2BR/1BA | 875 SF | $1,425 | ||||
| Trenton Watch Factory 720 Monmouth Street Trenton, NJ |
2.9 mi | 1965 / NAV | 71 | 1BR/1BA | 815 SF | $1,300 |
| 2BR/1BA | 1,000 SF | $1,575 | ||||
| (1) | Source: Appraisals. |
| (2) | Based on the underwritten rent rolls dated March 6, 2025. Average Unit Size (SF) and Average Monthly Rent per Unit reflects the average values inclusive of Section 8 Units. |
| (3) | Average Unit Size (SF) for the studio units at the Executive House Property excludes one corporate management office for which no square feet were attributable. |
| (4) | Represent the distances from the Executive House Property. |
THE INFORMATION IN THIS STRUCTURAL AND COLLATERAL TERM SHEET IS NOT COMPLETE AND MAY BE AMENDED PRIOR TO THE TIME OF SALE. THIS TERM SHEET IS NOT AN OFFER TO SELL THESE SECURITIES AND IT IS NOT A SOLICITATION OF AN OFFER TO BUY THESE SECURITIES IN ANY JURISDICTION WHERE THE OFFER OR SALE IS NOT PERMITTED. | ||
| 124 | ||
| Structural and Collateral Term Sheet | BBCMS 2025-5C34 | |
| No. 12 – Soho House Chicago | ||
| Mortgage Loan Information | Property Information | |||
| Mortgage Loan Seller: | Barclays | Single Asset / Portfolio: | Single Asset | |
| Original Principal Balance(1): | $29,000,000 | Title: | Fee | |
| Cut-off Date Principal Balance(1): | $29,000,000 | Property Type - Subtype: | Mixed-Use – Retail/Hospitality | |
| % of Pool by IPB: | 3.7% | Net Rentable Area (SF): | 115,000 | |
| Loan Purpose: | Refinance | Location: | Chicago, IL | |
| Borrower: | SG Real Estate LLC | Year Built / Renovated: | 1907 / 2014 | |
| Borrower Sponsors: | Justin Chun-Ying Ng and Yuan "Jerry" Tang | Occupancy: | 100.0% | |
| Interest Rate: | 6.78500% | Occupancy Date: | 2/10/2025 | |
| Note Date: | 2/10/2025 | 4th Most Recent NOI (As of): | $6,784,735 (12/31/2021) | |
| Maturity Date: | 2/6/2030 | 3rd Most Recent NOI (As of): | $7,390,154 (12/31/2022) | |
| Interest-only Period: | 60 months | 2nd Most Recent NOI (As of): | $8,170,504 (12/31/2023) | |
| Original Term: | 60 months | Most Recent NOI (As of): | $8,932,655 (12/31/2024) | |
| Original Amortization: | None | UW Occupancy: | 95.0% | |
| Amortization Type: | Interest Only | UW Revenues: | $9,309,308 | |
| Call Protection: | L(24),YM1(3),DorYM1(26),O(7) | UW Expenses: | $749,568 | |
| Lockbox / Cash Management: | Hard / Springing | UW NOI: | $8,559,740 | |
| Additional Debt(1): | Yes | UW NCF: | $8,559,740 | |
| Additional Debt Balance(1): | $36,000,000 | Appraised Value / PSF: | $117,800,000 / $1,024 | |
| Additional Debt Type(1): | Pari Passu | Appraisal Date: | 1/3/2025 | |
| Escrows and Reserves | Financial Information(1) | |||||
| Initial | Monthly | Initial Cap | Cut-off Date Loan / SF: | $565 | ||
| Taxes: | $76,727 | $38,364 | N/A | Maturity Date Loan / SF: | $565 | |
| Insurance: | $0 | Springing(2) | N/A | Cut-off Date LTV: | 55.2% | |
| Replacement Reserves | $0 | Springing(3) | N/A | Maturity Date LTV: | 55.2% | |
| UW NCF DSCR: | 1.91x | |||||
| UW NOI Debt Yield: | 13.2% | |||||
| Sources and Uses | |||||||
| Sources | Proceeds | % of Total | Uses | Proceeds | % of Total | ||
| Whole Loan | $65,000,000 | 100.0% | Loan Payoff | $62,923,600 | 96.8 | % | |
| Return of Equity | 1,365,531 | 2.1 | |||||
| Closing Costs | 634,142 | 1.0 | |||||
| Upfront Reserves | 76,727 | 0.1 | |||||
| Total Sources | $65,000,000 | 100.0% | Total Uses | $65,000,000 | 100.0 | % | |
| (1) | The Soho House Chicago Mortgage Loan (as defined below) is part of a whole loan evidenced by three pari passu notes with an aggregate outstanding principal balance of $65,000,000 (the “Soho House Chicago Whole Loan”). The Financial Information in the chart above reflects the Soho House Chicago Whole Loan. |
| (2) | The borrower is not required to make monthly escrow payments of 1/12th of the annual estimated insurance premiums so long as (i) no event of default under the Soho House Chicago Whole Loan documents or Major Tenant Trigger Event (as defined below) has occurred and is continuing, (ii) Soho House Chicago, LLC or an acceptable replacement tenant (a “Major Tenant”) continues to be obligated under such lease to maintain insurance covering the entire Soho House Chicago Property in form and substance satisfactory to the lender, (iii) the policies maintained by the Major Tenant covering the Soho House Chicago Property are approved by the lender and the insurance requirements of the Soho House Chicago Whole Loan agreement are satisfied and (iv) the borrower provides the lender with evidence reasonably satisfactory to the lender that the borrower or Major Tenant has paid the annual premium on all insurance required to be maintained pursuant to the Soho House Chicago Whole Loan agreement for the next 12 months within 30 days of the expiration date of such policies together along with evidence of such renewals thereof. A “Major Tenant Trigger Event” means the occurrence of any of the following: a Major Tenant (i) gives notice of its intent to terminate or not renew its lease; (ii) goes dark, vacates or abandons all or any portion of its premises at the Soho House Chicago Property; (iii) or its parent company or the guarantor of the Major Tenant’s lease is adjudicated insolvent by a court of competent jurisdiction or becomes a debtor in any bankruptcy or insolvency proceeding or has its assets made subject to the jurisdiction of a bankruptcy court; provided, however, that if any such insolvency or bankruptcy petition or proceeding was involuntary and not consented to or solicited to by the borrower or such guarantor, upon the same not being discharged, stayed or dismissed within 90 days; or (iv) defaults under the terms of the Major Tenant’s lease beyond all applicable notice and cure periods thereunder. |
| (3) | The borrower is not required to make monthly escrow payments for replacement reserves so long as (i) no event of default under the Soho House Chicago Whole Loan documents has occurred and is continuing, (ii) the Major Tenant’s lease is in full force and effect and no default beyond any applicable cure period is continuing thereunder, (iii) the Major Tenant is obligated to pay all costs and expenses of a capital nature relating to improvements of the Soho House Chicago Property and (iv) the Major Tenant pays all costs and expenses of a capital nature relating to the improvements at the Soho House Chicago Property and the borrower timely delivers to the lender evidence thereof. |
THE INFORMATION IN THIS STRUCTURAL AND COLLATERAL TERM SHEET IS NOT COMPLETE AND MAY BE AMENDED PRIOR TO THE TIME OF SALE. THIS TERM SHEET IS NOT AN OFFER TO SELL THESE SECURITIES AND IT IS NOT A SOLICITATION OF AN OFFER TO BUY THESE SECURITIES IN ANY JURISDICTION WHERE THE OFFER OR SALE IS NOT PERMITTED. | ||
| 125 | ||
| Structural and Collateral Term Sheet | BBCMS 2025-5C34 | |
| No. 12 – Soho House Chicago | ||
The Loan. The Soho House Chicago mortgage loan (the “Soho House Chicago Mortgage Loan”) is secured by the borrower’s fee interest in a six-story, 115,000 square foot (“SF”) building in downtown Chicago (the “Soho House Chicago Property”). The Soho House Chicago Whole Loan consists of three pari passu notes, has a five-year term, is interest only for the entire term and accrues interest at a rate of 6.78500% per annum on an Actual/360 basis. The Soho House Chicago Mortgage Loan is evidenced by the non-controlling note A-2 and note A-3 with an aggregate original and outstanding principal balance as of the Cut-off Date of $29,000,000. The Soho House Chicago Whole Loan was originated by Barclays and has an aggregate outstanding principal balance as of the Cut-off Date of $65,000,000.
The Soho House Chicago Whole Loan will be serviced pursuant to the pooling and servicing agreement for the BBCMS 2025-5C33 trust. See “Description of the Mortgage Pool—The Whole Loans—The Non-Serviced Pari Passu Whole Loans” and “Pooling and Servicing” Agreement in the Preliminary Prospectus.
| Whole Loan Summary | ||||
| Note | Original Balance | Cut-off Date Balance | Note Holder | Controlling Piece |
| A-1 | $36,000,000 | $36,000,000 | BBCMS 2025-5C33 | Yes |
| A-2 | $17,000,000 | $17,000,000 | BBCMS 2025-5C34 | No |
| A-3 | $12,000,000 | $12,000,000 | BBCMS 2025-5C34 | No |
| Whole Loan | $65,000,000 | $65,000,000 | ||
The Property. The Soho House Chicago Property is a historic six-story, 115,000 SF building located in downtown Chicago. Known as the Allis Building, the Soho House Chicago Property was constructed in 1907 and was used as a warehouse for the Allis Manufacturing Corporation. In 2012, the Soho House Chicago Property was acquired by the previous owner, which redeveloped the Soho House Chicago Property into a private social club (“Soho House Chicago”) affiliated with the Soho House & Co. Limited.
Many original elements were incorporated into the redevelopment such as the water tower on the roof, which was repurposed as a mural in the elevator lobby. The Soho House Chicago Property now includes six food and beverage outlets, a full-service spa and barber shop, 40 hotel rooms, a 17,000 SF fitness center and a 60-foot rooftop pool, which is heated year-round. The Soho House Chicago Property is currently 100% leased to Soho House Chicago, LLC, an independent tenant not affiliated with the borrower or borrower sponsors, which operates the Soho House Chicago Property as Soho House Chicago.
Major Tenant.
Soho House Chicago, LLC (115,000 SF; 100.0% of NRA, 100.0% of underwritten base rent). Soho House Chicago, LLC is a subsidiary of Soho House & Co. Limited, which operates exclusive, private members’ clubs as well as hotels, restaurants and spas. Since 2019, Soho House & Co. Limited has expanded from 26 to 44 locations and increased its membership base from 120,256 to approximately 264,500, a 120% increase, with a waiting list of approximately 111,000.
Soho House Chicago, LLC leases the Soho House Chicago Property on a 20-year triple-net lease that commenced on June 2, 2014. The Soho House Chicago, LLC lease includes annual 2.7% rent increases through the expiration date of June 30, 2034 with four, 10-year extension options remaining and no termination or contraction options. Soho House Chicago, LLC also pays 17.0% of Soho House Chicago earnings before interest, taxes and amortization (“EBITA”) in addition to base rent and reimbursements.
Soho House Chicago offers its members a diverse range of high-end amenities in an upscale setting across six floors and an English basement. The Cowshed Spa, a full-service spa with five treatment rooms, and the Neville Barbershop are both located in the English basement. The ground floor includes the open lobby space, which features six oversized, turn of the century crystal and gold chandeliers, as well as the Allis bar and lounge, which houses an expansive art collection, including an original from Damien Hirst. The second-floor gym features a professional boxing ring, two fitness studios, steam room and complimentary laundry service. The fourth floor includes a 30-seat screening room and an event space known as the Belt Room, which features the largest art collection of any Soho House property and the capacity to host up to 60 attendees. The fifth floor includes several food and beverage options including the Club Bar, which features a 40-foot vintage
THE INFORMATION IN THIS STRUCTURAL AND COLLATERAL TERM SHEET IS NOT COMPLETE AND MAY BE AMENDED PRIOR TO THE TIME OF SALE. THIS TERM SHEET IS NOT AN OFFER TO SELL THESE SECURITIES AND IT IS NOT A SOLICITATION OF AN OFFER TO BUY THESE SECURITIES IN ANY JURISDICTION WHERE THE OFFER OR SALE IS NOT PERMITTED. | ||
| 126 | ||
| Structural and Collateral Term Sheet | BBCMS 2025-5C34 | |
| No. 12 – Soho House Chicago | ||
Chesterfield sofa and a baby grand piano. Soho House Chicago’s rooftop pool is heated year-round and is surrounded by 180 feet of custom daybeds and two fireplaces. Soho House Chicago’s 40 hotel rooms are located the third and fourth floors and feature Egyptian cotton sheets, a full bar, walk-in shower with rainfall shower heads and Cowshed toiletries and hairstyling products. Please note Soho House Chicago, LLC’s furniture, fixtures and equipment are not collateral for the Soho House Chicago Mortgage Loan.
Since 2021, membership at Soho House Chicago has increased approximately 73.9% from 4,177 members to 7,265 members, with a waitlist 105% of the current membership base as of September 2024. All amenities are exclusive to members of Soho House Chicago with the exception of the Cowshed Spa, Neville Barbershop and the first-floor food and beverage outlets, which are open to the general public, and the screening room and Belt Room, which are available for private hire. Depending on demand, hotel rooms can also be rented by the general public at a room rate that includes a temporary membership during the guest’s stay.
Environmental. According to the Phase I environmental site assessment dated January 23, 2025, there was no evidence of any recognized environmental conditions at the Soho House Chicago Property.
| Tenant Summary(1) | |||||||
| Tenant | Ratings Moody’s/S&P/Fitch |
Net Rentable Area (SF) | % of Total NRA |
UW Base Rent PSF(2) | UW Base Rent(2) | % of Total UW Base Rent(2) |
Lease
Expiration Date |
| Soho House Chicago, LLC | NR / NR / NR | 115,000 | 100.0% | $67.35 | $7,745,709 | 100.0% | 6/30/2034 |
| Occupied Collateral Total / Wtd. Avg. | 115,000 | 100.0% | $67.35 | $7,745,709 | 100.0% | ||
| Vacant Space | 0 | 0.0% | |||||
| Collateral Total | 115,000 | 100.0% | |||||
| (1) | As of the rent roll dated February 10, 2025. |
| (2) | Includes $201,691 of contractual rent steps through May 2026. |
The Market. The Soho House Chicago Property is located in downtown Chicago’s Fulton Market Neighborhood, half a block from a portion of Randolph Street with a large concentration of high-end restaurants known as Restaurant Row. The Fulton Market District is considered an Innovation District, which is a tax designation intended to preserve existing structures while encouraging growth. Several corporations have relocated to the area including Google and McDonald’s, and the area’s population has nearly doubled since 2010. The Soho House Chicago Property is approximately 16 miles northwest and 10 miles southwest of Chicago O’Hare International Airport and Chicago Midway International, respectively. Average household income within two-, five- and 10-miles of the Soho House Chicago Property is $146,268, $123,305 and $99,720, respectively.
The Soho House Chicago Property is located in the Fulton Market/Near West Side retail submarket. According to the appraisal, the Fulton Market/Near West Side retail submarket had a vacancy rate of 3.6% and market asking rents of $35.70 PSF as of year-end 2024 with no properties currently under construction.
According to the appraisal, the Chicago lodging market is above average relative to the top 104 United States markets tracked by the appraiser. As of the third quarter 2024, the Chicago lodging market’s occupancy and ADR were 75.8% and $186.42, respectively, resulting in RevPAR of $141.24 putting it 10th out of the 104 United States markets tracked by the appraiser. The Chicago lodging market’s lodging performance index (the appraiser’s measure of a lodging market’s effective overall performance using multiple key performance metrics) was 1.21 (1.0 being average), ranking it 24th out of the 104 United States lodging markets tracked by the appraisal.
THE INFORMATION IN THIS STRUCTURAL AND COLLATERAL TERM SHEET IS NOT COMPLETE AND MAY BE AMENDED PRIOR TO THE TIME OF SALE. THIS TERM SHEET IS NOT AN OFFER TO SELL THESE SECURITIES AND IT IS NOT A SOLICITATION OF AN OFFER TO BUY THESE SECURITIES IN ANY JURISDICTION WHERE THE OFFER OR SALE IS NOT PERMITTED. | ||
| 127 | ||
| Structural and Collateral Term Sheet | BBCMS 2025-5C34 | |
| No. 12 – Soho House Chicago | ||
The appraisal noted there were very few sales of high-end private social clubs, so it relied on sales that share some similar components to the Soho House Chicago Property for its comparable sales analysis:
| Comparable Sales(1) | |||||||
| Name / Property Location | Property Use | Sale Date | Total NRA (SF) | Total Occupancy | Sale Price | Sale Price PSF | Adjusted Sales Price PSF |
|
Soho House Chicago Chicago, IL |
Retail/Hospitality | NAP | 115,000(2) | 100%(2) | NAP | NAP | NAP |
|
Steak 48 Chicago, IL |
Restaurant | Aug-24 | 12,030 | 100% | $11,460,000 | $952.62 | $1,191 |
|
Time Out Chicago Chicago, IL |
Retail | May-23 | 49,089 | 100% | $35,750,000 | $728.27 | $801 |
|
TAO Chicago Chicago, IL |
Restaurant/Nightclub | May-22 | 34,000 | 100% | $29,354,000 | $863.35 | $940 |
|
Movement Chicago, IL |
Retail | Feb-22 | 24,395 | 100% | $19,767,000 | $810.29 | $1,053 |
|
Neiman Marcus Chicago, IL |
Retail | April-22 | 195,500 | 100% | $94,000,000 | $480.82 | $721 |
|
Dierks Bentley’s Whiskey Row Denver, CO |
Retail/ Restaurant/ Events Space | March-22 | 19,319 | 100% | $23,500,000 | $1,216.42 | $1,034 |
|
Multi-tenant Retail Chicago, IL |
Retail | Oct-21 | 23,947 | 100% | $120,000,000 | $5,011.07 | $3,007 |
| (1) | Source: Appraisal. |
| (2) | As of the rent roll dated February 10, 2025. |
| Operating History and Underwritten Net Cash Flow | ||||||||
| 2021 | 2022 | 2023 | 2024 | Underwritten | Per SF | %(1) | ||
| In Place Rent | $6,832,799 | $7,078,641 | $7,267,875 | $7,462,172 | $7,745,709 | $67.35 | 94.4 | % |
| Vacancy Gross Up | 0 | 0 | 0 | 0 | 0 | 0 | 0.0 | |
| Gross Potential Rent | $6,832,799 | $7,078,641 | $7,267,875 | $7,462,172 | $7,745,709 | $67.35 | 94.4 | % |
| Total Reimbursements | $395,754 | $411,573 | $435,702 | $446,954 | $460,363 | $4.00 | 5.6 | |
| Total Gross Income | $7,228,553 | $7,490,214 | $7,703,577 | $7,909,126 | $8,206,072 | $71.36 | 100.0 | % |
| EBITDA Profit Share Income(2) | $0 | $347,028 | $960,643 | $1,513,540 | $1,513,540 | $13.16 | 18.4 | % |
| (Additional Vacancy Adjustment) | 0 | 0 | 0 | 0 | (410,304) | (3.57) | (5.0 | ) |
| Effective Gross Income | $7,228,553 | $7,837,242 | $8,664,220 | $9,422,666 | $9,309,308 | $80.95 | 113.4 | % |
| Variable Expenses | $15,143 | $2,630 | $23,664 | $4,377 | $250,526 | $2.18 | 2.7 | % |
| Real Estate Taxes | 395,754 | 411,573 | 435,702 | 446,954 | 460,363 | 4.00 | 4.9 | |
| Insurance | 32,921 | 32,884 | 34,350 | 38,679 | 38,679 | 0.34 | 0.4 | |
| Total Expenses | $443,818 | $447,087 | $493,716 | $490,011 | $749,568 | $6.52 | 8.1 | % |
| Net Operating Income | $6,784,735 | $7,390,154 | $8,170,504 | $8,932,655 | $8,559,740 | 74.43 | 91.9 | % |
| Capital Expenditures(3) | 0 | 0 | 0 | 0 | 0 | 0.00 | 0.0 | |
| TI/LC(3) | 0 | 0 | 0 | 0 | 0 | 0.00 | 0.0 | |
| Net Cash Flow | $6,784,735 | $7,390,154 | $8,170,504 | $8,932,655 | $8,559,740 | $74.43 | 91.9 | % |
| (1) | % column represents percent of Total Gross Income for all revenue lines and represents percent of Effective Gross Income for the remainder of fields |
| (2) | EBITDA Profit Share Income for 2023 and 2024 includes $195,091 and $463,520, respectively, to retroactively account for a cap to certain expense items used by Soho House Chicago, LLC in its calculation of EBITA, which was agreed to in 2025. |
| (3) | TI/LC and capital expenditures were not underwritten due to the long-term triple-net Soho House Chicago, LLC lease. |
THE INFORMATION IN THIS STRUCTURAL AND COLLATERAL TERM SHEET IS NOT COMPLETE AND MAY BE AMENDED PRIOR TO THE TIME OF SALE. THIS TERM SHEET IS NOT AN OFFER TO SELL THESE SECURITIES AND IT IS NOT A SOLICITATION OF AN OFFER TO BUY THESE SECURITIES IN ANY JURISDICTION WHERE THE OFFER OR SALE IS NOT PERMITTED. | ||
| 128 | ||
| Structural and Collateral Term Sheet | BBCMS 2025-5C34 | |
|
No. 13 – CentrePointe Business Park | ||
| Mortgage Loan Information | Property Information | |||
| Mortgage Loan Seller: | Barclays | Single Asset / Portfolio: | Single Asset | |
| Original Principal Balance: | $27,000,000 | Title: | Fee | |
| Cut-off Date Principal Balance: | $27,000,000 | Property Type – Subtype: | Industrial – Warehouse/Distribution | |
| % of IPB: | 3.4% | Net Rentable Area (SF): | 258,7751 | |
| Loan Purpose: | Refinance | Location: | Landover, MD | |
| Borrower: | Guardian Fund II – CentrePointe, LLC | Year Built / Renovated: | 1985-1987 / 2002 | |
| Borrower Sponsor: | Riki Rimberg | Occupancy: | 84.3% | |
| Interest Rate: | 7.35000% | Occupancy Date: | 12/2/2024 | |
| Note Date: | 4/2/2025 | 4th Most Recent NOI (As of): | $2,362,779 (12/31/2021) | |
| Maturity Date: | 4/6/2030 | 3rd Most Recent NOI (As of): | $2,520,262 (12/31/2022) | |
| Interest-only Period: | 60 months | 2nd Most Recent NOI (As of): | $2,778,038 (12/31/2023) | |
| Original Term: | 60 months | Most Recent NOI (As of(3)): | $2,995,174 (TTM 11/30/2024) | |
| Original Amortization Term: | None | UW Economic Occupancy: | 85.9% | |
| Amortization Type: | Interest Only | UW Revenues: | $5,447,021 | |
| Call Protection: | L(25),D(28),O(7) | UW Expenses: | $1,816,685 | |
| Lockbox / Cash Management: | Hard / In Place | UW NOI(3): | $3,630,336 | |
| Additional Debt: | No | UW NCF: | $3,433,244 | |
| Additional Debt Balance: | N/A | Appraised Value / Per SF: | $45,800,000 / $177 | |
| Additional Debt Type: | N/A | Appraisal Date: | 11/22/2024 | |
| Escrows and Reserves | Financial Information | |||||
| Initial | Monthly | Cap | Cut-off Date Loan / SF: | $104 | ||
| Taxes: | $215,076 | $30,725 | N/A | Maturity Date Loan / SF: | $104 | |
| Insurance: | $0 | Springing(1) | N/A | Cut-off Date LTV: | 59.0% | |
| Replacement Reserves: | $0 | $6,038 | N/A | Maturity Date LTV: | 59.0% | |
| TI / LC Reserves: | $1,000,000 | $21,565 | N/A | UW NCF DSCR: | 1.71x | |
| Other(2): | $1,730,035 | $0 | N/A | UW NOI Debt Yield: | 13.4% | |
| Sources and Uses | |||||||
| Sources | Proceeds | % of Total | Uses | Proceeds | % of Total | ||
| Mortgage Loan | $27,000,000 | 100.0% | Loan Payoff | $19,397,924 | 71.8 | % | |
| Return of Equity | 3,999,971 | 14.8 | |||||
| Reserves | 2,945,111 | 10.9 | |||||
| Closing Costs | 656,995 | 2.4 | |||||
| Total Sources | $27,000,000 | 100.0% | Total Uses | $27,000,000 | 100.0 | % | |
| (1) | Monthly deposits into an insurance reserve are not required so long as the borrower maintains a blanket policy acceptable to the lender. |
| (2) | Other escrows include an engineering reserve, outstanding landlord tenant improvement obligations and Foundation School gap rent. |
| (3) | The increase in Most Recent NOI to UW NOI is due to the borrower sponsor executing seven new or renewal leases totaling 81,918 square feet with approximately $1.8 million of attributable underwritten base rent. |
The Loan. The CentrePointe Business Park mortgage loan (the “CentrePointe Business Park Mortgage Loan”) has an original principal balance and Cut-off Date principal balance of $27,000,000 and is secured by the borrower’s fee interest in an industrial warehouse/distribution center property totaling 258,775 square feet located in Landover, Maryland (the “CentrePointe Business Park Property”). The CentrePointe Business Park Mortgage Loan has a 5-year term, is interest only for the full term and accrues interest at a rate of 7.35000% per annum on an Actual/360 basis.
The Property. The CentrePointe Business Park Property is a 258,775 square foot industrial warehouse/distribution facility located in Landover, Maryland. The CentrePointe Business Park Property consists of three buildings originally constructed from 1985 to 1987 and most recently renovated in 2002. The CentrePointe Business Park Property has clear heights ranging from 18 feet to 25 feet and has 27 dock doors. The CentrePointe Business Park Property has 827 parking spaces, resulting
THE INFORMATION IN THIS STRUCTURAL AND COLLATERAL TERM SHEET IS NOT COMPLETE AND MAY BE AMENDED PRIOR TO THE TIME OF SALE. THIS TERM SHEET IS NOT AN OFFER TO SELL THESE SECURITIES AND IT IS NOT A SOLICITATION OF AN OFFER TO BUY THESE SECURITIES IN ANY JURISDICTION WHERE THE OFFER OR SALE IS NOT PERMITTED. | ||
| 129 | ||
| Structural and Collateral Term Sheet | BBCMS 2025-5C34 | |
|
No. 13 – CentrePointe Business Park | ||
in a parking ratio of approximately 3.2 per 1,000 square feet. The borrower sponsor acquired the CentrePointe Business Park Property in 2019 and has increased net operating income from approximately $1.8 million in 2019 to the TTM November 2024 net operating income of approximately $3.0 million (64.0% increase). As of December 2, 2024, the CentrePointe Business Park Property was 84.3% occupied to 17 tenants.
Major Tenants.
State of MD (82,102 square feet; 31.7% of NRA; 41.4% of underwritten rent; Moody’s/S&P/Fitch: Aaa/AAA/AAA): State of MD includes the Department of Human Services and Department of Education. The Department of Human Services is the state’s human service provider and helps Marylanders buy healthy food, pay energy bills and obtain medical assistance. The Department of Education focuses on student development to knowledge and skills necessary for success in college, career and life. The State of MD – Department of Human Services has been a tenant at the CentrePointe Business Park Property since 1994 and has lease expirations of October 31, 2025 for 23,563 square feet of space and December 31, 2032 for 54,446 square feet of space. The State of MD – Department of Education has been a tenant at the CentrePointe Business Park Property since 2002 and has a lease expiration of February 28, 2034 for its 4,093 square feet of space.
Foundation Schools (34,136 square feet; 13.2% of NRA; 17.0% of underwritten rent): Foundation Schools is the main campus for Foundation Learning Center, a specialized program to meet the needs of students with autism spectrum disorders. The space consists of six classrooms, a gymnasium, a cafeteria and staff rooms. Foundation Schools leases two suites at the CentrePointe Business Park Property and has been a tenant since 2019 with its lease expiring in March 2036.
GSA – Secret Service (32,200 square feet; 12.4% of NRA; 17.2% of underwritten rent; Moody’s/S&P/Fitch: Aaa/AA+/AA+): GSA – Secret Service serves the United States Secret Service, a federal law enforcement agency headquartered in Washington, D.C focused on protection of national and visiting foreign leaders and criminal investigations. The CentrePointe Business Park Property is the servicing hub for the Secret Service’s vehicular fleet. GSA – Secret Service has been a tenant at the CentrePointe Business Park Property since 2000 with a lease expiration date in February 2026.
Environmental. According to the Phase I environmental assessment dated November 26, 2024, there was no evidence of any recognized environmental conditions at the CentrePointe Business Park Property.
| Historical and Current Occupancy(1) | |||
| 2021 | 2022 | 2023 | Current(2) |
| 84.3% | 86.9% | 76.8% | 84.3% |
| (1) | Historical occupancy is as of December 31 of each respective year. |
| (2) | Current occupancy is based on the underwritten rent roll as of December 2, 2024. |
THE INFORMATION IN THIS STRUCTURAL AND COLLATERAL TERM SHEET IS NOT COMPLETE AND MAY BE AMENDED PRIOR TO THE TIME OF SALE. THIS TERM SHEET IS NOT AN OFFER TO SELL THESE SECURITIES AND IT IS NOT A SOLICITATION OF AN OFFER TO BUY THESE SECURITIES IN ANY JURISDICTION WHERE THE OFFER OR SALE IS NOT PERMITTED. | ||
| 130 | ||
| Structural and Collateral Term Sheet | BBCMS 2025-5C34 | |
|
No. 13 – CentrePointe Business Park | ||
| Top Tenant Summary(1) | ||||||||
| Tenant | Ratings (Moody’s/S&P/Fitch)(2) | Net Rentable Area (SF) | % of Total NRA | UW Base Rent PSF | UW Base Rent | % of Total UW Base Rent | Lease Expiration Date | |
| State of MD | Aaa/AAA/AAA | 82,102 | 31.7 | % | $23.99 | $1,969,512 | 41.4% | Various(3) |
| Foundation Schools | NR/NR/NR | 34,136 | 13.2 | % | $23.75 | $810,730 | 17.0% | 3/1/2036 |
| GSA – Secret Service | Aaa/AA+/AA+ | 32,200 | 12.4 | % | $25.38 | $817,335 | 17.2% | 2/14/2026 |
| VOANS Senior Community Care | NR/NR/NR | 10,115 | 3.9 | % | $18.39 | $186,009 | 3.9% | 4/30/2034 |
| Fresenius Medical Care | Baa3/BBB/BBB- | 9,266 | 3.6 | % | $19.52 | $180,884 | 3.8% | 9/30/2027 |
| Total Major Tenants | 167,819 | 64.9 | % | $23.62 | $3,964,470 | 83.3% | ||
| Other Tenants | 50,281 | 19.4 | % | $15.80 | $794,423 | 16.7% | ||
| Total Occupied | 218,100 | 84.3 | % | $21.82 | $4,758,893 | 100.0% | ||
| Vacant Space | 40,675 | 15.7 | ||||||
| Total / Wtd. Avg. | 258,775 | 100.0 | % | |||||
| (1) | Based on the underwritten rent roll dated December 2, 2024. |
| (2) | In certain instances, ratings provided are those of the parent company of the entity shown, whether or not the parent company guarantees the lease. |
| (3) | State of MD – Department of Human Services has 23,563 square feet of Net Rentable Area (SF) expiring on October 31, 2025 and 54,446 square feet of Net Rentable Area (SF) expiring on December 31, 2032. State of MD – Department of Education has 4,093 square feet that expires on February 28, 2034. |
The following table presents certain information relating to the tenant lease expirations of the CentrePointe Business Park Property:
| Lease Rollover Schedule(1)(2) | ||||||||||||
| Year | Number of Leases Expiring | Net Rentable Area Expiring | % of NRA Expiring | UW Base Rent Expiring | % of UW Base Rent Expiring | Cumulative Net Rentable Area Expiring | Cumulative % of NRA Expiring | Cumulative UW Base Rent Expiring | Cumulative % of UW Base Rent Expiring | |||
| Vacant | NAP | 40,675 | 15.7 | % | NAP | NAP | 40,675 | 15.7% | NAP | NA | P | |
| 2025 & MTM | 3 | 31,371 | 12.1 | $643,984 | 13.5 | % | 72,046 | 27.8% | $643,984 | 13.5% | ||
| 2026 | 3 | 35,573 | 13.7 | $891,474 | 18.7 | 107,619 | 41.6% | $1,535,458 | 32.3% | |||
| 2027 | 4 | 24,650 | 9.5 | $368,169 | 7.7 | 132,269 | 51.1% | $1,903,627 | 40.0% | |||
| 2028 | 3 | 17,282 | 6.7 | $304,295 | 6.4 | 149,551 | 57.8% | $2,207,921 | 46.4% | |||
| 2029 | 1 | 6,434 | 2.5 | $145,049 | 3.0 | 155,985 | 60.3% | $2,352,970 | 49.4% | |||
| 2030 | 0 | 0 | 0.0 | 0 | 0.0 | 155,985 | 60.3% | $2,352,970 | 49.4% | |||
| 2031 | 0 | 0 | 0.0 | 0 | 0.0 | 155,985 | 60.3% | $2,352,970 | 49.4% | |||
| 2032 | 1 | 54,446 | 21.0 | $1,305,454 | 27.4 | 210,431 | 81.3% | $3,658,425 | 76.9% | |||
| 2033 | 0 | 0 | 0.0 | 0 | 0.0 | 210,431 | 81.3% | $3,658,425 | 76.9% | |||
| 2034 | 2 | 14,208 | 5.5 | $289,739 | 6.1 | 224,639 | 86.8% | $3,948,163 | 83.0% | |||
| 2035 | 0 | 0 | 0.0 | 0 | 0.0 | 224,639 | 86.8% | $3,948,163 | 83.0% | |||
| 2036 & Beyond | 2 | 34,136 | 13.2 | $810,730 | 17.0 | 258,775 | 100.0% | $4,758,893 | 100.0% | |||
| Total | 19 | 258,775 | 100.0 | % | $4,758,893 | 100.0 | % | |||||
| (1) | Based on the underwritten rent roll dated December 2, 2024. |
| (2) | Certain leases may have termination options that are exercisable prior to the originally stated expiration date of the lease and are not considered in this Lease Rollover Schedule. |
THE INFORMATION IN THIS STRUCTURAL AND COLLATERAL TERM SHEET IS NOT COMPLETE AND MAY BE AMENDED PRIOR TO THE TIME OF SALE. THIS TERM SHEET IS NOT AN OFFER TO SELL THESE SECURITIES AND IT IS NOT A SOLICITATION OF AN OFFER TO BUY THESE SECURITIES IN ANY JURISDICTION WHERE THE OFFER OR SALE IS NOT PERMITTED. | ||
| 131 | ||
| Structural and Collateral Term Sheet | BBCMS 2025-5C34 | |
|
No. 13 – CentrePointe Business Park | ||
The following table presents certain information relating to the operating history and underwritten cash flows of the CentrePointe Business Park Property:
| Operating History and Underwritten Net Cash Flow | ||||||||
| 2021 | 2022 | 2023 | TTM(1)(2) | Underwritten(2) | Per Square Foot | %(3) | ||
| In Place Rent | $3,494,379 | $4,178,019 | $4,394,834 | $4,641,632 | $4,758,893(4) | $18.39 | 76.4 | % |
| Vacancy Gross Up | 0 | 0 | 0 | 0 | 784,238 | 3.03 | 12.6 | |
| Gross Potential Rent | $3,494,379 | $4,178,019 | $4,394,834 | $4,641,632 | $5,543,131 | $21.42 | 89.0 | % |
| Total Reimbursements | 332,363 | 379,977 | 417,242 | 485,559 | 532,969 | 2.06 | 8.6 | |
| Parking Income | 88,836 | 130,588 | 142,986 | 155,158 | 155,158 | 0.60 | 2.5 | |
| Total Gross Income | $3,915,578 | $4,688,584 | $4,955,062 | $5,282,349 | $6,231,258 | $24.08 | 100.0 | % |
| (Vacancy/Credit Loss) | 0 | (323,522) | (384,217) | (508,462) | (784,238) | (3.03) | (12.6 | ) |
| Effective Gross Income | $3,915,578 | $4,365,062 | $4,570,845 | $4,773,887 | $5,447,021 | $21.05 | 87.4 | % |
| Total Expenses | 1,552,799 | 1,844,800 | 1,792,807 | 1,778,713 | 1,816,685 | 7.02 | 33.4 | |
| Net Operating Income | $2,362,779 | $2,520,262 | $2,778,038 | $2,995,174 | $3,630,336 | $14.03 | 66.6 | % |
| Capital Expenditures | 0 | 0 | 0 | 0 | 72,457 | 0.28 | 1.3 | |
| TI / LC(5) | 0 | 0 | 0 | 0 | 124,635 | 0.48 | 2.3 | |
| Net Cash Flow | $2,362,779 | $2,520,262 | $2,778,038 | $2,995,174 | $3,433,244 | $13.27 | 63.0 | % |
| (1) | TTM represents the trailing 12-month period ending November 30, 2024. |
| (2) | The increase in TTM to UW Net Operating Income is due to the borrower sponsor executing seven new or renewal leases totaling 81,918 square feet with approximately $1.8 million of attributable underwritten base rent. |
| (3) | % column represents percent of Total Gross Income for all revenue lines and represents percent of Effective Gross Income for the remainder of fields. |
| (4) | Based on the underwritten rent roll dated December 2, 2024 and inclusive of $172,412 of rent steps. |
| (5) | TI / LC includes a $100,000 credit equal to 10% of the $1.0 million upfront TI/LC reserve. |
The Market. The CentrePointe Business Park Property is located in Landover, Maryland, within Prince George’s County and approximately 15 miles from Washington, D.C. According to the appraisal, proximity to Washington, D.C. has attracted federal facilities to Prince George’s County, including NASA Goddard Space Flight Center, the USDA Beltsville Agricultural Research Center, the Army Research Laboratory, the Institute for Defense Analysis the U.S. Census Bureau Supercomputer Center and Joint Base Andrews. Access to the CentrePointe Business Park Property is provided by Interstate 495 and Route 214. The CentrePointe Business Park Property is also located approximately 1.7 miles from the Morgan Boulevard Metrorail Station.
According to the appraisal the estimated 2023 population in the Washington, D.C. core based statistical area was approximately 6.4 million with an average annual household income of $154,968.
According to the appraisal, the CentrePointe Business Park Property is situated in the Suburban Maryland industrial market and the Landover/Lanham submarket. The Suburban Maryland industrial market and Landover/Lanham industrial submarket contained approximately 51.0 million and 15.3 million square feet of industrial space as of the third quarter of 2024, respectively. The Suburban Maryland industrial market reported a vacancy rate of 7.7% with an average asking rental rate of $10.63 per square foot as of the end of the third quarter of 2024. The Landover/Lanham industrial submarket reported a vacancy rate of 5.5% with an average asking rental rate of $14.68 per square foot as of the end of the third quarter of 2024.
THE INFORMATION IN THIS STRUCTURAL AND COLLATERAL TERM SHEET IS NOT COMPLETE AND MAY BE AMENDED PRIOR TO THE TIME OF SALE. THIS TERM SHEET IS NOT AN OFFER TO SELL THESE SECURITIES AND IT IS NOT A SOLICITATION OF AN OFFER TO BUY THESE SECURITIES IN ANY JURISDICTION WHERE THE OFFER OR SALE IS NOT PERMITTED. | ||
| 132 | ||
| Structural and Collateral Term Sheet | BBCMS 2025-5C34 | |
|
No. 13 – CentrePointe Business Park | ||
The following table presents recent leasing data at comparable properties to the CentrePointe Business Park Property:
| Competitive Building Summary(1) | ||||||||||
Property Name |
Year Built / Renovated | Size (SF) | % Office | Clear Height | Tenant | Tenant Size (SF) | Rent PSF | Reimb. | Lease Date | Lease Term (Yrs.) |
|
CentrePointe Business Park Landover, MD |
1985-1987 / 2002 | 258,775(2) | 40.0% | 18’ – 25’ | State of MD | 82,102(2) | $22.30(2) | Net |
Jun-22 Feb-24 Mar-25 |
Various(2)(3) |
|
Muirkirk Business Center 1 & 2 Beltsville, MD |
1987 / NAV | 119,194 | 30.0% | 22’ | Agile | 4,803 | $15.00 | Net | Dec-24 | 5.2 |
|
7524 Standish Place Derwood, MD |
1985 / NAV | 24,051 | 90.0% | NAP | Castro Electrical Services | 6,871 | $17.50 | Net | Aug-24 | 3.0 |
|
Steeplechase F1 Capitol Heights, MD |
2013 / NAV | 48,557 | 0.0% | 24’ | C3M Power System | 26,191 | $16.00 | Net | Jul-24 | 2.6 |
|
7100 Old Landover Road Landover, MD |
1969 / 1999 | 251,227 | 6.0% | 17’ | GSA | 91.525 | $15.40 | Net | Apr-24 | 3.0 |
|
6100 Columbia Park Landover, MD |
1968 / 2006 | 149,860 | 3.0% | 17’ | Gilbrane Development Company | 70,230 | $15.00 | Net | Feb-24 | 3.0 |
|
6081 Mid Cities Avenue Beltsville, MD |
1972 / NAV | 70,600 | 0.0% | 24’ | RXO | 70,600 | $14.00 | Net | Feb-24 | 5.0 |
| (1) | Source: Appraisal. |
| (2) | Information is based on the underwritten rent roll dated December 2, 2024. |
| (3) | State of MD – Department of Human Services has 23,563 square feet of Net Rentable Area (SF) expiring on October 31, 2025 and 54,446 square feet of Net Rentable Area (SF) expiring on December 31, 2032. State of MD – Department of Education has 4,093 square feet that expires on February 28, 2034. |
THE INFORMATION IN THIS STRUCTURAL AND COLLATERAL TERM SHEET IS NOT COMPLETE AND MAY BE AMENDED PRIOR TO THE TIME OF SALE. THIS TERM SHEET IS NOT AN OFFER TO SELL THESE SECURITIES AND IT IS NOT A SOLICITATION OF AN OFFER TO BUY THESE SECURITIES IN ANY JURISDICTION WHERE THE OFFER OR SALE IS NOT PERMITTED. | ||
| 133 | ||
| Structural and Collateral Term Sheet | BBCMS 2025-5C34 | |
| No. 14 – Mia West | ||
| Mortgage Loan Information | Property Information | |||
| Mortgage Loan Seller: | AREF2 | Single Asset / Portfolio: | Single Asset | |
| Original Principal Balance: | $24,000,000 | Title(3): | Fee / Leasehold | |
| Cut-off Date Principal Balance: | $24,000,000 | Property Type - Subtype: | Multifamily - Garden | |
| % of IPB: | 3.1% | Net Rentable Area (Units): | 270 | |
| Loan Purpose: | Refinance | Location: | Houston, TX | |
| Borrower(1): | LXMI Copper Cove Property Owner, LLC | Year Built / Renovated: | 1983 / 2022-2024 | |
| Borrower Sponsors: | Anthony Gupta and Eric Trucksess | Occupancy: | 88.9% | |
| Interest Rate: | 6.65000% | Occupancy Date: | 2/11/2025 | |
| Note Date: | 3/10/2025 | 4th Most Recent NOI (As of)(4): | NAV | |
| Maturity Date: | 4/6/2030 | 3rd Most Recent NOI (As of)(5): | $962,813 (12/31/2023) | |
| Interest-only Period: | 60 months | 2nd Most Recent NOI (As of)(5): | $1,634,156 (12/31/2024) | |
| Original Term: | 60 months | Most Recent NOI (As of)(5): | $1,684,968 (TTM 1/31/2025) | |
| Original Amortization Term: | None | UW Occupancy: | 87.1% | |
| Amortization Type: | Interest Only | UW Revenues: | $3,374,949 | |
| Call Protection: | L(25),D(31),O(4) | UW Expenses: | $1,261,771 | |
| Lockbox / Cash Management: | Soft / Springing | UW NOI(5): | $2,113,177 | |
| Additional Debt: | No | UW NCF: | $2,045,677 | |
| Additional Debt Balance: | N/A | Appraised Value / Per Unit(6): | $34,400,000 / $127,407 | |
| Additional Debt Type: | N/A | Appraisal Date: | 2/6/2025 | |
| Escrows and Reserves | Financial Information | |||||
| Initial | Monthly | Initial Cap | Cut-off Date Loan / Unit: | $88,889 | ||
| Taxes: | $122,703 | $30,676 | N/A | Maturity Date Loan / Unit: | $88,889 | |
| Insurance: | $122,253 | $20,376 | N/A | Cut-off Date LTV(6): | 69.8% | |
| Replacement Reserve: | $0 | $5,625 | N/A | Maturity Date LTV(6): | 69.8% | |
| Immediate Repairs: | $35,050 | $0 | N/A | UW NCF DSCR: | 1.26x | |
| HHA Payments Reserve(2): | $0 | Springing | N/A | UW NOI Debt Yield: | 8.8% | |
| Sources and Uses | |||||||
| Sources | Proceeds | % of Total | Uses | Proceeds | % of Total | ||
| Mortgage Loan | $24,000,000 | 100.0% | Loan Payoff | $18,707,097 | 77.9 | % | |
| Return of Equity | 3,570,530 | 14.9 | |||||
| Closing Costs(7) | 1,442,368 | 6.0 | |||||
| Upfront Reserves | 280,006 | 1.2 | |||||
| Total Sources | $24,000,000 | 100.0% | Total Uses | $24,000,000 | 100.0 | % | |
| (1) | The Mia West Mortgage Loan (as defined below) and the Mia East mortgage loan have related borrowers. |
| (2) | Monthly deposits into the HHA Payments Reserve are not be required so long as (i) no event of default under the Mia West Mortgage Loan documents has occurred and is continuing and (ii) the borrower delivers evidence reasonably acceptable to the lender that the HHA Payments (as defined below) due under the HHA Program (as defined below) documents are paid timely. To the extent deposits are required, the borrower is required to pay to the lender an amount that is estimated by the lender to be sufficient to pay the next monthly or annual installment of the HHA Payments due under the HHA Program documents, and the lender will transfer such amounts to the HHA Payments Reserve. |
| (3) | The Mia West Property (as defined below) is encumbered by a 99-year ground lease as part of the Houston Housing Authority program (“HHA Program”). The Mia West Mortgage Loan is secured by the borrower’s leasehold interest and the Houston Housing Authority’s (“HHA”) fee interest in the Mia West Property. See “The Property” and “Ground Lease” below for further information. |
| (4) | 4th Most Recent NOI is not available as the borrower sponsors acquired the Mia West Property in 2022. |
| (5) | The increase in 2nd Most Recent NOI from 3rd Most Recent NOI is primarily due to an increase in average occupancy from 88.4% in 2023 to 94.0% in 2024 and a decrease in credit loss from $258,514 in 2023 to $71,403 in 2024 caused by a backlog of evictions that were completed in 2023. The increase in UW NOI from Most Recent NOI is primarily due to the anticipated real estate tax savings related to the admission of the Mia West Property into the HHA Program. |
| (6) | The Appraised Value, Appraised Value Per Unit, Cut-off Date LTV and Maturity Date LTV are based on the “Hypothetical Market Value with Restricted Rents” value of the leasehold interest in the Mia West Property, which assumes the Mia West Property is encumbered by a ground lease as part of the HHA Program whereby certain units at the Mia West Property are restricted for rent to tenants whose income does not exceed specified percentages of the area median income and that the ongoing payments due in connection with being a part of the HHA Program are subordinate to the Mia West Mortgage Loan. The market-based “As Is” appraised value as of February 6, 2025, which assumes no Tax Exemption (as defined below) is granted for the Mia West Property, is $30,300,000. See “The Property” below for further information. |
| (7) | Closing Costs include a rate buydown fee of $240,000. |
The Loan. The Mia West mortgage loan (the “Mia West Mortgage Loan”) has an outstanding principal balance as of the Cut-off Date of $24,000,000 and is secured by the borrower’s leasehold interest and the HHA’s fee simple interest in a 270-
THE INFORMATION IN THIS STRUCTURAL AND COLLATERAL TERM SHEET IS NOT COMPLETE AND MAY BE AMENDED PRIOR TO THE TIME OF SALE. THIS TERM SHEET IS NOT AN OFFER TO SELL THESE SECURITIES AND IT IS NOT A SOLICITATION OF AN OFFER TO BUY THESE SECURITIES IN ANY JURISDICTION WHERE THE OFFER OR SALE IS NOT PERMITTED. | ||
| 134 | ||
| Structural and Collateral Term Sheet | BBCMS 2025-5C34 | |
| No. 14 – Mia West | ||
unit garden-style multifamily property in Houston, Texas (the “Mia West Property”). The Mia West Mortgage Loan has a five-year term, is interest-only for the entire term and accrues interest at a fixed rate of 6.65000% per annum on an Actual/360 basis.
The Property. The Mia West Property is a 270-unit garden-style multifamily property located in Houston, Texas, approximately 18 miles west of downtown Houston. Built in 1983 and renovated from 2022-2024, the Mia West Property is comprised of eight, three-story buildings on a 7.04-acre site. The unit mix includes 11 studio units, 199 one-bedroom units and 60 two-bedroom units, with an average unit size of 757 square feet. Community amenities include swimming pools, a clubhouse, laundry facilities, BBQ grills, a business center and controlled access. Unit amenities include a full appliance package with freestanding oven and refrigerator, washer/dryer connections, ceiling fans and a patio/balcony. Since acquiring the Mia West Property in 2022, the borrower sponsors have invested approximately $3.0 million ($11,111 per unit) in capital expenditures, including approximately $1.4 million in exterior renovations and approximately $1.6 million in interior renovations. Exterior renovations included metal and wood repairs, pool resurfacing, painting and landscaping. Interior renovations included new flooring, granite or quartz countertops, tile resurfacing and new paint. The Mia West Property contains 397 parking spaces, resulting in a parking ratio of approximately 1.5 per unit.
The following table presents detailed information with respect to the unit mix at the Mia West Property:
| Unit Mix(1) | |||||||
| Unit Type | # of Units | % of Total | Occupied Units | Occupancy | Average Unit Size (SF) | Average Monthly Rental Rate | Average Monthly Rental Rate PSF |
| Studio | 11 | 4.1% | 7 | 63.6% | 632 | $927 | $1.46 |
| 1 Bedroom | 199 | 73.7% | 180 | 90.5% | 693 | $929 | $1.34 |
| 2 Bedroom | 60 | 22.2% | 53 | 88.3% | 990 | $1,287 | $1.30 |
| Total/Wtd. Avg. | 270 | 100.0% | 240 | 88.9% | 757 | $1,008 | $1.33 |
| (1) | Information based on the underwritten rent roll dated February 11, 2025. |
Pursuant to the HHA Program, a property will be exempt from all property taxes (the “Tax Exemption”) if it meets certain conditions including, among other things, (i) a portion of the property is utilized for the purpose of affordable housing, and (ii) the fee interest to the property is owned by the governing body overseeing the HHA Program and is leased back to the borrower under a ground lease. In order to receive the Tax Exemption, at least 5 of the 270 residential units at the Mia West Property must be reserved for or rented to tenants whose household income is less than 30% of the area median family income (“AMI”), 63 of the units must be restricted to the 60% AMI level, and 67 of the units must be restricted to the 80% AMI level.
At origination, the borrower entered into a 99-year ground lease between HHA, as ground lessor, and the borrower, as ground lessee (see “Ground Lease” below). The Mia West Mortgage Loan is secured by the borrower’s leasehold interest and HHA’s fee interest in the Mia West Property. The appraiser concluded that the in-place rents at the Mia West Property currently comply with the rent limits under the HHA Program documents.
Concurrent with the origination of the Mia West Mortgage Loan, all necessary documentation for admission into the HHA Program was effectuated and as such, the Mia West Property is part of the HHA Program managed by HHA; however, the Tax Exemption has not yet been granted by the applicable central appraisal district. Once issued, the Tax Exemption is expected to be retroactive to the date fee ownership in the Mia West Property was transferred by the borrower to HHA (on or about March 10, 2025) and continue for the term of the related ground lease or until its earlier termination.
If (i) the Tax Exemption is not granted by March 10, 2026 or (ii) the HHA Program documents are terminated, the Tax Exemption is lost and/or the borrower otherwise surrenders the leasehold estate created by the ground lease with HHA and the borrower acquires the fee interest in the Mia West Property, the Mia West Mortgage Loan documents require the borrower to partially prepay (in conjunction with the applicable payment of yield maintenance premium) the Mia West Mortgage Loan within 60 days in the amount necessary for the Mia West Property to satisfy both a debt service coverage ratio of 1.25x and a debt yield of 8.40% (the “HHA Prepayment Amount”). The Mia West Mortgage Loan documents provide recourse to the guarantors on a joint and several basis for the HHA Prepayment Amount and any related prepayment penalty. No real estate taxes were underwritten due to entry into the HHA Program, the HHA Prepayment Amount structure and the related recourse for the HHA Prepayment Amount.
THE INFORMATION IN THIS STRUCTURAL AND COLLATERAL TERM SHEET IS NOT COMPLETE AND MAY BE AMENDED PRIOR TO THE TIME OF SALE. THIS TERM SHEET IS NOT AN OFFER TO SELL THESE SECURITIES AND IT IS NOT A SOLICITATION OF AN OFFER TO BUY THESE SECURITIES IN ANY JURISDICTION WHERE THE OFFER OR SALE IS NOT PERMITTED. | ||
| 135 | ||
| Structural and Collateral Term Sheet | BBCMS 2025-5C34 | |
| No. 14 – Mia West | ||
Counsel for the HHA issued a legal opinion for the benefit of the lender opining it is more likely than not that the Mia West Property (including both the fee and leasehold interest therein) will be held by the Harris Central Appraisal District to be exempt from ad valorem taxation under the Texas Property Tax Code. It cannot be assured that the Mia West Property will be approved for the Tax Exemption. Until the Tax Exemption is granted, the borrower is required to make monthly deposits into a real estate tax reserve.
| Historical and Current Occupancy(1) | |||
| 2022 | 2023 | 2024 | Current(2) |
| 88.5% | 90.0% | 92.3% | 88.9% |
| (1) | Historical occupancies are as of December 31 of each respective year. |
| (2) | Current occupancy is based on the underwritten rent roll dated February 11, 2025. |
Environmental. According to the Phase I environmental report dated February 12, 2025, there was no evidence of any recognized environmental conditions at the Mia West Property.
The following table presents certain information relating to the operating history and underwritten cash flows of the Mia West Property:
| Operating History and Underwritten Cash Flow | ||||||
| 2023 | 2024 | TTM(1) | Underwritten | Per Unit | %(2) | |
| Gross Potential Rent | $3,051,428 | $3,157,887 | $3,173,723 | $3,263,943 | $12,089 | 100.0% |
| Other Income(3) | 361,794 | 457,614 | 467,348 | 531,179 | 1,967 | 16.3 |
| Vacancy, Credit Loss & Concessions | (677,245) | (350,535) | (346,029) | (420,173) | (1,556) | (12.9) |
| Effective Gross Income | $2,735,978 | $3,264,966 | $3,295,042 | $3,374,949 | $12,500 | 103.4% |
| Total Expenses | 1,773,164 | 1,630,810 | 1,610,074 | 1,261,771 | 4,673 | 37.4 |
| Net Operating Income(4) | $962,813 | $1,634,156 | $1,684,968 | $2,113,177 | $7,827 | 62.6% |
| Capital Expenditures | 0 | 0 | 0 | 67,500 | 250 | 2.0 |
| Net Cash Flow | $962,813 | $1,634,156 | $1,684,968 | $2,045,677 | $7,577 | 60.6% |
| (1) | TTM column reflects the trailing 12 months ending January 31, 2025. |
| (2) | % column represents percent of Gross Potential Rent for revenue lines and percent of Effective Gross Income for all remaining fields. |
| (3) | Other Income includes parking revenue, utility reimbursement, Wi-Fi income and other miscellaneous fees. |
| (4) | The increase in 2024 Net Operating Income from 2023 Net Operating Income is primarily due to an increase in average occupancy from 88.4% in 2023 to 94.0% in 2024 and a decrease in credit loss from $258,514 in 2023 to $71,403 in 2024 caused by a backlog of evictions that were completed in 2023. The increase in Underwritten Net Operating Income from TTM Net Operating Income is primarily due to the anticipated real estate tax savings related to the admission of the Mia West Property into the HHA Program. |
The Market. The Mia West Property is located in Houston, Texas within the Houston-The Woodlands-Sugar Land metropolitan statistical area (“Houston MSA”), approximately 18 miles west of downtown Houston. Primary access to the Mia West Property is provided by Beltway 8 and Westpark Tollway. The Mia West Property is located proximate to retail centers such as Market Square at Eldridge (2.3 miles away), featuring a Target, TJ Maxx & HomeGoods, Michaels, Burlington, PetSmart and Dollar Tree. The primary industries in the Houston MSA include energy, healthcare and aerospace, with Houston being home to Texas Medical Center, the largest medical complex in the world, and several higher education institutions including Rice University and University of Houston. The largest employers in the Houston metropolitan area include NASA Johnson Space Center, University of Texas Medical Branch, ExxonMobil and Shell Oil Co.
According to the appraisal, the estimated 2024 population within a one-, three- and five-mile radius of the Mia West Property was 21,370, 200,533 and 483,455, respectively. Additionally, the estimated 2024 median household income within the same radii was $46,674, $58,043 and $58,629, respectively.
The Mia West Property is located in the Briar Forest/West Memorial multifamily submarket. According to the appraisal, as of the fourth quarter of 2024, the Briar Forest/West Memorial multifamily submarket had an inventory of 33,229 units with a vacancy rate of 9.9% and an average rental rate of $1,378 per unit, an increase from $1,359 per unit as of the fourth quarter of 2023.
THE INFORMATION IN THIS STRUCTURAL AND COLLATERAL TERM SHEET IS NOT COMPLETE AND MAY BE AMENDED PRIOR TO THE TIME OF SALE. THIS TERM SHEET IS NOT AN OFFER TO SELL THESE SECURITIES AND IT IS NOT A SOLICITATION OF AN OFFER TO BUY THESE SECURITIES IN ANY JURISDICTION WHERE THE OFFER OR SALE IS NOT PERMITTED. | ||
| 136 | ||
| Structural and Collateral Term Sheet | BBCMS 2025-5C34 | |
| No. 14 – Mia West | ||
The following table presents multifamily rental data at comparable properties with respect to the Mia West Property:
| Competitive Rental Properties Summary(1) | |||||||
| Property Name/Location | Year Built/Renovated | # Units | Occupancy | Average Unit Size (SF) | Unit Mix | In-Place Monthly Rent per Unit | Average Asking Rent ($/SF) |
|
Mia West(2) Houston, TX |
1983 / 2022-2024 | 270 | 88.9% | 757 | Studio | $927 | $1.46 |
| 1BR | $929 | $1.34 | |||||
| 2BR | $1,287 | $1.30 | |||||
|
Ashford Court Houston, TX |
1984 / NAV | 440 | 91.0% | 634 | Studio | $825 - $1,095 | $1.54 - $2.62 |
| 1BR | $875 - $1,040 | $1.37 - $1.52 | |||||
| 2BR | $1,200 - $1,425 | $1.21 - $1.60 | |||||
|
Ashford Creek Houston, TX |
1983 / NAV | 188 | 92.0% | 791 | 1BR | $900 - $980 | $1.17 - $1.49 |
| 2BR | $950 - $1,250 | $1.12 - $1.23 | |||||
|
Magnolia Terrace Houston, TX |
1983 / NAV | 326 | 95.0% | 821 | 1BR | $813 - $894 | $1.09 - $1.35 |
| 2BR | $1,163 - $1,485 | $1.28 - $1.39 | |||||
|
Trails of Ashford Houston, TX |
1983 / NAV | 512 | 90.0% | 760 | Studio | $761 | $1.51 |
| 1BR | $811 - $960 | $1.08 - $1.28 | |||||
| 2BR | $1,061 - $1,230 | $0.86 - $1.26 | |||||
|
The Verano Houston, TX |
1980 / NAV | 312 | 95.0% | 725 | 1BR | $729 - $973 | $1.24 - $1.45 |
| 2BR | $998 - $1,299 | $1.16 - $1.45 | |||||
| 3BR | $1,988 | $1.66 | |||||
| (1) | Source: Appraisal, unless otherwise indicated. |
| (2) | Information other than Year Built/Renovated is based on the underwritten rent roll dated February 11, 2025. |
Ground Lease. At origination, the borrower entered into a ground lease between HHA, as ground lessor, and the borrower, as ground lessee. Pursuant to the ground lease, which is scheduled to terminate on March 31, 2124 with no extensions, and other documents entered into in relation to the Tax Exemption, the borrower is required to pay the HHA (or its affiliate), among other amounts, as applicable, (i) an annual oversight and compliance fee equal to the greater of (a) 0.5% of the Mia West Property’s gross income for the prior year or (b) $50,000, subject to annual increases of 3% (the “Compliance Fee”) and (ii) a monthly payment in the amount of 1/12th of 12% of the annual property tax savings received by the borrower pursuant to the related Tax Exemption (the “Tax Savings Payment” and, together with the Compliance Fee, the “HHA Payments”). In addition, pursuant to a subordination agreement amongst the borrower, its sole member, the HHA and the HHA-owned and controlled managing member of the borrower’s sole member, all fees and other amounts under the related ground lease and other documents and agreements entered into in relation to the Tax Exemption are to be paid from excess distributable cash, if any, after the payment of debt service payments in connection with the Mia West Mortgage Loan and operating expenses due and owing. Any deferred fees and other amounts may accrue until paid. The lender has established a reserve for the HHA Payments, provided that, absent a continuing event of default under the Mia West Mortgage Loan, there is no obligation to make deposits into the HHA Payments reserve unless the borrower fails to provide evidence of timely payment. The lender has a lien on both the leasehold interest, held by the borrower, and the fee interest, held by HHA, in the Mia West Property.
THE INFORMATION IN THIS STRUCTURAL AND COLLATERAL TERM SHEET IS NOT COMPLETE AND MAY BE AMENDED PRIOR TO THE TIME OF SALE. THIS TERM SHEET IS NOT AN OFFER TO SELL THESE SECURITIES AND IT IS NOT A SOLICITATION OF AN OFFER TO BUY THESE SECURITIES IN ANY JURISDICTION WHERE THE OFFER OR SALE IS NOT PERMITTED. | ||
| 137 | ||
| Structural and Collateral Term Sheet | BBCMS 2025-5C34 | |
| No. 15 – Hollister Place Apartments | ||
| Mortgage Loan Information | Property Information | |||
| Mortgage Loan Seller: | AREF2, KeyBank | Single Asset / Portfolio: | Single Asset | |
| Original Principal Balance: | $21,300,000 | Title(3): | Fee / Leasehold | |
| Cut-off Date Principal Balance: | $21,300,000 | Property Type - Subtype: | Multifamily - Garden | |
| % of IPB: | 2.7% | Net Rentable Area (Units): | 260 | |
| Loan Purpose: | Refinance | Location: | Houston, TX | |
| Borrowers(1): | Various | Year Built / Renovated: | 1997 / 2023-2024 | |
| Borrower Sponsors: | Ben Suttles, Feras Moussa, Brandon Turner and Brian Murray | Occupancy: | 95.4% | |
| Interest Rate: | 6.81000% | Occupancy Date: | 3/20/2025 | |
| Note Date: | 4/2/2025 | 4th Most Recent NOI (As of)(4): | NAV | |
| Maturity Date: | 4/6/2030 | 3rd Most Recent NOI (As of): | $1,801,627 (12/31/2023) | |
| Interest-only Period: | 60 months | 2nd Most Recent NOI (As of): | $1,644,410 (12/31/2024) | |
| Original Term: | 60 months | Most Recent NOI (As of)(5): | $1,691,742 (TTM 2/28/2025) | |
| Original Amortization Term: | None | UW Occupancy: | 91.9% | |
| Amortization Type: | Interest Only | UW Revenues: | $4,393,836 | |
| Call Protection: | L(6),YM2(50),O(4) | UW Expenses: | $2,460,039 | |
| Lockbox / Cash Management: | Soft / Springing | UW NOI(5): | $1,933,797 | |
| Additional Debt: | No | UW NCF: | $1,868,797 | |
| Additional Debt Balance: | N/A | Appraised Value / Per Unit: | $32,000,000 / $123,077 | |
| Additional Debt Type: | N/A | Appraisal Date: | 2/18/2025 | |
| Mortgage Loan Seller: | AREF2, KeyBank | Single Asset / Portfolio: | Single Asset | |
| Escrows and Reserves | Financial Information | |||||
| Initial | Monthly | Initial Cap | Cut-off Date Loan / Unit: | $81,923 | ||
| Taxes: | $246,598 | $61,649 | N/A | Maturity Date Loan / Unit: | $81,923 | |
| Insurance: | $134,789 | $26,958 | N/A | Cut-off Date LTV: | 66.6% | |
| Replacement Reserve: | $0 | $5,417 | N/A | Maturity Date LTV: | 66.6% | |
| PHFC Payments Reserve(2): | $0 | Springing | N/A | UW NCF DSCR: | 1.27x | |
| UW NOI Debt Yield: | 9.1% | |||||
| Sources and Uses | ||||||||
| Sources | Proceeds | % of Total | Uses | Proceeds | % of Total | |||
| Mortgage Loan | $21,300,000 | 97.3 | % | Loan Payoff | $20,221,468 | 92.4 | % | |
| Sponsor Equity | 582,665 | 2.7 | Closing Costs(6) | 1,279,811 | 5.8 | |||
| Upfront Reserves | 381,387 | 1.7 | ||||||
| Total Sources | $21,882,665 | 100.0 | % | Total Uses | $21,882,665 | 100.0 | % | |
| (1) | The borrowers are Hollister Place Holdings, LLC and Rice Hollister Holdings, LLC, as tenants-in-common, and are related to the borrower for the Porterwood Apartments mortgage loan. |
| (2) | Monthly deposits into the PHFC Payments Reserve are not required so long as (i) no event of default under the Hollister Place Apartments Mortgage Loan (as defined below) documents has occurred and is continuing and (ii) the borrower delivers evidence reasonably acceptable to the lender that all amounts due under the PHFC Program (as defined below) documents are paid timely. To the extent deposits are required, the borrower is required to pay to the lender an amount that is estimated by the lender to be sufficient to pay the next monthly or annual installment amount due under the PHFC Program documents, and the lender will transfer such amounts to the PHFC Payments Reserve. |
| (3) | The Hollister Place Apartments Property (as defined below) is encumbered by a 99-year ground lease as part of the Pecos Housing Finance Corporation program (“PHFC Program”). The Hollister Place Apartments Mortgage Loan is secured by the borrowers’ leasehold interest and the Pecos Housing Finance Corporation’s (“PHFC”) fee interest in the Hollister Place Apartments Property. See “The Property” and “Ground Lease” below for further information. |
| (4) | 4th Most Recent NOI is not available as the borrower sponsors acquired the Hollister Place Apartments Property in 2022. |
| (5) | The increase in UW NOI from Most Recent NOI is primarily due to an increase in physical occupancy from an average of 90.7% in the trailing twelve-months (“TTM”) ending February 2025 to the in-place physical occupancy as of March 20, 2025 of 95.4% and a decrease in underwritten credit loss compared to the TTM ending February 2025 as the TTM ending February 2025 experienced elevated credit loss expense due to a backlog of evictions that were completed in 2024. |
| (6) | Closing Costs include a rate buydown fee of $138,450. |
The Loan. The Hollister Place Apartments mortgage loan (the “Hollister Place Apartments Mortgage Loan”) has an outstanding principal balance as of the Cut-off Date of $21,300,000 and is secured by the borrowers’ leasehold interest and PHFC’s fee simple interest in a 260-unit garden-style multifamily property in Houston, Texas (the “Hollister Place Apartments Property”). The Hollister Place Apartments Mortgage Loan has a five-year term, is interest-only for the entire term and accrues interest at a fixed rate of 6.81000% per annum on an Actual/360 basis.
THE INFORMATION IN THIS STRUCTURAL AND COLLATERAL TERM SHEET IS NOT COMPLETE AND MAY BE AMENDED PRIOR TO THE TIME OF SALE. THIS TERM SHEET IS NOT AN OFFER TO SELL THESE SECURITIES AND IT IS NOT A SOLICITATION OF AN OFFER TO BUY THESE SECURITIES IN ANY JURISDICTION WHERE THE OFFER OR SALE IS NOT PERMITTED. | ||
| 138 | ||
| Structural and Collateral Term Sheet | BBCMS 2025-5C34 | |
| No. 15 – Hollister Place Apartments | ||
The Property. The Hollister Place Apartments Property is a 260-unit garden-style multifamily property located in Houston, Texas, approximately 15 miles northwest of downtown Houston. Built in 1997 and renovated from 2023 to 2024, the Hollister Place Apartments Property is comprised of 16, three-story buildings on a 14.00-acre site. The unit mix includes 140 one-bedroom units, 96 two-bedroom units and 24 three-bedroom units, with an average unit size of 923 square feet. Community amenities include a clubhouse, business center, fitness center, pool, and a dog park. Unit amenities include dishwashers, ceiling fans, patio/balcony, private yards, walk-in closets, and in-unit laundry Since acquisition in 2022, the borrower sponsors have invested approximately $2.8 million (approximately $10,750 per unit) in capital expenditures. The Hollister Place Apartments Property contains 416 parking spaces which results in a parking ratio of 1.6 spaces per unit.
The following table presents detailed information with respect to the unit mix at the Hollister Place Apartments Property:
| Unit Mix(1) | |||||||
| Unit Type | # of Units | % of Total | Occupied Units | Occupancy | Average Unit Size (SF) | Average Monthly Rental Rate | Average Monthly Rental Rate PSF |
| 1 Bedroom | 140 | 53.8% | 134 | 95.7% | 761 | $1,120 | $1.47 |
| 2 Bedroom | 96 | 36.9% | 91 | 94.8% | 1,062 | $1,396 | $1.31 |
| 3 Bedroom | 24 | 9.2% | 23 | 95.8% | 1,315 | $1,788 | $1.36 |
| Total/Wtd. Avg. | 260 | 100.0% | 248 | 95.4% | 923 | $1,283 | $1.39 |
| (1) | Information based on the underwritten rent roll dated March 20, 2025. |
The Hollister Place Apartments Property is encumbered by a 99-year ground lease as part of the PHFC Program. Pursuant to the PHFC Program’s policies, a property will qualify for a 100% real estate tax exemption if it meets certain criteria, largely relating to affordable housing. Provisions specific to affordable housing concentration for the Hollister Place Apartments Property require that 90% of units must be restricted at 140% Area Median Income (“AMI”), including 50% of units at 80% AMI or less. The Hollister Place Apartments Property currently complies with the AMI requirements and is pending approval from the related central appraisal district for the tax exemption. The lender has underwritten full property taxes as if the Hollister Place Apartments Property was not enrolled in the PHFC Program. It cannot be assured that the Hollister Place Apartments Property will be approved for the exemption.
| Historical and Current Occupancy(1) | |||
| 2022 | 2023 | 2024 | Current(2) |
| NAV | 92.1% | 90.9% | 95.4% |
| (1) | Historical occupancies are based on the average occupancies throughout each respective year. 2022 occupancy is not available as the borrower sponsors acquired the Hollister Place Apartments Property in December 2022. |
| (2) | Current occupancy is based on the underwritten rent roll dated March 20, 2025. |
Environmental. According to the Phase I environmental report dated February 21, 2025, there was no evidence of any recognized environmental conditions at the Hollister Place Apartments Property.
THE INFORMATION IN THIS STRUCTURAL AND COLLATERAL TERM SHEET IS NOT COMPLETE AND MAY BE AMENDED PRIOR TO THE TIME OF SALE. THIS TERM SHEET IS NOT AN OFFER TO SELL THESE SECURITIES AND IT IS NOT A SOLICITATION OF AN OFFER TO BUY THESE SECURITIES IN ANY JURISDICTION WHERE THE OFFER OR SALE IS NOT PERMITTED. | ||
| 139 | ||
| Structural and Collateral Term Sheet | BBCMS 2025-5C34 | |
| No. 15 – Hollister Place Apartments | ||
The following table presents certain information relating to the operating history and underwritten cash flows of the Hollister Place Apartments Property:
| Operating History and Underwritten Cash Flow | ||||||
| 2023 | 2024 | TTM(1) | Underwritten | Per Unit | %(2) | |
| Gross Potential Rent | $4,237,179 | $4,299,803 | $4,303,225 | $4,017,300 | $15,451 | 100.0% |
| Other Income(3) | 732,245 | 675,908 | 687,161 | 703,135 | 2,704 | 17.5 |
| Vacancy, Credit Loss & Concessions | (825,558) | (805,903) | (808,435) | (326,600) | (1,256) | (8.1) |
| Effective Gross Income | $4,143,865 | $4,169,808 | $4,181,951 | $4,393,836 | $16,899 | 109.4% |
| Total Operating Expenses(4) | 2,342,238 | 2,525,398 | 2,490,209 | 2,460,039 | 9,462 | 56.0 |
| Net Operating Income(5) | $1,801,627 | $1,644,410 | $1,691,742 | $1,933,797 | $7,438 | 44.0% |
| Capital Expenditures | 0 | 0 | 0 | 65,000 | 250 | 1.5 |
| Net Cash Flow | $1,801,627 | $1,644,410 | $1,691,742 | $1,868,797 | $7,188 | 42.5% |
| (1) | TTM column reflects the trailing 12 months ending February 28, 2025. |
| (2) | % column represents percent of Gross Potential Rent for revenue lines and percent of Effective Gross Income for all remaining fields. |
| (3) | Other Income consists of parking revenue, utility reimbursement, internet/cable and other miscellaneous fees. |
| (4) | While the Hollister Place Apartments Property is expected to benefit from the PHFC Program and have 100% abated taxes, full property taxes were underwritten. Excluding real estate taxes would increase the underwritten net cash flow debt service coverage ratio from 1.27x to 1.77x and increase the underwritten net operating income debt yield from 9.1% to 12.6%. It cannot be assured that the Hollister Place Apartments Property will be approved for the tax exemption. |
| (5) | The increase in Underwritten Net Operating Income from TTM Net Operating Income is primarily due to an increase in physical occupancy from an average of 90.7% in the TTM ending February 2025 to the in-place physical occupancy as of March 20, 2025 of 95.4% and a decrease in underwritten credit loss compared to the TTM ending February 2025 as the TTM ending February 2025 experienced elevated credit loss expense due to a backlog of evictions that were completed in 2024. |
The Market. The Hollister Place Apartments Property is located in Houston, Texas within the Houston-The Woodlands-Sugar Land metropolitan statistical area (“Houston MSA”), approximately 15 miles northwest of downtown Houston. Primary access to the Hollister Place Apartments Property is provided by U.S. Route 290 and State Highway 8. The Hollister Place Apartments Property is located proximate to retail centers such as a Walmart Supercenter (0.7 miles away) and Northwest Crossing (0.5 miles away), a shopping center featuring a Target, Dollar Tree, Marshalls, Burlington, and Planet Fitness. The primary industries in the Houston MSA include energy, healthcare, and aerospace, with Houston being home to Texas Medical Center, the largest medical complex in the world, and several higher education institutions including Rice University and University of Houston. The largest employers in the Houston metropolitan area include NASA Johnson Space Center, University of Texas Medical Branch, ExxonMobil, and Shell Oil Co.
According to the appraisal, the estimated 2024 population within a one-, three- and five-mile radius of the Hollister Place Apartments Property was 13,700, 120,793 and 322,687, respectively. Additionally, the estimated 2024 median household income within the same radii was $49,827, $56,600 and $62,109, respectively.
The Hollister Place Apartments Property is located
in the Northwest Houston multifamily submarket. According to the appraisal, as of the fourth quarter of 2024, the Northwest Houston multifamily
submarket had an inventory of 30,696 units with a vacancy rate of 6.9% and an average rental rate of $1,082 per unit, a slight decrease
from $1,086 per unit as of the previous quarter.
THE INFORMATION IN THIS STRUCTURAL AND COLLATERAL TERM SHEET IS NOT COMPLETE AND MAY BE AMENDED PRIOR TO THE TIME OF SALE. THIS TERM SHEET IS NOT AN OFFER TO SELL THESE SECURITIES AND IT IS NOT A SOLICITATION OF AN OFFER TO BUY THESE SECURITIES IN ANY JURISDICTION WHERE THE OFFER OR SALE IS NOT PERMITTED. | ||
| 140 | ||
| Structural and Collateral Term Sheet | BBCMS 2025-5C34 | |
| No. 15 – Hollister Place Apartments | ||
The following table presents multifamily rental data at comparable properties with respect to the Hollister Place Apartments Property:
| Competitive Rental Properties Summary(1) | |||||||
| Property Name/Location | Year Built/Renovated | # Units | Occupancy | Average Unit Size (SF) | Unit Mix | In-Place Monthly Rent per Unit |
Average Asking Rent ($/SF)
|
|
Hollister Place Apartments Houston, TX |
1997 / 2023-2024 | 260(2) | 95.4%(2) | 923(2) | 1BR | $1,120(2) | $1.47(2) |
| 2BR | $1,396(2) | $1.31(2) | |||||
| 3BR | $1,788(2) | $1.36(2) | |||||
|
The Ambrose Houston, TX |
1999 / NAV | 408 | 91.0% | 958 | 1BR | $836 - $1,051 | $1.05 - $1.38 |
| 2BR | $956 - $1,445 | $1.12 - $1.41 | |||||
| 3BR | $1,689 - $1,792 | $1.18 - $1.28 | |||||
|
Beckley Houston, TX |
1999 / NAV | 210 | 94.0% | 920 | 1BR | $975 - $1,299 | $1.48 - $1.56 |
| 2BR | $1,490 - $1,800 | $1.44 - $1.63 | |||||
| 3BR | $1,785 | $1.36 | |||||
|
The Bellagio Houston, TX |
2003 / NAV | 235 | 97.0% | 973 | 1BR | $1,232 - $1,868 | $1.53 - $2.03 |
| 2BR | $1,565 - $1,914 | $1.28 - $1.83 | |||||
|
The Estates at Hollister Houston, TX |
2005 / NAV | 323 | 90.0% | 1,257 | 1BR | $1,068 - $1,218 | $1.06 - $1.21 |
| 2BR | $1,457 - $1,607 | $1.10 - $1.22 | |||||
| 3BR | $1,810 - $1,882 | $1.10 - $1.14 | |||||
|
The Franklin Houston, TX |
2004 / NAV | 196 | 85.0% | 917 | 1BR | $1,202 - $1,313 | $1.60 - $1.78 |
| 2BR | $1,481 - $1,613 | $1.38 - $1.42 | |||||
| 3BR | $1,584 | $1.27 | |||||
| (1) | Source: Appraisal, unless otherwise indicated. |
| (2) | Based on the underwritten rent roll dated March 20, 2025. |
Ground Lease. At origination, the borrowers entered into a ground lease between PHFC, as ground lessor, and the borrowers, as ground lessee. Pursuant to the ground lease, which is scheduled to terminate on April 30, 2124 with no extensions, and other documents and agreements entered into in relation to the tax exemption, each borrower is required to pay in the aggregate, among other amounts, as applicable, (i) an annual compliance fee of $50 per unit (the “Compliance Payment”) and (ii) annual rent to the PHFC equal to 10% of the annual property tax savings (the “Savings Fee”, and together with the Compliance Payment, the “Rent”) with the Rent increasing by 2% per year. Each borrower, its managing member and PHFC entered into a subordination agreement agreeing that for so long as the tax exemption remains in effect, all fees required under the PHFC Program documents, including the Savings Fee but excluding the Compliance Payment, are to be paid from excess distributable cash, if any, after the payment of debt service payments in connection with each Mortgage Loan and operating expenses due and owing. The lender has a lien on both the leasehold interest, held by the borrowers, and the fee interest, held by PHFC, in the Hollister Place Apartments Property.
THE INFORMATION IN THIS STRUCTURAL AND COLLATERAL TERM SHEET IS NOT COMPLETE AND MAY BE AMENDED PRIOR TO THE TIME OF SALE. THIS TERM SHEET IS NOT AN OFFER TO SELL THESE SECURITIES AND IT IS NOT A SOLICITATION OF AN OFFER TO BUY THESE SECURITIES IN ANY JURISDICTION WHERE THE OFFER OR SALE IS NOT PERMITTED. | ||
| 141 | ||
| Structural and Collateral Term Sheet | BBCMS 2025-5C34 | |
| Contacts | ||
| Barclays CMBS Capital Markets & Banking | ||
| Contact | Phone Number | |
| Daniel Schmidt - Director | daniel.schmidt@barclays.com | (212) 528-7479 |
| Sammy Hamididdin - Director | sammy.hamididdin@barclays.com | (212) 526-4751 |
| Walter Johnston – Director | walter.johnston@barclays.com | (212) 526-5248 |
| Kara Foley – Vice President | kara.foley@barclays.com | (212) 526-4972 |
| Matthew Jacob – Assistant Vice President | matthew.jacob@barclays.com | (212) 526-7268 |
| Barclays CMBS Trading | ||
| David Kung - Director | david.kung@barclays.com | (212) 528-7374 |
| Peter Taylor - Director | peter.w.taylor@barclays.com | (212) 526-1528 |
| Barclays Securitized Products Syndicate | ||
| Brian Wiele – Managing Director | brian.wiele@barclays.com | (212) 412-5780 |
| Sean Foley - Director | sean.foley@barclays.com | (212) 412-5780 |
| Citigroup CMBS Capital Markets and Banking | ||
| Raul Orozco – Managing Director | raul.d.orozco@citi.com | (212) 723-1295 |
| Rick Simpson – Managing Director | richard.simpson@citi.com | (212) 816-5343 |
| Deutsche Bank CMBS Capital Markets and Banking | ||
| Lainie Kaye – Managing Director | lainie.kaye@db.com | (212) 250-5270 |
| Daniel Penn - Director | daniel.penn@db.com | (212) 250-5149 |
| KeyBank CMBS Capital Markets and Banking | ||
| Joe DeRoy, Jr. – Senior Vice President | joe_a_deroy@keybank.com | (913) 317-4230 |
| Jeffrey Watzke – Senior Vice President | jeffrey_d_watzke@keybank.com | (312) 730-2795 |
| Kathy Messmer – Vice President | kathy_messmer@keybank.com | (913) 317-4153 |
| UBS CMBS Capital Markets and Banking | ||
| Nicholas Galeone – Managing Director | nicholas.galeone@ubs.com | (212) 713-8832 |
| Siho Ham – Managing Director | siho.ham@ubs.com | (212) 713-1278 |
Michael Barbieri – Executive Director |
michael.barbieri@ubs.com |
(212) 713-1181 |
| Andrew Lisa – Executive Director | andrew.lisa@ubs.com | (212) 713-3506 |
THE INFORMATION IN THIS STRUCTURAL AND COLLATERAL TERM SHEET IS NOT COMPLETE AND MAY BE AMENDED PRIOR TO THE TIME OF SALE. THIS TERM SHEET IS NOT AN OFFER TO SELL THESE SECURITIES AND IT IS NOT A SOLICITATION OF AN OFFER TO BUY THESE SECURITIES IN ANY JURISDICTION WHERE THE OFFER OR SALE IS NOT PERMITTED. | ||
| 142 | ||