The Portfolio seeks long-term capital appreciation.
This table describes the fees and expenses that you may pay if you buy, hold and sell shares of the Portfolio, a series of The Lazard Funds, Inc. (the “Fund”). You may pay other fees, such as brokerage commissions and other fees to financial intermediaries, which are not reflected in the table and the Example below.
Annual Fund Operating Expenses - Lazard International Equity Select Portfolio |
Institutional |
Open |
R6 |
||
|---|---|---|---|---|---|
| Management Fees | 0.65% | 0.65% | 0.65% | ||
| Distribution and Service (12b-1) Fees | none | 0.25% | none | ||
| Fees and Expenses Related to Filing Foreign Tax Reclaims | 0.03% | 0.03% | 0.03% | [1] | |
| Remainder of Other Expenses | 0.35% | 0.52% | 0.35% | [1] | |
| Total Other Expenses | 0.38% | 0.55% | 0.38% | [1] | |
| Total Annual Portfolio Operating Expenses | 1.03% | 1.45% | 1.03% | ||
| Fee Waiver and/or Expense Reimbursement | [2] | 0.13% | 0.30% | 0.18% | |
| Total Annual Portfolio Operating Expenses After Fee Waiver and/or Expense Reimbursement | 0.90% | 1.15% | 0.85% | ||
| [1] | Remainder of Other Expenses |
| [2] | .13% |
This Example is intended to help you compare the cost of investing in the Portfolio with the cost of investing in other mutual funds.
The Example assumes that you invest $10,000 in the Portfolio for the time periods indicated and then hold or redeem all of your shares at the end of those periods. The Example also assumes that your investment has a 5% return each year and that the Portfolio’s operating expenses remain the same, giving effect to the expense limitation agreement described above. Although your actual costs may be higher or lower, based on these assumptions your costs would be:
Expense Example - Lazard International Equity Select Portfolio - USD ($) |
Institutional |
Open |
R6 |
|---|---|---|---|
| 1 Year | $ 92 | $ 117 | $ 87 |
| 3 Years | 315 | 429 | 310 |
| 5 Years | 556 | 764 | 551 |
| 10 Years | $ 1,248 | $ 1,709 | $ 1,243 |
The Portfolio pays transaction costs, such as commissions, when it buys and sells securities (or “turns over” its portfolio). A higher portfolio turnover rate may indicate higher transaction costs and may result in higher taxes
when Portfolio shares are held in a taxable account. These costs, which are not reflected in annual portfolio operating expenses or in the Example, affect the Portfolio’s performance. During the most recent fiscal year, the Portfolio’s portfolio turnover rate was 40% of the average value of its portfolio.
The Portfolio invests primarily in equity securities, including common stocks, of relatively large non-US companies with market capitalizations in the range of companies included in the MSCI All Country World Index ex-US (ranging from approximately $3.3 million to $1.7 trillion as of March 31, 2025) that the Investment Manager believes are undervalued based on their earnings, cash flow or asset values.
In choosing stocks for the Portfolio, the Investment Manager looks for established companies in economically developed countries, although the Portfolio may invest in securities of companies whose principal business activities are located in emerging market countries in an amount up to the current emerging markets component of the MSCI All Country World Index ex-US plus 15%. The allocation of the Portfolio’s assets to emerging market countries may vary from time to time.
Under normal circumstances, the Portfolio invests at least 80% of its assets in equity securities.
Although the Portfolio is classified as “diversified” under the Investment Company Act of 1940, as amended, it may invest in a smaller number of issuers than other, more diversified investment portfolios.
Risk Table - Lazard International Equity Select Portfolio |
Risk [Text Block] |
|---|---|
| Principal Investment Risks | Principal Investment Risks The value of your investment in the Portfolio will fluctuate, which means you could lose money. |
| Risk Lose Money [Member] | The value of your investment in the Portfolio will fluctuate, which means you could lose money. |
| Market Risk | Market Risk: The Portfolio may incur losses due to declines in one or more markets in which it invests. These declines may be the result of, among other things, political, regulatory, market, economic or social developments affecting the relevant market(s). To the extent that such developments impact specific industries, market sectors, countries or geographic regions, the Portfolio’s investments in such industries, market sectors, countries and/or geographic regions can be expected to be particularly affected, especially if such investments are a significant portion of its investment portfolio. In addition, turbulence in financial markets and reduced liquidity in equity, credit and/or fixed income markets may negatively affect many issuers, which could adversely affect the Portfolio. Global economies and financial markets are increasingly interconnected, and conditions and events in one country, region or financial market may adversely impact issuers worldwide. As a result, local, regional or global events such as war or military conflict, acts of terrorism, the spread of infectious illness or other public health issues, social unrest, natural disasters, extreme weather, other geological events, man-made disasters, supply chain disruptions, deflation, inflation, government defaults, government shutdowns, the imposition of sanctions or other similar measures, recessions or other events could have a significant negative impact on global economic and market conditions. For example, a public health or other emergency and aggressive responses taken by many governments or voluntarily imposed by private parties, including closing borders, restricting travel and imposing prolonged quarantines or similar restrictions, as well as the closure of, or operational changes to, many retail and other businesses, may have severe negative impacts on markets worldwide. Additionally, general market conditions may affect the value of a Portfolio’s securities, including changes in interest rates, currency rates or monetary policies. Furthermore, the imposition of tariffs, trade restrictions, currency restrictions or similar actions (or retaliatory measures taken in response to such actions), or the threat or potential of one or more such events and developments, could lead to price volatility and overall declines in the US and global investment markets. |
| Issuer Risk | Issuer Risk: The value of a security may decline for a number of reasons which directly relate to the issuer, such as management performance, financial leverage and reduced demand for the issuer’s goods or services, as well as the historical and prospective earnings of the issuer and the value of its assets or factors unrelated to the issuer’s value, such as investor perception. |
| Non-US Securities Risk | Non-US Securities Risk: The Portfolio’s performance will be influenced by political, social and economic factors affecting the non-US countries and companies in which the Portfolio invests. Non-US securities carry special risks, such as less developed or less efficient trading markets, political instability, a lack of company information, differing auditing and legal standards, and, potentially, less liquidity. Non-US securities may be subject to economic sanctions or other governmental actions or developments, exchange controls (including repatriation restrictions), confiscations, trade restrictions (including tariffs) or problems related to share registration, trade settlement or asset custody, which could, among other things, effectively restrict or eliminate the Portfolio’s ability to purchase or sell certain foreign securities. To the extent the Portfolio holds securities subject to such actions, the securities may become difficult to value and/or less liquid (or illiquid). In some cases, the securities may become worthless. |
| Emerging Market Risk | Emerging Market Risk: Emerging market countries generally have economic structures that are less diverse and mature, and political systems that are less stable, than those of developed countries. The economies of countries with emerging markets may be based predominantly on only a few industries, may be highly vulnerable to changes in local or global trade conditions, and may suffer from extreme debt burdens or volatile inflation rates. Further, investments in securities of issuers located in certain emerging countries involve the risk of loss resulting from problems in share registration, settlement or custody, substantial economic, political and social disruptions and the imposition of sanctions or exchange controls (including repatriation restrictions). The securities markets of emerging market countries have historically been extremely volatile and less liquid than more developed markets. These market conditions may continue or worsen. Investments in these countries may be subject to political, economic, legal, market and currency risks. Significant devaluation of emerging market currencies against the US dollar may occur subsequent to acquisition of investments denominated in emerging market currencies. |
| Foreign Currency Risk | Foreign Currency Risk: Investments denominated in currencies other than US dollars may experience a decline in value, in US dollar terms, due solely to fluctuations in currency exchange rates. The Portfolio’s investments denominated in such currencies (particularly currencies of emerging markets countries), as well as any investments in currencies themselves, could be adversely affected by delays in, or a refusal to grant, repatriation of funds or conversion of currencies. Irrespective of any foreign currency exposure hedging, the Portfolio may experience a decline in the value of its portfolio securities, in US dollar terms, due solely to fluctuations in currency exchange rates. The Investment Manager does not intend to actively hedge the Portfolio’s foreign currency exposure. |
| Focused Investing Risk | Focused Investing Risk: The Portfolio’s net asset value may be more vulnerable to changes in the market value of a single issuer or group of issuers and may be relatively more susceptible to adverse effects from any single corporate, industry, economic, market, political or regulatory occurrence than if the Portfolio’s investments consisted of securities issued by a larger number of issuers. |
| Value Investing Risk | Value Investing Risk: Value investments are believed by the Investment Manager to be undervalued, but may not realize their perceived value for extended periods of time or may never realize their perceived value. These securities may respond differently to market and other developments than other types of securities. |
| Large Cap Companies Risk | Large Cap Companies Risk: Investments in large cap companies may underperform other segments of the market when such other segments are in favor or because such companies may be less responsive to competitive challenges and opportunities and may be unable to attain high growth rates during periods of economic expansion. |
| Securities Selection Risk | Securities Selection Risk: Securities and other investments selected by the Investment Manager for the Portfolio may not perform to expectations. This could result in the Portfolio’s underperformance compared to other funds with similar investment objectives or strategies. |
The accompanying bar chart and table provide some indication of the risks of investing in Lazard International Equity Select Portfolio by showing the Portfolio’s year-by-year performance and its average annual performance compared to that of a broad measure of market performance. The bar chart shows how the performance of the Portfolio’s Institutional Shares has varied from year to year over the past 10 calendar years. Updated performance information is available at www.lazardassetmanagement.com or by calling (800) 823-6300. The Portfolio’s past performance (before and after taxes) is not necessarily an indication of how the Portfolio will perform in the future.
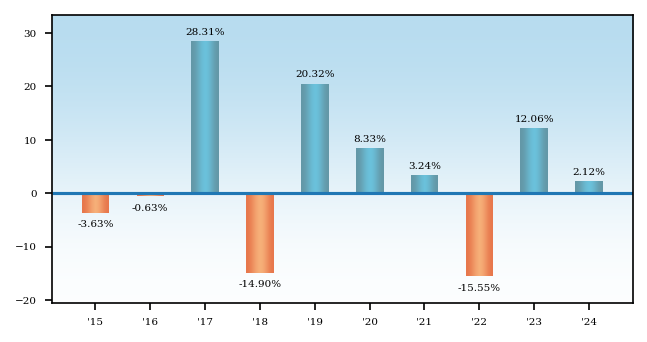
Best Quarter: | |
2020, Q2 | 15.47% |
|
|
Worst Quarter: | |
2020, Q1 | -23.98% |
After-tax returns are shown only for Institutional Shares. After-tax returns of the Portfolio’s other share classes will vary. After-tax returns are calculated using the historical highest individual marginal income tax rates and do not reflect the impact of state and local taxes. Actual after-tax returns depend on the investor’s tax situation and may differ from those shown. The after-tax returns shown are not relevant to investors who hold their shares through tax-deferred arrangements such as 401(k) plans or individual retirement accounts.
Returns shown below for the Portfolio’s R6 Shares (which were not operational as of December 31, 2024) reflect the performance of the Portfolio’s Institutional Shares. R6 Shares would have had substantially similar returns as Institutional Shares because the share classes are invested in the same portfolio of securities, and the returns would differ only to the extent that the classes do not have the same expenses.
Average Annual Total Returns - Lazard International Equity Select Portfolio |
Label |
1 Year |
5 Years |
10 Years |
Inception Date |
|---|---|---|---|---|---|
| Institutional | 2.12% | 1.57% | 3.12% | May 31, 2001 | |
| Institutional | After Taxes on Distributions | 1.75% | 1.30% | 2.91% | ||
| Institutional | After Taxes on Distributions and Sales | 1.60% | 1.40% | 2.64% | ||
| Open | 1.85% | 1.32% | 2.84% | May 31, 2001 | |
| R6 | 2.12% | 1.57% | 3.12% | ||
| MSCI ACWI ex-US Index | MSCI ACWI ex-US Index | 5.53% | 4.10% | 4.80% |