As filed with the Securities and Exchange Commission on April 29, 2025
Registration Nos. 333-149540; 811-09507
UNITED STATES
SECURITIES AND EXCHANGE COMMISSION
FORM N-6
REGISTRATION STATEMENT
UNDER
|
|
THE SECURITIES ACT OF 1933
|
|
|
|
Pre-Effective Amendment No.
|
☐
|
|
|
Post-Effective Amendment No. 19
|
☒
|
and/or
REGISTRATION STATEMENT
UNDER
THE INVESTMENT COMPANY ACT OF 1940
|
|
Amendment No. 61
|
☒
|
FARMERS VARIABLE LIFE SEPARATE ACCOUNT A
(Exact Name of Registrant)
FARMERS NEW WORLD LIFE INSURANCE COMPANY
(Name of Depositor)
3120 139th Ave SE, Suite 300, Bellevue, Washington 98005
(Address of Depositor’s Principal Executive Offices)
1-800-238-9671
(Depositor’s Telephone Number)
Tina de Jong
Special Corporate Counsel and Corporate Secretary
Farmers New World Life Insurance Company
3120 139th Ave SE, Suite 300
Bellevue, Washington 98005
(Name and Address of Agent for Service)
Approximate date of proposed public offering: Continuous
It is proposed that this filing will become effective (check appropriate box):
☐ immediately upon filing pursuant to paragraph (b) of Rule 485
☒ on May 1, 2025 pursuant to paragraph (b) of Rule 485
☐ days after filing pursuant to paragraph (a)(1) of Rule 485
☐ on (date) pursuant to paragraph (a)(1) of Rule 485
If appropriate, check the following box:
| ☐ |
this post-effective amendment designates a new effective date for a previously-filed post-effective amendment.
|
Prospectus
May 1, 2025
Farmers EssentialLife® Variable Universal Life
A FLEXIBLE PREMIUM VARIABLE UNIVERSAL LIFE INSURANCE POLICY
ISSUED THROUGH:
Farmers Variable Life Separate Account A
BY
Farmers New World Life Insurance Company
This prospectus describes Farmers EssentialLife® Variable Universal Life, an individual flexible premium variable life insurance
policy (the “Policy”), issued by Farmers New World Life Insurance Company. The Policy provides life insurance, with a life insurance benefit (called the “Death Benefit Amount Payable”) that we will pay if the Insured dies while the Policy is in
force. The amount of life insurance may increase or decrease depending on the number of years the Policy is in force and the investment experience of the Subaccounts of the Farmers Variable Life Separate Account A (the “Variable Account”) in
which you invest.
This Policy is currently not being issued.
This prospectus provides basic information that you should know before investing. You should keep this prospectus for future reference. Additional
information about certain investment products, including variable life insurance, has been prepared by the Securities and Exchange Commission’s staff and is available at www.investor.gov.
Replacing your existing life insurance with this Policy may not be to your advantage. In addition, it may not be to your advantage to
finance the purchase of or to maintain this Policy through a loan or through Surrenders or partial Surrenders from another policy.
An investment in this Policy is not a bank deposit, and the Policy is not insured or guaranteed by the Federal
Deposit Insurance Corporation or any other government agency.
Investing in this Policy involves risk, including possible loss of Premiums. Please read the “Principal Policy
Risks” section of this prospectus. It describes some of the risks associated with investing in the Policy.
|
The Securities and Exchange Commission has not approved or disapproved this Policy or determined that this prospectus is accurate or complete.
Anyone who tells you otherwise is committing a federal crime.
|
|
Not FDIC Insured
|
|
May Lose Value
|
|
No Bank Guarantee
|
Table of Contents
|
3
|
|
|
6
|
|
|
8
|
|
|
9
|
|
|
12
|
|
|
12
|
|
|
12
|
|
|
12
|
|
|
13
|
|
|
13
|
|
|
13
|
|
|
14
|
|
|
14
|
|
|
14
|
|
|
14
|
|
|
15
|
|
|
15
|
|
|
15
|
|
|
15
|
|
|
15
|
|
|
16
|
|
|
16
|
|
|
18
|
|
|
18
|
|
|
18
|
|
|
18
|
|
|
19
|
|
|
19
|
|
|
20
|
|
|
20
|
|
|
20
|
|
|
21
|
|
|
21
|
|
|
22
|
|
|
22
|
|
|
23
|
|
|
23
|
|
|
24
|
|
|
24
|
|
|
24
|
|
|
25
|
|
|
25
|
|
|
25
|
|
|
25
|
|
|
26
|
|
|
26
|
|
|
28
|
|
|
29
|
|
|
29
|
|
|
30
|
|
|
30
|
|
|
30
|
|
|
30
|
|
|
30
|
|
|
31
|
|
|
32
|
|
|
32
|
|
|
32
|
|
|
34
|
|
|
34
|
|
|
43
|
|
|
43
|
|
|
43
|
|
|
44
|
|
|
45
|
|
|
45
|
|
|
45
|
|
|
46
|
|
|
49
|
|
|
49
|
|
|
49
|
|
|
50
|
|
|
50
|
|
|
50
|
|
|
51
|
|
|
51
|
|
|
51
|
|
|
52
|
|
|
56
|
|
|
56
|
|
|
57
|
|
|
57
|
|
|
A-58
|
|
|
B-63
|
|
|
C-66
|
|
|
D-68
|
For your convenience, we are providing a glossary of the special terms we use in this prospectus.
Accumulation Unit Value. An accounting unit we use to calculate Subaccount values. It measures the net investment
results of each of the Subaccounts.
Attained Age. The sum of the Issue Age plus the number of Policy Years completed since the Issue Date.
Beneficiary. The Beneficiary is the natural person(s) or the entity(ies) named to receive the Death benefit Amount
Payable at the Insured’s death.
Business Day. Each day that the NYSE is open for regular trading. Farmers New World Life Insurance Company is open
to administer the Policy on each day the NYSE is open for regular trading. When we use the term “Business Day” in the Prospectus, it has the same meaning as the term “Valuation Day” found in the Policy.
Cash Surrender Value. The amount we will pay you if you fully surrender the Policy while it is in force. The Cash
Surrender Value on the date you surrender is equal to: the Contract Value, minus the Surrender Charge, if any, minus any Monthly Deduction due and unpaid, and minus any Policy Loan Balance.
Company (we, us, our, Farmers, FNWL). Farmers New World Life Insurance Company
Contract Value. On the Valuation Day, the Contract Value is equal to the Fixed Account Value plus the Subaccount
Policy Value plus any Loan Account Value.
Death Benefit Amount Payable. If the Insured dies while the Policy is In Force, the amount we will pay to the
Beneficiary on receipt of satisfactory Proof of Death is the Death Benefit in effect as of the date of death; less any Monthly Deductions due and unpaid at the date of death; less any Policy Loan Balance; plus the amounts to be paid under the
terms of any attached riders.
Face Amount. An amount chosen by you that is used to determine the Death Benefit. The actual Death Benefit Amount
Payable paid upon death may be more or less than the Face Amount. Face Amount is sometimes referred to as Principal Sum.
Fixed Account. An account that is secured by our general account, and is not a part of or dependent on the
investment performance of the Variable Account.
Fixed Account Value. The portion of your Contract Value allocated to the Fixed Account. Your Policy’s Fixed
Account Value is backed by our general account, and is not a part of or dependent on the investment performance of the Variable Account.
Fund(s). Investment companies that are registered with the SEC. The Policy allows you to invest in the portfolios
of the funds that are listed in Appendix A of the Prospectus.
General Account. The account containing all of Farmers’ assets, other than those held in its separate accounts.
Home Office. The address of our Home Office is 3120 139th Ave SE, Suite 300, Bellevue, WA 98005.
Initial Premium. The amount you must pay before insurance coverage begins under the Policy. The initial premium is
shown on your Policy’s specification page.
Insured. The natural person whose life is Insured by this Policy.
Issue Age. The Insured’s age as of his/her last birthday on this Policy’s Issue Date.
Issue Date. The effective date for the insurance coverage under this Policy, provided the first Premium Payment
has been made. Policy Months, Years, and Anniversaries are measured from the Issue Date.
Loan Account Value. The portion of your Contract Value allocated to the loan account.
Lapse. The termination of this Policy due to nonpayment of sufficient Premium Payments or Loan Repayments. A
policy that has lapsed provides no further values or benefits.
Monthly Deduction. The amount we deduct from the Contract Value each month to pay for the insurance coverage. The
Monthly Deduction is the Cost of Insurance Charge for the Policy; plus the Risk Charges of any attached riders; plus the Monthly Administration Charge; plus any Monthly Underwriting and Sales Expense Charge.
Monthly Due Date. The day of each month on which Monthly Deductions are determined and become due. It is on the
same day of the month as the Issue Date.
NYSE. The New York Stock Exchange
Outstanding Loan Amount. The Policy Loan Balance is the sum of Policy Loans taken; plus accrued loan interest;
minus the sum of Loan Repayments. The loan account is part of our General Account. The outstanding loan amount, or loan account value, is defined as the “Policy Loan Balance” in the Policy.
Portfolio. A series of a Fund with its own objective and policies, which represents shares of beneficial interest
in a separate portfolio of securities and other assets. Portfolio is sometimes referred to herein as a Fund.
Premium Class. An underwriting classification that is used to determine the Monthly Deduction, Surrender Charge,
and Minimum Premium.
Premiums. Any Planned or Unplanned Premium Payment for this Policy and any attached riders. When we use the term
“premium” in the Prospectus, it generally has the same meaning as “Premium Payments” in the Policy, refers to planned or unplanned premium payments, and means a premium without a premium expense charge applied.
Premium Expense Charge. An amount deducted from each Premium Payment before the remainder of the premium payment
is allocated to the Subaccounts and Fixed Account based on your current allocation percentages for Premium Payments.
Reallocation Date. The first Valuation Day on or after the Record Date; plus the number of days in the Right to
Examine Period; plus 10 days.
Record Date. The date we record your Policy on Our books as an In Force policy.
Right to Examine Period. The period when you may return the Policy and receive a refund of the greater of all
premiums you paid for the Policy or the Contract Value on the date we receive the returned Policy at Our Home Office. The length of the Right to Examine period varies by state. It will be at least 10 days from the date you receive the Policy. The
first page of your Policy shows your Right to Examine Period.
Service Center. The address of the Service Center is P.O. Box 724208, Atlanta, GA 31139. Infosys McCamish Systems,
L.L.C. is the administrator of the Policy. You can call the Service Center toll-free at 1-877-376-8008.
Subaccount. The Subaccounts are invested in distinct underlying fund portfolios. The Accumulation Unit Value of
each Subaccount will fluctuate in accordance with the investment experience of the Subaccount’s underlying fund portfolios.
Surrender. The termination of the Policy at the option of the Owner.
Surrender Charge. The amount, based on the Face Amount, we charge you to fully surrender the Policy. The Surrender
Charge is equal to (a) + (b), where (a) is the Surrender Charge for the Face Amount on the issue date; and (b) is the Surrender Charge for each increase in Face Amount. The Surrender Charge applies during the first nine years after the Issue Date
and the first nine years after each increase in Face Amount.
Tax Code. The Internal Revenue Code of 1986, as amended.
Variable Account. Farmers Variable Life Separate Account A. It is a separate investment account that is divided
into subaccounts, each of which invests in a corresponding portfolio of a designated fund.
Written Notice. The Written Notice you must sign and send us to request or exercise your rights as Owner under the
Policy. To be complete, it must: (1) be in a form we accept, (2) contain the information and documentation that we determine is necessary, and (3) be received at our Service Center.
You (your, Owner). The person entitled to exercise all rights as Policy Owner under the Policy.
Important Information You Should Consider About the Policy
|
FEES AND EXPENSES
|
|||||
|
Charges for Early Withdrawal
|
There are surrender charges assessed if your Policy is surrendered during the first 9 Policy years, or within 9 years following any increase in Face Amount. The amount of the charge depends on the age of the
insured person and other factors, but the maximum charge is $44.40 per $1000 of Face Amount. For example, if the Face Amount is $100,000, the highest possible surrender charge would be $4,440.
See “Charges and Deductions – Surrender Charge.”
|
||||
|
Transaction Charges
|
In addition to surrender charges (if applicable), you may also be charged for the following transactions:
• A premium expense charge will be deducted upon the payment of
each premium.
• A partial surrender processing fee will be deducted upon any
partial surrender.
• A transfer fee may be deducted upon transfers into or out of a
variable subaccount (or the fixed account) after you have made more than 12 such transfers in a year.
• A fee may be charged upon request for an additional annual
report.
See “Charges and Deductions.”
|
||||
|
Ongoing Fees and Expenses (annual charges)
|
In addition to surrender charges and transaction charges, you will also be subject to certain ongoing fees and expenses, including fees and expenses covering the cost of insurance under the Policy and the
cost of optional benefits under the Policy. Some of these fees and expenses are based wholly or in part on the characteristics of the insured person (e.g., age, sex, and underwriting classification). You should view the policy
specifications page of your Policy for rates applicable to your Policy.
See “Charges and Deductions.”
You will also bear expenses associated with the underlying portfolios under the Policy, as shown in the following table:
|
||||
|
|
|
Annual Fee
|
Minimum
|
Maximum
|
|
|
Investment options
(Portfolio fees and expenses)*
|
0.19%
|
1.05%
|
|
||
|
* As a percentage of Portfolio net assets.
See “Appendix A: Portfolios Available Under the Policy.”
|
|||||
|
RISKS
|
|||||
|
Risk of Loss
|
You can lose money by investing in the Policy.
See “Principal Policy Risks.”
|
||||
|
Not a Short-Term Investment
|
The Policy is not a short-term investment and is not appropriate for an investor who needs ready access to cash. The Policy is unsuitable as a short-term savings vehicle because of the substantial
policy-level charges, including the premium expense charge and the surrender charge, as well as potential adverse tax consequences from such short-term use.
See “Principal Policy Risks – Effects of Surrender Charges.”
|
||||
|
Risks Associated
with Investment
Options
|
An investment in the Policy is subject to the risk of poor performance and can vary depending on the performance of the Subaccount allocation options available under the Policy (i.e., Portfolios). Each such
option (as well as the Fixed Account) will have its own unique risks, and you should review these options before making an allocation decision.
See “Principal Policy Risks – Risk of Poor Investment Performance.”
|
||||
|
Insurance
Company Risks
|
Your investment in the policy is subject to risks related to Farmers New World Life Insurance Company (“Farmers”), including that the obligations (including under the Fixed Account option), guarantees, or
benefits are subject to the claims-paying ability of Farmers. Information about Farmers, including its financial strength ratings, is available upon request from your Farmers representative. Our current financial strength ratings can also
be obtained at www.ambest.com.
See “Farmers New World Life Insurance Company and Fixed Account – Farmers New World Life Insurance Company.”
|
||||
|
Contract Lapse
|
The Policy may lapse as a result of insufficient premium payments, poor performance of the variable Subaccounts and/or Fixed Account you have chosen, withdrawals, or unpaid loans or loan interest. If a
default is not cured within a 61-day grace period, your policy will lapse without value, and no death benefit or other benefits will be payable. You can apply to reinstate a policy that has gone into default, subject to conditions
including payment of a specified amount of additional premiums.
See “Policy Lapse and Reinstatement.”
|
||||
|
RESTRICTIONS
|
|||||
|
Investments
|
There are limitations on the transfer of Policy value among investment options (i.e., Subaccounts and the Fixed Account).. These restrictions include an annual limit
on the number of free transfers you may make, and a charge for transfers in excess of that limit, as well as a minimum dollar amount for transfers. We also impose additional restrictions to discourage market timing and disruptive trading
activity.
See “Transfers.”
The Policy also allows us to eliminate the shares of a Portfolio or class of Portfolio shares, or to substitute shares of another new or existing Portfolio, subject to applicable legal requirements.
See “The Variable Account and the Portfolios.”
|
||||
|
Optional Benefits
|
There are restrictions and limitations relating to supplemental benefits (riders) offered under the Policy, as well as conditions under which a supplemental benefit may be modified or terminated by us. For
example, certain supplemental benefits may be subject to underwriting, and your election of an option may result in restrictions on certain policy benefits.
See “Other Benefits Available Under the Policy.”
|
||||
|
TAXES
|
|||||
|
Tax Implications
|
You should consult with a tax professional to determine the tax implications of an investment in and payments received under the Policy. There is no additional tax benefit to you if the policy is purchased
through a tax-qualified plan. If we pay out any amount of your policy value upon surrender or partial withdrawal, all or part of that distribution would generally be treated as a return of the premiums you’ve paid and not subjected to
income tax, unless the Policy is a Modified Endowment Contract in which case to the extent there are earnings in the contract, they will be treated as being distributed first and subject to tax. Any portion not treated as a return of your
premiums is includible in your income. The taxable portion of distributions also is subject to tax penalties under some circumstances.
See “Federal Tax Considerations.”
|
||||
|
CONFLICTS OF INTEREST
|
|||||
|
Investment Professional Compensation
|
The policy is currently not being issued, however, some investment professionals may receive compensation in connection with additional Premiums in an outstanding Policy, including by means of commissions,
and may have a financial incentive to recommend such additional premiums over another investment.
See “Additional Information.”
|
||||
|
Exchanges
|
Some investment professionals may have a financial incentive to offer you a new policy in place of the one you already own, and you should only exchange your policy if you determine, after comparing the
features, fees, and risks of both policies, that it is preferable for you to purchase the new policy rather than continue to own the existing policy.
See “The Policy – Tax-Free “Section 1035” Exchanges.”
|
||||
Purpose
The purpose of the Policy is to provide lifetime insurance protection, with a death benefit payable if the insured dies while the Policy is in effect. The
Policy gives you the potential for long-term life insurance coverage with the opportunity for tax-deferred cash value accumulation. The Policy may be appropriate for persons seeking both life insurance protection and the potential for the
accumulation of cash values.
Premiums
You can vary the frequency and amount of premiums subject to certain limitations discussed in the Premium Flexibility section of this Prospectus. You may
be able to skip premium payments under certain circumstances. However, you greatly increase your risk of Lapse if you do not regularly pay premiums at least as large as the current minimum premium. After you pay an Initial Premium, you
can pay subsequent Premiums (minimum $25) at any time.
You may allocate premiums to one or more Subaccounts of the Variable Account. Each Subaccount invests exclusively in one of the Portfolios listed in “Appendix
A: Portfolios Available Under the Policy.” Investment returns from amounts allocated to the Subaccounts will vary each day with the investment experience of these Subaccounts. You may also allocate premiums to the Fixed Account where we
guarantee that it will earn interest at an annual rate of at least 2.5%. We may declare higher rates of interest, but are not obligated to do so.
Policy Features
Death Benefit
As long as the Policy remains in force, we will pay a death benefit payment to the Beneficiary on receipt of due proof of death. You may choose one of two
death benefit options under the Policy.
| • |
Option A is a variable death benefit through Attained Age 99 that is the greater of:
|
| ¡ |
the Face Amount of your Policy plus the Contract Value on the date of the Insured’s death; or
|
| ¡ |
the Contract Value on the date of the Insured’s death multiplied by the applicable Death Benefit Percentage.
|
| • |
Option B is a level death benefit through Attained Age 99 that is the greater of:
|
| ¡ |
the Face Amount on the date of the Insured’s death; or
|
| ¡ |
the Contract Value on the date of the Insured’s death multiplied by the applicable Death Benefit Percentage.
|
Surrender
At any time while the Policy is in force, you may fully Surrender your Policy and receive the Cash Surrender Value. After the first Policy year, you may
withdraw part of the Cash Surrender Value, subject to certain restrictions. Surrenders may have tax consequences. See “Full and Partial Surrenders.”
Loans
You may take a loan against the Policy by submitting a signed request to the Service Center. Generally, the minimum amount of each loan is $250. Interest
is charged on each loan. If there is an outstanding loan the amount of the loan and accrued interest will be deducted from the death benefit and other Policy proceeds. If your Policy is a Modified Endowment Contract, there may be additional tax
implications.
Supplemental Benefits (Riders)
The Policy offers the following riders that provide supplemental benefits under the Policy.
| • |
Accelerated Benefit Rider for Terminal Illness
|
| • |
Accidental Death Benefit Rider
|
| • |
Automatic Increase Benefit
|
| • |
Children’s Term Insurance Rider
|
| • |
Waiver of Deduction Rider
|
| • |
Monthly Disability Benefit Rider (not available under Policies issued after August 7, 2015)
|
Additional fees are charged for certain riders. See “Other Benefits Available Under the Policy
The following tables describe the fees and charges that you will pay when buying, owning, and surrendering or making withdrawals from
the Policy. Please refer to your Policy specifications page for information about the specific fees you will pay each year based on the options you have elected.
The first table describes the fees and expenses that you will pay at the time that you buy the Policy, surrender or make withdrawals
from the Policy, or transfer cash value between investment options.
|
Transaction Fees
|
|||
|
Charge
|
When Charge is Deducted
|
Amount Deducted
|
|
|
Guaranteed
Maximum Charge
|
Current Charge
|
||
|
Sales Expense
|
Upon payment of each premium
|
4.8%
|
4.8% in years 1-10 years; 0.8% in years 11+
|
|
Premium Taxes
|
Upon payment of each premium
|
2.2%
|
2.2%
|
|
Maximum Deferred Sales Charge (Load)1
(Per $1,000 of Face Amount)
|
Upon full Surrender of the Policy during first 9 Policy years, or within 9 years following any increase in Face Amount
|
|
|
|
|
|
|
|
|
◆ Minimum Charge in Policy Year 12
|
|
$3.00
|
$3.00
|
|
|
|
|
|
|
◆ Maximum Charge in Policy Year 13
|
|
$44.40
|
$44.40
|
|
|
|
|
|
|
◆ Charge for a Policy issued to a male at age 35, during Policy Year 1
|
$10.06
|
$10.06
|
|
|
Partial Surrender Processing Fees
|
Upon partial surrender
|
2.0%
|
2.0%
|
|
(As a percentage of the amount withdrawn, not to exceed $25.00)
|
|||
|
Transfer Fees
|
Upon transfer
|
First 12 transfers in a Policy year are free, $25 for each subsequent transfer
|
First 12 transfers in a Policy year are free, $25 for each subsequent transfer
|
| 1 |
The Surrender Charge is determined by applying a Surrender Charge Factor (see Appendix D) to the Face Amount, and dividing the result by 1,000 as more fully set out in your Policy.
|
| 2 |
This minimum charge is based on a female Insured age 0 at issue.
|
| 3 |
This maximum charge is based on a male Insured for a Policy that is issued at age 61.
|
The next table describes the fees and expenses that you will pay periodically during the time that you own the Policy, not including Portfolio Company fees and expenses.
|
Periodic Charges Other Than Annual Portfolio Company Expenses
|
|||
|
Charge
|
When Charge is Deducted
|
Amount Deducted
|
|
|
Guaranteed
Maximum Charge
|
Current Charge
|
||
|
Base Contract Charge:
|
|||
|
Cost of Insurance4 (No table rating factor charge or other extra charge 5):
|
Monthly on the Issue Date and on each monthly due date
|
Per $1,000 of Risk Insurance Amount 8
|
Per $1,000 of Risk Insurance Amount
|
|
|
|
|
|
|
◆ Minimum 6
|
|
$0.01
|
$0.01
|
|
|
|
|
|
|
◆ Maximum Charge 7
|
|
$37.12
|
$37.12
|
|
|
|
|
|
|
◆ Charge for a Policy insuring a male, Issue Age 35, in the standard non-nicotine Premium Class, in Policy year 5 with a Face Amount less than $150,000
|
$0.12
|
$0.06
|
|
|
Monthly Underwriting and Sales Expense Charge
(Per $1,000 of original Face Amount and any Face Amount increase)
|
Monthly on Issue Date and (Per $1,000 of original Face Amount and any Face Amount increase) or within 5 years after any increase in Face Amount
|
|
|
|
|
|
|
|
|
◆ Minimum Charge 9
|
|
$0.07
|
$0.07
|
|
|
|
|
|
|
◆ Maximum Charge 10
|
|
$2.21
|
$2.21
|
|
|
|
|
|
|
◆ Charge for a Policy issued to a male at age 35, in a non-nicotine standard class, during the first year
|
$0.26
|
$0.25
|
|
| 4 |
Cost of insurance charges are based on the Insured’s Issue Age, gender, Premium Class, the Contract Value, the number of months since the Issue Date, and the amount of the Face Amount, among other factors. The cost of insurance rate
you pay may increase annually with the age of the Insured. We currently apply higher cost of insurance rates for Policies with a Face Amount of less than $150,000. If you reduce your Face Amount below $150,000 at any time, then the higher
rates will apply in most cases. The cost of insurance charges shown in the table may not be representative of the charges you will pay. Your Policy will indicate the guaranteed maximum cost of insurance charge applicable to your Policy.
You can obtain more information about your cost of insurance charges by contacting your agent.
|
| 5 |
Table rating factor charges and flat extra charges are additional charges assessed on policies insuring individuals considered to have higher mortality risks based on our underwriting standards and guidelines.
|
| 6 |
The minimum charge is based on a female Insured, Issue Age 3, in the juvenile underwriting class.
|
| 7 |
This maximum charge is based on a male Insured, at Attained Age 99, in the nicotine underwriting class, who does not have a table rating factor charge. This maximum charge will be higher for a Policy with a table rating factor charge
or a flat extra charge.
|
| 8 |
The Risk Insurance Amount, on the Monthly Due Date, equals the adjusted death benefit, minus the adjusted Contract Value on that date. The adjusted death benefit and the adjusted Contract Value are determined by using the Contract
Value on the respective Monthly Due Date and deducting all applicable charges and fees, except the cost of insurance charge.
|
| 9 |
This minimum charge is based on a female Insured that is 0 at issue, assuming no subsequent increases in Face Amount.
|
10 This maximum charge is based on a male Insured at age 80.
|
Mortality and Expense Risk Fees (As an annualized percentage of daily net assets in each Subaccount)
|
Daily
|
0.60%
|
0.30%
|
|
Administrative Expenses
|
Monthly on the Issue Date and on each monthly due date
|
$12.00
|
$12.00, up to Attained Age 100
|
|
Loan Interest Rates
|
Interest is charged daily, and is due and payable at the end of each Policy year, or on the date of any Policy loan increase or repayment, if earlier.
|
These rates may change at our discretion, but are guaranteed not to exceed 6.5%.
|
For years 1 through 15, we will charge you loan interest at a rate of 4.5%, compounded annually. For years 16 and beyond, we will charge you loan interest at a rate 2.5%, compounded annually.
|
|
Optional Benefit Charges:
|
|||
|
Accelerated Benefit Rider for Terminal Illness
|
When a benefit is paid under this rider
|
$250 plus the actuarial discount
|
$150 plus the actuarial discount
|
|
Accidental Death Benefit Rider (Per $1,000 of rider Face Amount)
|
Monthly on the Issue Date and on each monthly due date
|
|
|
|
|
|
|
|
|
◆ Minimum Charge 11
|
|
$0.08
|
$0.04
|
|
|
|
|
|
|
◆ Maximum Charge 12
|
|
$0.56
|
$0.51
|
|
|
|
|
|
|
◆ Charge for an Insured at Attained Age 35
|
$0.08
|
$0.06
|
|
|
Children’s Term Insurance Rider (Per $1,000 of rider amount)
|
Monthly on Issue Date and on each Monthly Due Date
|
$0.87
|
$0.78
|
|
Monthly Disability Benefit Rider (Per $100 of monthly benefit)
|
Monthly on Issue Date and on each Monthly Due Date
|
|
|
|
|
|
|
|
|
◆ Minimum Charge 13
|
|
$6
|
$4
|
|
|
|
|
|
|
◆ Maximum Charge
|
|
$62
|
$45
|
|
|
|
|
|
|
◆ Charge at the Insured’s Attained Age 35
|
$7
|
$4.5
|
|
|
Waiver of Deduction Rider (As a percentage of all other monthly charges)
|
Monthly on the Issue Date and on each monthly due date
|
|
|
|
|
|
|
|
|
◆ Minimum Charge 13
|
|
6%
|
4%
|
|
|
|
|
|
|
◆ Maximum Charge
|
|
60%
|
45%
|
|
|
|
|
|
|
◆ Charge at the Insured’s Attained Age 35
|
7%
|
4.5%
|
|
11 The minimum charge is based on a female Insured at Attained Age 11.
12 The maximum charge is based on a male Insured at Attained Age 69 whose occupation and/or avocations at issue lead us to
believe the Insured’s risk of accidental death is roughly triple that of a representative Insured.
13 The minimum charge is for an Insured at Attained Age 21.
The Policy charges a Monthly Deduction, which consists of the total of 1) Cost of Insurance, 2) Administrative Expenses, 3) Monthly Underwriting and Sales Expense Charge
and 4) risk charges of any attached riders. See “Charges and Deductions – Monthly Deductions.”
The next item shows the minimum and maximum total operating expenses charged by the Portfolio Companies that you may pay periodically during the time that
you own the Contract. [These amounts also include applicable Platform Charges if you choose to invest in certain Portfolio Companies.] A complete list of Portfolio Companies available under the Contract, including their annual expenses, may be
found at the back of this document.
|
Annual Portfolio Company Expenses 14
|
Minimum
|
Maximum
|
|
(Expenses that are deducted from Portfolio Company assets, including management fees, distribution and/or service (12b-1) fees, and other expenses)
|
0.19%
|
1.05%
|
If you invest your Contract Value in one or more Subaccounts, you will be subject to the risk that investment performance will be
unfavorable and that your Contract Value will decrease. You could lose everything you invest and your Policy could lapse without value, unless you pay additional Premiums. In addition, we deduct Policy fees and charges from your Contract Value,
which can significantly reduce your Contract Value. During times of declining investment performance, the deduction for monthly charges based on the Risk Insurance Amount could accelerate and further reduce your Contract Value.
If you allocate Premiums and Contract Value to the Fixed Account, we will credit your Contract Value in the Fixed Account with a
declared rate of interest. You assume the risk that the rate may decrease, although it will never be lower than a guaranteed minimum annual effective rate of 2.5%.
This Policy and the underlying Portfolios are not designed for market timers. However, there
is no assurance that we will be able to identify and prevent all market timing and other forms of disruptive trading in the Policy and the underlying Portfolios. For a discussion of our policies and procedures on market timing and of the
potential costs and risks to you that can result if market timing or disruptive trading occurs in the underlying Portfolios, see the “Transfers – Policy and Procedures Regarding Disruptive Trading and Market Timing” section.
Paying the minimum premium is one way to reduce the risk that your Policy will Lapse without value. You greatly increase the risk of
your Policy lapsing if you do not regularly pay Premiums at least as large as the current minimum premium. However, paying the minimum Premiums for the Policy will not necessarily keep your Policy in
force because poor investment performance and/or partial surrenders could result in a lapse of a Policy, notwithstanding payment of minimum Premiums.
You also increase the risk that your Policy will Lapse if you take out a loan, take partial Surrenders or increase the Face Amount of
your Policy. These activities, any increase in the current charges, or any unfavorable investment returns will significantly increase the risk of your Policy lapsing. It is likely that additional Premiums will be necessary to keep your Policy in
force until maturity.
For a full discussion on the conditions that will cause the Policy to enter the grace period and the Grace Premium Test, please see
the “Policy Lapse and Reinstatement” section of this prospectus.
Whenever your Policy enters the 61-day grace period, you must make a payment before the grace period ends that is large enough to
keep your Policy in force. Market performance alone will not be deemed to constitute a sufficient payment. If you do not make a large enough payment before the end of the grace period, your Policy will terminate without value, insurance coverage
will no longer be in force, and you will receive no benefits. A Policy Lapse may have adverse tax consequences.
14 Before expense reimbursements or fee waiver arrangements. The Portfolio expenses used to prepare this table were
provided to Farmers by the Portfolio(s). Farmers has not independently verified such information. The expenses shown are those incurred for the year ending December 31, 2024. Current or future expenses may be greater or less than those shown.
Tax Risks
A Policy must satisfy certain requirements in the Tax Code in order to qualify as a life insurance contract for federal income tax
purposes and to receive the tax treatment normally accorded life insurance contracts under federal tax law. There is limited guidance as to how these requirements are to be applied. Nevertheless, we believe that a Policy issued on a standard
Premium Class basis should satisfy the applicable Tax Code requirements. There is, however, some uncertainty about the application of the Tax Code requirements to a Policy issued on a special Premium Class basis, particularly if the full amount
of Premiums permitted under the Policy is paid.
Depending on the total amount of Premiums you pay during the first seven years of a Policy, the Policy may be treated as a modified
endowment contract (“MEC”) under federal tax laws. In addition, any Section 1035 Exchange coming from a policy that is a MEC makes the new Policy a MEC. If a Policy is treated as a MEC, then partial Surrenders and loans under a Policy will be
taxable as ordinary income, to the extent there are earnings in the Policy. In addition, a 10% penalty tax may be imposed on the taxable portion of partial Surrenders and loans taken before you reach age 59 1/ 2. There may
be tax consequences to distributions from Policies that are not MECs. However, the 10% penalty tax will not apply to distributions from Policies that are not MECs. Loans from or secured by a Policy that is not a MEC are generally not treated as
distributions. However, the tax consequences associated with Policy loans from this Policy are less clear because the difference between the interest rate we charge on Policy loans and the rate we credit to the loan account results in a net cost
to you that could be viewed as negligible and, as a result, it is possible that such a loan could be treated as, in substance, a taxable distribution. You should consult a qualified tax advisor about such loans.
The federal tax laws are unclear in a variety of areas. You should review the “Federal Tax Considerations” section of this
prospectus carefully, especially if you are purchasing this Policy with the intention of taking Policy loans or partial Surrenders at any time in the future, and/or you intend to keep the Policy in force after
the Insured reaches Attained Age 100. You should consult a qualified tax advisor for assistance in all tax matters involving your Policy.
The Policy permits you to take only one partial Surrender in any calendar quarter, and only after the first Policy year has been
completed. The amount you may withdraw is limited to 75% of the Cash Surrender Value. You may not withdraw less than $500. If 75% of the Cash Surrender Value is less than $500, then a partial Surrender is not available.
A partial Surrender reduces the Cash Surrender Value and Contract Value and will increase the risk that the Policy will Lapse. A
partial Surrender also may have tax consequences.
In addition, a partial Surrender will reduce the death benefit. If you select a level death benefit (Option B), a partial Surrender
will permanently reduce the Face Amount by the amount of the partial Surrender (not including the processing fee). If a variable death benefit (Option A) is in effect when you make a partial Surrender, the Face Amount will remain the same but the
death benefit will be reduced by the amount that the Contract Value is reduced.
A Policy loan, whether or not repaid, will affect Contract Value over time because we subtract the amount of the loan from the
Subaccounts and Fixed Account and place this amount into the loan account as collateral. We credit a fixed interest rate of 2.5% per year to the loan account. For Policy years 1 through 15, we will charge you loan interest at a rate of 4.5%,
compounded annually. For Policy years 16 and beyond, we will charge you loan interest at a rate of 2.5%, compounded annually. These rates may change at our discretion, but are guaranteed not to exceed 6.5%. As a result, the loan collateral does
not participate in the investment results of the Subaccounts, nor does it receive as high an interest rate as amounts allocated to the Fixed Account. The longer the loan is outstanding, the greater the effect on Contract Value is likely to be.
Depending on the investment results of the Subaccounts and the interest rates charged against the loan and credited to the Fixed Account, the effect could be favorable or unfavorable.
A Policy loan affects the death benefit because a loan reduces the Death Benefit Amount Payable by the amount of the outstanding loan plus any
interest you owe on Policy loans.
A Policy loan will increase the risk that the Policy will Lapse. There is a risk that if the loan amount, together with poor investment performance
and payment of monthly insurance charges, reduces your Cash Surrender Value (or Contract Value, in certain circumstances) to an amount that is not large enough to pay the Monthly Deduction when due, then the Policy will enter the 61-day grace
period, and possibly Lapse. Adverse tax consequences could result. In addition, the tax consequences of loans are uncertain. You should consult a qualified tax advisor about such loans.
Certain fees and expenses are currently assessed at less than their maximum levels. We may increase these current charges in the
future up to the guaranteed maximum levels. If fees and expenses are increased, you may need to increase the amount and/or frequency of Premiums you pay to keep the Policy in force.
There are significant Surrender Charges under this Policy during the first nine Policy years and during the nine years after any
elected increase in Face Amount. It is likely that you will receive no Cash Surrender Value if you Surrender your Policy in the early Policy years. You should purchase this Policy only if you have the financial ability to keep it in force at the
initial Face Amount for a substantial period of time.
Even if you do not ask to Surrender your Policy, Surrender Charges may play a role in determining whether your Policy will Lapse. The
Cash Surrender Value is one measure we use to determine whether your Policy will enter a grace period and possibly Lapse.
A comprehensive discussion of the risks of each Portfolio may be found in each Portfolio’s prospectus. Please refer to the
prospectuses for the Portfolios for more information. There is no assurance that any of the Portfolios will achieve its stated investment objective.
Like others in our industry, we are subject to operational and information security risks resulting from “cyber-attacks,” “hacking”
or similar illegal or unauthorized intrusions into computer systems and networks. These risks include, among other things, the theft, misuse, corruption and destruction of data maintained online or digitally, denial of service attacks on websites
and unauthorized release of confidential customer information. Additionally, our operations support complex transactions and are highly dependent on the proper functioning of information technology and communication systems. Any failure of,
disruption to, or gap in the systems and processes necessary to support complex transactions and avoid systems failure, fraud, information security failures, processing errors, loss of data and breaches of regulation caused by cyber-attacks or
other similar illegal, or unauthorized intrusions may lead to a materially adverse effect on our operations, results, financial condition, and corporate reputation.
In addition, we must commit significant resources to maintain and enhance our existing systems in order to keep pace with applicable
regulatory requirements, industry standards and customer preferences. If we fail to maintain secure and well-functioning information systems, we may not be able to rely on information for product pricing, compliance obligations, risk management
and underwriting decisions. Although we seek to limit our vulnerability to such risks through technological and other means to maintain the integrity and security of our information systems and data, it is not possible to anticipate or prevent
all potential forms of cyber-attack or other similar illegal or unauthorized intrusions or to guarantee our ability to timely detect, remediate, and defend against all such attacks. In addition, due to the sensitive nature of much of the
financial and personal information we maintain, we may be at particular risk for targeting.
Cyber-attacks affecting us, any third-party administrator, the underlying funds, intermediaries and other affiliated or third-party
service providers may adversely affect us and your account value. For instance, cyber-attacks may interfere with our processing of contract transactions, including the processing of orders from our website or with the underlying funds, impact our
ability to calculate accumulation unit values, cause the release and possible destruction of confidential customer or business information, impede order processing, subject us and/or our service providers and intermediaries to regulatory fines
and financial losses and/or cause reputational damage. Cyber security risks may also affect the issuers of securities in which the underlying funds invest, which may cause the funds underlying your contract to lose value. There can be no
assurance that we or the underlying funds or our service providers will avoid losses affecting your contract that result from cyber-attacks or information security breaches in the future.
We are also exposed to risks related to natural and man-made disasters and catastrophes, any of which could adversely affect our
ability to conduct business. A natural or man-made disaster or catastrophe, including a pandemic (such as COVID-19), could affect the ability of our employees or the employees of our service providers to perform their responsibilities. In the
event our employees and/or the employees of our service providers are required to work remotely, those remote work arrangements could result in our business operations being less efficient than under normal circumstances and could lead to delays
in our processing of contract-related transactions, including orders from owners. Catastrophic events may also negatively affect the computer and other systems on which we rely. There can be no assurance that we, our service providers or the
underlying funds will be able to avoid negative impacts associated with natural and man-made disasters and catastrophes.
Farmers New World Life Insurance Company (“Farmers”) is located at 3120 139th Ave SE, Suite 300, Bellevue, Washington
98005. We are obligated to pay all amounts promised under the Policy.
You may allocate some or all of your premium payments and transfer some or all of your Contract Value to the Fixed Account. The Fixed
Account offers a guarantee of principal accumulating at a specified rate of interest that will be reduced by deductions for fees and expenses. The Fixed Account is part of Farmers’ General Account. We use our general assets to support our
insurance and annuity obligations other than those funded by our separate investment accounts (i.e., the Variable Account), and those obligations amounts are subject to our claims-paying ability and
financial strength. Subject to applicable law, Farmers has sole discretion over investment of the Fixed Account’s assets. Farmers bears the full investment risk for all amounts contributed to the Fixed Account. Farmers guarantees that the amounts
allocated to the Fixed Account will be credited interest daily at an annual net effective interest rate of at least 2.5%. We will determine any interest rate credited in excess of the guaranteed rate at our sole discretion. All assets in the
General Account are subject to our general liabilities from business operations.
Money you place in the Fixed Account will earn interest that is compounded annually and accrues daily at the current interest rate in
effect at the time of your allocation. We intend to credit the Fixed Account with interest at current rates in excess of the minimum guaranteed rate of 2.5%, but we are not obligated to do so. We have no specific formula for determining current
interest rates.
The Fixed Account Value will not share in the investment performance of our General Account. Because we, in our sole discretion,
anticipate changing the current interest rate from time to time, different allocations you make to the Fixed Account will be credited with different current interest rates. You assume the risk that interest credited to amounts in the Fixed
Account may not exceed the minimum 2.5% guaranteed rate.
We reserve the right to change the method of crediting interest from time to time, provided that such changes do not reduce the
guaranteed rate of interest below 2.5% per year or shorten the period for which the interest rate applies to less than one year (except for the year in which such amount is received or transferred).
We currently allocate amounts from the Fixed Account for partial Surrenders, transfers to the Subaccounts, or charges for the Monthly
Deduction on a last in, first out basis (“LIFO”) for the purpose of crediting interest.
The Fixed Account is not registered with the Securities and Exchange Commission (“SEC”). The disclosures included
in this prospectus about the Fixed Account are for your information and have not been necessarily reviewed by the staff of the SEC. However, Fixed Account disclosure is subject to general applicable provisions of the federal securities laws
relating to the accuracy and completeness of statements made in this prospectus.
The Variable Account and the Portfolios
Farmers established the Variable Account as a separate investment account under the law of the State of Washington on April 6, 1999.
Farmers owns the assets in the Variable Account. Farmers may use the Variable Account to support other variable life insurance policies Farmers issues. The Variable Account is registered with the SEC as a unit investment trust under the
Investment Company Act of 1940 (the “1940 Act”) and qualifies as a “separate account” within the meaning of the federal securities laws.
The Variable Account is divided into Subaccounts, each of which invests in shares of one Portfolio of a fund.
Income, gains, and losses credited to, or charged against, a Subaccount of the Variable Account reflect the Subaccount’s own
investment experience and not the investment experience of our other assets. The Variable Account’s assets may not be used to pay any of our liabilities other than those arising from the Policies and from other variable life insurance policies
supported by the Variable Account. Farmers is obligated to pay all amounts promised to investors under the Policies. If the Variable Account’s assets exceed the required reserves and other liabilities, we may transfer to our General Account the
excess related to seed capital, as well as earned fees and charges to which we are entitled under the Policy.
Changes to the Variable Account. We reserve the right in our sole discretion, and subject
to applicable law, to add, close, remove, or combine one or more Subaccounts, combine the Variable Account with one or more other separate accounts, or operate the Variable Account as a different kind of investment company. Subject to obtaining
any approvals or consents required by law, the assets of one or more Subaccounts may also be transferred to any other Subaccount if, in our sole discretion, conditions warrant. In addition, we reserve the right to modify the provisions of the
Policy to reflect changes to the Subaccounts and the Variable Account and to comply with applicable law. Some of these future changes may be the result of changes in applicable laws or interpretation of the law.
Each Subaccount of the Variable Account invests exclusively in shares of a designated Portfolio of a fund, as available. Shares of
each Portfolio are purchased and redeemed at net asset value, without a sales charge. Any dividends and distributions from a Portfolio are reinvested at net asset value in shares of that Portfolio. Each fund available under the Policy is
registered with the SEC under the 1940 Act as an open-end, management investment company. Such registration does not involve supervision of the management or investment practices or policies of the Funds by the SEC.
The assets of each Portfolio are separate from the assets of any other Portfolio, and each Portfolio has separate investment
objectives and policies. As a result, each Portfolio operates as a separate investment Portfolio and the income or losses of one Portfolio has no effect on the investment performance of any other Portfolio.
Each of the Portfolios is managed by an investment advisor registered with the SEC under the Investment Advisers Act of 1940, as
amended. Each investment advisor is responsible for the selection of the investments of the Portfolio. These investments must be consistent with the investment objective, policies and restrictions of that Portfolio.
Some of the Portfolios have been established by investment advisors that manage retail mutual Funds sold directly to the public
having similar names and investment objectives to the Portfolios available under the Policy. While some of the Portfolios may be similar to, and may in fact be modeled after, publicly traded mutual Funds, you should understand that the Portfolios
are not otherwise directly related to any publicly traded mutual fund.
Consequently, the investment performance of publicly traded mutual Funds and any similarly named Portfolio may differ substantially
from the Portfolios available through this Policy.
An investment in a Subaccount, or in any Portfolio, including the DWS Government Money Market VIP, is not Insured or guaranteed by
the U.S. Government and there can be no assurance that the DWS Government Money Market VIP will be able to maintain a stable net asset value per share. During extended periods of low interest rates, and due in part to insurance charges, the
yields on the money market Subaccount may become extremely low and possibly negative.
Information regarding each Portfolio, including (i) its name, (ii) its type, (iii) its investment adviser and any
sub-investment adviser, (iv) current expenses, and (v) performance is available in an appendix to this prospectus. See “Appendix A: Portfolios Available Under the Policy.”
Please read the attached prospectuses and/or summary prospectuses for the Portfolios to obtain more complete
information regarding the Portfolios
The Portfolios offered through the Policies are selected by Farmers, and Farmers may consider various factors, including, but not
limited to asset class coverage, the strength of the investment advisor’s (and/or subadvisor’s) reputation and tenure, brand recognition, performance, and the capability and qualification of each investment firm. We also consider whether the
Portfolio or one of its service providers (e.g., the investment advisor) will make payments to us in connection with certain administrative, marketing, and support services, or whether the Portfolio’s advisor is an affiliate. We review the
Portfolios periodically and may remove a Portfolio, or limit its availability to new Premiums and/or transfers of Contract Value if we determine that a Portfolio no longer satisfies one or more of the selection criteria and/or if the Portfolio
has not attracted significant allocations from Policy Owners.
You are responsible for choosing to invest in the Portfolios and the amounts allocated to each that are appropriate for your own
individual circumstances and your investment goals, financial situation, and risk tolerance. Since you bear the investment risk of investing in the Subaccounts, you should carefully consider any decisions regarding allocations of premium and
Contract Value to each Subaccount.
In making your investment selections, we encourage you to thoroughly investigate all of the information regarding the Portfolios that is available to
you, including each Portfolio’s prospectus and/or summary prospectus, statement of additional information, and annual and semi-annual reports. Other sources such as the Portfolio’s website or newspapers and financial and other magazines provide
more current information, including information about any regulatory actions or investigations relating to a Portfolio. After you select Subaccounts in which to allocate premium or Contract Value, you should monitor and periodically re-evaluate
your investment allocations to determine if they are still appropriate.
You bear the risk of any decline in the Contract Value of your Policy resulting from the performance of the
Subaccounts you have chosen.
We do not provide investment advice and we do not recommend or endorse any of the particular Portfolios available as investment
options in the Policy.
Revenue We Receive From the Portfolios and/or Their Service Providers. We
and/or Farmers Financial Solutions, LLC (“FFS”), may directly or indirectly receive payments from the Portfolios and/or their service providers (investment advisors, administrators, and/or distributors), in connection with certain administrative,
marketing and other services we and/or FFS provide and expenses we incur. We and/or FFS generally receive three types of payments:
| • |
Rule 12b-1 Fees. We and/or FFS, the principal underwriter and distributor for the Policies, receive some or all of the 12b-1 fees from the Portfolios that charge a 12b-1 fee.
See the prospectuses for the Portfolios for more information. The 12b-1 fees we and/or FFS receive are calculated as a percentage of the average daily net assets of the Portfolios owned by the Subaccounts available under this Policy and
certain other variable insurance products that we issue.
|
| • |
Administrative, Marketing and Support Service Fees (“Support Fees”). We and/or FFS may receive compensation from some of the Portfolios’ service providers for administrative
and other services we perform relating to Variable Account operations that might otherwise have been provided by the Portfolios. The amount of this compensation is based on a percentage of the average assets of the particular Portfolios
attributable to the Policy and to certain other variable insurance products that we issue. These percentages currently range from 0.00% to 0.25% and may be significant. Some service providers may pay us more than others.
|
The chart below provides the current maximum combined percentages of 12b-1 fees and Support Fees that we anticipate will be paid to
us and/or FFS on an annual basis:
|
Incoming Payments to Farmers and/or FFS
|
|||
|
From the following Funds and
their Service Providers:
|
Maximum %
of assets*
|
From the following Funds and their
Service Providers:
|
Maximum %
of assets*
|
|
American Funds
|
0.25%
|
Franklin Templeton
|
0.25%
|
|
DWS
|
0.25%
|
Janus
|
0.25%
|
|
BNY Mellon
|
0.25%
|
PIMCO
|
0.15%
|
|
Fidelity®
|
0.25%
|
Principal
|
0.25%
|
| * |
Payments are based on a percentage of the average assets of each underlying Portfolio owned by the Subaccounts available under this Policy and under certain other variable insurance products offered by us.
|
| • |
Other payments. We and/or FFS also may directly or indirectly receive additional amounts or different percentages of assets under management from some of the Portfolio’s
service providers with regard to the variable insurance products we issue. These payments may be derived, in whole or in part, from the advisory fees deducted from assets of the Portfolios. Policy Owners, through their indirect investment
in the Portfolios, bear the costs of these advisory fees. Certain investment advisors or their affiliates may provide us and/or FFS with wholesaling services to assist us in the distribution of the Policy, may pay us and/or FFS amounts to
participate in sales meetings or may reimburse our sales costs, and may provide us and/or FFS with occasional gifts, meals, tickets, or other compensation or reimbursement. The amounts in the aggregate may be significant and may provide
the investment advisor (or other affiliates) with increased access to us and FFS.
|
Proceeds from these payments made by the Portfolios, investment advisors, and/or their affiliates may be used for any corporate
purpose, including payment of expenses that we and FFS incur in promoting, issuing,
distributing, and administering the Policies, and that we incur, in our role as intermediary, in marketing and administering the underlying
Portfolios. We and our affiliates may profit from these payments.
For further details about the compensation payments we make in connection with the sale of the Policies, see the “Additional
Information – Distribution of the Policies” section.
We do not guarantee that each Portfolio will always be available for investment through the Policies.
We reserve the right, subject to applicable law, to add new Portfolios or classes of Portfolio shares, remove or close existing
Portfolios or classes of Portfolio shares, or substitute Portfolio shares held by any Subaccount for shares of a different Portfolio. New or substitute Portfolios or classes of Portfolio shares may have different fees and expenses and their
availability may be limited to certain classes of purchasers. If the shares of a Portfolio are no longer available for investment or if, in our judgment, further investment in any Portfolio should become inappropriate, we may redeem the shares of
that Portfolio and substitute shares of another Portfolio. We will not add, remove or substitute any shares without notice and prior approval of the SEC and state insurance authorities, to the extent required by the 1940 Act or other applicable
law.
Even though we are the legal Owner of the Portfolio shares held in the Subaccounts, and have the right to vote on all matters
submitted to shareholders of the Portfolios, we will vote our shares only as you and other Policy Owners instruct, so long as such action is required by law.
Before a vote of a Portfolio’s shareholders occurs, we will send voting materials to you. We will ask you to instruct us on how to
vote and to return your proxy to us in a timely manner. You will have the right to instruct us on the number of Portfolio shares that corresponds to the amount of Contract Value you have in that Portfolio (as of a date set by the Portfolio). The
number of votes you have will be calculated separately for each Subaccount in which you have an investment.
We do not require a minimum number of votes received from Policy Owners in order to cast our votes. Instead, if we do not receive
your voting instructions, or if we do not receive them within the time allowed to cast your vote, we will vote our Portfolio shares attributable to your Policy in proportion to the instructions that we timely receive from all Policy Owners who
have a voting interest in the Portfolio’s shares. Because we do not require a minimum number of votes received, one result of “proportional voting” is that a small number of Policy Owners, who choose to timely vote, may control the outcome of a
vote.
Should federal securities laws, regulations and interpretations change, we may elect to vote Portfolio shares in our own right. Under
current legal requirements, we may disregard the voting instructions we receive from Policy Owners only in certain narrow circumstances prescribed by SEC regulations. In the event we disregard voting instructions from Policy Owners, we will send
a summary in the next annual report to impacted Policy Owners advising them of the actions and the reasons we took such action.
Please note that we are no longer offering the Policies for sale. This “Purchasing a Policy” section is included in the prospectus for
your information.
To purchase a Policy, you must send the application and, in most cases, an Initial Premium, to us through any licensed Farmers
insurance agent who is also a registered representative of a broker-dealer having a selling agreement with the principal underwriter that offers the Policy, Farmers Financial Solutions, LLC.
There may be delays in our receipt of an application that are outside of our control because of the failure of the agent to forward
the application to us promptly, or because of delays in determining that the Policy is suitable for you. Any such delays will affect when your Policy can be issued and when your Initial Premium is allocated to one or more Subaccounts of the
Variable Account and/or to the Fixed Account.
Acceptance of an application is subject to our insurance underwriting. Interest is not credited to your Initial Premium and any other
amounts submitted with the application during the underwriting review process. This is true regardless of whether the application is declined or withdrawn, an offer to insure is not taken, or a Policy issued. We use different underwriting
standards in relation to the Policy. We can provide you with details as to these underwriting standards when you apply for a Policy. We must receive evidence of insurability that satisfies our underwriting standards before we will issue a Policy.
We reserve the right to reject an application for any reason permitted by law.
We reserve the right to decline an application for any reasons subject to the requirements imposed by law in the jurisdiction where the requested
insurance Policy was to be issued and delivered. If the application is declined or canceled, the full amount paid with the application will be refunded.
We determine the minimum Face Amount (an amount that is used to determine the death benefit) for a Policy based on the Attained Age
of the Insured when we issue the Policy. The minimum Face Amount for the preferred and premier Premium Classes is $150,000; $75,000 for standard/nicotine Premium Class Insureds age 21-50; and $50,000 for all others. The maximum Issue Age for
Insureds in the preferred and premier underwriting classes is age 75; in the juvenile underwriting class is age 20; and in the standard Premium Classes is age 80. We base the minimum Initial Premium for your Policy on a number of factors
including the age, gender and Premium Class of the Insured and the Face Amount. We currently require a minimum Initial Premium as shown on your Policy specifications page.
You can generally exchange one life insurance policy for another in a ‘tax-free exchange’ under Section 1035 of the Tax Code. Before
making an exchange, you should compare both policies carefully. Remember that if you exchange another policy for the one described in this prospectus, you might have to pay a Surrender Charge on your old policy. There will be a new Surrender
Charge period for this Policy and other charges may be higher (or lower) and the benefits may be different. This Policy will have new suicide and incontestability periods, during which benefits may be denied in certain circumstances. Your old
policy’s suicide and incontestability periods may have expired. If the exchange does not qualify for Section 1035 treatment, you may have to pay federal income and penalty taxes on the exchange. You should not exchange another policy for this one
unless you determine, after knowing all the facts, that the exchange is in your best interest and not just better for the person trying to sell you this Policy (that person will generally earn a commission if you buy this Policy through an
exchange or otherwise).
Temporary Insurance Coverage. If
the primary proposed Insured meets our eligibility requirements for temporary insurance coverage, then we will provide the primary proposed Insured and children to be covered under a Children’s Term Insurance Rider with temporary insurance
coverage in the amount applied for (excluding any riders and supplemental benefits) or $500,000, whichever is less. The conditions and eligibility requirements for temporary insurance coverage are detailed in the Temporary Insurance Agreement
(“TIA”) included with the Policy application.
Temporary insurance coverage terminates automatically, and without notice, on the earliest of:
| • |
The date insurance coverage under the Policy becomes effective;
|
| • |
The date you receive notice that either the temporary insurance coverage or the application has been declined, and in no event later than 12:01 a.m. Pacific Time of the fifth day after Farmers has mailed a letter giving such notice; or
|
| • |
The date Farmers receives a signed request from the Proposed Policy Owner(s) to cancel or withdraw either the Application or the TIA.
|
Insurance Coverage Under the Policy. If we issue the Policy as applied
for, insurance coverage under the Policy will take effect on the Issue Date, provided sufficient payment has been received. If we issue a Policy other than as applied for, insurance coverage under the Policy will take effect either upon the
completion of all underwriting and Owner payment for and acceptance of the Policy, or on the Issue Date, whichever is later. The Issue Date will be printed in the Policy and may be several days later than when the Policy is delivered to you.
Insurance coverage under the Policy will not begin before the Issue Date printed in the Policy, if issued.
Generally, we will issue the Policy if we determine that the Insured meets our underwriting requirements, we accept the original
application, and we receive the Owner’s payment. On the Issue Date, we will allocate your premium(s) (after subtracting the premium expense charge and the Monthly Deductions for the first month) to the Fixed Account until the Reallocation Date.
Backdating. We may sometimes backdate a Policy, if you request, by
assigning an Issue Date earlier than the Record Date so that you can obtain lower cost of insurance rates, based on a younger insurance age. We will not backdate a Policy earlier than the date the application is signed. For a backdated Policy,
Monthly Deductions, including cost of insurance charges and underwriting and sales expense charges, will begin on the backdated Issue Date. You will therefore incur charges for the period between the Issue Date and the Record Date as though
insurance coverage under the Policy is in effect during this period, even though such coverage does not in fact begin until the Record Date (or a few days prior to the Record Date in some cases).
You may cancel a Policy during the “Right to Examine Period” by returning it with a signed request for cancellation to our Home
Office. In most states, the Right to Examine Period expires 10 days after you receive the Policy. This period will be longer if required by state law. If you decide to cancel the Policy during the Right to Examine Period, we will treat the Policy
as if we never issued it. We will refund an amount equal to the greater of the sum of all Premiums paid for the Policy or the Contract Value at the end of the Valuation Date on which we receive the returned Policy, which must be sent along with a
signed request for cancellation to our Home Office.
Policies Sold in California. If you purchase your Policy in California,
and are 60 years of age or older at the time, the Right to Examine Period lasts for 30 days from the date you receive the Policy. You may cancel the Policy at any time during the Right to Examine Period by returning it with a signed request for
cancellation to our Home Office.
During the 30-day Right to Examine Period (plus 10 days), we will place your premium in the Fixed Account, unless you specifically
direct that we allocate your premium to the Subaccounts and Fixed Account you selected on the application. We will credit your premium(s) placed in the Fixed Account with interest at the current Fixed Account interest rate. If your premium is
placed solely in the Fixed Account, we will refund to you all Premiums and Policy fees you paid as of the business day on which we receive your cancelled Policy, which must be sent along with a signed request for cancellation to our Home Office.
If you have directed that your premium be invested in the Subaccounts, rather than the Fixed Account, during the Right to Examine
Period, we will refund you only the Contract Value. The Contract Value refunded will be as of the business day we receive your cancelled Policy, which must be sent along with a signed request for cancellation to our Home Office. Any amounts
refunded will reflect the investment performance of the Subaccounts you selected, and the fees and charges that we deduct. You bear the risk that a refund of your Contract Value could be less than the premium you
paid for this Policy. If you decide to cancel this Policy after the Right to Examine Period has expired, we will impose a Surrender Charge on the transaction.
We may offer other life insurance policies that have different investment options, death benefits, policy features, and optional
benefits. These other policies also have different charges that would result in different performance levels than this Policy. For more information about the other policies, please contact our Home Office or your agent.
The Policy belongs to the Owner named in the application. The Owner may exercise all of the Ownership rights and privileges described
in the Policy. The Insured is the Owner unless the application specifies a different person (another natural person or entity) as the Owner or a new Owner or co-Owner is named by the Owner. If the Owner dies before the Insured and no successor
Owner is named, then Ownership of the Policy will pass to the Insured. The Owner may designate the Beneficiary (the person to receive the Death Benefit Amount Payable when the Insured dies) in the application.
|
Changing the Owner
|
• You may change the Owner by providing a written request to us at
any time while the Insured is alive, subject to any existing assignments of your Policy.
|
|
|
• The change takes effect on the date that the written request is
signed.
|
|
|
• We are not liable for any actions we may have taken before we
received the written request.
|
|
|
• Changing the Owner does not automatically change the Beneficiary.
Changing the Owner may have tax consequences. You should consult a tax advisor before changing the Owner.
|
|
Selecting and
Changing the
Beneficiary
|
• If you designate more than one Beneficiary, then each Beneficiary
shares equally in any Death Benefit Amount Payable unless the Beneficiary designation states otherwise.
|
|
|
• If the Beneficiary dies before the Insured, then any contingent
Beneficiary becomes the Beneficiary.
|
|
|
• If both the Beneficiary and contingent Beneficiary die before the
Insured, then we will pay the Death Benefit Amount Payable to the Owner or the Owner’s estate once the Insured dies.
|
|
|
• You can request a delay clause that provides that if the
Beneficiary dies within a specified number of days (maximum 180 days) following the Insured’s death, then the Death Benefit Amount Payable will be paid as if the Beneficiary had died first.
|
|
|
• You can change the Beneficiary by providing us with a written
request while the Insured is living.
|
|
|
• The change in Beneficiary is effective as of the date you sign
the written request.
|
|
|
• We are not liable for any actions we may have taken before we
received the written request.
|
|
Assigning the
Policy – Collateral
Assignment
|
• You may assign Policy rights while the Insured is alive.
|
|
• The Owner retains any Ownership rights that are not assigned.
|
|
|
• The assignee may not change the Owner or the Beneficiary, and may
not elect or change an optional method of payment. We will pay any amount payable to the assignee in a lump sum.
|
|
|
|
• Claims under any assignment are subject to proof of interest and
the extent of the assignment.
|
|
|
• We are not:
|
|
|
• bound by any assignment unless we receive and record a Written
Notice of the assignment.
|
|
|
• responsible for the validity of any assignment.
|
|
|
• liable for any payment we made before we received Written
Notice of the assignment.
|
|
|
Assigning the Policy may have tax consequences. See the “Federal Tax Considerations” section.
|
Only one of our officers may modify the Policy or waive any of our rights or requirements under the Policy. Any modification or
waiver must be in writing. No agent may bind us by making any promise not contained in the Policy.
Upon notice to you, we may modify the Policy to:
| • |
conform the Policy, our operations, or the Variable Account’s operations to the requirements of any law (or regulation issued by a government agency) to which the Policy, our company or the Variable Account is subject;
|
| • |
assure continued qualification of the Policy as a life insurance contract under the federal tax laws; or
|
| • |
reflect a change in the Variable Account’s operations.
|
If we modify the Policy, we will make appropriate endorsements to the Policy. If any provision of the Policy conflicts with the laws
of a jurisdiction that govern the Policy, we will amend the provision to conform with such laws.
Your Policy will terminate on the earliest of:
| • |
the Maturity Date (Insured’s Attained Age 121);
|
| • |
the date the Insured dies;
|
| • |
a grace period ends before we receive the sufficient Premium Payment or Loan Repayment or both as defined in the Grace Period section; or
|
| • |
the date you Surrender the Policy in full.
|
Premiums
You have flexibility to determine the frequency and the amount of the Premiums you pay. You do not have to pay Premiums according to
any schedule. However, you greatly increase your risk of Lapse if you do not regularly pay Premiums at least as large as the current minimum premium. Paying the minimum Premiums for the Policy will not
necessarily keep your Policy in force. It is likely that additional Premiums will be necessary to keep the Policy in force until maturity.
Before the Issue Date of the Policy (or if premium is paid on delivery of the Policy, before the Record Date), we will require you to
pay the minimum premium indicated on your Policy specifications page. Thereafter, you may pay Premiums ($25 minimum) at any time. You must send all Premiums to our Service Center or to your agent. We reserve the right to limit the number and
amount of any unscheduled Premiums. You may not pay any Premiums once the Insured reaches Attained Age 100.
We deduct a premium expense charge from each premium payment, after which the remainder of the premium payment is allocated to the
Subaccounts and the Fixed Account based on your current allocation percentages for premium payments (Initial Premiums are assessed the premium expense charge and the remainder of the premium is allocated to the Fixed Account until the
Reallocation Date). We retain the premium expense charge to compensate us for certain expenses such as premium taxes and selling expenses. See “Charges and Deductions – Premium Deductions.”
We will treat any payment you make as a premium unless you clearly mark it as a loan repayment. We
have the right to limit or refund any premium, if the premium would disqualify the Policy as a life insurance contract under the Tax Code, or if the payment would increase the death benefit by more than the amount of the premium.
Planned Premiums. You may determine a planned premium schedule that
allows you to pay level Premiums at fixed intervals over a specified period of time. You are not required to pay Premiums according to this schedule. You may change the amount and frequency of your planned Premiums by sending us a written
request. We have the right to limit the amount of any increase in planned Premiums. Even if you pay your planned Premiums on schedule, your Policy will Lapse unless your Cash Surrender Value is positive or your Policy passes the Grace Exemption
Test. See the “Principal Policy Risks – Risk of Lapse” and the “Policy Lapse and Reinstatement – Lapse” sections.
Electronic Payments and Billing. If you authorize electronic payment of
your Premiums from your bank account, the total amount of Premiums being debited, must be at least $25 per month. If you request to be billed for your planned Premiums, the total amount billed must be at least $300 per year. You can be billed on
an annual, semi-annual, quarterly or monthly basis for the applicable fraction of $300, but the total for the year must add up to at least $300.
You can stop paying Premiums at any time and your Policy will continue in force until the earlier of the Maturity Date (when the
Insured reaches Attained Age 121), or the date when either (1) the Insured dies, or (2) the Policy Lapses, or (3) we receive your signed request to Surrender the Policy in full.
Tax Code Processing. If we receive any premium payment that we
anticipate will cause a Policy to become a modified endowment contract (“MEC”) or will cause a Policy to lose its status as life insurance under Section 7702 of the Tax Code, we will not accept the excess portion
of that premium. We will immediately notify the Owner and give an explanation of the issue by sending a letter to the Owner’s address of record. We will refund the excess premium no later than 2
weeks after receipt of the premium at the Service Center (the “refund date”), except in the following circumstances:
| a. |
the tax problem resolves itself prior to the refund date; or
|
| b. |
the tax problem relates to a MEC and we receive a signed acknowledgment from the Owner prior to the refund date instructing us to process the premium notwithstanding the tax issue involved.
|
During this two-week period, we will hold such excess premium in a suspense account until the refund date. Premiums held in the suspense account will
not be credited interest. Farmers will treat the excess premium as having been received on the date the tax problem resolves itself or the date Farmers receives the signed acknowledgement at the Service Center. We will then process the excess
premium accordingly.
Paying the minimum premium is one way to reduce the risk that your Policy will Lapse without value. You greatly increase the risk of
your Policy lapsing if you do not regularly pay Premiums at least as large as the current minimum premium. However, paying the minimum Premiums for the Policy will not necessarily keep your Policy in
force.
It is likely that you will be required to pay additional Premiums in order to keep your Policy in force until maturity.
For a full discussion of the conditions that will cause the Policy to enter the grace period, please see the “Policy Lapse and
Reinstatement – Lapse” section of this prospectus.
The initial minimum premium is shown on your Policy specifications page. The minimum premium depends on a number of factors including
the age, gender, and Premium Class of the proposed Insured, and the Face Amount.
The minimum premium will change if:
| • |
you increase or decrease the Face Amount;
|
| • |
you change the death benefit option;
|
| • |
you change or add a rider;
|
| • |
you take a partial Surrender when you have elected the level death benefit option (Option B); or
|
| • |
the Insured’s Premium Class changes (for example, from nicotine to non-nicotine, or from substandard to standard).
|
Your Policy can Lapse before maturity, depending on the amount of Premiums you pay, whether you take loans and partial Surrenders or
increase the Face Amount of your Policy, if the investment results of the Subaccounts in which you invest your Contract Value are unfavorable, or whether your current insurance charge increases. Your agent can provide you with a personalized illustration that can show how many years your Policy would stay in force under various premium and hypothetical investment scenarios. For certain Issue Ages, classes and Policy sizes, this
illustration may show that regular payments of the minimum premium will keep your Policy in force several years even if investment results are very low and even if we impose the maximum charges allowed by the Policy, so long as you do not take a
loan or partial Surrender or increase the Face Amount of your Policy. This is not true for all ages, classes, and investment results, however. So we encourage you to ask your agent for a personalized illustration to help you decide what level of
premium payments to pay in your particular circumstances.
When you apply for a Policy, you must instruct us to allocate your Initial Premium(s) to one or more Subaccounts of the Variable
Account and to the Fixed Account according to the following rules:
| • |
You must put at least 1% of each premium in any Subaccount you select or the Fixed Account.
|
| • |
Allocation percentages must be in whole numbers and the sum of the percentages must equal 100.
|
You can change the allocation instructions for additional Premiums without charge at any time by providing us with written
notification (or any other notification we deem satisfactory). Any allocation change will be effective on the date we record the change. Any future Premiums will be allocated in accordance with the new allocation, unless we receive contrary
written instructions. Changing your allocation instructions will not change the way your existing Contract Value is apportioned among the Subaccounts or the Fixed Account. We reserve the right to limit the number of premium allocation changes. We
also reserve the right to limit the number of Subaccount allocations in effect at any one time.
Investment returns from amounts allocated to the Subaccounts will vary with the investment experience of these Subaccounts and will
be reduced by applicable Policy fees and charges. You bear the risk of any decline in the Contract Value of your Policy resulting from the performance of the Subaccounts you have chosen.
On the Issue Date, we will allocate your premium(s) received, minus the premium expense charge, minus the Monthly Deduction(s), to
the Fixed Account unless your state requires that we immediately allocate your premium to the Subaccounts. We also allocate any Premiums we receive from the Issue Date to the Reallocation Date (the Record Date, plus the number of days in your
state’s right to examine period, plus 10 days) to the Fixed Account. While held in the Fixed Account, premium(s) will be credited with interest at the current Fixed Account rate. On the Reallocation Date, we will reallocate the Contract Value in
the Fixed Account to the Subaccounts (at the unit value next determined) in accordance with the allocation percentages provided in the application. In the absence of allocation instructions, the Contract Value will remain in the Fixed Account
pending such instructions.
Unless additional underwriting is required or a situation described above in the “Tax Code Processing” section occurs, we invest all
Premiums paid after the Reallocation Date on the Business Day they are received in our Service Center. We credit these Premiums to the Subaccounts at the unit value next computed at the end of a Business Day on which we receive them at our
Service Center. If we receive your additional Premiums after the close of a Business Day, we will calculate and credit them as of the end of the next Business Day.
Your Policy can Lapse before maturity, depending on the Premiums you pay and the investment results of the Subaccounts in which you
invest your Contract Value. Your agent can provide you, free of charge, with personalized illustrations that can show how many years your Policy would stay in force under various premium and hypothetical investment scenarios. You should request personalized illustrations from your agent to help you decide what level of premium payments to pay in your particular circumstances.
|
Your Contract Value:
|
• varies from day to day, depending on the investment experience of
the Subaccounts you choose, the interest credited to the Fixed Account, the charges deducted and any other Policy transactions (such as additional premium payments, transfers, partial Surrenders and Policy loans);
|
|
• serves as the starting point for calculating values under a
Policy;
|
|
|
|
• equals the sum of all values in each Subaccount, the loan account
(the Loan Account Value), and the Fixed Account (the Fixed Account Value);
|
|
|
• is determined on the Issue Date and on each Business Day;
|
|
|
• on the Issue Date, equals the Initial Premium received, minus the
premium expense charge, and minus the Monthly Deductions; and
|
|
|
• has no guaranteed minimum amount and may be more or less than
Premiums paid.
|
Each Subaccount’s value is determined at the end of each Business Day. We determine your Policy’s value in each Subaccount by
multiplying the number of units that your Policy has in the Subaccount by the Accumulation Unit value of that Subaccount at the end of the Business Day.
|
The number of units in any Subaccount on any Business Day equals:
|
• the number of units you had in any Subaccount at the end of the
preceding Business Day; plus
|
|
• units purchased with additional Premiums since the preceding
Business Day and allocated to the Subaccounts, net of the premium expense charge; plus
|
|
|
• units purchased via transfers from another Subaccount, the Fixed
Account, or loan account, to the Subaccount since the preceding Business Day; minus
|
|
|
• units redeemed as part of a transfer to another Subaccount, the
Fixed Account, or the loan account, plus units redeemed to cover any associated transfer fees since the preceding Business Day; minus
|
|
|
|
• units redeemed to pay partial Surrenders and partial Surrender
fees assessed against the Subaccount since the preceding Business Day; minus
|
|
|
• units redeemed to pay for the pro-rata share of the Monthly
Deductions on the Business Day on or after the Monthly Due Date.
|
Every time you allocate or transfer money to or from a Subaccount, we convert that dollar amount into units. We determine the number
of units we credit to, or subtract from, your Policy by dividing the dollar amount of the allocation, transfer, or partial Surrender, by the unit value for that Subaccount at the end of the Business Day for that transaction.
The Accumulation Unit value (or price) of each Subaccount will reflect the investment performance of the Portfolio in which the
Subaccount invests. Unit values will vary among Subaccounts. The unit value of each Subaccount was originally established at the figure shown on the Variable Account’s financial statements. The unit value may increase or decrease from one
Business Day to the next. For a discussion of how unit values are calculated, see the SAI.
On the Issue Date, the Fixed Account Value is equal to the Initial Premium paid, less the premium expense charge, less the first
Monthly Deduction. Any subsequent premium payments that are received by us prior to the Reallocation Date, minus the premium expense charge, will also be allocated to the Fixed Account.
|
The Fixed Account Value on any Business Day after the Issue Date equals:
|
• the Fixed Account Value on the preceding Business Day plus
interest from the preceding Business Day to the current Business Day; plus
|
|
• the portion of the premium(s), minus the premium expense charge,
allocated to the Fixed Account since the preceding Business Day, plus interest from the date such premium(s) were received to the current Business Day; plus
|
|
|
• any amounts transferred to the Fixed Account since the preceding
Business Day, plus interest from the effective date of such transfers since the preceding Business Day to the current Business Day; minus
|
|
|
|
• the amount of any transfer from the Fixed Account to the
Subaccounts and the loan account, and any associated transfer fees, since the preceding Business Day, plus interest on each transferred amount and transfer fees from the effective date of such transfers since the preceding Business Day to
the current Business Day; minus
|
|
|
• the amount of any partial Surrenders and any applicable partial
Surrender fees deducted from the Fixed Account since the preceding Business Day, plus interest on those Surrendered amounts from the effective date of each partial Surrender since the preceding Business Day to the current Business Day; minus
|
|
|
• the amount equal to a pro-rata share of the Monthly Deduction on
the Business Day on or after each Monthly Due Date, for the month beginning on that Monthly Due Date.
|
Your Policy’s guaranteed minimum Fixed Account Value will not be less than the minimum values required by the state where we deliver
your Policy.
|
The Loan Account
Value on any Business Day after the Issue Date equals:
|
• the Loan Account Value on the preceding Business Day plus
interest from the preceding Business Day to the date of calculation; plus
|
|
• any amounts transferred to the loan account since the preceding
Business Day, plus interest from the effective date of such transfers to the date of calculation; minus
|
|
|
|
• the amount of any transfer from the loan account to the
Subaccounts and the Fixed Account since the preceding Business Day, plus interest from the effective date of such transfers since the preceding Business Day to the date of calculation.
|
Interest is charged daily on Policy loans. Interest is due and payable at the end of each Policy year or, if earlier, on the date of
any Policy loan increase or repayment. Any interest not paid when due will be transferred from the Fixed Account and Subaccounts to the loan account on a pro-rata basis, if sufficient Funds are available for transfer. Unpaid interest becomes part
of the Outstanding Loan Amount and accrues interest daily.
This section describes the charges and deductions that we make under the Policy to compensate for: (1) the services and benefits we
provide; (2) the costs and expenses we incur; and (3) the risks we assume. The fees and charges we deduct under the Policy may result in a profit to us.
|
Services and benefits we provide:
|
• the death benefit, Surrender and loan benefits under the Policy,
and the benefits provided by riders.
|
|
|
• investment options, including premium allocations.
|
|
|
• administration of elective options.
|
|
|
• the distribution of reports to Owners.
|
|
Costs and expenses we incur:
|
• costs associated with processing and underwriting applications,
issuing and administering the Policy (including any riders).
|
|
|
• overhead and other expenses for providing services and benefits.
|
|
|
• sales and marketing expenses, including compensation paid in
connection with the sale of the Policies.
|
|
|
• other costs of doing business, such as collecting Premiums,
maintaining records, processing claims, affecting transactions, and paying federal, state and local premium and other taxes and fees.
|
|
Risks we assume include but are not limited to:
|
• that the cost of insurance charges we deduct are insufficient to
meet our actual claims because Insureds die sooner than we anticipate.
|
|
• that the costs of providing the services and benefits under the
Policies exceed the charges we deduct.
|
All of the charges we deduct are used to pay aggregate Policy costs and expenses, including a profit to us, that we incur in
providing the services and benefits under the Policy and assuming the risks associated with the Policy.
When you make a premium payment, and before we allocate the net premium payment to the Subaccounts and/or the Fixed Account, we
deduct a premium expense charge currently equal to 7% of the premium payment for Premiums paid in Policy years 1-10 and 3% of the premium payment for Premiums paid in Policy years 11+. The premium expense charge will never exceed 7% of the
premium payment. We determine the amount that we will allocate to the Subaccounts and the Fixed Account according to your instructions. For Policy years 1 through 10, the 7% of each premium that we retain is the sum of 4.8%, which compensates us
for a portion of our sales expenses, and 2.2%, which compensates us for the estimated average state premium taxes we expect to incur in the future. For Policy years 11 and over, the 3% of each premium that we retain is the sum of 0.8%, which
compensates us for a portion of our sales expenses, and 2.2%, which compensates us for the estimated average state premium taxes we expect to incur in the future. State premium tax rates vary from state to state and currently range from 0% to
3.50% in the states in which the Policy is sold. The estimated charge does not necessarily reflect the actual premium tax rate that applies to a particular Policy. If the actual premium tax rate is less than 2.2%, the difference between the
actual rate and the 2.2% will be retained by us to help cover additional premium tax charges that may be imposed in the future, and to help cover premium taxes imposed on Policies in states that charge a higher premium tax rate.
We take a Monthly Deduction from the Contract Value on the Issue Date and on the Business Day on or after each subsequent Monthly Due
Date (the same day of each succeeding month as the Issue Date). We will make deductions by canceling units in each Subaccount and withdrawing Funds from the Fixed Account. We will take the Monthly Deduction on a pro-rata basis from all accounts
except the loan account (i.e., in the same proportion that the value in each Subaccount and the Fixed Account bears to the sum of all Subaccounts and the Fixed Account on the Monthly Due Date). Because
portions of the Monthly Deduction can vary from month-to-month, the Monthly Deduction will also vary.
The Monthly Deduction is equal to:
| • |
The monthly administration charge; plus
|
| • |
The cost of insurance charge for the Policy; plus
|
| • |
The monthly underwriting and sales expense charge, if any; plus
|
| • |
The risk charges of any attached riders.
|
Monthly Administration Charge. We deduct this charge to compensate us for a portion of
our administrative expenses such as recordkeeping, processing death benefit claims and Policy changes, and overhead costs. The monthly administration charge currently equals $12.00. We may increase or decrease this charge but it is guaranteed
never to be higher than $12.00.
Cost of Insurance Charge. We assess a monthly cost of insurance charge
to compensate us for the anticipated cost of paying a death benefit in excess of your Contract Value. The charge depends on a number of variables (e.g., the Face Amount, the Contract Value, the Death
Benefit Option, the Insured’s Issue Age, gender, and Premium Class, and the number of months since the Issue Date, among other factors) that will cause it to vary from Policy to Policy and from month to month.
The cost of insurance charge is equal to Risk of Insurance Amount, as defined below, divided by 1,000, then multiplied by the number
produced from the following:
| 1. |
the monthly cost of insurance rate per $1,000; times
|
| 2. |
the table rating factor charge for your Policy, if any, as shown on your Policy’s specifications page; plus
|
| 3. |
the flat extra charge for your Policy, if any, as shown on your Policy’s specifications page.
|
The guaranteed maximum monthly cost of insurance rate will be the rate shown in the table in Appendix B (or on your Policy
specifications page), except that a different table of guaranteed maximum monthly cost of insurance rate per $1,000 may apply to increases in Face Amount that are issued with a Premium Class different from that shown on your Policy specifications
page.
The table rating factor charge is a factor by which the cost of insurance rate may be
multiplied if this Policy is in a special Premium Class. This factor is applied to both current and guaranteed cost of insurance rates. This factor is deducted as part of the cost of insurance charge and compensates us for additional costs
associated with policies in a special Premium Class. If applicable to you, your Policy specifications page will show you the amount of this factor.
The flat extra charge is an extra amount that may be added to the cost of insurance charge
if your Policy is in a special Premium Class. The flat extra charge is a rate per $1,000 of Risk Insurance Amount per month. This charge, if any, will be shown on your Policy’s specifications page. This charge compensates us for additional costs
we anticipate from Policies in a special Premium Class.
The Risk Insurance Amount on the Monthly Due Date is:
| 1. |
the adjusted death benefit; minus
|
| 2. |
the adjusted Contract Value on that date.
|
The adjusted death benefit and the adjusted Contract Value are what the death benefit and the Contract Value, respectively, would be
on that date if the cost of insurance charge for this Policy was zero. The adjusted death benefit and the adjusted Contract Value are determined by using the Contract Value on the respective Monthly Due Date and deducting all applicable charges
and fees, except the cost of insurance charge.
The Risk Insurance Amount may increase or decrease each month depending on investment experience of the Portfolios in which you are
invested, the payment of additional Premiums, the fees and charges deducted under the Policy, the death benefit option you chose, Policy riders, any Policy transactions (such as loans, partial Surrenders, changes in death benefit option) and the
application of the death benefit percentage formula. Therefore, the cost of insurance charges can increase or decrease each month.
Cost of insurance rates vary by the Insured’s Attained Age, gender, Premium Class, the number of months since the Issue Date, and the
amount of the Face Amount, among other factors. The cost of insurance rates are generally higher for male Insureds than for female Insureds of the same age and Premium Class, and ordinarily increase with age. Cost of insurance rates may never
exceed the guaranteed maximum cost of insurance rates. For Sample rates, see “Appendix B: Guaranteed Maximum Cost of Insurance Rates.”
The Premium Class of the Insured will affect the cost of insurance rates. We currently place Insureds into premier, preferred and
standard Premium Classes and into special Premium Classes involving higher mortality risks.
The cost of insurance rates for Insureds in special Premium Classes involving higher mortality risks are multiples of the standard
rates. If the Insured is in a special Premium Class, the guaranteed maximum monthly cost of insurance rate will be the rate shown in the table in the Policy times a table rating factor charge shown on your Policy specifications page.
We calculate the cost of insurance separately for the initial Face Amount and for any increase in Face Amount. If you request and we approve an
increase in your Policy’s Face Amount, then a different Premium Class (and a different cost of insurance rate) may apply to the increase, based on the Insured’s age and circumstances at the time of the increase.
The Policies are based on 2001 or 2017 C.S.O. mortality tables that distinguish between men and women. As a result, the Policy may
pay different benefits to men and women of the same age and Premium Class. We also offer Policies based on unisex mortality tables if required by state law.
We currently charge cost of insurance rates that are higher for Policies having a Face Amount less than $150,000. If you reduce your
Face Amount below $150,000 at any time, then the higher rates will apply in most cases.
Monthly Underwriting and Sales Expense Charge. We deduct this charge
each month during the first 5 Policy years after the Issue Date to compensate us for a portion of the expenses of selling, underwriting and issuing the Policy. This charge is imposed for an additional 5 Policy years each time you choose to
increase the Face Amount after the Issue Date. The rate for this charge depends upon the Insured’s age at issue or at the time of any increase in Face Amount. The charge is calculated by multiplying the rate for this charge by the amount of Face
Amount issued or by the amount by which the Face Amount is increased above the Face Amount immediately prior to the current increase. The underwriting and sales expense charge is not imposed on any increases in Face Amount that are due to a
change in death benefit option. The monthly underwriting and sales expense charge will not be reduced as a result of a reduction in the Face Amount.
The amount of the monthly underwriting and sales expense charge is computed on the Issue Date, or on the Monthly Due Date for
increases in Face Amount, as follows:
| 1. |
Find the appropriate monthly underwriting and sales expense charge per $1,000 for the Insured’s Issue Age in Appendix C; then
|
| 2. |
Multiply this charge per $1,000 by the original Face Amount; and then
|
| 3. |
Divide the result by 1,000.
|
If you choose to increase the Face Amount after the Issue Date, we will assess an additional monthly underwriting and sales expense
charge for 5 years after the increase takes effect. The additional charge will be assessed only on the amount of the increase in Face Amount, using the charge applicable to the Insured’s Attained Age at the time of the increase. The additional
charge will be calculated by following the three steps outlined above.
| • |
Monthly Underwriting and Sales Expense Charge discount (“MUSEC discount”). We may provide a discount on the base monthly underwriting and sales expense charge if a “qualifying” policy is in force, applied for, or pending when we
receive your Policy application. Qualifying policies currently include those where the Policy Owner, the payor of the Policy or the primary Insured on the Policy is an active driver on a Farmers Insurance® auto policy, or is
one of the named Insureds under a Farmers Insurance® home owner’s or renter’s policy, or owns another life insurance or commercial policy issued by us. We may also provide the discount prospectively if, after issue, you
purchase a qualifying policy, subject to state restrictions. Contact us or your agent for details concerning the rate of MUSEC discount that may be applied to your Policy. The size of the qualifying policy does not affect the amount of
the discount.
|
Rider Charges. The Monthly Deduction includes charges for certain
optional insurance benefits you add to your Policy by rider. The rider charges are summarized in the Fee Table in this prospectus. Any rider charges applicable to your Policy will be indicated in the rider you receive. If you add one or more of
the following riders to your Policy, your Monthly Deduction will include the corresponding rider charges:
| • |
Accidental Death Benefit Rider
|
| • |
Children’s Term Insurance Rider
|
| • |
Waiver of Deduction Rider
|
| • |
Monthly Disability Benefit Rider (not available effective August 7, 2015)
|
We deduct a daily charge from your Contract Value in each Subaccount to compensate us for a portion of certain mortality and expense
risks we assume. The mortality risk is the risk that an Insured will live for a shorter time than we project. The expense risk is the risk that the expenses we incur will exceed the maximum charges we can impose according to the terms of the
Policy. The mortality and expense risk charge is equal to:
| • |
your Contract Value in each Subaccount; multiplied by
|
| • |
the daily portion of the annual mortality and expense risk charge rate, which is currently 0.30%.
|
| • |
We reserve the right, at our discretion, to increase the annual mortality and expense risk charge rate to no more than 0.60%.
|
If this charge and the other charges we impose do not cover our actual costs, we absorb the loss. Conversely, if the charges we
impose more than cover actual costs, the excess is added to our surplus. We expect to profit from the mortality and expense risk charge. We may use any profits for any lawful purpose including covering distribution costs.
We deduct a Surrender Charge if, during the first nine Policy Years, or within nine years following any increase in Face Amount, you
fully Surrender the Policy. In the case of a full Surrender, we pay you the Contract Value, less any Surrender Charge, less any Monthly Deduction due and unpaid, and less any Outstanding Loan Amount (including any interest you owe). The payment
you receive is called the Cash Surrender Value.
The Surrender Charge may be significant. You should carefully calculate this charge before you
request a full Surrender. Under some circumstances the level of Surrender Charges might result in no Cash Surrender Value available if you Surrender your Policy during the period when Surrender Charges apply. This will depend on a
number of factors, but is more likely if:
| 1. |
you pay Premiums equal to or not much higher than the minimum premium shown in your Policy, or
|
| 2. |
investment performance is too low.
|
The Surrender Charge is equal to the sum of:
| 1. |
the Surrender Charge for the Face Amount on the Issue Date; plus
|
| 2. |
the Surrender Charge for each increase in Face Amount.
|
To calculate the Surrender Charge for the Face Amount on the Issue Date, (i) locate the appropriate Surrender Charge factor from a
table in Appendix D of this prospectus, or the “Surrender Charge Factors” table in your Policy, for the Insured’s Issue Age and the number of complete years that have elapsed since your Policy was issued, then (ii) multiply this factor by the
Face Amount on the Issue Date and divide the result by 1,000.
To calculate the Surrender Charge for increases in Face Amount that are issued with the same Premium Class as that shown on your
Policy specifications page, (i) locate the appropriate Surrender Charge factor from a table in Appendix D of this prospectus, or the “Surrender Charge Factors” table in your Policy, for the Insured’s Attained Age at the time of increase and the
number of complete years that have elapsed since the increase, then (ii) multiply this factor by the amount of the increase in Face Amount and divide the result by 1,000.
For increases in Face Amount that are issued with a Premium Class different from that shown on your Policy specifications page, the
same process is followed, but a different table from the “Surrender Charge Factors” table in your Policy may apply; see “Appendix D: Table of Surrender Charge Factors” of this prospectus for an exhaustive list of surrender charge factor
tables. The applicable Surrender Charge factor varies by Issue Age, gender, nicotine use, and number of full Policy years since the Issue Date.
This example is for a Policy issued to a male Insured, in the standard non-nicotine Premium Class. The Face Amount is $150,000 and
the Issue Age is 32. The Surrender Charge in Policy year 1 will be $1,300.50 ($150,000 multiplied by the Surrender Charge factor (8.67) divided by 1,000).
Partial Surrender Processing Fee. Upon partial Surrender, we deduct a
partial Surrender processing fee equal to the lesser of 2% of the amount of the partial Surrender or $25. The partial Surrender processing fee will be deducted from the Subaccounts and the Fixed Account on a pro-rata basis, or on different basis
if you so request.
| • |
We currently allow you to make 12 transfers each Policy year free from charge. Any unused free transfers do not carry over to the next Policy year.
|
| • |
We charge $25 for each additional transfer. We will not increase this charge.
|
| • |
For purposes of assessing the transfer charge, each written or telephone request is considered to be one transfer, regardless of the number of Subaccounts (or Fixed Account) affected by the transfer.
|
| • |
We deduct the transfer charge from the Subaccounts and Fixed Account on a pro-rata basis, or on a different basis if you so request.
|
| • |
Transfers we effect on the Reallocation Date, and transfers due to loans, dollar cost averaging, and death benefit processing do not count as transfers for the purpose of assessing this charge.
|
| • |
For years 1 through 15, we will charge you loan interest at a rate of 4.5%, compounded annually. For years 16 and beyond, we will charge you loan interest at a rate 2.5%, compounded annually. These rates may change at our discretion,
but are guaranteed not to exceed 6.5%.
|
| • |
Interest is charged daily, and is due and payable at the end of each Policy year, or on the date of any Policy loan increase or repayment, if earlier.
|
| • |
Unpaid interest becomes part of the Outstanding Loan Amount and accrues interest daily.
|
| • |
Amounts in the loan account earn interest at the guaranteed minimum rate of 2.5% per year.
|
Each Portfolio deducts Portfolio management fees and expenses from the amounts you have invested in the Portfolios through the
Subaccounts. You pay these Portfolio fees and expenses indirectly. In addition, some Portfolios deduct 12b-1 fees at an annual rate of up to 0.25% of average daily Portfolio assets. For 2024, total annual Portfolio fees and charges for the
Portfolios offered through this Policy ranged from 0.19% to 1.05% of average daily Portfolio assets. See the prospectuses for the Portfolios for more information.
Redemption Fees. A Portfolio may assess a redemption fee of up to 2% on
Subaccount assets that are redeemed out of the Portfolio in connection with a partial Surrender or transfer. Each Portfolio determines the amount of the redemption fee and when the fee is imposed. The redemption fee is retained by or paid to the
Portfolio and is not retained by us. The redemption fee will be deducted from your Contract Value. For more information on each Portfolio’s redemption fee, see the Portfolio prospectus. See also “Transfers – Policy and Procedures Regarding
Disruptive Trading and Market Timing.”
| ◾ |
We may charge a fee not to exceed $25 for each additional annual report you request. We currently charge $0 for each additional annual report you request.
|
| ◾ |
Certain riders attached to the Policy will have their own charges. See the “Fee Table” for more information.
|
Death Benefit Amount Payable
As long as the Policy is in force, we will pay the Death Benefit Amount Payable once we receive satisfactory proof of the Insured’s
death at our Home Office. We may require return of the Policy. We will pay the Death Benefit Amount Payable to the primary Beneficiary or a contingent beneficiary. If the Beneficiary dies before the Insured and there is no contingent beneficiary,
we will pay the Death Benefit Amount Payable to the Owner or the Owner’s estate. We will pay the Death Benefit proceeds in a lump sum or a series of payments according to the payment option selected by the Beneficiary. For more information, see
the “Payment Options” section in the SAI.
|
Death benefit Amount Payable equals:
|
• the death benefit (described below) in effect as of the date of
the Insured’s death; minus
|
|
• any Monthly Deductions due and unpaid at the date of the
Insured’s death; minus
|
|
|
|
• any Outstanding Loan Amount you owe on the Policy loan(s); plus
|
|
|
• the amounts to be paid under the terms of any riders you added to
the Policy.
|
If all or a part of the Death Benefit Amount Payable is paid in one lump sum and the amount is at least $10,000, we will place the
lump-sum payment into an interest-bearing special account opened in the Beneficiary’s name unless the Beneficiary elects to receive the lump sum by check or payment by check is required by applicable law. We will provide the Beneficiary with a
checkbook to access these Funds from the special account within seven days of receipt of due proof of death and payment instructions at the Home Office. The Beneficiary can withdraw all or a portion of the Death Benefit Amount Payable at any
time, and will receive interest on the proceeds remaining in the account. The special account is part of our General Account, is not FDIC Insured, and is subject to the claims of our creditors. We may receive a benefit from the amounts held in
the account.
We may further adjust the amount of the Death Benefit Amount Payable under certain circumstances. See the “Additional Policy Provisions – Our
Right to Contest the Policy; Suicide Exclusion; Misstatement of Age or Gender” sections in the SAI.
In your application, you tell us how much life insurance coverage you initially want to purchase on the life of the Insured. We call
this the “Face Amount” of insurance. You also choose whether the death benefit we will pay is Option A (variable death benefit through Attained Age 99), or Option B (level death benefit through Attained Age 99). For Attained Ages 100 through 120,
the death benefit equals the Contract Value.
You may change the death benefit option after the first Policy year if you send us a signed request for a Policy change, and, if you
change from Option A to Option B, you send evidence of insurability satisfactory to us at the Service Center. A change in death benefit option may have tax consequences.
|
The variable death benefit under Option A is the greater of:
|
• your Policy’s Face Amount, plus your Contract Value on the date
of the Insured’s death; or
|
|
• your Contract Value on the date of the Insured’s death multiplied
by the applicable death benefit percentage.
|
Under Option A, the death benefit varies with the Contract Value.
|
The level death benefit under Option B is the greater of:
|
• your Policy’s Face Amount on the date of the Insured’s death; or
|
|
• your Contract Value on the date of the Insured’s death multiplied
by the applicable death benefit percentage.
|
Under Option B, your death benefit generally equals the Face Amount and will remain level, unless the Contract Value becomes so large
that the Tax Code requires a higher death benefit (Contract Value times the applicable death benefit percentage).
Under Option A, your death benefit will tend to be higher than under Option B. However, the monthly insurance charges we deduct will
also be higher to compensate us for our additional risk. Because of this, your Contract Value will tend to be higher under Option B than under Option A.
In order for the Policy to qualify as life insurance, federal tax law requires that your death benefit
be at least as much as your Contract Value multiplied by the applicable death benefit percentage. The death benefit percentage is based on the Insured person’s Attained Age. For example, the death benefit percentage is 250% for an Insured at age
40 or under, and it declines for older Insureds. The following table indicates the applicable death benefit percentages for different Attained Ages:
|
Attained Age
|
|
Death Benefit Percentage
|
|
40 and under
|
|
250%
|
|
41 to 45
|
|
250% minus 7% for each age over age 40
|
|
46 to 50
|
|
209% minus 6% for each age over age 46
|
|
51 to 55
|
|
178% minus 7% for each age over age 51
|
|
56 to 60
|
|
146% minus 4% for each age over age 56
|
|
61 to 65
|
|
128% minus 2% for each age over age 61
|
|
66 to 70
|
|
119% minus 1% for each age over age 66
|
|
71 to 74
|
|
113% minus 2% for each age over age 71
|
|
75 to 90
|
|
105%
|
|
91 to 94
|
|
104% minus 1% for each age over age 91
|
|
95 and above
|
|
100%
|
If the Tax Code requires us to increase the death benefit by reference to the death benefit percentages, that increase in the death
benefit will increase our risk, and will result in a higher monthly cost of insurance.
Option A Example. Assume that the Insured’s Attained Age is under 40,
that there have been no decreases in the Face Amount, and that there are no outstanding loans. Under Option A, a Policy with a Face Amount of $50,000 will have a death benefit equal to the greater of $50,000 plus Contract Value or 250% of the
Contract Value. Thus, a Policy with a Contract Value of $10,000 will have a death benefit of $60,000 (that is, the greater of $60,000 ($50,000 + $10,000) or $25,000 (250% of $10,000)).
However, once the Contract Value exceeds $33,334, the death benefit determined by reference to the death benefit percentage ($33,334 X 250% = $83,335)
will be greater than the Face Amount plus Contract Value ($50,000 + $33,334 = $83,334). Each additional dollar of Contract Value above $33,334 will increase the death benefit by $2.50. This is a circumstance in which we have the right to prohibit
you from paying additional Premiums because an additional dollar of premium would increase the death benefit by more than one dollar.
Similarly, under this scenario, any time Contract Value exceeds $33,334, each dollar taken out of Contract Value will reduce the
death benefit by $2.50.
Option B Example. Assume that the Insured’s Attained Age is under 40,
there have been no partial Surrenders or decreases in Face Amount, and that there are no outstanding loans. Under Option B, a Policy with a $100,000 Face Amount will generally have a $100,000 death benefit. However, because the death benefit must
be equal to or be greater than 250% of Contract Value, any time the Contract Value exceeds $40,000, the death benefit will be determined as required by the Tax Code (Contract Value X 250%) and will exceed the Face Amount of $100,000. Each
additional dollar added to the Contract Value above $40,000 will increase the death benefit by $2.50. This is a circumstance in which we have the right to prohibit you from paying additional Premiums because an additional dollar of premium would
increase the death benefit by more than one dollar.
Similarly, so long as the Contract Value exceeds $40,000, each dollar taken out of the Contract Value will reduce the death benefit
by $2.50.
After the first Policy year, you may change death benefit options or increase or decrease the Face Amount once each Policy year if
you send us a signed request for a Policy change and, in certain instances, the Insured provides evidence of insurability satisfactory to us (but you may not change both the death benefit option and Face Amount during the same Policy year, unless
done simultaneously). Surrender Charges may apply. You may not decrease the Face Amount below the minimum Face Amount shown on your Policy specifications page.
A change in death benefit option may affect the future monthly cost of insurance charge, which varies with the Risk Insurance Amount.
Generally, the Risk Insurance Amount is the amount by which the death benefit exceeds the Contract Value. (See the “Charges and Deductions – Monthly Deduction – Cost of Insurance Charge” section.) If the death benefit does not equal
Contract Value times the death benefit percentage under either Options A or B, changing from Option A (variable death benefit) to Option B (level death benefit) will generally decrease the future Risk Insurance Amount. This would decrease the
future cost of insurance charges. Changing from Option B (level death benefit) to Option A (variable death benefit) generally results in a Risk Insurance Amount that remains level. Such a change, however, results in an increase in cost of
insurance charges over time, since the cost of insurance rates increase with the Insured’s age. Changing the death benefit option may have tax consequences. You should consult a qualified tax advisor before changing the death benefit option.
After any reduction in Face Amount or change in death benefit option, the monthly underwriting and sales expense charge and the
Surrender Charge for the Policy will continue to be based on the same Face Amount on which they were based immediately before the change and on any subsequent requested increase in Face Amount.
For a more detailed discussion on changing death benefit options, see the SAI.
If you have selected the variable death benefit (Option A), a partial Surrender will not affect the Face Amount. But if you have
selected the level death benefit (Option B), a partial Surrender will reduce the Face Amount by the amount of the partial Surrender (not including the processing fee). The reduction in Face Amount will be subject to the terms of the “Changing the
Face Amount” section below.
When you apply for the Policy, you tell us how much life insurance coverage you initially want on the life of the Insured. We call
this the Face Amount. After the first Policy year, you may change the Face Amount subject to the conditions described below. You may change the Face Amount or the death benefit option once each Policy year, but
you may not change both the Face Amount and the death benefit option during the same Policy year unless done simultaneously. We will send you a Policy endorsement with the change to attach to your Policy.
Increasing the Face Amount could increase the death benefit. Decreasing the Face Amount could decrease the death benefit. The amount
of change in the death benefit will depend, among other things, upon the selected death benefit option and the degree to which the death benefit exceeds the Face Amount prior to the change. Changing the Face Amount could affect the subsequent
level of death benefit we pay and your Contract Value. An increase in the Face Amount may increase the Risk Insurance Amount, thereby increasing your cost of insurance charge. Conversely, a decrease in the Face Amount may decrease the Risk
Insurance Amount, thereby decreasing your cost of insurance charge.
We will not permit any change that would result in your Policy being disqualified as a life insurance contract under Section 7702 of
the Tax Code. However, changing the Face Amount may have other tax consequences. You should consult a qualified tax advisor before changing the Face Amount.
Increases
| • |
You may increase the Face Amount by submitting a signed, written request and providing evidence of insurability satisfactory to us. The increase will be effective on the Monthly Due Date following our approval of your request. We can
deny your request for reasons including, but not limited to, the following:
|
| ¡ |
We do not wish to increase the death benefits due to the Insured’s health, occupation, avocations, or any factor that we believe has a bearing on the Insured’s risk of death.
|
| ¡ |
We conclude the Insured has an excessive amount of insurance coverage.
|
| ¡ |
We conclude the Owner no longer has an insurable interest in the Insured.
|
| • |
You can increase the Face Amount at any time after the first Policy year and before the Insured’s Attained Age 81.
|
| • |
The minimum increase is $10,000.
|
| • |
An additional monthly underwriting and sales expense charge will be imposed each month during the 60 months following each increase in Face Amount. We assess this charge on the amount of the increase in Face Amount. See the “Charges
and Deductions – Monthly Deduction – Monthly Underwriting and Sales Expense Charge” section of this prospectus for an explanation of how this charge is calculated.
|
| • |
An additional Surrender Charge will be imposed on full Surrenders occurring within 9 years of each increase in Face Amount.
|
| • |
Increasing the Face Amount will increase your Policy’s minimum premium.
|
Decreases
| • |
You may decrease the Face Amount, but not below the minimum Face Amount shown on your Policy specifications page.
|
| • |
You must submit a signed, written request to decrease the Face Amount. Evidence of insurability is not required.
|
| • |
Any decrease will be effective on the Monthly Due Date following our approval of your request.
|
| • |
Any decrease will first be used to reduce:
|
| ¡ |
the most recent increase; then
|
| ¡ |
the next most recent increases in succession; and then
|
| ¡ |
the Face Amount on the Issue Date.
|
| • |
A reduction in Face Amount will not reduce any monthly underwriting and sales expense charges or Surrender Charges on the Policy.
|
| • |
A decrease in Face Amount may require that a portion of a Policy’s Cash Surrender Value be distributed as a partial Surrender in order to maintain federal tax compliance. Decreasing the Face Amount may also cause your Policy to become
a Modified Endowment Policy, or “MEC,” under federal tax law and receive less favorable tax treatment than other life insurance policies. See the “Federal Tax Considerations – Tax Treatment of Policy Benefits – Modified Endowment
Contracts” section.
|
| • |
Decreasing the Face Amount will reduce your Policy’s minimum premium.
|
| • |
Decreasing the Face Amount may increase the rates we charge you for the cost of insurance. Except for juvenile policies, we currently charge higher rates if the Face Amount is below $150,000 than if it is at least $150,000.
|
There are several ways of receiving proceeds under the death benefit and Surrender provisions of the Policy, other than in a lump
sum. None of these options vary with the investment performance of the Variable Account. For a discussion of the settlement options described in your Policy, see “Payment Options” of the SAI.
In addition to the standard death benefit associated with your contract, other standard and/or optional benefits may also be available to you. The following tables summarize
information about those benefits. Information about the fees associated with each benefit included in the tables may be found in the Fee Table.
|
Optional Benefits with No Additional Charge
|
||
|
Name of Benefit
|
Purpose
|
Brief Description of
Restrictions/Limitation
|
|
Accelerated Benefit Rider for Terminal Illness
|
Access up to 50% of the Death Benefit (subject to a $150,000 maximum) under the Policy if the Insured is diagnosed with a terminal illness as defined in the Policy.
|
• The Policy’s expiration/maturity date must be more than 2 years
from the request of the benefit under this rider.
• Consent from irrevocable beneficiaries and permitted assignees,
if any, needed.
• No benefit if the Policy Owner is a) required by law to use this
benefit to meet the claims of creditors, whether in bankruptcy or otherwise, or b) required by a government entity to use this benefit in order to apply for, obtain, or otherwise keep a
|
|
government benefit or entitlement, or for any other reason.
• No benefit if the Terminal Illness results from actions of the
Insured that are intended or would be expected to result in injury.
|
||
|
Automatic Increase Benefit Rider
|
Automatic annual increases in Face Amount.
|
• Increases apply on each Policy Anniversary prior to the Insured’s
Attained Age 55, or on the first two Policy Anniversaries if the Insured’s Issue Age is between 53 and 55 when the rider is issued.
• The rider ends when the Insured attains age 55.
|
|
Accidental Death Benefit Rider
|
Payment of an additional death benefit if the Insured’s death was caused by accidental bodily injury.
|
• Exclusions from Coverage – Death resulting from:
¡ Suicide whether sane
or insane;
¡ War or any act
attributable to war, declared or undeclared, whether the Insured is in the military service or not;
¡ Bodily or mental
infirmity, illness or disease of any kind;
¡ Bacterial infection
other than infection occurring as a result of accidental or external bodily injuries;
¡ Committing or
attempting to commit an assault or felony;
¡ Voluntary taking of
any poison, drug or sedative, asphyxiation from voluntary inhalation of gas;
¡ Participating in
aviation, except as a passenger.
|
|
Children’s Term Insurance Rider
|
Term insurance on the Insured’s current and future legal dependent children.
|
• Insurance coverage for each insured child continues until the
earlier: (1) the child’s 22nd birthday, or (2) the Insured reaches Attained Age 65.
|
|
Waiver of Deduction Rider
|
Waives Monthly Deductions due to the Insured’s qualifying total disability. This rider may help prevent the Policy from lapsing during a period of total disability by waiving Monthly Deductions.
|
• Exclusions from coverage – disability resulting from:
¡ Intentional
self-inflicted injury;
¡ War or any act
attributable to war, declared or undeclared, while the Insured is in the military, naval or air service of any country;
¡ Participation in
aviation, except as a passenger
|
|
Monthly Disability Benefit Rider
|
Payment of a Monthly Disability Benefit if the insured is totally Disabled.
|
• Effective August 7, 2015, the Monthly Disability Benefit Rider
was no longer available and could not be added to a Policy; Monthly Disability Benefit Riders that were in force as of August 7, 2015 were not affected
• Exclusions from Coverage – Disability resulting from:
¡ Intentional
self-inflicted injury;
¡ War or any act
attributable to war, declared or undeclared, while the Insured is in the military, naval or air service of any country; or
¡ Participation in
aviation, except as a passenger.
|
Accelerated Benefit Rider for Terminal Illness
This rider provides for a payment to the Owner if the Insured is diagnosed by certain physicians as having a medical condition that with reasonable medical
certainty will result in the Insured’s death within 12 months from the date of the physician’s statement, regardless of any medical treatment the Insured receives, or a condition that requires a human bone marrow or an entire human heart, kidney,
lung, pancreas or liver (“Major Organ”) transplant to prevent the Insured’s death within the next 12 months (“Terminal Illness”). The benefit amount is a part of the Policy’s death benefit paid while the Insured is living. If the Insured dies
before payment is made then no benefit amount is payable. The maximum portion of the death benefit available for acceleration is the lesser of: (1) $150,000; or (2) 50 percent of the death benefit available on the policy to which this rider is
attached on the date the request for the benefit amount is received in our home office. If, however, at the time of request for the benefit amounts, the death benefit equals the surrender value, and the Insured’s death is anticipated within 24
months, any amount up to 100 percent of the death benefit is available for acceleration. Non-accelerated benefits provided by riders attached to the policy are not included in the determination of the benefit amount. The benefit amount is subject
to the following adjustments and deductions:
1. We will pay the present value of the amount available for acceleration under the benefit amount. This calculation will be based on
the applicable actuarial discount appropriate to the Policy. The maximum interest rate used for the discount is the greater of: a) the current yield on 90 day US Treasury Bills; or b) the current maximum statutory adjustable policy loan interest
rate.
2. If, on the date we approve the request, there is an outstanding policy loan, the benefit amount will be reduced by the benefit
amount before any adjustments and deductions, divided by the current death benefit provided by the Policy excluding any attached riders (“Benefit Percentage”) multiplied by the outstanding loan balance. This reduction repays a portion of the
policy loan.
3. We will reduce the benefit amount by any monthly deductions that are due and unpaid at the time we approved the request for
payment of the benefit amount. Otherwise, we will reduce the benefit amount by any premiums which are due and unpaid at the time we approve the request.
4. We may reduce the benefit amount by an administrative charge not to exceed $250.
Payment of the benefit amount is subject to the following conditions:
1. The expiration or maturity date of the Policy must be more than 2 years from the date the benefit amount is requested. The Policy
must not be in force as extended term or reduced paid-up insurance.
2. The sum of benefit amounts on this and any other policies issued by us on the life of the Insured may not exceed $150,000. Only
one benefit amount is allowed per Policy. These limitations will not apply to this Policy if the benefit is requested at a time when the death benefit proceeds that would be payable under the Policy in the event of the Insured’s death are the
same as the proceeds that would be payable if the Policy was surrendered.
3. We must receive proof of eligibility that is acceptable to us and will only pay the benefit amount during the Insured’s Lifetime.
4. We must receive a consent form from all irrevocable beneficiaries and permitted assignees, if any. We also reserve the right to
require a consent form from the Insured and the Policy Owner, their spouses, other beneficiaries, and any other person if, in our sole discretion, such person’s consent is necessary to protect our interests.
5. This benefit is not meant to cause involuntary access to proceeds. Therefore, this benefit is not available if the Policy Owner
is: a) required by law to use this benefit to meet the claims of creditors, whether in bankruptcy or otherwise, or b) required by a government entity to use this benefit in order to apply for, obtain, or otherwise keep a government benefit or
entitlement, or for any other reason.
In addition to any other conditions, exclusions or limitations set forth in this rider, no benefit will be provided by this rider if the Terminal Illness
results from actions of the Insured that are intended or would be expected to result in injury.
The administrative charge for this rider varies by state. It is guaranteed not to exceed $250 or the maximum allowed by state regulation. In addition to
the administrative charge, we reduce the single sum benefit at the time of payment by an actuarial discount to compensate us for lost income due to the early payment of the death benefit. The actuarial
discount may be significant, depending on the death benefit amount being accelerated and the Moody’s Corporate Bond Yield Averages Rate. The amount of the administrative
fee and the actuarial discount will be communicated to the Policy Owner, who may accept or refuse the offer to accelerate the benefit.
Claim Provisions. Written proof of the Insured’s
Terminal Illness, in form and content acceptable to us, must be received by us at our home office before we will pay the benefit amount. This proof will include properly completed claim forms, a Physician’s Statement, and medical information
acceptable to us supporting the Diagnosis including documentation supported by clinical, radiological, histological and laboratory evidence. We may require additional medical information from the physician submitting the statement and from other
Physicians, specialists, or institutions having knowledge of the Insured’s Terminal Illness. At our expense, we reserve the right to have a physician of our choosing examine the Insured prior to paying the benefit amount, and as often as we deem
reasonably necessary to determine the validity of your claim. We reserve the right to rely on the physician we choose for claim purposes. The benefit amount will be paid to the Policy Owner. We may place benefits in an interest bearing account to
which the Policy Owner will have full access, unless the Policy Owner directs otherwise.
After the benefit amount is paid, the Policy will remain in force subject to the following adjustments:
1. This rider will terminate.
2. The death benefit or principal sum, Policy value or cash value, accumulation account, excluding any riders other than the Critical
Illness Accelerated Benefit Rider, if any, and any outstanding loans, as applicable, will be reduced by the Benefit Percentage. Amounts in any Subaccounts and the Fixed Account will be reduced by the same percentage.
3. Cost of insurance charges and other monthly charges, if any, and any required premiums will be adjusted appropriately to reflect
the current coverage.
4. Any outstanding loan will be reduced by the amount of loan repayment as described in item 2 above.
5. The benefits for any Accidental Death Benefit Rider and/or Children’s Term Insurance Rider will not be affected, provided these
riders remain in effect according to the terms and conditions of any such riders.
We will send the Policy Owner, any irrevocable beneficiary and any permitted assignee, a statement showing the effect of the payment of the benefit amount
on the Policy.
Termination of the Rider. This rider ends on the
earlier of the following:
1. When we receive the Policy Owner’s written request to cancel this rider;
2. When the policy to which this rider is attached ends for any reason;
3. When the policy is in force as reduced paid-up or extended term insurance;
4. When we pay the benefit amount provided by this rider; or
5. When the Insured dies.
Impact on Policy Terms. This rider does not increase or
decrease any Guaranteed Values of the Policy.
Example
John Doe is 49 years old, lives in Texas, and meets the medical condition requirements for the Accelerated Benefit Rider for Terminal Illness. His
increasing death benefit option policy has a face amount of $325,000, and a current account value of $123,000 on the date the request for accelerated benefit is received. He has a $50,000 loan balance on the policy, and no other policies with
Farmers.
The maximum death benefit available for acceleration is $150,000.
|
= min(150000, 50% × Death Benefit Available)
|
|
|
|
= min(150000, 50% × (325000 + 123000 – 50000))
|
|
|
|
= min(150000, 199000)
|
|
|
|
= 150000
|
The interest rate used for the actuarial discount of the benefit is 2.96%.
= max(Current Yield on 90 day US Treasury Bills, Current Max Stat Adjustable Policy Loan Interest
Rate)
= max(0.12%, 2.96%)
= 2.96%
The benefit amount will be reduced by $18,844.22 due to the policy loan balance.
|
=
|
Maximum Benefit Available
|
x
|
Outstanding Loan Balance
|
|
Current Death Benefit
|
|
=
|
150000
|
× 50000
|
|
(325000 + 123000 – 50000)
|
||
|
|
|
|
|
|
= 18844.22
|
|
For this example, there are no monthly deduction that are due and unpaid, and no premiums which are due and unpaid.
The benefit will be reduced by an additional $150, because John Doe lives in Texas.
The final benefit amount received will be $126,693.42
|
=
|
Max Benefit
|
– Reduction for Loan – Administrative Charge
|
|
(1 + Interest Rae + for Discounting)
|
|
|
|
|
|
|
=
|
150000
|
—
|
18844.22–150
|
|
|
1 + 2.96%
|
||
|
|
|
||
|
|
= 126693.42
|
||
Accidental Death Benefit Rider
This rider provides for a payment to the Beneficiary upon receipt of due proof that the Insured’s death was caused by accidental bodily injury subject to
the terms below. The Accidental Death Benefit amount varies by face amount, but is not less than $10,000.00.
Death must occur: 1) as a direct result of accidental bodily injury and independently of all other causes; and 2) within 90 days of such injury; and 3)
before the Insured reaches Attained Age 70; and 4) while the Policy and rider are in force.
We will not pay this benefit if the death results from: 1) suicide whether sane or insane; 2) war or any act attributable to war, declared or undeclared,
whether the Insured is in the military service or not; 3) bodily or mental infirmity, illness or disease of any kind; 4) bacterial infection other than infection occurring as a result of accidental or external bodily injuries; 5) committing or
attempting to commit an assault or felony; 6) the voluntary taking of any poison, drug or sedative, asphyxiation from voluntary inhalation of gas; 7) participating in aviation, except as a passenger.
Charge for this Rider. The charge for this rider will
be added to the monthly deduction for the policy. The monthly charge is the sum of: 1) the Risk Rate at the Insured’s Attained Age times the number of thousands of Accidental Death Benefit amount shown on the Policy Specifications page; plus 2)
the extra monthly charge for a special premium class for this rider, if any.
If the Policy provides for Waiver of Deduction, the monthly charge for this rider will be waived if the monthly deduction for the Policy is waived.
Guaranteed Maximum Monthly Risk Rates are shown in the following table.
|
GUARANTEED MAXIMUM RISK RATES PER $1,000 ATTAINED AGE
|
|||||||||
|
AGE
|
RISK RATE
|
AGE
|
RISK RATE
|
AGE
|
RISK RATE
|
AGE
|
RISK RATE
|
AGE
|
RISK RATE
|
|
|
|
|
|
|
|
|
|
|
|
|
1
|
0.104
|
15
|
0.104
|
29
|
0.083
|
43
|
0.104
|
57
|
0.125
|
|
|
|
|
|
|
|
|
|
|
|
|
2
|
0.104
|
16
|
0.125
|
30
|
0.083
|
44
|
0.104
|
58
|
0.125
|
|
|
|
|
|
|
|
|
|
|
|
|
3
|
0.083
|
17
|
0.146
|
31
|
0.083
|
45
|
0.104
|
59
|
0.125
|
|
|
|
|
|
|
|
|
|
|
|
|
4
|
0.083
|
18
|
0.146
|
32
|
0.083
|
46
|
0.104
|
60
|
0.125
|
|
|
|
|
|
|
|
|
|
|
|
|
5
|
0.083
|
19
|
0.146
|
33
|
0.083
|
47
|
0.104
|
61
|
0.146
|
|
|
|
|
|
|
|
|
|
|
|
|
6
|
0.083
|
20
|
0.146
|
34
|
0.083
|
48
|
0.104
|
62
|
0.146
|
|
|
|
|
|
|
|
|
|
|
|
|
7
|
0.083
|
21
|
0.146
|
35
|
0.083
|
49
|
0.104
|
63
|
0.146
|
|
|
|
|
|
|
|
|
|
|
|
|
8
|
0.083
|
22
|
0.125
|
36
|
0.083
|
50
|
0.104
|
64
|
0.167
|
|
|
|
|
|
|
|
|
|
|
|
|
9
|
0.083
|
23
|
0.125
|
37
|
0.083
|
51
|
0.104
|
65
|
0.167
|
|
|
|
|
|
|
|
|
|
|
|
|
10
|
0.083
|
24
|
0.104
|
38
|
0.083
|
52
|
0.104
|
66
|
0.167
|
|
|
|
|
|
|
|
|
|
|
|
|
11
|
0.083
|
25
|
0.104
|
39
|
0.083
|
53
|
0.104
|
67
|
0.188
|
|
|
|
|
|
|
|
|
|
|
|
|
12
|
0.083
|
26
|
0.104
|
40
|
0.083
|
54
|
0.104
|
68
|
0.188
|
|
|
|
|
|
|
|
|
|
|
|
|
13
|
0.083
|
27
|
0.104
|
41
|
0.083
|
55
|
0.125
|
69
|
0.188
|
|
|
|
|
|
|
|
|
|
|
|
|
14
|
0.083
|
28
|
0.083
|
42
|
0.083
|
56
|
0.125
|
||
Termination of Rider. This rider will end when: 1) the
Insured Attains Age 70; or 2) the policy ends; or 3) the Owner’s signed request for termination is received.
Impact on Policy Terms. This rider does not increase or
decrease the guaranteed values of the Policy.
Example.
Jane Smith is 57 when her base policy is issued. She elects an additional $100,000 of Accidental Death Benefit coverage.
Under the guaranteed maximum charges, she will pay the following schedule of charges, each month.
|
Attained Age
|
Risk Rate
|
Guar Max Monthly Charges for
$100,000 Coverage
|
|
|
|
|
|
57
|
0.125
|
$12.50
|
|
|
|
|
|
58
|
0.125
|
$12.50
|
|
|
|
|
|
59
|
0.125
|
$12.50
|
|
|
|
|
|
60
|
0.125
|
$12.50
|
|
|
|
|
|
61
|
0.146
|
$14.60
|
|
|
|
|
|
62
|
0.146
|
$14.60
|
|
|
|
|
|
63
|
0.146
|
$14.60
|
|
|
|
|
|
64
|
0.167
|
$16.70
|
|
|
|
|
|
65
|
0.167
|
$16.70
|
|
|
|
|
|
66
|
0.167
|
$16.70
|
|
|
|
|
|
67
|
0.188
|
$18.80
|
|
|
|
|
|
68
|
0.188
|
$18.80
|
|
|
|
|
|
69
|
0.188
|
$18.80
|
For example, when Jane has an attained age of 61, she will pay $14.60 each month, 175.20 for the year, for her accidental death coverage. If Jane dies
prior to attained age 70, under applicable causes, the beneficiary will receive an additional $100,000 of death benefit. If Jane lives to attained age 70 or dies of other causes not covered by the rider, the beneficiary will only receive the base
coverage death benefit.
Automatic Increase Benefit Rider
This rider provides for an automatic increase in the Face Amount of the policy on each Policy anniversary subject to the terms below. We will not require
evidence of insurability.
On each Policy anniversary prior to the Insured’s Attained Age 55, or on the first two Policy anniversaries if the Insured’s Issue Age is between 53 and 55
when the rider is issued: 1) the Face Amount will be increased by the lesser of: (a) 3% of the Face Amount on the policy’s Issue Date or (b) $10,000; and 2) the planned premium payment will be increased by 3%.
Any increase in planned premium may not be sufficient to keep your policy in force and you may be required to make additional premium payments.
The increases described above will continue automatically unless: 1) the Monthly Deductions for the policy are being waived under the terms of any riders
attached to the policy. Automatic increases will resume when the Monthly Deductions for the policy are no longer being waived under the terms of any rider; or 2) this rider ends as described in the Termination of Rider section.
There are no risk charges for this rider. However, all charges described in the policy apply to each increase in Face Amount.
Termination of Rider. This rider will end when:
1. the Insured Attains Age 55, or immediately following the second Policy anniversary after the rider is issued if the Insured’s
Issue Age is between 53 and 55 when the rider is issued;
2. the total of all increases equals the Face Amount of the policy on the policy’s Issue Date;
3. you refuse an increase in Face Amount. We must receive your signed notice of refusal 30 days before the Policy anniversary on
which the automatic increase would take place;
4. you request a decrease in Face Amount;
5. the policy ends; or
6. we receive your signed request for termination of this rider.
Example.
Joyce Ward purchased a $125,000 policy on September 9th, 2020 when she was 51. Each policy anniversary prior to attained age 55, Joyce’s policy
will increase by 3% of the face amount on the policy’s issue date, $3750. See the table below for a face amount schedule.
|
Attained Age
|
Date
|
Total Face Amount
|
|
|
|
|
|
51
|
9/20/2020
|
125,000
|
|
|
|
|
|
52
|
9/20/2021
|
128,750
|
|
|
|
|
|
53
|
9/20/2022
|
132,500
|
|
|
|
|
|
54
|
9/20/2023
|
136,250
|
|
|
|
|
|
55
|
9/20/2024
|
136,250
|
|
|
|
|
|
56
|
9/20/2025
|
136,250
|
Children’s Term Insurance Rider
This rider provides for a payment to the Beneficiary of the rider a Children’s Term Rider amount which will be shown on the Policy Specifications page upon
our receipt of due proof of the death of an Insured Child, provided 1) this rider is in force on the date of death; and 2) death occurred prior to the Insured Child’s 22nd birthday.
Each of the children described below is an Insured Child from age 15 days until the earliest of either the child’s 22nd birthday or the Insured’s Attained
Age 65.
1. A child of the Insured who is listed in the application and is not yet 20 years of age on the effective date of this rider.
2. A future child born to the Insured.
3. A child legally adopted by the Insured before the child is age 20 and before the Insured Attains Age 63.
Upon receipt of due proof of the Insured’s death while this rider is in force, we will provide you paid-up term insurance to age 22 on each Insured Child. This paid-up term
insurance may be surrendered at any time prior to the Insured Child’s 22nd birthday. The surrender value will be the net single premium necessary to continue the Insured Child’s insurance to age 22. The basis for the net single premium is: 1) an
interest rate that does not exceed the maximum rate allowed by the laws of the state in which this rider is issued; 2) Commissioners 2017 Standard Ordinary Mortality Table; 3) age last birthday; and 4) the assumption that the Insured Child’s
death occurs at the end of the policy year.
The Insured is the Beneficiary under this rider, unless you designate otherwise, subject to the terms of the Change of Beneficiary section of the policy,
while the Insured is living. At the time of the Beneficiary’s death, if you are living, you will become the Beneficiary; if you are not living, the surviving Insured Children will share and share alike.
While the policy and this rider are in force, the insurance on each Insured Child may be converted to any permanent life insurance product we make
available for conversion at that time. Conversion is subject to certain terms set forth in the rider.
Upon receipt of due proof that the death of an Insured Child, eligible to be insured under a new policy, occurred during the 31 days following the
expiration of that Insured Child’s insurance under this rider, and before any new policy had become effective, We will pay to the Beneficiary of this rider, the amount which would have been paid if such Insured Child’s term insurance had not
expired.
Risk Charge. The Risk Charge for this rider is part of
the Monthly Deduction for the policy. The Guaranteed Maximum Monthly Risk Charge for this rider is $0.87 per thousand of the Children’s Term Rider amount. If the Monthly Deduction for the policy is being waived under the provision of any rider
attached to the policy, the Risk Charge for this rider will also be waived.
Termination of Rider. This rider will end when:
1. the Insured dies or Attains Age 65;
2. the youngest Insured Child covered by this rider reaches age 22;
3. all Insured Children have exercised their conversion privilege;
4. the policy ends; or
5. we receive your signed request for termination of this rider.
Example.
Aaron Johnson is 40 years old when he purchases his policy with an additional $5000 of coverage under the Children’s Term Insurance Rider for his son,
Mark, who is 5 years old. When Aaron is 45 years old, he has a second child, Mary, who is eligible for an additional $5000 of coverage under the Children’s Term Insurance Rider for her when she is 15 days old. The following table outlines the
guaranteed maximum monthly risk charge Aaron will pay for $5000 of coverage on each child. Mark will be covered from age 5 until age 22, and Mary will be covered from 15 days old until Aaron attains age 65.
|
Insured’s
Attained Age
|
Child 1’s
Attained Age
|
Child 2’s
Attained Age
|
Guar Max Monthly
Risk Charge
|
|
|
|
|
|
|
40
|
5
|
na
|
$4.35
|
|
|
|
|
|
|
41
|
6
|
na
|
$4.35
|
|
|
|
|
|
 |
|
na
|
|
|
|
|
|
|
|
45
|
10
|
0
|
$4.35
|
|
|
|
|
|
|
46
|
11
|
1
|
$4.35
|
|
|
|
|
|
|
|
|
|
|
|
|
|
|
|
|
56
|
21
|
11
|
$4.35
|
|
|
|
|
|
|
57
|
22
|
12
|
$4.35
|
|
|
|
|
|
|
|
|
|
 |
|
|
|
|
|
|
64
|
29
|
19
|
$4.35
|
|
|
|
|
|
|
65
|
30
|
20
|
$—
|
Waiver of Deduction Rider
This rider provides for the waiver of the Monthly Deductions due during the Insured’s continued disability, as defined below.
While the Policy and this rider are in force, Disability means that, as a result of bodily injury or disease starting after the Issue Date of this rider
and before the Insured reaches Attained Age 60, the Insured is totally disabled so that the Insured: 1) is, and for a continuous period of at least 180 days has been, prevented from working in any occupation for which the Insured is reasonably
qualified by education, training or experience; or 2) has suffered total and irrevocable loss of the sight of both eyes, or the loss of both hands, or both feet, or one hand and one foot.
We will not waive Monthly Deductions until the claim for benefits under this rider is approved. If the claim is approved, we will credit the Contract Value
with all Monthly Deductions that were deducted from the Contract Value since the start of the Disability. However, we will not waive Monthly Deductions retroactively for any Monthly Due Date that was more than 12 months before receipt of Written
Notice of Disability. During the period in which we are waiving Monthly Deductions under this rider, we will not accept or approve any request for: 1) an increase in Face Amount; or 2) a change in death benefit option.
We will not waive Monthly Deductions if Disability results from: 1) intentional self-inflicted injury; 2) war or any act attributable to war, declared or
undeclared, while the Insured is in the military, naval or air service of any country; or 3) participation in aviation, except as a passenger.
Termination of Disability. You must give proof of the
Insured’s continuing Disability upon request in certain circumstances. We reserve the right to require that the Insured be examined by a physician acceptable to us. If you do not furnish this proof within 91 days of our request, benefits under
this rider will end and we will notify you of the Monthly Deduction then due.
Risk Charge. The Risk Charge for this rider is part of
the Monthly Deduction for the policy. The Risk Charge is: 1) the Monthly Waiver of Deduction Risk Rate, times 2) the Monthly Waiver of Deduction Table Rating Factor, if any, as shown on the Policy Specifications page; with the result then
multiplied by 3) the Monthly Deduction for the policy, excluding the Risk Charge for this rider. The Monthly Waiver of Deduction Risk Rate is based on the Insured’s Attained Age. The Guaranteed Maximum Monthly Waiver of Deduction Risk Rates are
shown in the following table. We may use Monthly Waiver of Deduction Risk Rates that are less than those shown in the table, but not greater.
|
GUARANTEED MAXIMUM MONTHLY
WAIVER OF DEDUCTION RISK RATES |
|||
|
Attained Age
|
Rate
|
Attained Age
|
Rate
|
|
|
|
|
|
|
30 and below
|
.06
|
51-55
|
.15
|
|
|
|
|
|
|
31-40
|
.07
|
56-59
|
.20
|
|
|
|
|
|
|
41-45
|
.08
|
60 and above
|
.00
|
|
|
|
|
|
|
46-50
|
.10
|
|
|
Termination of Rider. This rider will end when: 1) the
Insured Attains Age 60 and is not Disabled; 2) the Insured’s Disability terminates, if the Insured is Disabled upon reaching Attained Age 60; 3) the policy ends; or 4) we receive your signed request for termination of this rider.
Impact on Policy Terms. Any proceeds paid under the
policy will not be reduced by any Monthly Deductions waived under this rider.
Monthly Disability Benefit Rider
This rider provides for the addition of a monthly benefit to the Fixed Account Value of the policy on each Monthly Due Date during the Insured’s continued
disability as defined below, but not beyond the Insured’s Attained Age 65. The monthly benefit varies by the characteristics of the Insured, but is not less than $48.25 per month.
Disability means that, as a result of bodily injury or disease starting after the Issue Date of this rider and before the Insured reaches Attained Age 60,
the Insured is totally disabled so that the Insured: 1) is, and for a continuous period of at least 180 days has been, prevented from working in any occupation for which the Insured is reasonably qualified by education, training or experience; or
2) has suffered total and irrevocable loss of the sight of both eyes, or the loss of both hands, or both feet, or one hand and one foot. We must receive Written Notice of Disability at our
Home Office during the Insured’s continuing disability and while the Insured is alive, unless it can be shown that notice was given as soon as reasonably possible.
We will not pay any monthly benefit until the claim for benefits under this rider is approved. If the claim is approved, we will add the monthly benefit to
the Fixed Account Value beginning on the first Monthly Due Date after the start of the Insured’s disability. However, we will not add monthly benefits retroactively for any Monthly Due Date that was more than 12 months before receipt of Written
Notice of Disability.
We will not pay Monthly Benefits if the Disability results from: 1) intentional self-inflicted injury; 2) war or any act attributable to war, declared or
undeclared, while the Insured is in the military, naval or air service of any country; or 3) participation in aviation, except as a passenger. You must give proof of the Insured’s continuing disability upon request in certain circumstances. We
reserve the right to require that the Insured be examined by a physician acceptable to us. If you do not furnish this proof within 91 days of our request, the benefit will end.
Risk Charge. The Risk Charge for the rider is part of the Monthly Deduction for the policy. The
Risk Charge is 1) the Monthly Risk Rate for Monthly Disability Benefit; times 2) the Monthly Disability Benefit Rider Table Rating Factor, if any, as shown on the Policy Specifications page; with the result then multiplied by 3) the Monthly
Disability Benefit Rider amount shown on the Policy Specifications page. The Monthly Risk Rate for Monthly Disability Benefit is based on the Insured’s Attained Age. The Guaranteed Maximum Risk Rates for Monthly Disability Benefit are shown in
the following table. We may use Monthly Risk Rates for Monthly Disability Benefit that are less than those shown in the table, but not greater.
|
GUARANTEED MAXIMUM MONTHLY RISK RATES
FOR MONTHLY DISABILITY BENEFIT |
|||
|
Attained Age
|
Rate
|
Attained Age
|
Rate
|
|
|
|
|
|
|
21-30
|
.06
|
46-50
|
.10
|
|
|
|
|
|
|
31-40
|
.07
|
51-55
|
.15
|
|
|
|
|
|
|
41-45
|
.08
|
56 and above
|
.20
|
Termination of Rider. This rider will end when: 1) the Insured Attains Age 60 and is not
Disabled; 2) You are receiving benefits under this rider and the Insured dies or Attains Age 65 or the Insured’s Disability Terminates; 3) the policy ends; or 4) We receive Your signed request for termination of this rider.
Impact on Policy Terms. Any proceeds paid under the policy will not be reduced by any Monthly
Benefits paid by this rider. This rider does not increase or decrease any guaranteed values of the Policy.
You may make a written request to fully Surrender your Policy for its Cash Surrender Value, as calculated at the end of the Business
Day on which we receive your signed request, unless you specify a later Business Day in your request. Please send your written request to the Service Center. The Cash Surrender Value is the amount we pay when you fully Surrender your Policy while
it is in force.
The Cash Surrender Value on any Business Day equals:
| • |
the Contract Value as of such date; minus
|
| • |
any Surrender Charge as of such date; minus
|
| • |
any Monthly Deductions due and unpaid as of such date; minus
|
| • |
any Outstanding Loan Amount (including interest you owe) as of such date.
|
|
Full Surrender Conditions:
|
• You must make your Surrender request in writing.
|
|
• Your written Surrender request must contain your signature.
|
|
|
• Send your written request to the Service Center.
|
|
|
• The Insured must be alive and the Policy must be in force when
you make your written request. A Surrender is effective as of the end of the Business Day on which we receive your written request and your Policy.
|
|
|
• You will incur a Surrender Charge if you Surrender the Policy
during the first nine Policy years or within nine years after any increase in the Face Amount. See the “Charges and Deductions” section.
|
|
|
• Once you Surrender your Policy, all coverage and other benefits
under it cease and cannot be reinstated.
|
|
|
• We will pay you the Cash Surrender Value in a lump sum usually
within seven calendar days unless you request other arrangements.
|
We will price complete Surrender requests that we receive from you at our Service Center before the NYSE closes for regular trading
(usually, 4:00 p.m. Eastern Time, 1:00 p.m. Pacific Time) using the Accumulation Unit value determined at the close of that regular trading session of the NYSE. If we receive your complete Surrender request after the close of regular trading on
the NYSE, we will price your Surrender request using the Accumulation Unit value determined at the close of the next regular trading session of the NYSE, unless you specify a later Business Day in your request.
Surrendering the Policy may have adverse tax consequences, including a penalty tax. See the “Federal Tax Considerations”
section.
After the first Policy year, you may request a partial Surrender of a portion of your Cash Surrender Value, subject to certain
conditions. Partial Surrenders may have tax consequences. See the “Federal Tax Considerations” section.
|
Partial Surrender Conditions:
|
• You must make your partial Surrender request in writing.
|
|
• Your written partial Surrender request must contain your
signature.
|
|
|
• Send your written request to the Service Center.
|
|
|
• You may make only one partial Surrender each calendar quarter.
|
|
|
• You partial Surrender request must be at least $500.
|
|
|
• You cannot withdraw more than 75% of the Cash Surrender Value
without Surrendering the Policy.
|
|
|
• You can specify the Subaccount(s) and Fixed Account from which to
make the partial Surrender, otherwise we will deduct the amount from the Subaccounts and the Fixed Account on a pro-rata basis (that is, according to the percentage of Contract Value contained in each Subaccount and the Fixed Account). No
portion of the loan account may be withdrawn.
|
|
|
• We will price complete partial Surrender requests that we receive
from you at our Service Center before the NYSE closes for regular trading (usually, 4:00 p.m. Eastern Time, 1:00 p.m. Pacific Time) using the Accumulation Unit value determined at the close of that regular trading session. If we receive
your complete partial Surrender request after the close of regular trading on the NYSE, we will price your partial Surrender request using the Accumulation Unit value determined at the close of the next regular trading session of the
NYSE.
|
|
|
• We will reduce your Contract Value by the amount of the partial
Surrender you requested plus any processing fee.
|
|
|
• We generally will pay a partial Surrender request within seven
calendar days after the Business Day when we receive the request.
|
Processing Fee for Partial Surrenders. Whenever you take a partial
Surrender, we deduct a processing fee according to your instructions (or on a pro rata basis if you provide no instructions) from the Subaccounts and the Fixed Account equal to the lesser of $25 or 2% of the amount withdrawn.
If the level death benefit (Option B) is in effect at the time of a partial Surrender, we will reduce the Face Amount by the amount of the partial
Surrender (but not by the processing fee). See the “Death Benefit – Changing the Face Amount – Decreases” section. We will not allow any partial Surrender to reduce the Face Amount below the minimum Face Amount set forth in your Policy
specifications page.
Income taxes, tax penalties and certain restrictions may apply to any full Surrender or partial Surrenders you make.
We usually pay the amounts of any full Surrender, partial Surrender, Death Benefit Amount Payable, loans, or settlement options
within seven calendar days after we receive all applicable Written Notices and/or due proofs of death. However, we can postpone such payments if:
| • |
the NYSE is closed, other than customary weekend and holiday closings, or trading on the NYSE is restricted as determined by the SEC; or
|
| • |
the SEC permits, by an order, the postponement for the protection of Policy Owners; or
|
| • |
the SEC determines that an emergency exists that would make the disposal of securities held in the Variable Account or the determination of their value not reasonably practicable.
|
If you have submitted a recent check or draft, we have the right to defer payment of a full Surrender, a partial Surrender, Death
Benefit Amount Payable, or payments under a settlement option until such check or draft has been honored.
If mandated under applicable law, we may be required to reject a premium payment and/or otherwise block access to a Policy Owner’s
account and thereby refuse to pay any request for transfers, partial Surrenders, a full Surrender, loans, or death benefits. We may also be required to provide additional information about you, the Insured, your Beneficiary, or your account to
government regulators. Once blocked, monies would be held in that account until instructions are received from the appropriate regulator.
We have the right to defer payment of any full Surrender, partial Surrender, Death Benefit Amount Payable, loans, or settlement
options from the Fixed Account for up to six months from the date we receive your written request.
You may make transfers from the Subaccounts or from the Fixed Account, subject to the conditions stated below. You may not make any
transfers from the loan account. We determine the amount you have available for transfers at the end of the Business Day when we receive your transfer request. We may modify or revoke the
transfer privilege at any time. The following features apply to transfers under the Policy:
| • |
You may make an unlimited number of transfers in a Policy year from and among the Subaccounts (subject to the “Policy and Procedures Regarding Disruptive Trading and Market Timing” section below).
|
| • |
You may only make one transfer each Policy year from the Fixed Account (unless you choose dollar cost averaging).
|
| • |
You may request transfers in writing (in a form we accept), or by telephone. You should send written requests to the Service Center.
|
| • |
For Subaccount transfers, you must transfer at least the lesser of $250, or the total value in the Subaccount.
|
| • |
For Fixed Account transfers, you may not transfer more than 25% of the value in the Fixed Account, unless the balance after the transfer is less than $250, in which case the entire amount will be transferred.
|
| • |
We charge $25 for the 13th and each additional transfer during a Policy year, and unless you instruct us otherwise we deduct the transfer charge from the Subaccounts and Fixed Account on a pro-rata basis.
|
Any unused free transfers do not carry over to the next Policy year. Transfers we effect on the Reallocation Date, and transfers
resulting from loans, dollar cost averaging, and death benefit processing are not treated as transfers for the purpose of assessing the transfer charge.
| • |
We consider each written or telephone request to be a single transfer, regardless of the number of Subaccounts (or Fixed Account) involved.
|
| • |
We will price complete transfer requests that we receive at our Service Center before the NYSE closes for regular trading (usually, 4:00 p.m. Eastern Time, 1:00 p.m. Pacific Time) using the Accumulation Unit value determined at the
close of that regular trading session of the NYSE. If we receive your complete transfer request after the close of regular trading on the NYSE, we will price the transfer request using the Accumulation Unit value determined at the close
of the next regular trading session of the NYSE.
|
We reserve the right to modify, restrict, suspend or eliminate transfer privileges at any time, for any class of Policies, for any
reason.
If you authorize a third party to transact transfers on your behalf, we will honor their transfer instructions, so long as they
comply with our administrative systems, rules and procedures, which we may modify or rescind at any time. We take no responsibility for any third party asset allocation program. Please note that any fees
and charges assessed for third party asset allocation services are separate and distinct from the Policy fees and charges set forth in this prospectus. We neither recommend nor discourage the use of asset allocation services.
Your Policy, as applied for and issued, will automatically receive telephone transfer privileges unless you provide other
instructions. To make a telephone transfer, you must call the Service Center toll-free at 1-877-376-8008, open between 8:00 a.m. and 6:00 p.m. Eastern Time. Any telephone transfer requests directed to another number may not be considered received
at our Service Center.
Please note the following regarding telephone transfers:
| • |
We are not liable for any loss, damage, cost or expense from complying with telephone instructions we reasonably believe to be authentic. You bear the risk of any such loss.
|
| • |
We will employ reasonable procedures to confirm that telephone instructions are genuine.
|
| • |
Such procedures may include requiring forms of personal identification prior to acting upon telephone instructions, providing written confirmation of transactions to you, and/or tape recording telephone instructions received from you.
|
| • |
If we do not employ reasonable confirmation procedures, we may be liable for losses due to unauthorized or fraudulent instructions.
|
We will price any complete telephone transfer request that we receive at the Service Center before the NYSE closes for regular
trading (usually, 4:00 p.m. Eastern Time, 1:00 p.m. Pacific Time) using the Accumulation Unit value determined at the end of that regular trading session of the NYSE. We cannot guarantee that telephone transfer transactions will always be
available. For example, our Service Center may be closed during severe weather emergencies or there may be interruptions in telephone service or problems with computer systems that are beyond our control. Outages or slowdowns may prevent or delay
our receipt of your request. If the volume of calls is unusually high, we might not have someone immediately available to receive your order. Although we have taken precautions to help our systems handle heavy use, we cannot promise complete
reliability under all circumstances.
The corresponding Portfolio of any Subaccount determines its net asset value per each share once daily, as of the close of the
regular business session of the NYSE (usually, 4:00 p.m. Eastern Time, 1:00 p.m. Pacific Time), which coincides with the end of each Business Day. Therefore, we will price any transfer request we receive after the close of the regular business
session of the NYSE, on any day the NYSE is open for regular trading, using the net asset value for each share of the applicable Portfolio determined as of the close of the next regular business session of the NYSE.
We reserve the right to modify, restrict, suspend or eliminate the transfer privileges (including the telephone transfer facility) at
any time, for any class of Policies, for any reason.
Statement of Policy. This Policy
is not designed for use by organizations or individuals engaged in market timing or for use by investors who make frequent transfers, programmed transfers, transfers into and then out of a Subaccount in a short period of time, or transfers of
large amounts at one time (“Disruptive Trading”).
Market timing and other kinds of Disruptive Trading can increase your investment risks and have harmful effects for you, for other Policy Owners, for
the underlying Portfolios, and for other persons who have material rights under the Policy, such as Insureds and beneficiaries. These risks and harmful effects include:
| • |
dilution of the interests of long-term investors in a Subaccount if market timers manage to transfer into an underlying Portfolio at prices that are below the true value or to transfer out of the underlying Portfolio at prices that are
above the true value of the underlying Portfolio’s investments (some market timers attempt to do this through methods known as “time-zone arbitrage” and “liquidity arbitrage”);
|
| • |
reduced investment performance due to adverse effects on Portfolio management by:
|
| ¡ |
impeding a Portfolio manager’s ability to sustain an investment objective;
|
| ¡ |
causing the underlying Portfolio to maintain a higher level of cash than would otherwise be the case; or
|
| ¡ |
causing an underlying Portfolio to liquidate investments prematurely (or otherwise at an inopportune time) in order to pay partial Surrenders or transfers out of the underlying Portfolio; and
|
| • |
increased costs to you in the form of increased brokerage and administrative expenses. These costs are borne by all Policy Owners invested in those Subaccounts, not just those making the
transfers.
|
Policy Against Disruptive Trading. We have adopted internal policies and
procedures intended to detect and deter market timing and other forms of Disruptive Trading. We do not make special arrangements or grant exceptions or waivers to accommodate any persons or class of persons with regard to these internal policies
and procedures. Do not invest with us if you intend to conduct market timing or potentially Disruptive Trading.
For these purposes, we do not include transfers made pursuant to Dollar Cost Averaging or Automatic Asset Rebalancing.
Detection. We monitor the transfer activities of Owners and coordinate
with the underlying fund companies in order to detect market timing and other forms of Disruptive Trading activity. However, despite our monitoring we may not be able to detect or halt all Disruptive Trading activity. Our ability to detect
Disruptive Trading may be limited by operational or technological systems, as well as by our ability to predict strategies employed by market timers to avoid detection. As a result, despite our efforts, there is no assurance that we will be able
to identify and curtail all Disruptive Trading by such Policy Owners or intermediaries acting on their behalf.
In addition, because other insurance companies (and retirement plans) with different market timing policies and procedures may invest
in the underlying Portfolios, we cannot guarantee that all harmful trading will be detected or that an underlying Portfolio will not suffer harm from Disruptive Trading in the Subaccounts of variable products issued by these other insurance
companies (or retirement plans) that invest in the underlying Portfolios.
As a result, to the extent we are not able to detect Disruptive Trading activity, or other insurance companies (or retirement plans)
fail to detect such activity, it is possible that a market timer may be able to engage in Disruptive Trading transactions that may interfere with underlying Portfolio management and cause you to experience detrimental effects such as increased
costs, lower performance and a dilution of your interest in a underlying Portfolio.
Deterrence. We impose limits on
transfer activity within the Policy in order to deter Disruptive Trading.
We will accept the following transfers only if the order is sent to us with an original signature
or other standard identity authentication :
| • |
transfers in excess of $1,000,000 per Policy, per day
|
We will conduct ongoing monitoring for possible suspicious transfer activity. This includes identifying two or more round trip
transactions to the same Subaccount within a 90-day period and more than four round trip transactions to the same Subaccount within a 12 month period. We will also coordinate and cooperate with the underlying fund companies’ efforts to deter,
detect, and impose transaction restrictions as necessary to address disruptive trading activity.
If we identify suspicious transfer activity, we will advise you in writing that we are monitoring your transfer activity and that we
will impose restrictions if we identify a pattern of Disruptive Trading activity. If we identify such a pattern as a result of continued monitoring, we will notify you in writing that all future transfers must be submitted through written
request. This means that we may accept only written transfer requests with an original signature transmitted to us only by first class U.S. mail. We may also restrict the transfer privileges of others acting on your behalf, including your
registered representative or an asset allocation or investment advisory service.
To further deter any market timing and Disruptive Trading activities, we may at any time and without prior notice:
| • |
terminate all telephone, website, email or fax transfer privileges;
|
| • |
limit the total number of transfers;
|
| • |
place further limits on the dollar amount that may be transferred;
|
| • |
require a minimum period of time between transfers; or
|
| • |
refuse transfer requests from intermediaries acting on behalf of you.
|
To the extent we are unable to effectively impose these restrictions to discourage market timing and other forms of Disruptive
Trading, some Policy Owners may be able to market time through the Policy, while others would bear the harm associated with the timing.
We reserve the right to reject any premium payment or transfer request from any person without prior notice, if, in our judgment,
(1) the payment or transfer, or series of transfers, would have a negative impact on an underlying Portfolio’s operations, or (2) if an underlying Portfolio would reject or has rejected our purchase order, or has instructed us not to allow that
purchase or transfer, or (3) you have a history of large or frequent transfers. We may impose other restrictions on transfers, or even prohibit transfers for any Policy Owner who, in our view, has abused, or appears likely to abuse, the transfer
privilege. We also reserve the right to reverse a potentially harmful transfer if an underlying Portfolio refuses or reverses our order; in such instances some Policy Owners may be treated differently than others. For all of these purposes, we
may aggregate two or more variable insurance products that we believe are connected.
In addition to our internal policies and procedures, we will administer your Policy to comply with any applicable state, federal, and other regulatory
requirements concerning transfers. We reserve the right to implement, administer, and charge you for any fee or restriction, including redemption fees, imposed by any underlying Portfolio. To the extent permitted by law, we also reserve the right
to defer the transfer privilege at any time that we are unable to purchase or redeem shares of any of the underlying Portfolios.
Under our current policies and procedures, we do not:
| • |
impose redemption fees on transfers;
|
| • |
expressly limit the number, size or frequency of transfers in a given period (except for certain Subaccounts listed above where transfers that exceed a certain size are prohibited); or
|
| • |
allow a certain number of transfers in a given period.
|
Redemption fees, other transfer limits, and other procedures or restrictions may be more or less successful than ours in deterring
market timing or other forms of Disruptive Trading and in preventing or limiting harm from such trading.
We may revise our policies and procedures in our sole discretion at any time and without prior notice, as we deem necessary or
appropriate (1) to better detect and deter market timing or other Disruptive Trading if we discover that our current procedures do not adequately curtail such activity, (2) to comply with state or federal regulatory requirements, or (3) to impose
additional or alternative restrictions on Owners engaging in frequent transfer activity among the underlying Portfolios under the Policy. The actions we take will be based on policies and procedures that we apply uniformly to all Policy Owners.
Underlying Portfolio Frequent Trading Policies. The underlying Portfolios may have adopted their own policies and procedures with respect to frequent purchases and redemptions of their respective shares. Such policies and procedures may include a redemption fee of up to 2% on
Subaccount assets that are redeemed out of a Portfolio in connection with a partial Surrender or Transfer. The prospectuses for the underlying Portfolios describe any such policies and procedures. The frequent trading policies and procedures of
one underlying Portfolio may be different, and more or less restrictive, than the frequent trading policies and procedures of another underlying Portfolio and the policies and procedures we have adopted for the Policy to discourage market timing
and other programmed, large, frequent, or short-term transfers.
You should be aware that, as required by SEC regulation, we have entered into a written agreement with each
underlying fund or principal underwriter that obligates us to provide the fund, upon written request, with information about you and your trading activities in the fund’s Portfolios. In addition, we are
obligated to execute instructions from the Funds that may require us to restrict or prohibit your investment in a specific Portfolio if the fund
identifies you as violating the frequent trading policies that the fund has established for that Portfolio.
If we receive a premium payment from you with instructions to allocate it into a fund that has directed us to restrict or prohibit
your trades into the fund, then we will request new allocation instructions from you. If you request a transfer into a fund that has directed us to restrict or prohibit your trades, then we will not effect the transfer.
Omnibus Order. Policy Owners and
other persons with material rights under the Policy also should be aware that the purchase and redemption orders received by the underlying Portfolios generally are “omnibus” orders from intermediaries such as retirement plans and separate
accounts funding variable insurance products. The omnibus orders reflect the aggregation and netting of multiple orders from individual retirement plan participants and individual Owners of variable insurance products. The omnibus nature of these
orders may limit the underlying Portfolios’ ability to apply their respective frequent trading policies and procedures. We cannot guarantee that the underlying Portfolios will not be harmed by transfer activity relating to the retirement plans or
other insurance companies that may invest in the underlying Portfolios. These other insurance companies are responsible for their own policies and procedures regarding frequent transfer activity. If their policies and procedures fail to
successfully discourage harmful transfer activity, it will affect other Owners of underlying Portfolio shares, as well as the Owners of all of the variable annuity or life insurance policies, including ours, whose variable investment options
correspond to the affected underlying Portfolios. In addition, if an underlying Portfolio believes that an omnibus order we submit may reflect one or more transfer requests from Owners engaged in market timing and other programmed, large,
frequent, or short- term transfers, the underlying Portfolio may reject the entire omnibus order and thereby delay or prevent us from implementing your request.
Under the Automatic Asset Rebalancing (“AAR”) program, we will automatically transfer amounts among the Subaccounts each quarter to
reflect your most recent instructions for allocating Premiums. The Automatic Asset Rebalancing program may not be used to transfer amounts into and out of the Fixed Account. No transfer fees apply, and transfers under the AAR program are not
included when we determine the number of free transfers permitted each year. For more information, see the SAI. The AAR program is not available if you elect to enroll in the Dollar Cost Averaging program discussed below.
Under the Dollar Cost Averaging Program, you may authorize us to transfer a fixed dollar amount at monthly intervals from the Fixed
Account to one or more Subaccounts. You may designate up to eight Subaccounts to receive the transfers.
You may enroll in the Dollar Cost Averaging program at any time by submitting a request to the Service Center. We make transfers on
the same day of every month on your Monthly Due Date. Transfers under this program are not included when we determine the number of free transfers permitted each year. We must receive your request at least five Business Days before the transfer
date for your transfers to begin on that date. When you enroll in the dollar cost averaging program, your total Fixed Account Value must be at least equal to the amount you designate to be transferred on each transfer date. Transfers from the
Fixed Account under this program must be at least $100. If on any transfer date the amount remaining in the Fixed Account is less than the amount designated to be transferred, the entire balance will be transferred out of the Fixed Account and
applied pro-rata to the selected Subaccounts, and the dollar cost averaging request will expire. The Dollar Cost Averaging program is not available if you elect to enroll in the Automatic Asset Rebalancing program discussed above.
While the Policy is in force, you may borrow money from us using the Policy as the only security for the loan. A loan that is taken
from, or secured by, a Policy may have tax consequences. See the “Federal Tax Considerations” section.
Risk of Policy Lapse. There are risks involved in taking a Policy loan,
one of which is an increased potential for the Policy to Lapse. A Policy loan, whether or not repaid, affects the Policy, the Contract Value and the death benefit. We deduct any Outstanding Loan Amount (including any interest you owe on the
loans) from the proceeds payable upon the death of the Insured and from the Cash Surrender Value. Repaying the loan causes the Death Benefit Amount Payable and Cash Surrender Value to increase by the amount of the repayment. We will notify you
(or any assignee of record) if the sum of your Outstanding Loan Amount (including any interest you owe on the loans) is more than the Contract Value. If you do not submit a sufficient payment during the 61-day grace period, your Policy will Lapse
without value, insurance coverage will no longer be in effect, and you will receive no benefits.
Risk of Investment Performance. As long as a loan is outstanding, we
hold an amount equal to the Outstanding Loan Amount in the loan account. The amount in the loan account is not affected by the Variable Account’s investment performance and may not be credited with the same interest rates currently accruing on
the
Fixed Account. Amounts transferred from the Variable Account to the loan account will affect the Contract Value because we credit such amounts with an interest rate we
declare rather than a rate of return reflecting the investment results of the Variable Account.
Tax Risks. The federal tax consequences of a Policy loan are uncertain.
A Policy loan may have adverse tax consequences. You should review the “Federal Tax Considerations” section of this prospectus carefully, especially if you are purchasing this Policy with the intention of taking
Policy loans or a partial Surrender at any time in the future, and/or you intend to keep the Policy in force after the Insured reaches age 100. You should consult a qualified tax advisor before taking out a Policy loan.
The following flow chart shows the process used to determine if the Policy will enter the 61-day grace period:
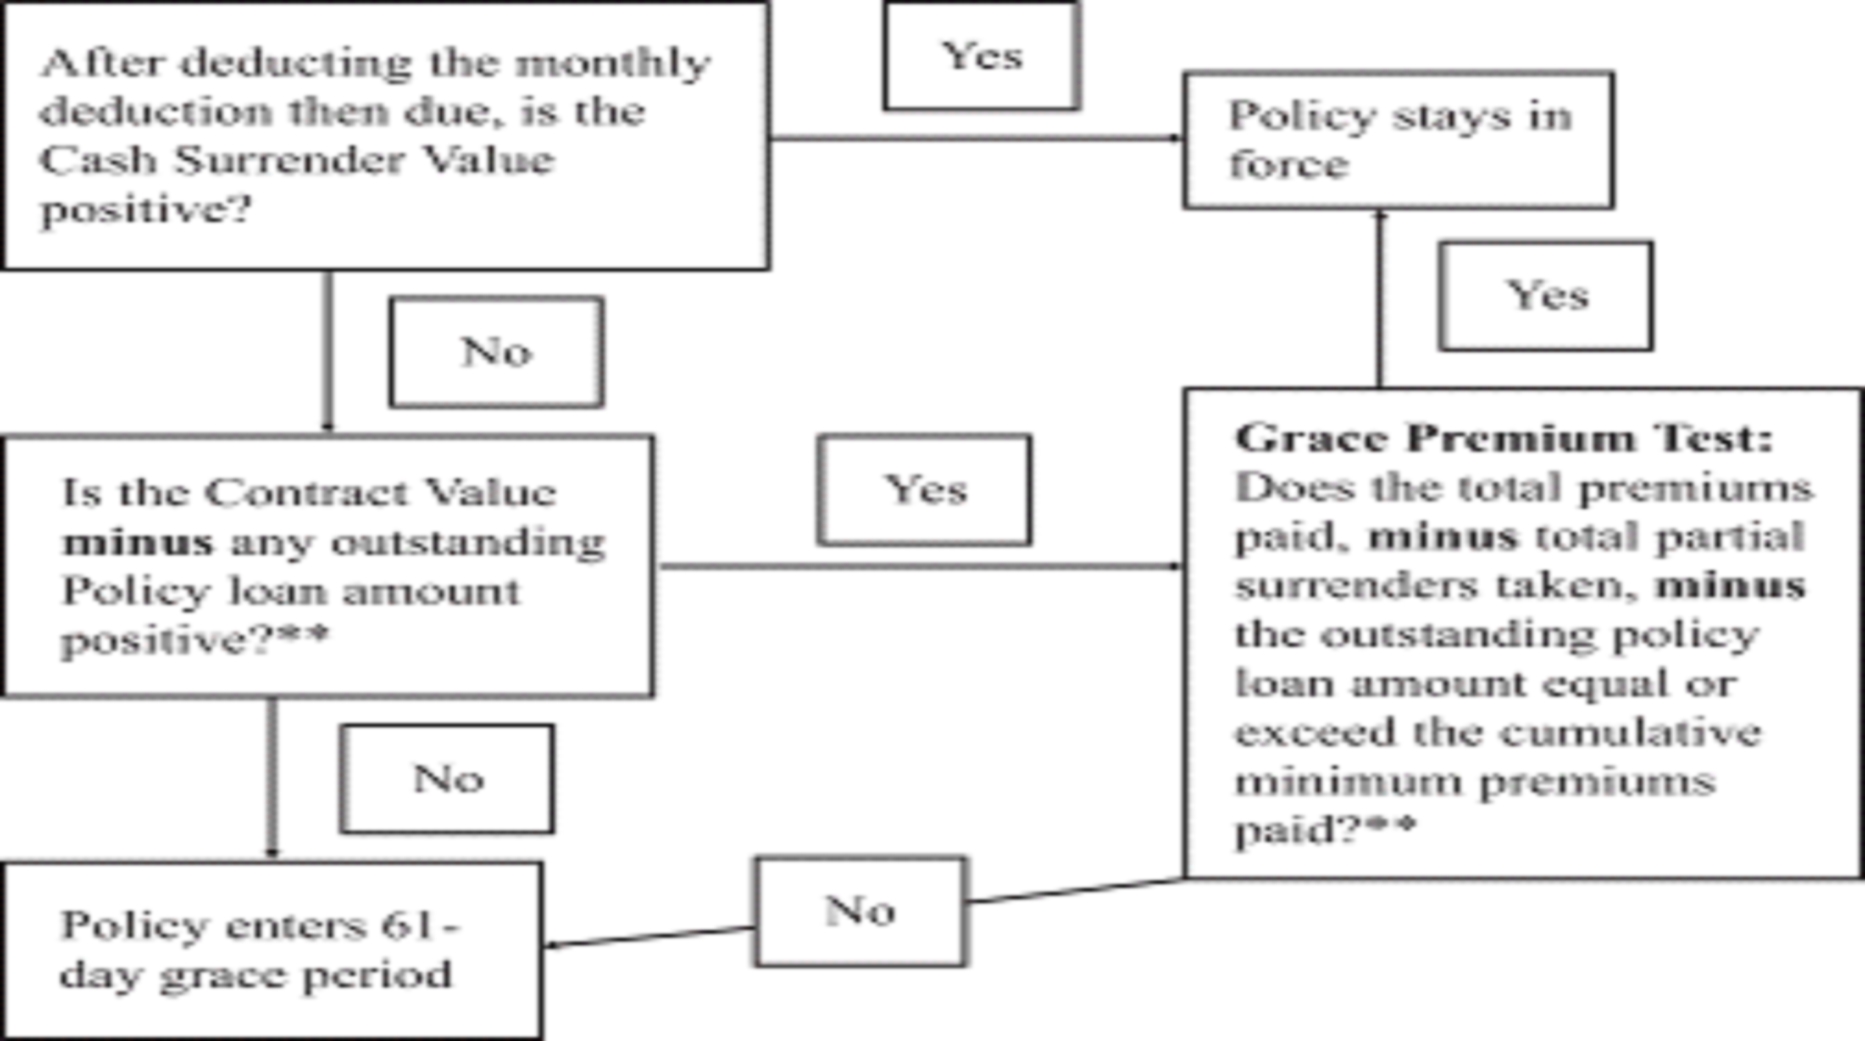
** These two conditions make up the Grace Exemption Test. If the answer to both questions
is “Yes,” then the Grace Exemption Test is passed.
If your Policy enters into a grace period, we will mail a notice to your last known address and to any assignee of record. We will
mail the notice at least 61 days before the end of the grace period. The notice will specify the minimum payment that you must pay to prevent your Policy from lapsing and the final date by which we must receive the payment at the Service Center
in order to keep the Policy from lapsing. If we do not receive the specified minimum payment by the end of the grace period, all coverage under the Policy will terminate.
It is possible that we may require you to pay an additional premium (over and above the premium specified in the Lapse notice) if the
investment performance of your Policy is unfavorable during the grace period.
In order to prevent your Policy from lapsing, the premium payment you pay must be large enough to cause either one of the following
conditions:
Condition One: After deducting the Monthly Deduction due on the first two Monthly Due Dates
following the first day of the grace period, the Cash Surrender Value would be positive.
Condition Two: The Policy passes the Grace Premium Test after two more minimum Premiums are
added to the cumulative minimum Premiums following the first date of the grace period.
We will consider reinstating a Lapsed Policy within three years, unless otherwise required by state law, after the Policy enters a
grace period that ends with a Lapse (and prior to the Maturity Date).
If your Policy has Lapsed, you must do the following to reinstate the Policy:
| 1. |
Provide evidence of insurability sufficient to demonstrate that there has been no material change in the health of the Insured since the Issue Date and that there has been no material change in the health of any natural persons covered
under any riders attached to this policy since that rider’s Issue Date;
|
| 2. |
Pay sufficient premium payments such that after deducting all due and unpaid Monthly Deductions from the first day of the Grace Period to and including the effective date of Reinstatement: a) You must pay sufficient premium payments
such that after deducting all due and unpaid Monthly Deductions from the first day of the Grace Period to and including the effective date of Reinstatement; and (b) You must pay sufficient premium payments so the policy would pass the
Grace Exemption Test (described in the diagram above) is passed as of the effective date of the reinstatement of the Policy, plus pay an additional three minimum premium payments.
|
We will not reinstate any indebtedness unless required by state law.
We will not consider your request for reinstatement unless you have made sufficient premium payments and provided the requested
evidence of insurability. Until we have received all required Premiums and evidence of insurability, we will hold your Premiums in the Reinstatement Suspense Account without interest. If your reinstatement Premiums have been in our Reinstatement
Suspense Account for more than 60 days, we will send a notice to your address of record reminding you that your Policy will remain Lapsed until you send in the required items and we approve your application. After we have held your reinstatement
Premiums in our Reinstatement Suspense Account for 90 days, we will return your reinstatement Premiums to you and you will be required to re-apply for reinstatement of your Policy.
We may decline a request for reinstatement. We will not reinstate a Policy that has been surrendered for the Cash Surrender Value or
that had an Outstanding Loan Amount on the date of Lapse.
The following summary provides a general description of the federal income tax considerations associated with a Policy and does not
purport to be complete or to cover all situations. This discussion is not intended as tax advice. Please consult counsel or other qualified tax
advisors for more complete information. We base this discussion on our understanding of the present federal income tax laws as they are currently interpreted by the Internal Revenue Service (the “IRS”). Federal income tax laws and the current
interpretations by the IRS may change.
A Policy must satisfy certain requirements set forth in the Tax Code in order to qualify as a life insurance contract for federal
income tax purposes and to receive the tax treatment normally accorded life insurance contracts under federal tax law. There is limited guidance as to how these requirements are to be applied. Nevertheless, we believe that a Policy issued on a
standard Premium Class basis should satisfy the applicable Tax Code requirements. There is, however, some uncertainty about the application of the Tax Code requirements if a Policy is issued on a special Premium Class basis, particularly if the
full amount of Premiums permitted under the Policy is paid. If it is subsequently determined that a Policy does not satisfy the applicable requirements, we may take appropriate steps to bring the Policy into compliance with such requirements and
we reserve the right to restrict Policy transactions and make other changes to your Policy that may be necessary in order to do so.
In some circumstances, Owners of variable life insurance contracts who retain excessive control over the investment of the underlying
Portfolio assets of the Variable Account may be treated as the Owners of those assets and may be subject to tax on income produced by those assets. Although there is limited published guidance in this area and it does not address certain aspects
of the Policies, we believe that the Owner of a Policy should not be treated as the Owner of the underlying assets. We reserve the right to modify the Policies to bring them into conformity with applicable standards should such modification be
necessary to prevent Owners of the Policies from being treated as the Owners of the underlying Portfolio assets of the Variable Account.
In addition, the Tax Code requires that the investments of the Variable Account be “adequately diversified” in order to treat the
Policy as a life insurance contract for federal income tax purposes. We intend that the Variable Account, through the Portfolios, will satisfy these diversification requirements.
The following discussion assumes that the Policy will qualify as a life insurance contract for federal income tax purposes.
In General. We believe that the death benefit under a Policy generally
should be excludible from the Beneficiary’s gross income. If the death benefit is not received in a lump sum, however, and is instead applied under a proceeds option agreed to by us and the Beneficiary, payments generally will be prorated between
amounts attributable to the death benefit, which will be excludible from the Beneficiary’s income, and amounts attributable to interest (occurring after the Insured’s death), which will be includable in the Beneficiary’s income.
Generally, you will not be deemed to be in constructive receipt of the Contract Value. When distributions from a Policy occur, or
when loans are taken out from or secured by (e.g., by assignment), a Policy, the tax consequences depend on whether the Policy is classified as a “Modified Endowment Contract.”
Federal, state and local transfer, and other tax consequences of Ownership or receipt of Policy proceeds depend on your circumstances
and the Beneficiary’s circumstances. You should consult a tax advisor on these consequences.
Modified Endowment Contracts. Under the Tax Code, certain life insurance
contracts are classified as “Modified Endowment Contracts,” (“MEC”) with less favorable lifetime income tax treatment than other life insurance contracts. Due to the flexibility of the Policies as to Premiums and benefits, the individual
circumstances of each Policy will determine whether it is classified as a MEC. In general, a Policy will be classified as a MEC if the amount of Premiums paid into the Policy causes the Policy to fail the “7-pay test.” A Policy will fail the
7-pay test if at any time in the first seven Policy years, the amount paid into the Policy exceeds the sum of the level Premiums that would have been paid at that point under a Policy that provided for paid-up future benefits after the payment of
seven level annual payments.
If there is a reduction in the benefits under the Policy during the first seven Policy years, for example, as a result of a partial
Surrender, the 7-pay test will have to be reapplied as if the Policy had originally been issued at the reduced Face Amount. If there is a “material change” in the Policy’s benefits or other terms, even after the first seven Policy years, the
Policy will have to be retested as if it were a newly issued Policy. A material change can occur, for example, when there is an increase in the death benefit that is due to the payment of an unnecessary premium. Unnecessary Premiums are Premiums
paid into the Policy which are not needed in order to provide a death benefit equal to the lowest death benefit that was payable in the first seven Policy years. To prevent your Policy from becoming a MEC it may be necessary to limit premium
payments or to limit reductions in benefits. A current or prospective Policy Owner should consult with a competent tax advisor to determine whether a Policy transaction will cause the Policy to be classified as a Modified Endowment Contract.
Upon issuance of your Policy, we will notify you if your Policy is classified as a MEC based on the Initial Premium we receive. If
any future payment we receive would cause your Policy to become a MEC, you will be notified. We will not invest that premium in the Policy until you notify us that you want to continue your Policy as a MEC.
Distributions (other than Death Benefits) from Modified Endowment Contracts (“MEC”).
Policies classified as MECs are subject to the following tax rules:
| • |
All distributions other than death benefits from a MEC, including distributions upon Surrender and partial Surrender, will be treated first as distributions of gain taxable as ordinary income and as tax-free recovery of the Policy
Owner’s investment in the Policy only after all gain has been distributed.
|
| • |
Loans taken from or secured by (e.g., by assignment) such a Policy are treated as distributions and taxed accordingly.
|
| • |
A 10% additional income tax is imposed on the amount included in income except where the distribution or loan is made when you have Attained Age 59 1/2 or are disabled, or where the distribution is part of a
series of substantially equal periodic payments for your life (or life expectancy) or the joint lives (or joint life expectancies) of you, and the Beneficiary.
|
| • |
If a Policy becomes a MEC, distributions that occur during the Policy year will be taxed as distributions from a MEC. In addition, distributions from a Policy within two years before it becomes a MEC will be taxed in this manner. This
means that a distribution from a Policy that is not a MEC at the time when the distribution is made could later become taxable as a distribution from a MEC.
|
Distributions (other than Death Benefits) from Policies that are not Modified
Endowment Contracts. Distributions other than Death Benefits from a Policy that is not a MEC are generally treated first as a recovery of your investment in the Policy, and as taxable income after the recovery of all investment in the
Policy. However, certain distributions which must be made in order to enable the Policy to continue to qualify as a life insurance
contract for federal income tax purposes if Policy benefits are reduced during the first 15 Policy years may be treated in whole or in part as ordinary income subject to
tax.
Loans from or secured by a Policy that is not a MEC are generally not treated as distributions. However, the tax consequences
associated with Policy loans from this Policy are less clear because the difference between the interest rate we charge on Policy loans and the rate we credit to the loan account results in a net cost to you that could be viewed as negligible
and, as a result, it is possible that such a loan could be treated as, in substance, a taxable distribution. You should consult a tax advisor about such loans.
Finally, neither distributions from nor loans from or secured by a Policy that is not a MEC are subject to the 10% additional tax.
Investment in the Policy. Your
investment in the Policy is generally your aggregate Premiums. When a distribution is taken from the Policy, your investment in the Policy is reduced by the amount of the distribution that is tax-free.
Policy Loans. If a loan from a Policy is outstanding when the Policy is
cancelled or Lapses, the amount of the outstanding indebtedness will be added to the amount distributed and will be taxed accordingly. In general, interest you pay on a loan from a Policy will not be deductible. Before taking out a Policy loan,
you should consult a tax advisor as to the tax consequences. If your Policy has a large amount of indebtedness when it Lapses or is Surrendered, you might owe taxes that are much more than the Surrender Value you
receive.
This Policy may be purchased with the intention of accumulating cash value on a tax-free basis for some period (such as, until
retirement) and then periodically borrowing from the Policy without allowing the Policy to Lapse. The aim of this strategy is to continue borrowing from the Policy until its Contract Value is just enough to pay off the Policy loans that have been
taken out. Anyone contemplating taking advantage of this strategy should be aware that it involves several risks. First, this strategy will fail to achieve its goal if the Policy is a MEC or becomes a MEC after the periodic borrowing begins.
Second, this strategy has not been ruled on by the Internal Revenue Service or the courts and it may be subject to challenge by the IRS, since it is possible that loans under this Policy will be treated as taxable distributions. Finally, there is
a significant risk that poor investment performance, together with ongoing deductions for insurance charges, will lead to a substantial decline in the Contract Value that could result in the Policy lapsing. In that event, assuming Policy loans
have not already been subject to tax as distributions, a significant tax liability could arise when the Lapse occurs. Anyone considering using the Policy as a source of tax-free income by taking out Policy loans should consult a competent tax
advisor before purchasing the Policy about the tax risks inherent in such a strategy.
Multiple Policies. All MECs that we issue (or that our affiliates issue)
to the same Owner during any calendar year are treated as one MEC for purposes of determining the amount includible in the Owner’s income when a taxable distribution occurs.
Withholding. To the extent that Policy distributions are taxable, they
are generally subject to withholding for the recipient’s federal income tax liability. Recipients can generally elect, however, not to have tax withheld from distributions.
Life Insurance Purchases by Residents of Puerto Rico. The Internal
Revenue Service has announced that income received by residents of Puerto Rico under life insurance contracts issued by a Puerto Rico branch of a United States life insurance company is U.S.-source income that is generally subject to United
States federal income tax.
Other Policy Owner Tax Matters. The tax consequences of continuing the
Policy after the Insured reaches age 100 are unclear. The IRS has issued Revenue Procedure 2010-28 providing a safe harbor concerning the application of Sections 7702 and 7702A to life insurance contracts that have mortality guarantees based on
the 2001 CSO Table and which may continue in force after an insured attains age 100. If a contract satisfies all the requirements of Sections 7702 and 7702A using all of the Age 100 Safe Harbor Testing Method requirements set forth in Rev. Proc.
2010-28, the IRS will not challenge the qualification of that contract under Sections 7702 and 7702A. Rev. Proc. 2010-28 also states that: “No adverse inference should be drawn with respect to the qualification of a contract as a life insurance
contract under Section 7702, or its status as not a MEC under Section 7702A, merely by reason of a failure to satisfy all of the requirements of [the Age 100 Safe Harbor]. Revenue Procedure 2018-20 modifies and supersedes Revenue Procedure
2010-28 to the extent life insurance contracts have mortality guarantees based on the 2017 CSO Table.
You should consult a tax advisor if you intend to keep the Policy in-force after the Insured reaches age 100. It is possible that the Internal Revenue Service might tax you as though you have Surrendered the Policy
when the Insured reaches age 100, even if you keep the Policy in force. This could potentially result in a very large tax liability for you. The tax
liability might be much larger than the Cash Surrender Value of this Policy.
Business Uses of the Policy. The Policy may be used in various
arrangements, including nonqualified deferred compensation or salary continuance plans, split-dollar insurance plans, executive bonus plans, retiree medical benefit plans and others. The tax consequences of such plans and business uses of the
Policy may vary depending on the particular facts and circumstances of each individual arrangement and business use of the Policy. Therefore, if you are contemplating using the Policy in any arrangement the value of which depends in part on its
tax consequences, you should be sure to consult a tax advisor as to the tax attributes of the arrangement.
Employer-owned Life Insurance Contracts.
Pursuant to section 101(j) of the Code, unless certain eligibility, notice and consent requirements are satisfied, the amount excludible as a death benefit payment under an employer-owned life insurance contract will generally be limited to the
Premiums paid for such contract (although certain exceptions may apply in specific circumstances). An employer-owned life insurance contract is a life insurance contract owned by an employer that insures an employee of the employer and where the
employer is a direct or indirect beneficiary under such contract. It is the employer’s responsibility to verify the eligibility of the intended insured under employer-owned life insurance contracts and to provide the notices and obtain the
consents required by section 101(j). These requirements generally apply to employer-owned life insurance contracts issued or materially modified after August 17, 2006. A tax advisor should be consulted by anyone considering the purchase or
modification of an employer-owned life insurance contract.
Non-Individual Owners and Business Beneficiaries of Policies. If a
Policy is owned or held by a corporation, trust or other non-natural person, this could jeopardize some (or all) of such entity’s interest deduction under Code Section 264, even where such entity’s indebtedness is in no way connected to the
Policy unless one of the exceptions under Code Section 264(f)(4) applies. In addition, under Section 264(f)(5), if a business (other than a sole proprietorship) is directly or indirectly a beneficiary of a Policy, this Policy could be treated as
held by the business for purposes of the Section 264(f) entity-holder rules. Therefore, it would be advisable to consult with a qualified tax advisor before any non-natural person is made an Owner or holder of a Policy, or before a business
(other than a sole proprietorship) is made a beneficiary of a Policy.
In Revenue Ruling 2011-9, the IRS held that the status of an Insured as an employee “at the time first covered” for purposes of
Section 264(f)(4) does not carry over from a policy given up in a Section 1035 tax-free exchange for a policy received in such an exchange. Therefore, the pro rata interest expense disallowance exception of Section 264(f)(4) does not apply to new
policies received in Section 1035 tax-free exchanges unless such policies also qualify for the exception provided by Section 264(f)(4) of the Code.
Split-Dollar Arrangements. The Sarbanes-Oxley Act of 2002 prohibits,
with limited exceptions, publicly-traded companies, including non-U.S. companies that have securities listed on exchanges in the United States, from extending, directly or through a subsidiary, many types of personal loans to their directors or
executive officers. It is possible that this prohibition may be interpreted as applying to split-dollar life insurance policies for directors and executive officers of such companies, since such insurance arguably can be viewed as involving a
loan from the employer for at least some purposes.
Although the prohibition on loans is generally effective as of July 30, 2002, there is an exception for loans outstanding as of the
date of enactment, so long as there is no material modification to the loan terms and the loan is not renewed after July 30, 2002. Any affected business contemplating the payment of a premium on an existing Policy, or the purchase of a new
Policy, in connection with a split-dollar life insurance arrangement should consult legal counsel.
In addition, the IRS and Treasury have issued guidance relating to split-dollar insurance arrangements that significantly affect the
tax treatment of such arrangements. This guidance affects all split-dollar arrangements, not just those involving publicly-traded companies. Any business contemplating the purchase of a new Policy or a change in an existing Policy should consult
a tax advisor.
Estate, Gift and Generation-Skipping Transfer Taxes. The transfer of the
Policy or designation of a beneficiary may have federal, state, and/or local transfer and inheritance tax consequences, including the imposition of gift, estate, and generation-skipping transfer taxes. For example, when the Insured dies, the
death proceeds will generally be includable in the Owner’s estate for purposes of federal estate tax if the Insured owned the Policy. If the Owner was not the Insured, the fair market value of the Policy would be included in the Owner’s estate
upon the Owner’s death. The Policy would not be includable in the Insured’s estate if the Insured did not retain incidents of Ownership at death or had given up Ownership more than three years before death.
Moreover, under certain circumstances, the Tax Code may impose a “generation skipping transfer tax” when all or part of a life insurance policy is
transferred to, or a death benefit is paid to, an individual two or more generations younger than the Owner. Regulations issued under the Tax Code may require us to deduct the tax from your Policy, or from any applicable payment, and pay it
directly to the IRS.
Qualified tax advisors should be consulted concerning the estate and gift tax consequences of Policy Ownership and distributions
under federal, state and local law. The individual situation of each Owner or beneficiary will determine the extent, if any, to which federal, state, and local transfer and inheritance taxes may be imposed and how Ownership or receipt of Policy
proceeds will be treated for purposes of federal, state and local estate, inheritance, generation-skipping and other taxes.
The American Taxpayer Relief Act of 2012 (“ATRA”). ATRA permanently
establishes the federal estate tax, gift tax and generation-skipping transfer tax exemptions at $5,000,000, indexed for inflation. ATRA also permanently establishes the maximum federal estate tax, gift tax and generation-skipping transfer tax
rate at 40%. ATRA allows a deceased spouse’s estate to transfer any unused portion of the deceased spouse’s exemption amount to a surviving spouse. ATRA also unified the estate tax, gift tax and generation skipping transfer tax exemptions and
provided for indexing of these exemptions for inflation beginning in 2012. The Tax Cut and Jobs Act of 2017, increased the federal estate, gift and generation-skipping transfer tax exemption amounts to $11,200,000 for individuals and $22,400,000
for married couples respectively beginning in 2018. These exemption amounts are scheduled to increase with inflation each year until 2025. On January 1, 2026, the exemption amounts are scheduled to revert to the 2017 levels, adjusted for
inflation.
The Health Care and Education Reconciliation Act of 2010 (the “Act”). The
Act imposes a 3.8% tax in taxable years beginning in 2013 on an amount equal to the lesser of (a) “net investment income”; or (b) the excess of a taxpayer’s modified adjusted gross income over a specified income threshold ($250,000 for married
couples filing jointly, $125,000 for married couples filing separately, and $200,000 for everyone else). Regulations issued by the IRS define “net investment income” for this purpose as including taxable distributions from life insurance policies
over allowable deductions, as such term is defined in the Act. Please consult the impact of the Act on you with a competent tax advisor.
Accelerated Benefit Rider for Terminal Illness. The tax consequences
associated with adding or electing to receive benefits under the Accelerated Benefit Rider for Terminal Illness are unclear. A tax advisor should be consulted about the tax consequences of adding this rider to a Policy or requesting payment under
the rider.
Life Insurance Purchases by Nonresident Aliens and Foreign Corporations. The
discussion above provides general information regarding U.S. federal income tax consequences to life insurance purchasers that are U.S. citizens or residents. Purchasers that are not U.S. citizens or residents will generally be subject to U.S.
federal withholding tax on taxable distributions from life insurance policies at a 30% rate, unless a lower treaty rate applies. In addition, purchasers may be subject to state and/or municipal taxes and taxes that may be imposed by the
purchaser’s country of citizenship or residence. Prospective purchasers are advised to consult with a qualified tax advisor regarding U.S., state, and foreign taxation with respect to a life insurance policy purchase.
Foreign Tax Credits. We may
benefit from any foreign tax credits attributable to taxes paid by certain Portfolios to foreign jurisdictions to the extent permitted under federal tax law.
Possible Charges for Our Taxes.
At the present time, we make no charge for any federal, state or local taxes (other than the charge for state premium taxes) that may be attributable to the Subaccounts or to the Policy. We reserve the right to impose charges for any future taxes
or economic burden we may incur.
Possible Tax Law Changes. While the likelihood of legislative changes is
uncertain, there is always a possibility that the tax treatment of the Policy could change by legislation or otherwise. It is even possible that any legislative change could be retroactive (effective prior to the date of the change). Consult a
tax advisor with respect to legislative developments and their effect on the Policy.
Distribution and Principal Underwriting Agreement. We have entered into
a distribution agreement with Farmers Financial Solutions, LLC (“FFS”) for the distribution and sale of the Policies. Pursuant to this agreement, FFS serves as principal underwriter for the Policies. FFS offers the Policies for sale through its
sales representatives. We reimburse FFS for certain expenses it incurs in order to pay for the distribution of the Policies.
Compensation to Broker-Dealers Selling the Policies. We pay commissions to FFS for sales
of the Policies by FFS’ sales representatives. Sales commissions may vary, but the commissions payable for Policy sales by sales representatives of FFS are expected not to exceed 99% of Premiums up to a target premium set by Farmers received
within the first two Policy years (we may pay additional amounts) and 5.14% of premium received in excess of the target premium through the 10th Policy year. After year 10, the commission is not expected to exceed 0.185% of the
Policy’s Contract Value each year. FFS may be required to return to us first year commissions if the Policy is not continued through the first Policy year.
Special Compensation Paid to FFS. We pay for FFS’ operating and other
expenses, including overhead, legal, and accounting fees. We may also pay for certain sales expenses of FFS: sales representative training materials; marketing materials and advertising expenses; and certain other expenses of distributing the
Policies. In addition, we contribute indirectly to the deferred compensation for FFS’ sales representatives. FFS pays its sales representatives a portion of the commissions received for their sales of the Policies.
FFS’ sales representatives and their managers also may be eligible for various cash benefits under certain circumstances. Such cash
benefits may include incentive bonuses for the sale of non-variable insurance products we issue as well as certain insurance benefits and financing arrangements.
In addition, FFS’ sales representatives who meet certain productivity, persistency and length of service standards and/or their
managers may be eligible for additional non-cash compensation. Non-cash compensation items that FFS and we may provide jointly include attendance at conferences, conventions, seminars and trips (including travel, lodging and meals in connection
therewith), entertainment, awards, merchandise and other similar items. By selling this Policy, sales representatives and/or their managers may qualify for these productivity benefits. FFS’ sales representatives and managers may receive other
payments from us for services that do not directly involve the sale of the Policies, including payments made for the recruitment and training of personnel, production of promotional literature and similar services.
Exclusive Access to FFS’ Distribution Network. In exchange for the
amounts we pay to FFS, we receive exclusive access to FFS’ distribution network. The amounts we pay are designed especially to encourage the sale of our products by FFS. See the SAI for a discussion of the amounts we have paid FFS in connection
with its exclusive offering of the Policies and other Farmers variable life products.
The prospect of receiving, or the actual receipt, of the additional compensation may provide FFS and/or its sales representatives with an incentive to
recommend the Policies to prospective Owners over the sales of other investments with respect to which FFS either does not receive additional compensation or receives lower levels of additional compensation.
Ask your sales representative for further information about the compensation your sales representative and FFS may
receive in connection with your purchase of a Policy. Also inquire about any revenue sharing arrangements that we may have with FFS, including the conflicts of interest that such arrangements may create.
No specific charge is assessed directly to Policy Owners or the Variable Account to cover commissions and other incentives and
payments described above in connection with the distribution of the Policies. However, we intend to recoup commissions and other sales expenses through the fees and charges we deduct under the Policy and through other corporate revenue.
You should be aware that FFS and its sales representatives may receive different compensation or incentives for selling one product
over another. In some cases, these payments may create an incentive for the selling firm or its sales representatives to recommend or sell this Policy to you. You may wish to take these payments into account when considering and evaluating any
recommendations relating to the Policy.
Like other life insurance companies, we are involved in lawsuits that arise in the ordinary course of the Company’s business. These
actions are in various stages of discovery and development, and some seek punitive as well as compensatory damages. In addition, we are, from time to time, involved as a party to various governmental and administrative proceedings. While it is
not possible to predict the outcome of such matters with absolute certainty, at the present time, it appears that there are no pending or threatened lawsuits that are likely to have a material adverse impact on the Variable Account, on FFS’
ability to perform under its principal underwriting agreement, or on the Company’s ability to meet its obligations under the Policy.
The audited financial statements of Farmers New World Life Insurance Company and of Farmers Variable Life Separate Account A are
contained in the SAI. You should consider the financial statements of Farmers New World Life Insurance Company as bearing only upon our ability to meet our obligations under the Policies. For a free copy of these audited financial statements
and/or the SAI, please call our Service Center at 1-877-376-8008, or write to us at P. O. Box 724208 Atlanta, Georgia 31139.
The following is a list of Portfolios under the Contract. More information about the Portfolios is available in the prospectuses for the Portfolios, which
may be amended from time to time and can be found online at
https://vpx.broadridge.com/GetContract1.asp?cid=fnwl&fid=FVL. You can also request this information at no cost by calling 1-877-376-8008 or emailing us at farmersvariable@infosys.com.
https://vpx.broadridge.com/GetContract1.asp?cid=fnwl&fid=FVL. You can also request this information at no cost by calling 1-877-376-8008 or emailing us at farmersvariable@infosys.com.
The current expenses and performance information below reflects fees and expenses of the Portfolios, but do not reflect the other fees and expenses that
your Contract may charge. Expenses would be higher, and performance would be lower, if these other charges were included. Each Portfolio’s past performance is not necessarily an indication of future performance.
|
Investment Objective
|
Portfolio and Adviser/Subadviser
|
Current
Expenses |
Average Annual Total
Returns (as of 12/31/24) |
|||
|
1 year
|
5 year
|
10 year
|
||||
|
Seeks to provide a high total return (including income and capital gains) consistent with preservation of capital over the long term.
|
American Funds Asset Allocation Fund (Class 2 Shares)
Investment Adviser:
Capital Research and Management CompanySM
|
0.54%
|
16.44%
|
8.32%
|
8.32%
|
|
|
Seeks (1) to provide a level of current income that exceeds the average yield on U.S. stocks generally and (2) to provide a growing stream of income over the years. The secondary objective is to provide growth of capital.
|
American Funds Capital Income Builder® (Class 2 Shares)1
Investment Adviser:
Capital Research and Management CompanySM
|
0.66%
|
10.19%
|
6.02%
|
5.48%
|
|
|
Seeks to provide long-term growth of capital while providing current income.
|
American Funds Capital World Growth and Income Fund (Class 2 Shares)1
Investment Adviser:
Capital Research and Management CompanySM
|
0.77%
|
14.00%
|
7.29%
|
8.45%
|
|
|
Seeks to provide a long-term growth of capital.
|
American Funds Global Growth Fund
(Class 2 Shares)
Investment Adviser:
Capital Research and Management CompanySM
|
0.76%
|
13.68%
|
9.76%
|
10.74%
|
|
|
Seeks to provide growth of capital.
|
American Funds Growth Fund
(Class 2 Shares)
Investment Adviser:
Capital Research and Management CompanySM
|
0.59%
|
31.61%
|
18.83%
|
16.58%
|
|
|
Seeks to achieve long-term growth of capital and income.
|
American Funds Growth-Income Fund
(Class 2 Shares)
Investment Adviser:
Capital Research and Management CompanySM
|
0.53%
|
24.23%
|
13.01%
|
12.20%
|
|
|
Seeks to provide long-term growth of capital.
|
American Funds International Fund
(Class 2 Shares)
Investment Adviser:
Capital Research and Management CompanySM
|
0.78%
|
3.16%
|
1.23%
|
4.01%
|
|
|
Seeks capital growth.
|
BNY Mellon Opportunistic Small Cap Portfolio (Service Class Shares)
Investment Adviser:
BNY Mellon Investment Advisors, Inc.
Subadviser:
Newton Investment Management North America, LLC
|
1.05%
|
4.36%
|
5.62%
|
6.20%
|
|
|
Seeks long-term capital appreciation.
|
BNY Mellon Sustainable U.S. Equity Portfolio, Inc. (Service Class Shares)
Investment Adviser:
BNY Mellon Investment Advisors, Inc.
Subadviser:
Newton Investment Management Limited
|
0.92%
|
24.58%
|
13.18%
|
11.25%
|
|
|
Seeks long-term growth of capital.
|
DWS CROCI® International VIP (Series I) (Class A Shares)1
Investment Adviser:
DWS Investment Management Americas, Inc.
|
0.93%
|
2.45%
|
3.47%
|
3.68%
|
|
|
Seeks to achieve a high rate of total return.
|
DWS CROCI® U.S. VIP (Series II)
(Class A Shares)1
Investment Adviser:
DWS Investment Management Americas, Inc.
|
0.78%
|
17.76%
|
6.01%
|
5.72%
|
|
|
Seeks above-average capital appreciation over the long term.
|
DWS Global Small Cap VIP (Series I) (Class A Shares)1
Investment Adviser:
DWS Investment Management Americas, Inc.
|
1.08%
|
5.76%
|
6.18%
|
4.84%
|
|
|
Seeks maximum current income to the extent consistent with stability of principal.
|
DWS Government Money Market VIP (Series II) (Class A Shares)
Investment Adviser:
DWS Investment Management Americas, Inc.
|
0.40%
|
4.92%
|
2.22%
|
1.47%
|
|
|
Seeks to provide a high level of current income.
|
DWS High Income VIP (Series II)
(Class A Shares)1
Investment Adviser:
DWS Investment Management Americas, Inc.
|
0.91%
|
7.14%
|
3.73%
|
4.62%
|
|
|
Seeks high total return with a secondary objective of principal preservation as the fund approaches its target date and beyond.
|
Fidelity® VIP Freedom 2010 Portfolio
(Service Class 2 Shares)
Investment Adviser:
Fidelity Management & Research Company LLC
|
0.65%
|
5.06%
|
3.26%
|
4.38%
|
|
|
Seeks high total return with a secondary objective of principal preservation as the fund approaches its target date and beyond.
|
Fidelity® VIP Freedom 2015 Portfolio
(Service Class 2 Shares)
Investment Adviser:
Fidelity Management & Research Company LLC
|
0.68%
|
6.21%
|
4.08%
|
5.11%
|
|
|
Seeks high total return with a secondary objective of principal preservation as the fund approaches its target date and beyond.
|
Fidelity® VIP Freedom 2020 Portfolio
(Service Class 2 Shares)
Investment Adviser:
Fidelity Management & Research Company LLC
|
0.71%
|
7.40%
|
4.89%
|
5.76%
|
|
|
Seeks high total return with a secondary objective of principal preservation as the fund approaches its target date and beyond.
|
Fidelity® VIP Freedom 2025 Portfolio
(Service Class 2 Shares)
Investment Adviser:
Fidelity Management & Research Company LLC
|
0.73%
|
8.28%
|
5.52%
|
6.27%
|
|
|
Seeks high total return with a secondary objective of principal preservation as the fund approaches its target date and beyond.
|
Fidelity® VIP Freedom 2030 Portfolio
(Service Class 2 Shares)
Investment Adviser:
Fidelity Management & Research Company LLC
|
0.76%
|
9.14%
|
6.25%
|
7.03%
|
|
|
Seeks high total return with a secondary objective of principal preservation.
|
Fidelity® VIP Freedom Income Portfolio (Service Class 2 Shares)
Investment Adviser:
Fidelity Management & Research Company LLC
|
0.62%
|
4.20%
|
2.26%
|
3.19%
|
|
|
Seeks high current income and, as a secondary objective, capital appreciation.
|
Fidelity® VIP FundsManager 20% Portfolio (Service Class 2 Shares)1
Investment Adviser:
Fidelity Management & Research Company LLC
|
0.66%
|
5.39%
|
2.80%
|
3.16%
|
|
|
Seeks high total return.
|
Fidelity® VIP FundsManager 50% Portfolio (Service Class 2 Shares)1
Investment Adviser:
Fidelity Management & Research Company LLC
|
0.79%
|
8.38%
|
5.60%
|
5.69%
|
|
|
Seeks high total return.
|
Fidelity® VIP FundsManager 70% Portfolio (Service Class 2 Shares)1
Investment Adviser:
Fidelity Management & Research Company LLC
|
0.83%
|
10.68%
|
7.40%
|
7.29%
|
|
|
Seeks high total return.
|
Fidelity® VIP FundsManager 85% Portfolio (Service Class 2 Shares)1
Investment Adviser:
Fidelity Management & Research Company LLC
|
0.86%
|
12.38%
|
8.57%
|
8.45%
|
|
|
Seeks to achieve capital appreciation.
|
Fidelity® VIP Growth Portfolio
(Service Class Shares)
Investment Adviser:
Fidelity Management & Research Company LLC
|
0.66%
|
30.27%
|
18.81%
|
16.51%
|
|
|
Seeks investment results that correspond to the total return of common stocks publicly traded in the United States, as represented by the S&P 500.
|
Fidelity® VIP Index 500 Portfolio
(Service Class Shares)
Investment Adviser:
Fidelity Management & Research Company LLC
Subadviser: Geode Capital Management, LLC
|
0.19%
|
24.77%
|
14.29%
|
12.88%
|
|
|
Seeks long-term growth of capital.
|
Fidelity® VIP Mid Cap Portfolio
(Service Class Shares)
Investment Adviser:
Fidelity Management & Research Company LLC
|
0.67%
|
17.35%
|
11.23%
|
9.10%
|
|
|
Seeks long-term total return. Under normal market conditions, the fund invests at least 80% of its net assets in investments of small capitalization companies.
|
Franklin Small Cap Value VIP Fund
(Class 2 Shares)2
Investment Adviser:
Franklin Mutual Advisors, LLC
|
0.90%
|
11.71%
|
8.36%
|
8.17%
|
|
|
Seeks long-term capital growth. Under normal market conditions, the fund invests at least 80% of its net assets in investments of small-capitalization and mid-capitalization companies.
|
Franklin Small-Mid Cap Growth VIP Fund (Class 2 Shares)1
Investment Adviser:
Franklin Advisors, Inc.
|
1.09%
|
11.04%
|
9.75%
|
9.32%
|
|
|
Seeks long-term capital growth, consistent with preservation of capital and balanced by current income.
|
Janus Henderson Balanced Portfolio
(Service Class Shares)
Investment Adviser:
Janus Henderson Investors US LLC
|
0.87%
|
15.15%
|
8.06%
|
8.40%
|
|
|
Seeks long-term growth of capital.
|
Janus Henderson Forty Portfolio
(Institutional Shares)
Investment Adviser:
Janus Henderson Investors US LLC
|
0.58%
|
28.47%
|
15.40%
|
15.65%
|
|
|
Seeks maximum total return, consistent with preservation of capital and prudent investment management.
|
PIMCO International Bond Portfolio (U.S. Dollar-Hedged) (Administrative Class Shares)
Investment Adviser:
Pacific Investment Management Company LLC (“PIMCO”)
|
1.01%
|
5.46%
|
1.34%
|
2.51%
|
|
|
Seeks maximum total return, consistent with preservation of capital and prudent investment management.
|
PIMCO Low Duration Portfolio (Administrative Class Shares)
Investment Adviser:
Pacific Investment Management Company LLC (“PIMCO”)
|
0.67%
|
4.50%
|
1.08%
|
1.28%
|
|
|
Seeks to provide as high a level of total return (consisting of reinvested income and capital appreciation) as is consistent with reasonable risk.
|
Principal SAM Balanced Portfolio
(Class 2 Shares)
Investment Adviser:
Principal Global Investors, LLC
|
0.48%
|
12.38%
|
6.48%
|
6.52%
|
|
|
Seeks to provide a high level of total return (consisting of reinvestment of income and capital appreciation), consistent with a moderate degree of principal risk.
|
Principal SAM Conservative Balanced Portfolio (Class 2 Shares)
Investment Adviser:
Principal Global Investors, LLC
|
0.49%
|
8.69%
|
4.39%
|
4.89%
|
|
|
Seeks to provide long-term capital appreciation.
|
Principal SAM Conservative Growth Portfolio (Class 2 Shares)
Investment Adviser:
Principal Global Investors, LLC
|
0.48%
|
14.94%
|
8.24%
|
7.98%
|
|
|
Seeks to provide a high level of total return (consistent of income with some capital appreciation).
|
Principal SAM Flexible Income Portfolio (Class 2 Shares)
Investment Adviser:
Principal Global Investors, LLC
|
0.49%
|
6.43%
|
2.82%
|
3.73%
|
|
|
Seeks to provide long-term capital appreciation.
|
Principal SAM Strategic Growth Portfolio (Class 2 Shares)
Investment Adviser:
Principal Global Investors, LLC
|
0.48%
|
16.68%
|
9.61%
|
8.79%
|
|
| 1 |
This Portfolio is subject to an expense reimbursement or fee waiver arrangement resulting in a temporary expense reduction. See the Portfolio’s prospectus for additional information.
|
| 2 |
The Subaccount that invests in this Portfolio is closed to new investors.
|
Appendix B: Guaranteed Maximum Cost of Insurance Rates
This Table applies for Prior Policies.
|
GUARANTEED MAXIMUM MONTHLY COST OF INSURANCE RATES
|
|||||||||||||||||
|
Per 1,000 of Risk Insurance Amount
|
|||||||||||||||||
|
Attained
Age
|
Male
Non-
Nicotine
|
Male
Nicotine*
|
Female
Non-
Nicotine
|
Female
Nicotine*
|
Attained
Age
|
Male
Non-
Nicotine
|
Male
Nicotine*
|
Female
Non-
Nicotine
|
Female
Nicotine*
|
||||||||
|
|
|
|
|
|
|
|
|
|
|
||||||||
|
0
|
N/A
|
0.06001
|
N/A
|
0.03500
|
51
|
0.31471
|
0.61121
|
0.27458
|
0.53155
|
||||||||
|
|
|
|
|
|
|
|
|
|
|
||||||||
|
1
|
N/A
|
0.03834
|
N/A
|
0.02583
|
52
|
0.34732
|
0.67332
|
0.30551
|
0.59108
|
||||||||
|
|
|
|
|
|
|
|
|
|
|
||||||||
|
2
|
N/A
|
0.02750
|
N/A
|
0.01916
|
53
|
0.38498
|
0.74807
|
0.33812
|
0.65569
|
||||||||
|
|
|
|
|
|
|
|
|
|
|
||||||||
|
3
|
N/A
|
0.02000
|
N/A
|
0.01666
|
54
|
0.43269
|
0.83717
|
0.37242
|
0.72454
|
||||||||
|
|
|
|
|
|
|
|
|
|
|
||||||||
|
4
|
N/A
|
0.01750
|
N/A
|
0.01583
|
55
|
0.48629
|
0.93226
|
0.41176
|
0.79765
|
||||||||
|
|
|
|
|
|
|
|
|
|
|
||||||||
|
5
|
N/A
|
0.01750
|
N/A
|
0.01500
|
56
|
0.54161
|
1.03082
|
0.45446
|
0.87587
|
||||||||
|
|
|
|
|
|
|
|
|
|
|
||||||||
|
6
|
N/A
|
0.01833
|
N/A
|
0.01583
|
57
|
0.59527
|
1.12189
|
0.49970
|
0.95500
|
||||||||
|
|
|
|
|
|
|
|
|
|
|
||||||||
|
7
|
N/A
|
0.01833
|
N/A
|
0.01750
|
58
|
0.64897
|
1.20883
|
0.54664
|
1.03756
|
||||||||
|
|
|
|
|
|
|
|
|
|
|
||||||||
|
8
|
N/A
|
0.01833
|
N/A
|
0.01750
|
59
|
0.71194
|
1.31107
|
0.59443
|
1.12611
|
||||||||
|
|
|
|
|
|
|
|
|
|
|
||||||||
|
9
|
N/A
|
0.01916
|
N/A
|
0.01750
|
60
|
0.78840
|
1.43713
|
0.64478
|
1.21812
|
||||||||
|
|
|
|
|
|
|
|
|
|
|
||||||||
|
10
|
N/A
|
0.02000
|
N/A
|
0.01833
|
61
|
0.88176
|
1.59135
|
0.70019
|
1.31784
|
||||||||
|
|
|
|
|
|
|
|
|
|
|
||||||||
|
11
|
N/A
|
0.02333
|
N/A
|
0.02083
|
62
|
0.99037
|
1.76877
|
0.75899
|
1.42359
|
||||||||
|
|
|
|
|
|
|
|
|
|
|
||||||||
|
12
|
N/A
|
0.02833
|
N/A
|
0.02250
|
63
|
1.10924
|
1.95930
|
0.82119
|
1.53200
|
||||||||
|
|
|
|
|
|
|
|
|
|
|
||||||||
|
13
|
N/A
|
0.03333
|
N/A
|
0.02583
|
64
|
1.23333
|
2.15024
|
0.88933
|
1.64904
|
||||||||
|
|
|
|
|
|
|
|
|
|
|
||||||||
|
14
|
N/A
|
0.04334
|
N/A
|
0.02833
|
65
|
1.36266
|
2.33731
|
0.96510
|
1.77557
|
||||||||
|
|
|
|
|
|
|
|
|
|
|
||||||||
|
15
|
N/A
|
0.05501
|
N/A
|
0.03000
|
66
|
1.49387
|
2.51876
|
1.04768
|
1.91334
|
||||||||
|
|
|
|
|
|
|
|
|
|
|
||||||||
|
16
|
N/A
|
0.06502
|
N/A
|
0.03250
|
67
|
1.63122
|
2.70230
|
1.13961
|
2.06666
|
||||||||
|
|
|
|
|
|
|
|
|
|
|
||||||||
|
17
|
N/A
|
0.07419
|
N/A
|
0.03417
|
68
|
1.77642
|
2.89051
|
1.24177
|
2.23476
|
||||||||
|
|
|
|
|
|
|
|
|
|
|
||||||||
|
18
|
N/A
|
0.07920
|
N/A
|
0.03667
|
69
|
1.93972
|
3.09808
|
1.35336
|
2.42029
|
||||||||
|
|
|
|
|
|
|
|
|
|
|
||||||||
|
19
|
N/A
|
0.08170
|
N/A
|
0.03834
|
70
|
2.13062
|
3.33638
|
1.47947
|
2.63021
|
||||||||
|
|
|
|
|
|
|
|
|
|
|
||||||||
|
20
|
N/A
|
0.08337
|
N/A
|
0.03917
|
71
|
2.36296
|
3.62993
|
1.62358
|
2.86556
|
||||||||
|
|
|
|
|
|
|
|
|
|
|
||||||||
|
21
|
0.07920
|
0.11340
|
0.03917
|
0.05251
|
72
|
2.63536
|
3.97231
|
1.78151
|
3.12222
|
||||||||
|
|
|
|
|
|
|
|
|
|
|
||||||||
|
22
|
0.07920
|
0.11924
|
0.04000
|
0.05501
|
73
|
2.92321
|
4.31861
|
1.95420
|
3.40297
|
||||||||
|
|
|
|
|
|
|
|
|
|
|
||||||||
|
23
|
0.08003
|
0.12508
|
0.04000
|
0.05751
|
74
|
3.23355
|
4.69520
|
2.14598
|
3.69761
|
||||||||
|
|
|
|
|
|
|
|
|
|
|
||||||||
|
24
|
0.08086
|
0.13176
|
0.04167
|
0.06085
|
75
|
3.57270
|
5.11567
|
2.35698
|
4.00801
|
||||||||
|
|
|
|
|
|
|
|
|
|
|
||||||||
|
25
|
0.08337
|
0.13927
|
0.04250
|
0.06585
|
76
|
3.95664
|
5.58418
|
2.58905
|
4.34483
|
||||||||
|
|
|
|
|
|
|
|
|
|
|
||||||||
|
26
|
0.08670
|
0.14678
|
0.04584
|
0.07002
|
77
|
4.40517
|
6.12911
|
2.84664
|
4.70924
|
||||||||
|
|
|
|
|
|
|
|
|
|
|
||||||||
|
27
|
0.08837
|
0.15095
|
0.04751
|
0.07419
|
78
|
4.92894
|
6.75812
|
3.12826
|
5.10421
|
||||||||
|
|
|
|
|
|
|
|
|
|
|
||||||||
|
28
|
0.08670
|
0.15179
|
0.05001
|
0.07920
|
79
|
5.51951
|
7.45576
|
3.43845
|
5.53102
|
||||||||
|
|
|
|
|
|
|
|
|
|
|
||||||||
|
29
|
0.08587
|
0.15095
|
0.05251
|
0.08420
|
80
|
6.18263
|
8.22452
|
3.82529
|
6.06583
|
||||||||
|
|
|
|
|
|
|
|
|
|
|
||||||||
|
30
|
0.08503
|
0.15012
|
0.05501
|
0.08921
|
81
|
6.90909
|
9.04868
|
4.30288
|
6.72401
|
||||||||
|
|
|
|
|
|
|
|
|
|
|
||||||||
|
31
|
0.08420
|
0.15095
|
0.05835
|
0.09588
|
82
|
7.68497
|
9.90463
|
4.81112
|
7.40691
|
||||||||
|
|
|
|
|
|
|
|
|
|
|
||||||||
|
32
|
0.08503
|
0.15346
|
0.06168
|
0.10255
|
83
|
8.53991
|
10.82608
|
5.34786
|
8.10961
|
||||||||
|
|
|
|
|
|
|
|
|
|
|
||||||||
|
33
|
0.08754
|
0.15847
|
0.06585
|
0.11090
|
84
|
9.50017
|
11.87958
|
5.95007
|
8.84722
|
||||||||
|
|
|
|
|
|
|
|
|
|
|
||||||||
|
34
|
0.08921
|
0.16431
|
0.07086
|
0.12174
|
85
|
10.58031
|
13.08901
|
6.56439
|
9.53442
|
||||||||
|
|
|
|
|
|
|
|
|
|
|
||||||||
|
35
|
0.09338
|
0.17099
|
0.07669
|
0.13259
|
86
|
11.78364
|
14.41951
|
7.29574
|
10.33521
|
||||||||
|
|
|
|
|
|
|
|
|
|
|
||||||||
|
36
|
0.09755
|
0.18101
|
0.08253
|
0.14344
|
87
|
13.10250
|
15.85547
|
8.20718
|
11.33853
|
||||||||
|
|
|
|
|
|
|
|
|
|
|
||||||||
|
37
|
0.10339
|
0.19270
|
0.08754
|
0.15262
|
88
|
14.52614
|
17.37749
|
9.17863
|
12.35414
|
||||||||
|
38
|
0.11090
|
0.20690
|
0.09171
|
0.16181
|
89
|
16.04444
|
18.97012
|
10.15602
|
13.29346
|
||||||||
|
|
|
|
|
|
|
|
|
|
|
||||||||
|
39
|
0.11757
|
0.22277
|
0.09671
|
0.17182
|
90
|
17.58287
|
20.53619
|
10.88246
|
13.83189
|
||||||||
|
|
|
|
|
|
|
|
|
|
|
||||||||
|
40
|
0.12675
|
0.24198
|
0.10255
|
0.18268
|
91
|
19.12353
|
22.05253
|
11.58260
|
14.27591
|
||||||||
|
|
|
|
|
|
|
|
|
|
|
||||||||
|
41
|
0.13760
|
0.26538
|
0.10923
|
0.19520
|
92
|
20.76683
|
23.63636
|
12.75537
|
15.24260
|
||||||||
|
|
|
|
|
|
|
|
|
|
|
||||||||
|
42
|
0.15095
|
0.29297
|
0.11674
|
0.21107
|
93
|
22.53307
|
25.30420
|
14.36966
|
16.62877
|
||||||||
|
|
|
|
|
|
|
|
|
|
|
||||||||
|
43
|
0.16681
|
0.32558
|
0.12592
|
0.22862
|
94
|
24.43244
|
27.11897
|
16.42157
|
18.59746
|
||||||||
|
|
|
|
|
|
|
|
|
|
|
||||||||
|
44
|
0.18435
|
0.36238
|
0.13676
|
0.24950
|
95
|
26.35437
|
28.98442
|
18.70919
|
20.97702
|
||||||||
|
45
|
0.20356
|
0.39920
|
0.14928
|
0.27374
|
96
|
28.27211
|
30.79253
|
21.02122
|
23.30415
|
||||||||
|
46
|
0.22277
|
0.43604
|
0.16431
|
0.30216
|
97
|
30.36217
|
32.73942
|
22.55449
|
24.71403
|
||||||||
|
47
|
0.23864
|
0.46703
|
0.18184
|
0.33729
|
98
|
32.64693
|
34.84234
|
23.39817
|
25.28542
|
||||||||
|
48
|
0.25118
|
0.49048
|
0.20105
|
0.37912
|
99
|
35.15185
|
37.11809
|
25.17504
|
26.84313
|
||||||||
|
49
|
0.26705
|
0.52065
|
0.22277
|
0.42599
|
100+
|
0
|
0
|
0
|
0
|
||||||||
|
50
|
0.28795
|
0.56005
|
0.24700
|
0.47624
|
|||||||||||||
* Attained ages 0-20 are juvenile issues
If the Insured is in a special Premium Class, the guaranteed maximum monthly cost of insurance rate will be the rate shown in the
table times the table rating factor shown on the policy specifications page.
The rates shown above are for the base policy only. Separate maximum charges apply to each rider.
This Table applies for Updated Policies.
|
GUARANTEED MAXIMUM MONTHLY COST OF INSURANCE RATES
|
|||||||||
|
Per 1,000 of Risk Insurance Amount
|
|||||||||
|
Attained
Age
|
Male
Non-
Nicotine
|
Male
Nicotine*
|
Female
Non-
Nicotine
|
Female
Nicotine*
|
Attained
Age
|
Male
Non-
Nicotine
|
Male
Nicotine*
|
Female
Non-
Nicotine
|
Female
Nicotine*
|
|
|
|
|
|
|
|
|
|
|
|
|
0
|
N/A
|
0.02000
|
N/A
|
0.02167
|
51
|
0.21024
|
0.43688
|
0.13343
|
0.33980
|
|
|
|
|
|
|
|
|
|
|
|
|
1
|
N/A
|
0.01250
|
N/A
|
0.01167
|
52
|
0.23029
|
0.47457
|
0.14845
|
0.37327
|
|
|
|
|
|
|
|
|
|
|
|
|
2
|
N/A
|
0.01083
|
N/A
|
0.00750
|
53
|
0.25118
|
0.51563
|
0.16682
|
0.41176
|
|
|
|
|
|
|
|
|
|
|
|
|
3
|
N/A
|
0.01000
|
N/A
|
0.00667
|
54
|
0.27291
|
0.56257
|
0.18686
|
0.45363
|
|
|
|
|
|
|
|
|
|
|
|
|
4
|
N/A
|
0.00917
|
N/A
|
0.00667
|
55
|
0.29381
|
0.61625
|
0.20607
|
0.50054
|
|
|
|
|
|
|
|
|
|
|
|
|
5
|
N/A
|
0.00833
|
N/A
|
0.00750
|
56
|
0.31304
|
0.67668
|
0.22528
|
0.55419
|
|
|
|
|
|
|
|
|
|
|
|
|
6
|
N/A
|
0.00833
|
N/A
|
0.00750
|
57
|
0.33311
|
0.74555
|
0.24366
|
0.61457
|
|
|
|
|
|
|
|
|
|
|
|
|
7
|
N/A
|
0.00750
|
N/A
|
0.00667
|
58
|
0.35486
|
0.82372
|
0.26372
|
0.68172
|
|
|
|
|
|
|
|
|
|
|
|
|
8
|
N/A
|
0.00750
|
N/A
|
0.00667
|
59
|
0.38163
|
0.91374
|
0.28461
|
0.75563
|
|
|
|
|
|
|
|
|
|
|
|
|
9
|
N/A
|
0.00750
|
N/A
|
0.00667
|
60
|
0.41511
|
1.01650
|
0.30886
|
0.83886
|
|
|
|
|
|
|
|
|
|
|
|
|
10
|
N/A
|
0.00833
|
N/A
|
0.00750
|
61
|
0.45949
|
1.13455
|
0.33813
|
0.93142
|
|
|
|
|
|
|
|
|
|
|
|
|
11
|
N/A
|
0.00917
|
N/A
|
0.00750
|
62
|
0.51060
|
1.26713
|
0.37076
|
1.03251
|
|
|
|
|
|
|
|
|
|
|
|
|
12
|
N/A
|
0.01167
|
N/A
|
0.00667
|
63
|
0.56928
|
1.41259
|
0.40842
|
1.14384
|
|
|
|
|
|
|
|
|
|
|
|
|
13
|
N/A
|
0.01667
|
N/A
|
0.00750
|
64
|
0.63303
|
1.57355
|
0.44861
|
1.26459
|
|
|
|
|
|
|
|
|
|
|
|
|
14
|
N/A
|
0.02417
|
N/A
|
0.01250
|
65
|
0.70187
|
1.74923
|
0.49300
|
1.39566
|
|
|
|
|
|
|
|
|
|
|
|
|
15
|
N/A
|
0.03501
|
N/A
|
0.01917
|
66
|
0.77496
|
1.93547
|
0.54077
|
1.53625
|
|
|
|
|
|
|
|
|
|
|
|
|
16
|
N/A
|
0.04918
|
N/A
|
0.02500
|
67
|
0.85568
|
2.13062
|
0.59192
|
1.68639
|
|
|
|
|
|
|
|
|
|
|
|
|
17
|
N/A
|
0.06502
|
N/A
|
0.02750
|
68
|
0.94574
|
2.34073
|
0.64898
|
1.84358
|
|
|
|
|
|
|
|
|
|
|
|
|
18
|
N/A
|
0.06669
|
N/A
|
0.02750
|
69
|
1.05021
|
2.57190
|
0.71531
|
2.01297
|
|
|
|
|
|
|
|
|
|
|
|
|
19
|
N/A
|
0.07003
|
N/A
|
0.02750
|
70
|
1.17422
|
2.83375
|
0.79261
|
2.20146
|
|
|
|
|
|
|
|
|
|
|
|
|
20
|
0.07086
|
0.07253
|
0.02667
|
0.02667
|
71
|
1.32123
|
3.13172
|
0.88429
|
2.39719
|
|
|
|
|
|
|
|
|
|
|
|
|
21
|
0.07086
|
0.07503
|
0.02667
|
0.02667
|
72
|
1.49473
|
3.46183
|
0.99206
|
2.60020
|
|
|
|
|
|
|
|
|
|
|
|
|
22
|
0.06919
|
0.07753
|
0.02667
|
0.02750
|
73
|
1.69488
|
3.81834
|
1.11768
|
2.82172
|
|
|
|
|
|
|
|
|
|
|
|
|
23
|
0.06836
|
0.08004
|
0.02667
|
0.03000
|
74
|
1.92185
|
4.18936
|
1.26375
|
3.06618
|
|
|
|
|
|
|
|
|
|
|
|
|
24
|
0.06836
|
0.08337
|
0.02667
|
0.03334
|
75
|
2.17244
|
4.56366
|
1.43206
|
3.33724
|
|
|
|
|
|
|
|
|
|
|
|
|
25
|
0.06586
|
0.08421
|
0.02667
|
0.03334
|
76
|
2.44854
|
4.93423
|
1.62528
|
3.63948
|
|
|
|
|
|
|
|
|
|
|
|
|
26
|
0.05668
|
0.08421
|
0.02667
|
0.03417
|
77
|
2.75469
|
5.30456
|
1.85038
|
3.97493
|
|
|
|
|
|
|
|
|
|
|
|
|
27
|
0.05168
|
0.08337
|
0.02834
|
0.03417
|
78
|
3.09981
|
5.68439
|
2.11698
|
4.34659
|
|
|
|
|
|
|
|
|
|
|
|
|
28
|
0.05001
|
0.08170
|
0.03084
|
0.03584
|
79
|
3.49733
|
6.08900
|
2.43912
|
4.80146
|
|
|
|
|
|
|
|
|
|
|
|
|
29
|
0.04668
|
0.08170
|
0.03251
|
0.03834
|
80
|
3.96100
|
6.53125
|
2.82086
|
5.37704
|
|
|
|
|
|
|
|
|
|
|
|
|
30
|
0.04501
|
0.08337
|
0.03417
|
0.04084
|
81
|
4.49358
|
7.00358
|
3.23010
|
6.05158
|
|
|
|
|
|
|
|
|
|
|
|
|
31
|
0.04835
|
0.08754
|
0.03584
|
0.04418
|
82
|
5.10686
|
7.60972
|
3.65596
|
6.81830
|
|
|
|
|
|
|
|
|
|
|
|
|
32
|
0.05168
|
0.09422
|
0.04001
|
0.04751
|
83
|
5.82291
|
8.40539
|
4.14748
|
7.64507
|
|
|
|
|
|
|
|
|
|
|
|
|
33
|
0.05668
|
0.10089
|
0.04668
|
0.05668
|
84
|
6.66210
|
9.31617
|
4.82958
|
8.44838
|
|
|
|
|
|
|
|
|
|
|
|
|
34
|
0.06586
|
0.10840
|
0.05418
|
0.06836
|
85
|
7.64417
|
10.36138
|
5.61965
|
9.42708
|
|
|
|
|
|
|
|
|
|
|
|
|
35
|
0.07670
|
0.11758
|
0.06169
|
0.07920
|
86
|
8.78935
|
11.54945
|
6.41042
|
10.58781
|
|
|
|
|
|
|
|
|
|
|
|
|
36
|
0.08838
|
0.12842
|
0.07003
|
0.09338
|
87
|
10.11221
|
12.88214
|
7.32646
|
11.73999
|
|
|
|
|
|
|
|
|
|
|
|
|
37
|
0.10006
|
0.14094
|
0.07670
|
0.10840
|
88
|
11.59966
|
14.33254
|
8.38254
|
12.99755
|
|
|
|
|
|
|
|
|
|
|
|
|
38
|
0.10923
|
0.15597
|
0.08254
|
0.12258
|
89
|
13.22687
|
15.86442
|
9.56128
|
14.34231
|
|
|
|
|
|
|
|
|
|
|
|
|
39
|
0.11591
|
0.17684
|
0.08504
|
0.13343
|
90
|
14.96281
|
17.44422
|
10.85333
|
15.74030
|
|
GUARANTEED MAXIMUM MONTHLY COST OF INSURANCE RATES
|
|||||||||
|
Per 1,000 of Risk Insurance Amount
|
|||||||||
|
Attained
Age
|
Male
Non-
Nicotine
|
Male
Nicotine*
|
Female
Non-
Nicotine
|
Female
Nicotine*
|
Attained
Age
|
Male
Non-
Nicotine
|
Male
Nicotine*
|
Female
Non-
Nicotine
|
Female
Nicotine*
|
|
|
|
|
|
|
|
|
|
|
|
|
40
|
0.12175
|
0.19855
|
0.08587
|
0.14345
|
91
|
16.75815
|
19.02260
|
12.26342
|
17.18368
|
|
|
|
|
|
|
|
|
|
|
|
|
41
|
0.12926
|
0.22110
|
0.08671
|
0.15179
|
92
|
18.58107
|
20.57599
|
13.81441
|
18.68869
|
|
|
|
|
|
|
|
|
|
|
|
|
42
|
0.13760
|
0.24199
|
0.08671
|
0.16098
|
93
|
20.38033
|
22.06638
|
15.46390
|
20.18093
|
|
|
|
|
|
|
|
|
|
|
|
|
43
|
0.14595
|
0.26037
|
0.08671
|
0.17016
|
94
|
22.06638
|
23.41872
|
17.20990
|
21.64133
|
|
|
|
|
|
|
|
|
|
|
|
|
44
|
0.15096
|
0.27375
|
0.08754
|
0.17934
|
95
|
23.86216
|
24.88209
|
19.26070
|
23.31064
|
|
|
|
|
|
|
|
|
|
|
|
|
45
|
0.15597
|
0.28879
|
0.08921
|
0.19354
|
96
|
25.99959
|
26.72182
|
21.71026
|
25.27107
|
|
|
|
|
|
|
|
|
|
|
|
|
46
|
0.16181
|
0.30719
|
0.09255
|
0.21191
|
97
|
28.35327
|
28.80495
|
24.46746
|
27.35722
|
|
|
|
|
|
|
|
|
|
|
|
|
47
|
0.16765
|
0.32726
|
0.09755
|
0.23280
|
98
|
30.94902
|
31.17660
|
27.54398
|
29.53318
|
|
|
|
|
|
|
|
|
|
|
|
|
48
|
0.17517
|
0.34984
|
0.10339
|
0.25536
|
99
|
33.75115
|
33.81926
|
30.92665
|
31.74040
|
|
|
|
|
|
|
|
|
|
|
|
|
49
|
0.18352
|
0.37494
|
0.11090
|
0.28043
|
100+
|
0
|
0
|
0
|
0
|
|
|
|
|
|
|
|
|
|
|
|
|
50
|
0.19437
|
0.40423
|
0.12091
|
0.30802
|
|||||
* Attained ages 0-20 are juvenile issues
If the Insured is in a special Premium Class, the guaranteed maximum monthly cost of insurance rate will be the rate shown in the
table times the table rating factor shown on the policy specifications page.
The rates shown above are for the base policy only. Separate maximum charges apply to each rider.
This Table applies for Prior Policies and Updated Policies in all states other than California.
|
GUARANTEED MAXIMUM MONTHLY UNDERWRITING
AND SALES EXPENSE CHARGE
|
|||||||||
|
Per $1,000 of Face Amount
|
|||||||||
|
Issue Age or
Attained
Age at
Increase
|
Male
Non-
Nicotine
|
Male
Nicotine*
|
Female
Non-
Nicotine
|
Female
Nicotine*
|
Issue Age
or Attained
Age at
Increase
|
Male
Non-
Nicotine
|
Male
Nicotine*
|
Female
Non-
Nicotine
|
Female
Nicotine*
|
|
|
|
|
|
|
|
|
|
|
|
|
0
|
N/A
|
0.075
|
N/A
|
0.072
|
41
|
0.352
|
0.415
|
0.281
|
0.287
|
|
|
|
|
|
|
|
|
|
|
|
|
1
|
N/A
|
0.076
|
N/A
|
0.072
|
42
|
0.368
|
0.436
|
0.292
|
0.298
|
|
|
|
|
|
|
|
|
|
|
|
|
2
|
N/A
|
0.077
|
N/A
|
0.073
|
43
|
0.383
|
0.457
|
0.303
|
0.310
|
|
|
|
|
|
|
|
|
|
|
|
|
3
|
N/A
|
0.078
|
N/A
|
0.074
|
44
|
0.398
|
0.478
|
0.314
|
0.321
|
|
|
|
|
|
|
|
|
|
|
|
|
4
|
N/A
|
0.079
|
N/A
|
0.075
|
45
|
0.414
|
0.499
|
0.325
|
0.332
|
|
|
|
|
|
|
|
|
|
|
|
|
5
|
N/A
|
0.080
|
N/A
|
0.076
|
46
|
0.441
|
0.532
|
0.346
|
0.352
|
|
|
|
|
|
|
|
|
|
|
|
|
6
|
N/A
|
0.083
|
N/A
|
0.078
|
47
|
0.468
|
0.564
|
0.367
|
0.371
|
|
|
|
|
|
|
|
|
|
|
|
|
7
|
N/A
|
0.085
|
N/A
|
0.081
|
48
|
0.495
|
0.597
|
0.388
|
0.391
|
|
|
|
|
|
|
|
|
|
|
|
|
8
|
N/A
|
0.088
|
N/A
|
0.083
|
49
|
0.522
|
0.629
|
0.409
|
0.411
|
|
|
|
|
|
|
|
|
|
|
|
|
9
|
N/A
|
0.091
|
N/A
|
0.086
|
50
|
0.549
|
0.662
|
0.430
|
0.430
|
|
|
|
|
|
|
|
|
|
|
|
|
10
|
N/A
|
0.093
|
N/A
|
0.088
|
51
|
0.591
|
0.707
|
0.461
|
0.461
|
|
|
|
|
|
|
|
|
|
|
|
|
11
|
N/A
|
0.098
|
N/A
|
0.092
|
52
|
0.632
|
0.753
|
0.492
|
0.492
|
|
|
|
|
|
|
|
|
|
|
|
|
12
|
N/A
|
0.103
|
N/A
|
0.097
|
53
|
0.673
|
0.798
|
0.523
|
0.523
|
|
|
|
|
|
|
|
|
|
|
|
|
13
|
N/A
|
0.108
|
N/A
|
0.101
|
54
|
0.714
|
0.843
|
0.553
|
0.553
|
|
|
|
|
|
|
|
|
|
|
|
|
14
|
N/A
|
0.113
|
N/A
|
0.106
|
55
|
0.755
|
0.889
|
0.584
|
0.584
|
|
|
|
|
|
|
|
|
|
|
|
|
15
|
N/A
|
0.118
|
N/A
|
0.110
|
56
|
0.816
|
0.952
|
0.638
|
0.638
|
|
|
|
|
|
|
|
|
|
|
|
|
16
|
N/A
|
0.126
|
N/A
|
0.116
|
57
|
0.877
|
1.015
|
0.693
|
0.693
|
|
|
|
|
|
|
|
|
|
|
|
|
17
|
N/A
|
0.134
|
N/A
|
0.122
|
58
|
0.938
|
1.077
|
0.747
|
0.747
|
|
|
|
|
|
|
|
|
|
|
|
|
18
|
N/A
|
0.142
|
N/A
|
0.128
|
59
|
0.999
|
1.140
|
0.801
|
0.801
|
|
|
|
|
|
|
|
|
|
|
|
|
19
|
N/A
|
0.150
|
N/A
|
0.134
|
60
|
1.060
|
1.203
|
0.855
|
0.855
|
|
|
|
|
|
|
|
|
|
|
|
|
20
|
N/A
|
0.158
|
N/A
|
0.140
|
61
|
1.108
|
1.222
|
0.903
|
0.903
|
|
|
|
|
|
|
|
|
|
|
|
|
21
|
0.159
|
0.173
|
0.140
|
0.142
|
62
|
1.156
|
1.242
|
0.950
|
0.950
|
|
|
|
|
|
|
|
|
|
|
|
|
22
|
0.161
|
0.188
|
0.140
|
0.145
|
63
|
1.204
|
1.261
|
0.998
|
0.998
|
|
|
|
|
|
|
|
|
|
|
|
|
23
|
0.162
|
0.203
|
0.140
|
0.147
|
64
|
1.251
|
1.280
|
1.045
|
1.045
|
|
|
|
|
|
|
|
|
|
|
|
|
24
|
0.163
|
0.218
|
0.140
|
0.150
|
65
|
1.299
|
1.299
|
1.093
|
1.093
|
|
|
|
|
|
|
|
|
|
|
|
|
25
|
0.164
|
0.233
|
0.140
|
0.152
|
66
|
1.351
|
1.351
|
1.144
|
1.144
|
|
|
|
|
|
|
|
|
|
|
|
|
26
|
0.173
|
0.242
|
0.146
|
0.159
|
67
|
1.402
|
1.402
|
1.195
|
1.195
|
|
|
|
|
|
|
|
|
|
|
|
|
27
|
0.183
|
0.250
|
0.151
|
0.166
|
68
|
1.454
|
1.454
|
1.246
|
1.246
|
|
|
|
|
|
|
|
|
|
|
|
|
28
|
0.193
|
0.259
|
0.158
|
0.173
|
69
|
1.505
|
1.505
|
1.297
|
1.297
|
|
|
|
|
|
|
|
|
|
|
|
|
29
|
0.202
|
0.268
|
0.163
|
0.180
|
70
|
1.557
|
1.557
|
1.348
|
1.348
|
|
|
|
|
|
|
|
|
|
|
|
|
30
|
0.212
|
0.276
|
0.169
|
0.186
|
71
|
1.645
|
1.645
|
1.431
|
1.431
|
|
|
|
|
|
|
|
|
|
|
|
|
31
|
0.221
|
0.285
|
0.177
|
0.194
|
72
|
1.733
|
1.733
|
1.515
|
1.515
|
|
|
|
|
|
|
|
|
|
|
|
|
32
|
0.231
|
0.293
|
0.185
|
0.202
|
73
|
1.821
|
1.821
|
1.598
|
1.598
|
|
|
|
|
|
|
|
|
|
|
|
|
33
|
0.240
|
0.302
|
0.193
|
0.210
|
74
|
1.909
|
1.909
|
1.682
|
1.682
|
|
|
|
|
|
|
|
|
|
|
|
|
34
|
0.249
|
0.310
|
0.200
|
0.218
|
75
|
1.997
|
1.997
|
1.765
|
1.765
|
|
|
|
|
|
|
|
|
|
|
|
|
35
|
0.258
|
0.319
|
0.208
|
0.225
|
76
|
2.039
|
2.039
|
1.802
|
1.802
|
|
|
|
|
|
|
|
|
|
|
|
|
36
|
0.274
|
0.334
|
0.221
|
0.235
|
77
|
2.081
|
2.081
|
1.839
|
1.839
|
|
|
|
|
|
|
|
|
|
|
|
|
37
|
0.290
|
0.349
|
0.233
|
0.246
|
78
|
2.123
|
2.123
|
1.876
|
1.876
|
|
|
|
|
|
|
|
|
|
|
|
|
38
|
0.306
|
0.364
|
0.245
|
0.256
|
79
|
2.164
|
2.164
|
1.913
|
1.913
|
|
|
|
|
|
|
|
|
|
|
|
|
39
|
0.321
|
0.379
|
0.257
|
0.266
|
80
|
2.206
|
2.206
|
1.950
|
1.950
|
|
|
|
|
|
|
|
|
|
|
|
|
40
|
0.337
|
0.394
|
0.270
|
0.276
|
|||||
* Attained ages 0-20 are juvenile issues
This Table applies for Updated Policies issued only in the state of California.
|
GUARANTEED MAXIMUM MONTHLY UNDERWRITING
AND SALES EXPENSE CHARGE
|
|||||||||
|
Per $1,000 of Face Amount
|
|||||||||
|
Issue Age or
Attained
Age at
Increase
|
Male
Non-
Nicotine
|
Male
Nicotine*
|
Female
Non-
Nicotine
|
Female
Nicotine*
|
Issue Age or
Attained
Age at
Increase
|
Male
Non-
Nicotine
|
Male
Nicotine*
|
Female
Non-
Nicotine
|
Female
Nicotine*
|
|
|
|
|
|
|
|
|
|
|
|
|
0
|
N/A
|
0.075
|
N/A
|
0.072
|
41
|
0.352
|
0.415
|
0.281
|
0.287
|
|
|
|
|
|
|
|
|
|
|
|
|
1
|
N/A
|
0.076
|
N/A
|
0.072
|
42
|
0.368
|
0.436
|
0.292
|
0.298
|
|
|
|
|
|
|
|
|
|
|
|
|
2
|
N/A
|
0.077
|
N/A
|
0.073
|
43
|
0.383
|
0.457
|
0.303
|
0.310
|
|
|
|
|
|
|
|
|
|
|
|
|
3
|
N/A
|
0.078
|
N/A
|
0.074
|
44
|
0.398
|
0.478
|
0.314
|
0.321
|
|
|
|
|
|
|
|
|
|
|
|
|
4
|
N/A
|
0.079
|
N/A
|
0.075
|
45
|
0.414
|
0.499
|
0.325
|
0.332
|
|
|
|
|
|
|
|
|
|
|
|
|
5
|
N/A
|
0.080
|
N/A
|
0.076
|
46
|
0.441
|
0.532
|
0.346
|
0.352
|
|
|
|
|
|
|
|
|
|
|
|
|
6
|
N/A
|
0.083
|
N/A
|
0.078
|
47
|
0.468
|
0.564
|
0.367
|
0.371
|
|
|
|
|
|
|
|
|
|
|
|
|
7
|
N/A
|
0.085
|
N/A
|
0.081
|
48
|
0.495
|
0.597
|
0.388
|
0.391
|
|
|
|
|
|
|
|
|
|
|
|
|
8
|
N/A
|
0.088
|
N/A
|
0.083
|
49
|
0.522
|
0.629
|
0.409
|
0.411
|
|
|
|
|
|
|
|
|
|
|
|
|
9
|
N/A
|
0.091
|
N/A
|
0.086
|
50
|
0.549
|
0.662
|
0.430
|
0.430
|
|
|
|
|
|
|
|
|
|
|
|
|
10
|
N/A
|
0.093
|
N/A
|
0.088
|
51
|
0.591
|
0.707
|
0.461
|
0.461
|
|
|
|
|
|
|
|
|
|
|
|
|
11
|
N/A
|
0.098
|
N/A
|
0.092
|
52
|
0.632
|
0.753
|
0.491
|
0.492
|
|
|
|
|
|
|
|
|
|
|
|
|
12
|
N/A
|
0.103
|
N/A
|
0.097
|
53
|
0.673
|
0.794
|
0.522
|
0.523
|
|
|
|
|
|
|
|
|
|
|
|
|
13
|
N/A
|
0.108
|
N/A
|
0.101
|
54
|
0.714
|
0.801
|
0.553
|
0.553
|
|
|
|
|
|
|
|
|
|
|
|
|
14
|
N/A
|
0.113
|
N/A
|
0.106
|
55
|
0.722
|
0.810
|
0.584
|
0.584
|
|
|
|
|
|
|
|
|
|
|
|
|
15
|
N/A
|
0.118
|
N/A
|
0.110
|
56
|
0.738
|
0.821
|
0.638
|
0.638
|
|
|
|
|
|
|
|
|
|
|
|
|
16
|
N/A
|
0.126
|
N/A
|
0.116
|
57
|
0.753
|
0.827
|
0.693
|
0.693
|
|
|
|
|
|
|
|
|
|
|
|
|
17
|
N/A
|
0.134
|
N/A
|
0.122
|
58
|
0.761
|
0.828
|
0.747
|
0.747
|
|
|
|
|
|
|
|
|
|
|
|
|
18
|
N/A
|
0.142
|
N/A
|
0.128
|
59
|
0.783
|
0.836
|
0.756
|
0.801
|
|
|
|
|
|
|
|
|
|
|
|
|
19
|
N/A
|
0.150
|
N/A
|
0.134
|
60
|
0.798
|
0.880
|
0.760
|
0.855
|
|
|
|
|
|
|
|
|
|
|
|
|
20
|
N/A
|
0.158
|
N/A
|
0.140
|
61
|
0.811
|
0.927
|
0.769
|
0.903
|
|
|
|
|
|
|
|
|
|
|
|
|
21
|
0.159
|
0.173
|
0.140
|
0.142
|
62
|
0.823
|
0.971
|
0.782
|
0.950
|
|
|
|
|
|
|
|
|
|
|
|
|
22
|
0.161
|
0.188
|
0.140
|
0.145
|
63
|
0.835
|
0.969
|
0.796
|
0.998
|
|
|
|
|
|
|
|
|
|
|
|
|
23
|
0.162
|
0.203
|
0.140
|
0.147
|
64
|
0.847
|
0.940
|
0.808
|
1.045
|
|
|
|
|
|
|
|
|
|
|
|
|
24
|
0.163
|
0.218
|
0.140
|
0.150
|
65
|
0.858
|
0.911
|
0.821
|
1.050
|
|
|
|
|
|
|
|
|
|
|
|
|
25
|
0.164
|
0.233
|
0.140
|
0.152
|
66
|
0.869
|
0.881
|
0.834
|
1.023
|
|
|
|
|
|
|
|
|
|
|
|
|
26
|
0.173
|
0.242
|
0.146
|
0.159
|
67
|
0.880
|
0.850
|
0.846
|
0.997
|
|
|
|
|
|
|
|
|
|
|
|
|
27
|
0.183
|
0.250
|
0.151
|
0.166
|
68
|
0.907
|
0.847
|
0.857
|
0.969
|
|
|
|
|
|
|
|
|
|
|
|
|
28
|
0.193
|
0.259
|
0.158
|
0.173
|
69
|
0.916
|
0.854
|
0.870
|
0.940
|
|
|
|
|
|
|
|
|
|
|
|
|
29
|
0.202
|
0.268
|
0.163
|
0.180
|
70
|
0.921
|
0.864
|
0.894
|
0.910
|
|
|
|
|
|
|
|
|
|
|
|
|
30
|
0.212
|
0.276
|
0.169
|
0.186
|
71
|
0.931
|
0.879
|
0.918
|
0.878
|
|
|
|
|
|
|
|
|
|
|
|
|
31
|
0.221
|
0.285
|
0.177
|
0.194
|
72
|
0.942
|
0.897
|
0.914
|
0.874
|
|
|
|
|
|
|
|
|
|
|
|
|
32
|
0.231
|
0.293
|
0.185
|
0.202
|
73
|
0.954
|
0.915
|
0.922
|
0.884
|
|
|
|
|
|
|
|
|
|
|
|
|
33
|
0.240
|
0.302
|
0.193
|
0.210
|
74
|
0.962
|
0.931
|
0.931
|
0.892
|
|
|
|
|
|
|
|
|
|
|
|
|
34
|
0.249
|
0.310
|
0.200
|
0.218
|
75
|
0.972
|
0.949
|
0.939
|
0.899
|
|
|
|
|
|
|
|
|
|
|
|
|
35
|
0.258
|
0.319
|
0.208
|
0.225
|
76
|
0.973
|
0.954
|
0.939
|
0.898
|
|
|
|
|
|
|
|
|
|
|
|
|
36
|
0.274
|
0.334
|
0.221
|
0.235
|
77
|
0.975
|
0.960
|
0.940
|
0.897
|
|
|
|
|
|
|
|
|
|
|
|
|
37
|
0.290
|
0.349
|
0.233
|
0.246
|
78
|
0.976
|
0.963
|
0.942
|
0.898
|
|
|
|
|
|
|
|
|
|
|
|
|
38
|
0.306
|
0.364
|
0.245
|
0.256
|
79
|
0.984
|
0.962
|
0.957
|
0.916
|
|
|
|
|
|
|
|
|
|
|
|
|
39
|
0.321
|
0.379
|
0.257
|
0.266
|
80
|
0.991
|
0.964
|
0.948
|
0.910
|
|
|
|
|
|
|
|
|
|
|
|
|
40
|
0.337
|
0.394
|
0.270
|
0.276
|
|||||
* Attained ages 0-20 are juvenile issues
Appendix D: Table of Surrender Charge Factors
These tables apply for Prior Policies.
|
TABLE OF SURRENDER CHARGE FACTORS
|
|||||||||||||||||||
|
Male Non-Nicotine (Premier, Preferred, & Standard)
|
|||||||||||||||||||
|
Number of Full Policy Years Completed Since the Issue Date or Since Increase in Face Amount
|
|||||||||||||||||||
|
Issue
Age
|
0
|
1
|
2
|
3
|
4
|
5
|
6
|
7
|
8
|
9 or
more
|
|||||||||
|
|
|
|
|
|
|
|
|
|
|
|
|||||||||
|
21
|
5.22
|
4.96
|
4.65
|
4.38
|
4.12
|
3.86
|
3.29
|
2.19
|
1.10
|
0.00
|
|||||||||
|
|
|
|
|
|
|
|
|
|
|
|
|||||||||
|
22
|
5.33
|
5.06
|
4.74
|
4.48
|
4.21
|
3.94
|
3.36
|
2.24
|
1.12
|
0.00
|
|||||||||
|
|
|
|
|
|
|
|
|
|
|
|
|||||||||
|
23
|
5.47
|
5.20
|
4.87
|
4.59
|
4.32
|
4.05
|
3.45
|
2.30
|
1.15
|
0.00
|
|||||||||
|
|
|
|
|
|
|
|
|
|
|
|
|||||||||
|
24
|
5.63
|
5.35
|
5.01
|
4.73
|
4.45
|
4.17
|
3.55
|
2.36
|
1.18
|
0.00
|
|||||||||
|
|
|
|
|
|
|
|
|
|
|
|
|||||||||
|
25
|
5.83
|
5.54
|
5.19
|
4.90
|
4.61
|
4.31
|
3.67
|
2.45
|
1.22
|
0.00
|
|||||||||
|
|
|
|
|
|
|
|
|
|
|
|
|||||||||
|
26
|
6.11
|
5.80
|
5.44
|
5.13
|
4.83
|
4.52
|
3.85
|
2.57
|
1.28
|
0.00
|
|||||||||
|
|
|
|
|
|
|
|
|
|
|
|
|||||||||
|
27
|
6.48
|
6.16
|
5.77
|
5.44
|
5.12
|
4.80
|
4.08
|
2.72
|
1.36
|
0.00
|
|||||||||
|
|
|
|
|
|
|
|
|
|
|
|
|||||||||
|
28
|
6.92
|
6.57
|
6.16
|
5.81
|
5.47
|
5.12
|
4.36
|
2.91
|
1.45
|
0.00
|
|||||||||
|
|
|
|
|
|
|
|
|
|
|
|
|||||||||
|
29
|
7.35
|
6.98
|
6.54
|
6.17
|
5.81
|
5.44
|
4.63
|
3.09
|
1.54
|
0.00
|
|||||||||
|
|
|
|
|
|
|
|
|
|
|
|
|||||||||
|
30
|
7.78
|
7.39
|
6.92
|
6.54
|
6.15
|
5.76
|
4.90
|
3.27
|
1.63
|
0.00
|
|||||||||
|
|
|
|
|
|
|
|
|
|
|
|
|||||||||
|
31
|
8.22
|
7.81
|
7.32
|
6.90
|
6.49
|
6.08
|
5.18
|
3.45
|
1.73
|
0.00
|
|||||||||
|
|
|
|
|
|
|
|
|
|
|
|
|||||||||
|
32
|
8.67
|
8.24
|
7.72
|
7.28
|
6.85
|
6.42
|
5.46
|
3.64
|
1.82
|
0.00
|
|||||||||
|
|
|
|
|
|
|
|
|
|
|
|
|||||||||
|
33
|
9.13
|
8.67
|
8.13
|
7.67
|
7.21
|
6.76
|
5.75
|
3.83
|
1.92
|
0.00
|
|||||||||
|
|
|
|
|
|
|
|
|
|
|
|
|||||||||
|
34
|
9.59
|
9.11
|
8.54
|
8.06
|
7.58
|
7.10
|
6.04
|
4.03
|
2.01
|
0.00
|
|||||||||
|
|
|
|
|
|
|
|
|
|
|
|
|||||||||
|
35
|
10.06
|
9.56
|
8.95
|
8.45
|
7.95
|
7.44
|
6.34
|
4.23
|
2.11
|
0.00
|
|||||||||
|
|
|
|
|
|
|
|
|
|
|
|
|||||||||
|
36
|
10.63
|
10.10
|
9.46
|
8.93
|
8.40
|
7.87
|
6.70
|
4.46
|
2.23
|
0.00
|
|||||||||
|
|
|
|
|
|
|
|
|
|
|
|
|||||||||
|
37
|
11.28
|
10.72
|
10.04
|
9.48
|
8.91
|
8.35
|
7.11
|
4.74
|
2.37
|
0.00
|
|||||||||
|
|
|
|
|
|
|
|
|
|
|
|
|||||||||
|
38
|
11.94
|
11.34
|
10.63
|
10.03
|
9.43
|
8.84
|
7.52
|
5.01
|
2.51
|
0.00
|
|||||||||
|
|
|
|
|
|
|
|
|
|
|
|
|||||||||
|
39
|
12.60
|
11.97
|
11.21
|
10.58
|
9.95
|
9.32
|
7.94
|
5.29
|
2.65
|
0.00
|
|||||||||
|
|
|
|
|
|
|
|
|
|
|
|
|||||||||
|
40
|
13.25
|
12.59
|
11.79
|
11.13
|
10.47
|
9.81
|
8.35
|
5.57
|
2.78
|
0.00
|
|||||||||
|
|
|
|
|
|
|
|
|
|
|
|
|||||||||
|
41
|
13.85
|
13.16
|
12.33
|
11.63
|
10.94
|
10.25
|
8.73
|
5.82
|
2.91
|
0.00
|
|||||||||
|
|
|
|
|
|
|
|
|
|
|
|
|||||||||
|
42
|
14.43
|
13.71
|
12.84
|
12.12
|
11.40
|
10.68
|
9.09
|
6.06
|
3.03
|
0.00
|
|||||||||
|
|
|
|
|
|
|
|
|
|
|
|
|||||||||
|
43
|
15.09
|
14.34
|
13.43
|
12.68
|
11.92
|
11.17
|
9.51
|
6.34
|
3.17
|
0.00
|
|||||||||
|
|
|
|
|
|
|
|
|
|
|
|
|||||||||
|
44
|
15.74
|
14.95
|
14.01
|
13.22
|
12.43
|
11.65
|
9.92
|
6.61
|
3.31
|
0.00
|
|||||||||
|
|
|
|
|
|
|
|
|
|
|
|
|||||||||
|
45
|
16.26
|
15.45
|
14.47
|
13.66
|
12.85
|
12.03
|
10.24
|
6.83
|
3.41
|
0.00
|
|||||||||
|
|
|
|
|
|
|
|
|
|
|
|
|||||||||
|
46
|
16.76
|
15.92
|
14.92
|
14.08
|
13.24
|
12.40
|
10.56
|
7.04
|
3.52
|
0.00
|
|||||||||
|
|
|
|
|
|
|
|
|
|
|
|
|||||||||
|
47
|
17.48
|
16.61
|
15.56
|
14.68
|
13.81
|
12.94
|
11.01
|
7.34
|
3.67
|
0.00
|
|||||||||
|
|
|
|
|
|
|
|
|
|
|
|
|||||||||
|
48
|
18.37
|
17.45
|
16.35
|
15.43
|
14.51
|
13.59
|
11.57
|
7.72
|
3.86
|
0.00
|
|||||||||
|
|
|
|
|
|
|
|
|
|
|
|
|||||||||
|
49
|
19.41
|
18.44
|
17.27
|
16.30
|
15.33
|
14.36
|
12.23
|
8.15
|
4.08
|
0.00
|
|||||||||
|
|
|
|
|
|
|
|
|
|
|
|
|||||||||
|
50
|
20.60
|
19.57
|
18.33
|
17.30
|
16.27
|
15.24
|
12.98
|
8.65
|
4.33
|
0.00
|
|||||||||
|
|
|
|
|
|
|
|
|
|
|
|
|||||||||
|
51
|
21.81
|
20.72
|
19.41
|
18.32
|
17.23
|
16.14
|
13.74
|
9.16
|
4.58
|
0.00
|
|||||||||
|
|
|
|
|
|
|
|
|
|
|
|
|||||||||
|
52
|
22.91
|
21.76
|
20.39
|
19.24
|
18.10
|
16.95
|
14.43
|
9.62
|
4.81
|
0.00
|
|||||||||
|
|
|
|
|
|
|
|
|
|
|
|
|||||||||
|
53
|
24.04
|
22.84
|
21.40
|
20.19
|
18.99
|
17.79
|
15.15
|
10.10
|
5.05
|
0.00
|
|||||||||
|
|
|
|
|
|
|
|
|
|
|
|
|||||||||
|
54
|
25.27
|
24.01
|
22.49
|
21.23
|
19.96
|
18.70
|
15.92
|
10.61
|
5.31
|
0.00
|
|||||||||
|
|
|
|
|
|
|
|
|
|
|
|
|||||||||
|
55
|
26.43
|
25.11
|
23.52
|
22.20
|
20.88
|
19.56
|
16.65
|
11.10
|
5.55
|
0.00
|
|||||||||
|
|
|
|
|
|
|
|
|
|
|
|
|||||||||
|
56
|
27.53
|
26.15
|
24.50
|
23.13
|
21.75
|
20.37
|
17.34
|
11.56
|
5.78
|
0.00
|
|||||||||
|
|
|
|
|
|
|
|
|
|
|
|
|||||||||
|
57
|
28.84
|
27.40
|
25.67
|
24.23
|
22.78
|
21.34
|
18.17
|
12.11
|
6.06
|
0.00
|
|||||||||
|
|
|
|
|
|
|
|
|
|
|
|
|||||||||
|
58
|
30.45
|
28.93
|
27.10
|
25.58
|
24.06
|
22.53
|
19.18
|
12.79
|
6.39
|
0.00
|
|||||||||
|
TABLE OF SURRENDER CHARGE FACTORS
|
|||||||||||||||||||
|
Male Non-Nicotine (Premier, Preferred, & Standard)
|
|||||||||||||||||||
|
Number of Full Policy Years Completed Since the Issue Date or Since Increase in Face Amount
|
|||||||||||||||||||
|
Issue
Age
|
0
|
1
|
2
|
3
|
4
|
5
|
6
|
7
|
8
|
9 or
more
|
|||||||||
|
|
|
|
|
|
|
|
|
|
|
|
|||||||||
|
59
|
32.22
|
30.61
|
28.68
|
27.06
|
25.45
|
23.84
|
20.30
|
13.53
|
6.77
|
0.00
|
|||||||||
|
|
|
|
|
|
|
|
|
|
|
|
|||||||||
|
60
|
33.90
|
32.21
|
30.17
|
28.48
|
26.78
|
25.09
|
21.36
|
14.24
|
7.12
|
0.00
|
|||||||||
|
|
|
|
|
|
|
|
|
|
|
|
|||||||||
|
61
|
35.40
|
33.63
|
31.51
|
29.74
|
27.97
|
26.20
|
22.30
|
14.87
|
7.43
|
0.00
|
|||||||||
|
|
|
|
|
|
|
|
|
|
|
|
|||||||||
|
62
|
36.90
|
35.06
|
32.84
|
31.00
|
29.15
|
27.31
|
23.25
|
15.50
|
7.75
|
0.00
|
|||||||||
|
|
|
|
|
|
|
|
|
|
|
|
|||||||||
|
63
|
38.40
|
36.48
|
34.18
|
32.26
|
30.34
|
28.42
|
24.19
|
16.13
|
8.06
|
0.00
|
|||||||||
|
|
|
|
|
|
|
|
|
|
|
|
|||||||||
|
64
|
39.90
|
37.91
|
35.51
|
33.52
|
31.52
|
29.53
|
25.14
|
16.76
|
8.38
|
0.00
|
|||||||||
|
|
|
|
|
|
|
|
|
|
|
|
|||||||||
|
65
|
41.40
|
39.33
|
36.85
|
34.78
|
32.71
|
30.64
|
26.08
|
17.39
|
8.69
|
0.00
|
|||||||||
|
|
|
|
|
|
|
|
|
|
|
|
|||||||||
|
66
|
42.90
|
40.76
|
38.18
|
36.04
|
33.89
|
31.75
|
27.03
|
18.02
|
9.01
|
0.00
|
|||||||||
|
|
|
|
|
|
|
|
|
|
|
|
|||||||||
|
67
|
44.40
|
42.18
|
39.52
|
37.30
|
35.08
|
32.86
|
27.97
|
18.65
|
9.32
|
0.00
|
|||||||||
|
|
|
|
|
|
|
|
|
|
|
|
|||||||||
|
68
|
44.40
|
42.18
|
39.51
|
37.29
|
35.07
|
32.85
|
27.97
|
18.64
|
9.32
|
0.00
|
|||||||||
|
|
|
|
|
|
|
|
|
|
|
|
|||||||||
|
69
|
43.90
|
41.70
|
39.07
|
36.87
|
34.68
|
32.48
|
27.65
|
18.43
|
9.21
|
0.00
|
|||||||||
|
|
|
|
|
|
|
|
|
|
|
|
|||||||||
|
70
|
43.30
|
41.13
|
38.53
|
36.37
|
34.20
|
32.04
|
27.27
|
18.18
|
9.09
|
0.00
|
|||||||||
|
|
|
|
|
|
|
|
|
|
|
|
|||||||||
|
71
|
42.50
|
40.37
|
37.82
|
35.70
|
33.57
|
31.45
|
26.77
|
17.85
|
8.92
|
0.00
|
|||||||||
|
|
|
|
|
|
|
|
|
|
|
|
|||||||||
|
72
|
41.60
|
39.52
|
37.02
|
34.94
|
32.86
|
30.78
|
26.20
|
17.47
|
8.73
|
0.00
|
|||||||||
|
|
|
|
|
|
|
|
|
|
|
|
|||||||||
|
73
|
40.70
|
38.66
|
36.22
|
34.18
|
32.15
|
30.11
|
25.64
|
17.09
|
8.54
|
0.00
|
|||||||||
|
|
|
|
|
|
|
|
|
|
|
|
|||||||||
|
74
|
39.90
|
37.90
|
35.51
|
33.51
|
31.52
|
29.52
|
25.13
|
16.75
|
8.37
|
0.00
|
|||||||||
|
|
|
|
|
|
|
|
|
|
|
|
|||||||||
|
75
|
39.00
|
37.05
|
34.71
|
32.76
|
30.81
|
28.86
|
24.57
|
16.38
|
8.19
|
0.00
|
|||||||||
|
|
|
|
|
|
|
|
|
|
|
|
|||||||||
|
76
|
38.60
|
36.67
|
34.35
|
32.42
|
30.49
|
28.56
|
24.31
|
16.21
|
8.10
|
0.00
|
|||||||||
|
|
|
|
|
|
|
|
|
|
|
|
|||||||||
|
77
|
38.10
|
36.19
|
33.90
|
32.00
|
30.09
|
28.19
|
24.00
|
16.00
|
8.00
|
0.00
|
|||||||||
|
|
|
|
|
|
|
|
|
|
|
|
|||||||||
|
78
|
37.60
|
35.72
|
33.46
|
31.58
|
29.70
|
27.82
|
23.68
|
15.79
|
7.89
|
0.00
|
|||||||||
|
|
|
|
|
|
|
|
|
|
|
|
|||||||||
|
79
|
37.20
|
35.34
|
33.10
|
31.24
|
29.38
|
27.52
|
23.43
|
15.62
|
7.81
|
0.00
|
|||||||||
|
|
|
|
|
|
|
|
|
|
|
|
|||||||||
|
80
|
36.70
|
34.86
|
32.66
|
30.82
|
28.99
|
27.15
|
23.12
|
15.41
|
7.70
|
0.00
|
|||||||||
|
TABLE OF SURRENDER CHARGE FACTORS
|
|||||||||||||||||||||||||||||||
|
Male Nicotine (Ages 0-20 are juvenile issues.)
|
|||||||||||||||||||||||||||||||
|
Number of Full Policy Years Completed Since the Issue Date or Since Increase in Face Amount
|
|||||||||||||||||||||||||||||||
|
Issue
Age
|
0
|
1
|
2
|
3
|
4
|
5
|
6
|
7
|
8
|
9 or
more
|
|||||||||||||||||||||
|
|
|
|
|
|
|
|
|
|
|
|
|||||||||||||||||||||
|
0
|
3.27
|
3.11
|
2.91
|
2.75
|
2.58
|
2.42
|
2.06
|
1.37
|
0.69
|
0.00
|
|||||||||||||||||||||
|
|
|
|
|
|
|
|
|
|
|
|
|||||||||||||||||||||
|
1
|
3.30
|
3.14
|
2.94
|
2.77
|
2.61
|
2.44
|
2.08
|
1.39
|
0.69
|
0.00
|
|||||||||||||||||||||
|
|
|
|
|
|
|
|
|
|
|
|
|||||||||||||||||||||
|
2
|
3.36
|
3.19
|
2.99
|
2.82
|
2.65
|
2.49
|
2.12
|
1.41
|
0.71
|
0.00
|
|||||||||||||||||||||
|
|
|
|
|
|
|
|
|
|
|
|
|||||||||||||||||||||
|
3
|
3.44
|
3.27
|
3.06
|
2.89
|
2.72
|
2.55
|
2.17
|
1.44
|
0.72
|
0.00
|
|||||||||||||||||||||
|
|
|
|
|
|
|
|
|
|
|
|
|||||||||||||||||||||
|
4
|
3.51
|
3.33
|
3.12
|
2.95
|
2.77
|
2.60
|
2.21
|
1.47
|
0.74
|
0.00
|
|||||||||||||||||||||
|
|
|
|
|
|
|
|
|
|
|
|
|||||||||||||||||||||
|
5
|
3.60
|
3.42
|
3.20
|
3.02
|
2.84
|
2.66
|
2.27
|
1.51
|
0.76
|
0.00
|
|||||||||||||||||||||
|
|
|
|
|
|
|
|
|
|
|
|
|||||||||||||||||||||
|
6
|
3.68
|
3.50
|
3.28
|
3.09
|
2.91
|
2.72
|
2.32
|
1.55
|
0.77
|
0.00
|
|||||||||||||||||||||
|
|
|
|
|
|
|
|
|
|
|
|
|||||||||||||||||||||
|
7
|
3.78
|
3.59
|
3.36
|
3.18
|
2.99
|
2.80
|
2.38
|
1.59
|
0.79
|
0.00
|
|||||||||||||||||||||
|
|
|
|
|
|
|
|
|
|
|
|
|||||||||||||||||||||
|
8
|
3.88
|
3.69
|
3.45
|
3.26
|
3.07
|
2.87
|
2.44
|
1.63
|
0.81
|
0.00
|
|||||||||||||||||||||
|
|
|
|
|
|
|
|
|
|
|
|
|||||||||||||||||||||
|
9
|
3.98
|
3.78
|
3.54
|
3.34
|
3.14
|
2.95
|
2.51
|
1.67
|
0.84
|
0.00
|
|||||||||||||||||||||
|
|
|
|
|
|
|
|
|
|
|
|
|||||||||||||||||||||
|
10
|
4.09
|
3.89
|
3.64
|
3.44
|
3.23
|
3.03
|
2.58
|
1.72
|
0.86
|
0.00
|
|||||||||||||||||||||
|
|
|
|
|
|
|
|
|
|
|
|
|||||||||||||||||||||
|
11
|
4.17
|
3.96
|
3.71
|
3.50
|
3.29
|
3.09
|
2.63
|
1.75
|
0.88
|
0.00
|
|||||||||||||||||||||
|
|
|
|
|
|
|
|
|
|
|
|
|||||||||||||||||||||
|
12
|
4.26
|
4.05
|
3.79
|
3.58
|
3.37
|
3.15
|
2.68
|
1.79
|
0.89
|
0.00
|
|||||||||||||||||||||
|
|
|
|
|
|
|
|
|
|
|
|
|||||||||||||||||||||
|
13
|
4.34
|
4.12
|
3.86
|
3.65
|
3.43
|
3.21
|
2.73
|
1.82
|
0.91
|
0.00
|
|||||||||||||||||||||
|
TABLE OF SURRENDER CHARGE FACTORS
|
|||||||||||||||||||||||||||||||
|
Male Nicotine (Ages 0-20 are juvenile issues.)
|
|||||||||||||||||||||||||||||||
|
Number of Full Policy Years Completed Since the Issue Date or Since Increase in Face Amount
|
|||||||||||||||||||||||||||||||
|
Issue
Age
|
0
|
1
|
2
|
3
|
4
|
5
|
6
|
7
|
8
|
9 or
more
|
|||||||||||||||||||||
|
|
|
|
|
|
|
|
|
|
|
|
|||||||||||||||||||||
|
14
|
4.43
|
4.21
|
3.94
|
3.72
|
3.50
|
3.28
|
2.79
|
1.86
|
0.93
|
0.00
|
|||||||||||||||||||||
|
|
|
|
|
|
|
|
|
|
|
|
|||||||||||||||||||||
|
15
|
4.52
|
4.29
|
4.02
|
3.80
|
3.57
|
3.34
|
2.85
|
1.90
|
0.95
|
0.00
|
|||||||||||||||||||||
|
|
|
|
|
|
|
|
|
|
|
|
|||||||||||||||||||||
|
16
|
4.63
|
4.40
|
4.12
|
3.89
|
3.66
|
3.43
|
2.92
|
1.94
|
0.97
|
0.00
|
|||||||||||||||||||||
|
|
|
|
|
|
|
|
|
|
|
|
|||||||||||||||||||||
|
17
|
4.75
|
4.51
|
4.23
|
3.99
|
3.75
|
3.52
|
2.99
|
2.00
|
1.00
|
0.00
|
|||||||||||||||||||||
|
|
|
|
|
|
|
|
|
|
|
|
|||||||||||||||||||||
|
18
|
4.87
|
4.63
|
4.33
|
4.09
|
3.85
|
3.60
|
3.07
|
2.05
|
1.02
|
0.00
|
|||||||||||||||||||||
|
|
|
|
|
|
|
|
|
|
|
|
|||||||||||||||||||||
|
19
|
5.00
|
4.75
|
4.45
|
4.20
|
3.95
|
3.70
|
3.15
|
2.10
|
1.05
|
0.00
|
|||||||||||||||||||||
|
|
|
|
|
|
|
|
|
|
|
|
|||||||||||||||||||||
|
20
|
5.13
|
4.87
|
4.57
|
4.31
|
4.05
|
3.80
|
3.23
|
2.15
|
1.08
|
0.00
|
|||||||||||||||||||||
|
|
|
|
|
|
|
|
|
|
|
|
|||||||||||||||||||||
|
21
|
7.23
|
6.87
|
6.43
|
6.07
|
5.71
|
5.35
|
4.55
|
3.04
|
1.52
|
0.00
|
|||||||||||||||||||||
|
|
|
|
|
|
|
|
|
|
|
|
|||||||||||||||||||||
|
22
|
7.46
|
7.09
|
6.64
|
6.27
|
5.89
|
5.52
|
4.70
|
3.13
|
1.57
|
0.00
|
|||||||||||||||||||||
|
|
|
|
|
|
|
|
|
|
|
|
|||||||||||||||||||||
|
23
|
7.67
|
7.29
|
6.83
|
6.44
|
6.06
|
5.68
|
4.83
|
3.22
|
1.61
|
0.00
|
|||||||||||||||||||||
|
|
|
|
|
|
|
|
|
|
|
|
|||||||||||||||||||||
|
24
|
7.87
|
7.48
|
7.00
|
6.61
|
6.22
|
5.82
|
4.96
|
3.31
|
1.65
|
0.00
|
|||||||||||||||||||||
|
|
|
|
|
|
|
|
|
|
|
|
|||||||||||||||||||||
|
25
|
8.10
|
7.70
|
7.21
|
6.80
|
6.40
|
5.99
|
5.10
|
3.40
|
1.70
|
0.00
|
|||||||||||||||||||||
|
|
|
|
|
|
|
|
|
|
|
|
|||||||||||||||||||||
|
26
|
8.39
|
7.97
|
7.47
|
7.05
|
6.63
|
6.21
|
5.29
|
3.52
|
1.76
|
0.00
|
|||||||||||||||||||||
|
|
|
|
|
|
|
|
|
|
|
|
|||||||||||||||||||||
|
27
|
8.77
|
8.33
|
7.81
|
7.37
|
6.93
|
6.49
|
5.53
|
3.68
|
1.84
|
0.00
|
|||||||||||||||||||||
|
|
|
|
|
|
|
|
|
|
|
|
|||||||||||||||||||||
|
28
|
9.20
|
8.74
|
8.19
|
7.73
|
7.27
|
6.81
|
5.80
|
3.86
|
1.93
|
0.00
|
|||||||||||||||||||||
|
|
|
|
|
|
|
|
|
|
|
|
|||||||||||||||||||||
|
29
|
9.61
|
9.13
|
8.55
|
8.07
|
7.59
|
7.11
|
6.05
|
4.04
|
2.02
|
0.00
|
|||||||||||||||||||||
|
|
|
|
|
|
|
|
|
|
|
|
|||||||||||||||||||||
|
30
|
10.01
|
9.51
|
8.91
|
8.41
|
7.91
|
7.41
|
6.31
|
4.20
|
2.10
|
0.00
|
|||||||||||||||||||||
|
|
|
|
|
|
|
|
|
|
|
|
|||||||||||||||||||||
|
31
|
10.42
|
9.90
|
9.27
|
8.75
|
8.23
|
7.71
|
6.56
|
4.38
|
2.19
|
0.00
|
|||||||||||||||||||||
|
|
|
|
|
|
|
|
|
|
|
|
|||||||||||||||||||||
|
32
|
10.85
|
10.31
|
9.66
|
9.11
|
8.57
|
8.03
|
6.84
|
4.56
|
2.28
|
0.00
|
|||||||||||||||||||||
|
|
|
|
|
|
|
|
|
|
|
|
|||||||||||||||||||||
|
33
|
11.31
|
10.74
|
10.07
|
9.50
|
8.93
|
8.37
|
7.13
|
4.75
|
2.38
|
0.00
|
|||||||||||||||||||||
|
|
|
|
|
|
|
|
|
|
|
|
|||||||||||||||||||||
|
34
|
11.80
|
11.21
|
10.50
|
9.91
|
9.32
|
8.73
|
7.43
|
4.96
|
2.48
|
0.00
|
|||||||||||||||||||||
|
|
|
|
|
|
|
|
|
|
|
|
|||||||||||||||||||||
|
35
|
12.32
|
11.70
|
10.96
|
10.35
|
9.73
|
9.12
|
7.76
|
5.17
|
2.59
|
0.00
|
|||||||||||||||||||||
|
|
|
|
|
|
|
|
|
|
|
|
|||||||||||||||||||||
|
36
|
12.86
|
12.22
|
11.45
|
10.80
|
10.16
|
9.52
|
8.10
|
5.40
|
2.70
|
0.00
|
|||||||||||||||||||||
|
|
|
|
|
|
|
|
|
|
|
|
|||||||||||||||||||||
|
37
|
13.44
|
12.77
|
11.96
|
11.29
|
10.62
|
9.95
|
8.47
|
5.64
|
2.82
|
0.00
|
|||||||||||||||||||||
|
|
|
|
|
|
|
|
|
|
|
|
|||||||||||||||||||||
|
38
|
14.05
|
13.35
|
12.50
|
11.80
|
11.10
|
10.40
|
8.85
|
5.90
|
2.95
|
0.00
|
|||||||||||||||||||||
|
|
|
|
|
|
|
|
|
|
|
|
|||||||||||||||||||||
|
39
|
14.70
|
13.97
|
13.08
|
12.35
|
11.61
|
10.88
|
9.26
|
6.17
|
3.09
|
0.00
|
|||||||||||||||||||||
|
|
|
|
|
|
|
|
|
|
|
|
|||||||||||||||||||||
|
40
|
15.43
|
14.66
|
13.73
|
12.96
|
12.19
|
11.42
|
9.72
|
6.48
|
3.24
|
0.00
|
|||||||||||||||||||||
|
|
|
|
|
|
|
|
|
|
|
|
|||||||||||||||||||||
|
41
|
16.22
|
15.41
|
14.44
|
13.62
|
12.81
|
12.00
|
10.22
|
6.81
|
3.41
|
0.00
|
|||||||||||||||||||||
|
|
|
|
|
|
|
|
|
|
|
|
|||||||||||||||||||||
|
42
|
17.02
|
16.17
|
15.15
|
14.30
|
13.45
|
12.59
|
10.72
|
7.15
|
3.57
|
0.00
|
|||||||||||||||||||||
|
|
|
|
|
|
|
|
|
|
|
|
|||||||||||||||||||||
|
43
|
17.83
|
16.94
|
15.87
|
14.98
|
14.09
|
13.19
|
11.23
|
7.49
|
3.74
|
0.00
|
|||||||||||||||||||||
|
|
|
|
|
|
|
|
|
|
|
|
|||||||||||||||||||||
|
44
|
18.67
|
17.74
|
16.62
|
15.68
|
14.75
|
13.82
|
11.76
|
7.84
|
3.92
|
0.00
|
|||||||||||||||||||||
|
|
|
|
|
|
|
|
|
|
|
|
|||||||||||||||||||||
|
45
|
19.55
|
18.57
|
17.40
|
16.42
|
15.44
|
14.47
|
12.32
|
8.21
|
4.11
|
0.00
|
|||||||||||||||||||||
|
|
|
|
|
|
|
|
|
|
|
|
|||||||||||||||||||||
|
46
|
20.47
|
19.45
|
18.22
|
17.19
|
16.17
|
15.15
|
12.90
|
8.60
|
4.30
|
0.00
|
|||||||||||||||||||||
|
|
|
|
|
|
|
|
|
|
|
|
|||||||||||||||||||||
|
47
|
21.43
|
20.36
|
19.07
|
18.00
|
16.93
|
15.86
|
13.50
|
9.00
|
4.50
|
0.00
|
|||||||||||||||||||||
|
|
|
|
|
|
|
|
|
|
|
|
|||||||||||||||||||||
|
48
|
22.46
|
21.34
|
19.99
|
18.87
|
17.74
|
16.62
|
14.15
|
9.43
|
4.72
|
0.00
|
|||||||||||||||||||||
|
|
|
|
|
|
|
|
|
|
|
|
|||||||||||||||||||||
|
49
|
23.59
|
22.41
|
21.00
|
19.82
|
18.64
|
17.46
|
14.86
|
9.91
|
4.95
|
0.00
|
|||||||||||||||||||||
|
|
|
|
|
|
|
|
|
|
|
|
|||||||||||||||||||||
|
50
|
24.75
|
23.51
|
22.03
|
20.79
|
19.55
|
18.32
|
15.59
|
10.40
|
5.20
|
0.00
|
|||||||||||||||||||||
|
|
|
|
|
|
|
|
|
|
|
|
|||||||||||||||||||||
|
51
|
25.86
|
24.57
|
23.02
|
21.72
|
20.43
|
19.14
|
16.29
|
10.86
|
5.43
|
0.00
|
|||||||||||||||||||||
|
|
|
|
|
|
|
|
|
|
|
|
|||||||||||||||||||||
|
52
|
26.95
|
25.60
|
23.99
|
22.64
|
21.29
|
19.94
|
16.98
|
11.32
|
5.66
|
0.00
|
|||||||||||||||||||||
|
|
|
|
|
|
|
|
|
|
|
|
|||||||||||||||||||||
|
53
|
28.18
|
26.77
|
25.08
|
23.67
|
22.26
|
20.85
|
17.75
|
11.84
|
5.92
|
0.00
|
|||||||||||||||||||||
|
|
|
|
|
|
|
|
|
|
|
|
|||||||||||||||||||||
|
54
|
29.61
|
28.13
|
26.35
|
24.87
|
23.39
|
21.91
|
18.65
|
12.44
|
6.22
|
0.00
|
|||||||||||||||||||||
|
|
|
|
|
|
|
|
|
|
|
|
|||||||||||||||||||||
|
55
|
31.03
|
29.48
|
27.62
|
26.07
|
24.51
|
22.96
|
19.55
|
13.03
|
6.52
|
0.00
|
|||||||||||||||||||||
|
|
|
|
|
|
|
|
|
|
|
|
|||||||||||||||||||||
|
56
|
32.43
|
30.81
|
28.86
|
27.24
|
25.62
|
24.00
|
20.43
|
13.62
|
6.81
|
0.00
|
|||||||||||||||||||||
|
|
|
|
|
|
|
|
|
|
|
|
|||||||||||||||||||||
|
57
|
34.24
|
32.53
|
30.47
|
28.76
|
27.05
|
25.34
|
21.57
|
14.38
|
7.19
|
0.00
|
|||||||||||||||||||||
|
|
|
|
|
|
|
|
|
|
|
|
|||||||||||||||||||||
|
58
|
36.45
|
34.63
|
32.44
|
30.62
|
28.80
|
26.97
|
22.96
|
15.31
|
7.65
|
0.00
|
|||||||||||||||||||||
|
|
|
|
|
|
|
|
|
|
|
|
|||||||||||||||||||||
|
59
|
38.40
|
36.48
|
34.18
|
32.26
|
30.34
|
28.42
|
24.19
|
16.13
|
8.06
|
0.00
|
|||||||||||||||||||||
|
|
|
|
|
|
|
|
|
|
|
|
|||||||||||||||||||||
|
60
|
38.40
|
36.48
|
34.18
|
32.26
|
30.34
|
28.42
|
24.19
|
16.13
|
8.06
|
0.00
|
|||||||||||||||||||||
|
|
|
|
|
|
|
|
|
|
|
|
|||||||||||||||||||||
|
61
|
38.40
|
36.48
|
34.18
|
32.26
|
30.34
|
28.42
|
24.19
|
16.13
|
8.06
|
0.00
|
|||||||||||||||||||||
|
|
|
|
|
|
|
|
|
|
|
|
|||||||||||||||||||||
|
62
|
38.40
|
36.48
|
34.18
|
32.26
|
30.34
|
28.42
|
24.19
|
16.13
|
8.06
|
0.00
|
|||||||||||||||||||||
|
|
|
|
|
|
|
|
|
|
|
|
|||||||||||||||||||||
|
63
|
38.40
|
36.48
|
34.18
|
32.26
|
30.34
|
28.42
|
24.19
|
16.13
|
8.06
|
0.00
|
|||||||||||||||||||||
|
|
|
|
|
|
|
|
|
|
|
|
|||||||||||||||||||||
|
64
|
39.90
|
37.91
|
35.51
|
33.52
|
31.52
|
29.53
|
25.14
|
16.76
|
8.38
|
0.00
|
|||||||||||||||||||||
|
|
|
|
|
|
|
|
|
|
|
|
|||||||||||||||||||||
|
65
|
41.40
|
39.33
|
36.85
|
34.78
|
32.71
|
30.64
|
26.08
|
17.39
|
8.69
|
0.00
|
|||||||||||||||||||||
|
|
|
|
|
|
|
|
|
|
|
|
|||||||||||||||||||||
|
66
|
42.90
|
40.76
|
38.18
|
36.04
|
33.89
|
31.75
|
27.03
|
18.02
|
9.01
|
0.00
|
|||||||||||||||||||||
|
|
|
|
|
|
|
|
|
|
|
|
|||||||||||||||||||||
|
67
|
44.40
|
42.18
|
39.52
|
37.30
|
35.08
|
32.86
|
27.97
|
18.65
|
9.32
|
0.00
|
|||||||||||||||||||||
|
|
|
|
|
|
|
|
|
|
|
|
|||||||||||||||||||||
|
68
|
44.40
|
42.18
|
39.51
|
37.29
|
35.07
|
32.85
|
27.97
|
18.64
|
9.32
|
0.00
|
|||||||||||||||||||||
|
|
|
|
|
|
|
|
|
|
|
|
|||||||||||||||||||||
|
69
|
43.90
|
41.70
|
39.07
|
36.87
|
34.68
|
32.48
|
27.65
|
18.43
|
9.21
|
0.00
|
|||||||||||||||||||||
|
|
|
|
|
|
|
|
|
|
|
|
|||||||||||||||||||||
|
70
|
43.30
|
41.13
|
38.53
|
36.37
|
34.20
|
32.04
|
27.27
|
18.18
|
9.09
|
0.00
|
|||||||||||||||||||||
|
|
|
|
|
|
|
|
|
|
|
|
|||||||||||||||||||||
|
71
|
42.50
|
40.37
|
37.82
|
35.70
|
33.57
|
31.45
|
26.77
|
17.85
|
8.92
|
0.00
|
|||||||||||||||||||||
|
|
|
|
|
|
|
|
|
|
|
|
|||||||||||||||||||||
|
72
|
41.60
|
39.52
|
37.02
|
34.94
|
32.86
|
30.78
|
26.20
|
17.47
|
8.73
|
0.00
|
|||||||||||||||||||||
|
|
|
|
|
|
|
|
|
|
|
|
|||||||||||||||||||||
|
73
|
40.70
|
38.66
|
36.22
|
34.18
|
32.15
|
30.11
|
25.64
|
17.09
|
8.54
|
0.00
|
|||||||||||||||||||||
|
|
|
|
|
|
|
|
|
|
|
|
|||||||||||||||||||||
|
74
|
39.90
|
37.90
|
35.51
|
33.51
|
31.52
|
29.52
|
25.13
|
16.75
|
8.37
|
0.00
|
|||||||||||||||||||||
|
|
|
|
|
|
|
|
|
|
|
|
|||||||||||||||||||||
|
75
|
39.00
|
37.05
|
34.71
|
32.76
|
30.81
|
28.86
|
24.57
|
16.38
|
8.19
|
0.00
|
|||||||||||||||||||||
|
|
|
|
|
|
|
|
|
|
|
|
|||||||||||||||||||||
|
76
|
38.60
|
36.67
|
34.35
|
32.42
|
30.49
|
28.56
|
24.31
|
16.21
|
8.10
|
0.00
|
|||||||||||||||||||||
|
|
|
|
|
|
|
|
|
|
|
|
|||||||||||||||||||||
|
77
|
38.10
|
36.19
|
33.90
|
32.00
|
30.09
|
28.19
|
24.00
|
16.00
|
8.00
|
0.00
|
|||||||||||||||||||||
|
|
|
|
|
|
|
|
|
|
|
|
|||||||||||||||||||||
|
78
|
37.60
|
35.72
|
33.46
|
31.58
|
29.70
|
27.82
|
23.68
|
15.79
|
7.89
|
0.00
|
|||||||||||||||||||||
|
|
|
|
|
|
|
|
|
|
|
|
|||||||||||||||||||||
|
79
|
37.20
|
35.34
|
33.10
|
31.24
|
29.38
|
27.52
|
23.43
|
15.62
|
7.81
|
0.00
|
|||||||||||||||||||||
|
|
|
|
|
|
|
|
|
|
|
|
|||||||||||||||||||||
|
80
|
36.70
|
34.86
|
32.66
|
30.82
|
28.99
|
27.15
|
23.12
|
15.41
|
7.70
|
0.00
|
|||||||||||||||||||||
|
TABLE OF SURRENDER CHARGE FACTORS
|
||||||||||||||||||||||||||||
|
Female Non-Nicotine (Premier, Preferred, & Standard)
|
||||||||||||||||||||||||||||
|
Number of Full Policy Years Completed Since the Issue Date or Since Increase in Face Amount
|
||||||||||||||||||||||||||||
|
Issue
Age
|
0
|
1
|
2
|
3
|
4
|
5
|
6
|
7
|
8
|
9 or
more
|
||||||||||||||||||
|
|
|
|
|
|
|
|
|
|
|
|
||||||||||||||||||
|
21
|
4.65
|
4.42
|
4.14
|
3.91
|
3.67
|
3.44
|
2.93
|
1.95
|
0.98
|
0.00
|
||||||||||||||||||
|
|
|
|
|
|
|
|
|
|
|
|
||||||||||||||||||
|
22
|
4.75
|
4.51
|
4.23
|
3.99
|
3.75
|
3.52
|
2.99
|
2.00
|
1.00
|
0.00
|
||||||||||||||||||
|
|
|
|
|
|
|
|
|
|
|
|
||||||||||||||||||
|
23
|
4.84
|
4.60
|
4.31
|
4.07
|
3.82
|
3.58
|
3.05
|
2.03
|
1.02
|
0.00
|
||||||||||||||||||
|
|
|
|
|
|
|
|
|
|
|
|
||||||||||||||||||
|
24
|
4.94
|
4.69
|
4.40
|
4.15
|
3.90
|
3.66
|
3.11
|
2.07
|
1.04
|
0.00
|
||||||||||||||||||
|
|
|
|
|
|
|
|
|
|
|
|
||||||||||||||||||
|
25
|
5.03
|
4.78
|
4.48
|
4.23
|
3.97
|
3.72
|
3.17
|
2.11
|
1.06
|
0.00
|
||||||||||||||||||
|
|
|
|
|
|
|
|
|
|
|
|
||||||||||||||||||
|
26
|
5.25
|
4.99
|
4.67
|
4.41
|
4.15
|
3.89
|
3.31
|
2.21
|
1.10
|
0.00
|
||||||||||||||||||
|
|
|
|
|
|
|
|
|
|
|
|
||||||||||||||||||
|
27
|
5.48
|
5.21
|
4.88
|
4.60
|
4.33
|
4.06
|
3.45
|
2.30
|
1.15
|
0.00
|
||||||||||||||||||
|
|
|
|
|
|
|
|
|
|
|
|
||||||||||||||||||
|
28
|
5.72
|
5.43
|
5.09
|
4.80
|
4.52
|
4.23
|
3.60
|
2.40
|
1.20
|
0.00
|
||||||||||||||||||
|
|
|
|
|
|
|
|
|
|
|
|
||||||||||||||||||
|
29
|
5.98
|
5.68
|
5.32
|
5.02
|
4.72
|
4.43
|
3.77
|
2.51
|
1.26
|
0.00
|
||||||||||||||||||
|
|
|
|
|
|
|
|
|
|
|
|
||||||||||||||||||
|
30
|
6.26
|
5.95
|
5.57
|
5.26
|
4.95
|
4.63
|
3.94
|
2.63
|
1.31
|
0.00
|
||||||||||||||||||
|
|
|
|
|
|
|
|
|
|
|
|
||||||||||||||||||
|
31
|
6.59
|
6.26
|
5.87
|
5.54
|
5.21
|
4.88
|
4.15
|
2.77
|
1.38
|
0.00
|
||||||||||||||||||
|
|
|
|
|
|
|
|
|
|
|
|
||||||||||||||||||
|
32
|
6.96
|
6.61
|
6.19
|
5.85
|
5.50
|
5.15
|
4.38
|
2.92
|
1.46
|
0.00
|
||||||||||||||||||
|
|
|
|
|
|
|
|
|
|
|
|
||||||||||||||||||
|
33
|
7.37
|
7.00
|
6.56
|
6.19
|
5.82
|
5.45
|
4.64
|
3.10
|
1.55
|
0.00
|
||||||||||||||||||
|
|
|
|
|
|
|
|
|
|
|
|
||||||||||||||||||
|
34
|
7.79
|
7.40
|
6.93
|
6.54
|
6.15
|
5.76
|
4.91
|
3.27
|
1.64
|
0.00
|
||||||||||||||||||
|
|
|
|
|
|
|
|
|
|
|
|
||||||||||||||||||
|
35
|
8.20
|
7.79
|
7.30
|
6.89
|
6.48
|
6.07
|
5.17
|
3.44
|
1.72
|
0.00
|
||||||||||||||||||
|
|
|
|
|
|
|
|
|
|
|
|
||||||||||||||||||
|
36
|
8.62
|
8.19
|
7.67
|
7.24
|
6.81
|
6.38
|
5.43
|
3.62
|
1.81
|
0.00
|
||||||||||||||||||
|
|
|
|
|
|
|
|
|
|
|
|
||||||||||||||||||
|
37
|
9.08
|
8.63
|
8.08
|
7.63
|
7.17
|
6.72
|
5.72
|
3.81
|
1.91
|
0.00
|
||||||||||||||||||
|
|
|
|
|
|
|
|
|
|
|
|
||||||||||||||||||
|
38
|
9.63
|
9.15
|
8.57
|
8.09
|
7.61
|
7.13
|
6.07
|
4.04
|
2.02
|
0.00
|
||||||||||||||||||
|
|
|
|
|
|
|
|
|
|
|
|
||||||||||||||||||
|
39
|
10.20
|
9.69
|
9.08
|
8.57
|
8.06
|
7.55
|
6.43
|
4.28
|
2.14
|
0.00
|
||||||||||||||||||
|
|
|
|
|
|
|
|
|
|
|
|
||||||||||||||||||
|
40
|
10.70
|
10.17
|
9.52
|
8.99
|
8.45
|
7.92
|
6.74
|
4.49
|
2.25
|
0.00
|
||||||||||||||||||
|
|
|
|
|
|
|
|
|
|
|
|
||||||||||||||||||
|
41
|
11.11
|
10.55
|
9.89
|
9.33
|
8.78
|
8.22
|
7.00
|
4.67
|
2.33
|
0.00
|
||||||||||||||||||
|
|
|
|
|
|
|
|
|
|
|
|
||||||||||||||||||
|
42
|
11.53
|
10.95
|
10.26
|
9.69
|
9.11
|
8.53
|
7.26
|
4.84
|
2.42
|
0.00
|
||||||||||||||||||
|
|
|
|
|
|
|
|
|
|
|
|
||||||||||||||||||
|
43
|
11.96
|
11.36
|
10.64
|
10.05
|
9.45
|
8.85
|
7.53
|
5.02
|
2.51
|
0.00
|
||||||||||||||||||
|
|
|
|
|
|
|
|
|
|
|
|
||||||||||||||||||
|
44
|
12.35
|
11.73
|
10.99
|
10.37
|
9.76
|
9.14
|
7.78
|
5.19
|
2.59
|
0.00
|
||||||||||||||||||
|
|
|
|
|
|
|
|
|
|
|
|
||||||||||||||||||
|
45
|
12.83
|
12.19
|
11.42
|
10.78
|
10.14
|
9.49
|
8.08
|
5.39
|
2.69
|
0.00
|
||||||||||||||||||
|
|
|
|
|
|
|
|
|
|
|
|
||||||||||||||||||
|
46
|
13.43
|
12.76
|
11.95
|
11.28
|
10.61
|
9.94
|
8.46
|
5.64
|
2.82
|
0.00
|
||||||||||||||||||
|
|
|
|
|
|
|
|
|
|
|
|
||||||||||||||||||
|
47
|
14.08
|
13.38
|
12.53
|
11.83
|
11.12
|
10.42
|
8.87
|
5.91
|
2.96
|
0.00
|
||||||||||||||||||
|
|
|
|
|
|
|
|
|
|
|
|
||||||||||||||||||
|
48
|
14.75
|
14.01
|
13.13
|
12.39
|
11.65
|
10.92
|
9.29
|
6.20
|
3.10
|
0.00
|
||||||||||||||||||
|
|
|
|
|
|
|
|
|
|
|
|
||||||||||||||||||
|
49
|
15.47
|
14.70
|
13.77
|
12.99
|
12.22
|
11.45
|
9.75
|
6.50
|
3.25
|
0.00
|
||||||||||||||||||
|
|
|
|
|
|
|
|
|
|
|
|
||||||||||||||||||
|
50
|
16.23
|
15.42
|
14.44
|
13.63
|
12.82
|
12.01
|
10.22
|
6.82
|
3.41
|
0.00
|
||||||||||||||||||
|
|
|
|
|
|
|
|
|
|
|
|
||||||||||||||||||
|
51
|
17.16
|
16.30
|
15.27
|
14.41
|
13.56
|
12.70
|
10.81
|
7.21
|
3.60
|
0.00
|
||||||||||||||||||
|
|
|
|
|
|
|
|
|
|
|
|
||||||||||||||||||
|
52
|
17.94
|
17.04
|
15.97
|
15.07
|
14.17
|
13.28
|
11.30
|
7.53
|
3.77
|
0.00
|
||||||||||||||||||
|
|
|
|
|
|
|
|
|
|
|
|
||||||||||||||||||
|
53
|
18.72
|
17.78
|
16.66
|
15.72
|
14.79
|
13.85
|
11.79
|
7.86
|
3.93
|
0.00
|
||||||||||||||||||
|
|
|
|
|
|
|
|
|
|
|
|
||||||||||||||||||
|
54
|
19.58
|
18.60
|
17.43
|
16.45
|
15.47
|
14.49
|
12.34
|
8.22
|
4.11
|
0.00
|
||||||||||||||||||
|
|
|
|
|
|
|
|
|
|
|
|
||||||||||||||||||
|
55
|
20.53
|
19.50
|
18.27
|
17.25
|
16.22
|
15.19
|
12.93
|
8.62
|
4.31
|
0.00
|
||||||||||||||||||
|
|
|
|
|
|
|
|
|
|
|
|
||||||||||||||||||
|
56
|
21.75
|
20.66
|
19.36
|
18.27
|
17.18
|
16.10
|
13.70
|
9.14
|
4.57
|
0.00
|
||||||||||||||||||
|
|
|
|
|
|
|
|
|
|
|
|
||||||||||||||||||
|
57
|
23.05
|
21.90
|
20.51
|
19.36
|
18.21
|
17.06
|
14.52
|
9.68
|
4.84
|
0.00
|
||||||||||||||||||
|
|
|
|
|
|
|
|
|
|
|
|
||||||||||||||||||
|
58
|
24.44
|
23.22
|
21.75
|
20.53
|
19.31
|
18.09
|
15.40
|
10.26
|
5.13
|
0.00
|
||||||||||||||||||
|
|
|
|
|
|
|
|
|
|
|
|
||||||||||||||||||
|
59
|
25.92
|
24.62
|
23.07
|
21.77
|
20.48
|
19.18
|
16.33
|
10.89
|
5.44
|
0.00
|
||||||||||||||||||
|
|
|
|
|
|
|
|
|
|
|
|
||||||||||||||||||
|
60
|
27.40
|
26.03
|
24.39
|
23.02
|
21.65
|
20.28
|
17.26
|
11.51
|
5.75
|
0.00
|
||||||||||||||||||
|
|
|
|
|
|
|
|
|
|
|
|
||||||||||||||||||
|
61
|
28.90
|
27.46
|
25.72
|
24.28
|
22.83
|
21.39
|
18.21
|
12.14
|
6.07
|
0.00
|
||||||||||||||||||
|
|
|
|
|
|
|
|
|
|
|
|
||||||||||||||||||
|
62
|
30.40
|
28.88
|
27.06
|
25.54
|
24.02
|
22.50
|
19.15
|
12.77
|
6.38
|
0.00
|
||||||||||||||||||
|
|
|
|
|
|
|
|
|
|
|
|
||||||||||||||||||
|
63
|
31.90
|
30.31
|
28.39
|
26.80
|
25.20
|
23.61
|
20.10
|
13.40
|
6.70
|
0.00
|
||||||||||||||||||
|
|
|
|
|
|
|
|
|
|
|
|
||||||||||||||||||
|
65
|
34.90
|
33.16
|
31.06
|
29.32
|
27.57
|
25.83
|
21.99
|
14.66
|
7.33
|
0.00
|
||||||||||||||||||
|
|
|
|
|
|
|
|
|
|
|
|
||||||||||||||||||
|
66
|
36.40
|
34.58
|
32.40
|
30.58
|
28.76
|
26.94
|
22.93
|
15.29
|
7.64
|
0.00
|
||||||||||||||||||
|
|
|
|
|
|
|
|
|
|
|
|
||||||||||||||||||
|
67
|
37.90
|
36.01
|
33.73
|
31.84
|
29.94
|
28.05
|
23.88
|
15.92
|
7.96
|
0.00
|
||||||||||||||||||
|
|
|
|
|
|
|
|
|
|
|
|
||||||||||||||||||
|
68
|
39.40
|
37.43
|
35.06
|
33.09
|
31.12
|
29.15
|
24.82
|
16.54
|
8.27
|
0.00
|
||||||||||||||||||
|
|
|
|
|
|
|
|
|
|
|
|
||||||||||||||||||
|
69
|
40.90
|
38.85
|
36.40
|
34.35
|
32.31
|
30.26
|
25.76
|
17.17
|
8.58
|
0.00
|
||||||||||||||||||
|
|
|
|
|
|
|
|
|
|
|
|
||||||||||||||||||
|
70
|
42.40
|
40.28
|
37.73
|
35.61
|
33.49
|
31.37
|
26.71
|
17.80
|
8.90
|
0.00
|
||||||||||||||||||
|
|
|
|
|
|
|
|
|
|
|
|
||||||||||||||||||
|
71
|
43.90
|
41.70
|
39.07
|
36.87
|
34.68
|
32.48
|
27.65
|
18.43
|
9.21
|
0.00
|
||||||||||||||||||
|
|
|
|
|
|
|
|
|
|
|
|
||||||||||||||||||
|
72
|
43.90
|
41.70
|
39.07
|
36.87
|
34.68
|
32.48
|
27.65
|
18.43
|
9.21
|
0.00
|
||||||||||||||||||
|
|
|
|
|
|
|
|
|
|
|
|
||||||||||||||||||
|
73
|
43.10
|
40.94
|
38.35
|
36.20
|
34.04
|
31.89
|
27.15
|
18.10
|
9.05
|
0.00
|
||||||||||||||||||
|
|
|
|
|
|
|
|
|
|
|
|
||||||||||||||||||
|
74
|
42.20
|
40.09
|
37.55
|
35.44
|
33.33
|
31.22
|
26.58
|
17.72
|
8.86
|
0.00
|
||||||||||||||||||
|
|
|
|
|
|
|
|
|
|
|
|
||||||||||||||||||
|
75
|
41.40
|
39.33
|
36.84
|
34.77
|
32.70
|
30.63
|
26.08
|
17.38
|
8.69
|
0.00
|
||||||||||||||||||
|
|
|
|
|
|
|
|
|
|
|
|
||||||||||||||||||
|
76
|
41.00
|
38.95
|
36.49
|
34.44
|
32.39
|
30.34
|
25.83
|
17.22
|
8.61
|
0.00
|
||||||||||||||||||
|
|
|
|
|
|
|
|
|
|
|
|
||||||||||||||||||
|
77
|
40.60
|
38.57
|
36.13
|
34.10
|
32.07
|
30.04
|
25.57
|
17.05
|
8.52
|
0.00
|
||||||||||||||||||
|
|
|
|
|
|
|
|
|
|
|
|
||||||||||||||||||
|
78
|
40.20
|
38.19
|
35.77
|
33.76
|
31.75
|
29.74
|
25.32
|
16.88
|
8.44
|
0.00
|
||||||||||||||||||
|
|
|
|
|
|
|
|
|
|
|
|
||||||||||||||||||
|
79
|
38.80
|
36.86
|
34.53
|
32.59
|
30.65
|
28.71
|
24.44
|
16.29
|
8.14
|
0.00
|
||||||||||||||||||
|
|
|
|
|
|
|
|
|
|
|
|
||||||||||||||||||
|
80
|
38.80
|
36.86
|
34.53
|
32.59
|
30.65
|
28.71
|
24.44
|
16.29
|
8.14
|
0.00
|
||||||||||||||||||
|
TABLE OF SURRENDER CHARGE FACTORS
|
|||||||||||||||||||||||||
|
Female Nicotine (Ages 0-20 are juvenile issues.)
|
|||||||||||||||||||||||||
|
Number of Full Policy Years Completed Since the Issue Date or Since Increase in Face Amount
|
|||||||||||||||||||||||||
|
Issue
Age
|
0
|
1
|
2
|
3
|
4
|
5
|
6
|
7
|
8
|
9 or
more
|
|||||||||||||||
|
|
|
|
|
|
|
|
|
|
|
|
|||||||||||||||
|
0
|
3.00
|
2.85
|
2.67
|
2.52
|
2.37
|
2.22
|
1.89
|
1.26
|
0.63
|
0.00
|
|||||||||||||||
|
|
|
|
|
|
|
|
|
|
|
|
|||||||||||||||
|
1
|
3.03
|
2.88
|
2.70
|
2.55
|
2.39
|
2.24
|
1.91
|
1.27
|
0.64
|
0.00
|
|||||||||||||||
|
|
|
|
|
|
|
|
|
|
|
|
|||||||||||||||
|
2
|
3.08
|
2.93
|
2.74
|
2.59
|
2.43
|
2.28
|
1.94
|
1.29
|
0.65
|
0.00
|
|||||||||||||||
|
|
|
|
|
|
|
|
|
|
|
|
|||||||||||||||
|
3
|
3.15
|
2.99
|
2.80
|
2.65
|
2.49
|
2.33
|
1.98
|
1.32
|
0.66
|
0.00
|
|||||||||||||||
|
|
|
|
|
|
|
|
|
|
|
|
|||||||||||||||
|
4
|
3.22
|
3.06
|
2.87
|
2.70
|
2.54
|
2.38
|
2.03
|
1.35
|
0.68
|
0.00
|
|||||||||||||||
|
|
|
|
|
|
|
|
|
|
|
|
|||||||||||||||
|
5
|
3.29
|
3.13
|
2.93
|
2.76
|
2.60
|
2.43
|
2.07
|
1.38
|
0.69
|
0.00
|
|||||||||||||||
|
|
|
|
|
|
|
|
|
|
|
|
|||||||||||||||
|
6
|
3.36
|
3.19
|
2.99
|
2.82
|
2.65
|
2.49
|
2.12
|
1.41
|
0.71
|
0.00
|
|||||||||||||||
|
|
|
|
|
|
|
|
|
|
|
|
|||||||||||||||
|
7
|
3.45
|
3.28
|
3.07
|
2.90
|
2.73
|
2.55
|
2.17
|
1.45
|
0.72
|
0.00
|
|||||||||||||||
|
|
|
|
|
|
|
|
|
|
|
|
|||||||||||||||
|
8
|
3.53
|
3.35
|
3.14
|
2.97
|
2.79
|
2.61
|
2.22
|
1.48
|
0.74
|
0.00
|
|||||||||||||||
|
|
|
|
|
|
|
|
|
|
|
|
|||||||||||||||
|
9
|
3.62
|
3.44
|
3.22
|
3.04
|
2.86
|
2.68
|
2.28
|
1.52
|
0.76
|
0.00
|
|||||||||||||||
|
|
|
|
|
|
|
|
|
|
|
|
|||||||||||||||
|
10
|
3.72
|
3.53
|
3.31
|
3.12
|
2.94
|
2.75
|
2.34
|
1.56
|
0.78
|
0.00
|
|||||||||||||||
|
|
|
|
|
|
|
|
|
|
|
|
|||||||||||||||
|
11
|
3.79
|
3.60
|
3.37
|
3.18
|
2.99
|
2.80
|
2.39
|
1.59
|
0.80
|
0.00
|
|||||||||||||||
|
|
|
|
|
|
|
|
|
|
|
|
|||||||||||||||
|
12
|
3.86
|
3.67
|
3.44
|
3.24
|
3.05
|
2.86
|
2.43
|
1.62
|
0.81
|
0.00
|
|||||||||||||||
|
|
|
|
|
|
|
|
|
|
|
|
|||||||||||||||
|
13
|
3.94
|
3.74
|
3.51
|
3.31
|
3.11
|
2.92
|
2.48
|
1.65
|
0.83
|
0.00
|
|||||||||||||||
|
|
|
|
|
|
|
|
|
|
|
|
|||||||||||||||
|
14
|
4.02
|
3.82
|
3.58
|
3.38
|
3.18
|
2.97
|
2.53
|
1.69
|
0.84
|
0.00
|
|||||||||||||||
|
|
|
|
|
|
|
|
|
|
|
|
|||||||||||||||
|
15
|
4.10
|
3.90
|
3.65
|
3.44
|
3.24
|
3.03
|
2.58
|
1.72
|
0.86
|
0.00
|
|||||||||||||||
|
|
|
|
|
|
|
|
|
|
|
|
|||||||||||||||
|
16
|
4.19
|
3.98
|
3.73
|
3.52
|
3.31
|
3.10
|
2.64
|
1.76
|
0.88
|
0.00
|
|||||||||||||||
|
|
|
|
|
|
|
|
|
|
|
|
|||||||||||||||
|
17
|
4.28
|
4.07
|
3.81
|
3.60
|
3.38
|
3.17
|
2.70
|
1.80
|
0.90
|
0.00
|
|||||||||||||||
|
|
|
|
|
|
|
|
|
|
|
|
|||||||||||||||
|
18
|
4.38
|
4.16
|
3.90
|
3.68
|
3.46
|
3.24
|
2.76
|
1.84
|
0.92
|
0.00
|
|||||||||||||||
|
|
|
|
|
|
|
|
|
|
|
|
|||||||||||||||
|
19
|
4.47
|
4.25
|
3.98
|
3.75
|
3.53
|
3.31
|
2.82
|
1.88
|
0.94
|
0.00
|
|||||||||||||||
|
|
|
|
|
|
|
|
|
|
|
|
|||||||||||||||
|
20
|
4.57
|
4.34
|
4.07
|
3.84
|
3.61
|
3.38
|
2.88
|
1.92
|
0.96
|
0.00
|
|||||||||||||||
|
|
|
|
|
|
|
|
|
|
|
|
|||||||||||||||
|
21
|
5.09
|
4.84
|
4.53
|
4.28
|
4.02
|
3.77
|
3.21
|
2.14
|
1.07
|
0.00
|
|||||||||||||||
|
|
|
|
|
|
|
|
|
|
|
|
|||||||||||||||
|
22
|
5.18
|
4.92
|
4.61
|
4.35
|
4.09
|
3.83
|
3.26
|
2.18
|
1.09
|
0.00
|
|||||||||||||||
|
|
|
|
|
|
|
|
|
|
|
|
|||||||||||||||
|
23
|
5.28
|
5.02
|
4.70
|
4.44
|
4.17
|
3.91
|
3.33
|
2.22
|
1.11
|
0.00
|
|||||||||||||||
|
|
|
|
|
|
|
|
|
|
|
|
|||||||||||||||
|
24
|
5.35
|
5.08
|
4.76
|
4.49
|
4.23
|
3.96
|
3.37
|
2.25
|
1.12
|
0.00
|
|||||||||||||||
|
|
|
|
|
|
|
|
|
|
|
|
|||||||||||||||
|
25
|
5.45
|
5.18
|
4.85
|
4.58
|
4.31
|
4.03
|
3.43
|
2.29
|
1.14
|
0.00
|
|||||||||||||||
|
|
|
|
|
|
|
|
|
|
|
|
|||||||||||||||
|
26
|
5.65
|
5.37
|
5.03
|
4.75
|
4.46
|
4.18
|
3.56
|
2.37
|
1.19
|
0.00
|
|||||||||||||||
|
|
|
|
|
|
|
|
|
|
|
|
|||||||||||||||
|
27
|
5.95
|
5.65
|
5.30
|
5.00
|
4.70
|
4.40
|
3.75
|
2.50
|
1.25
|
0.00
|
|||||||||||||||
|
|
|
|
|
|
|
|
|
|
|
|
|||||||||||||||
|
28
|
6.29
|
5.98
|
5.60
|
5.28
|
4.97
|
4.65
|
3.96
|
2.64
|
1.32
|
0.00
|
|||||||||||||||
|
|
|
|
|
|
|
|
|
|
|
|
|||||||||||||||
|
29
|
6.59
|
6.26
|
5.87
|
5.54
|
5.21
|
4.88
|
4.15
|
2.77
|
1.38
|
0.00
|
|||||||||||||||
|
|
|
|
|
|
|
|
|
|
|
|
|||||||||||||||
|
30
|
6.87
|
6.53
|
6.11
|
5.77
|
5.43
|
5.08
|
4.33
|
2.89
|
1.44
|
0.00
|
|||||||||||||||
|
|
|
|
|
|
|
|
|
|
|
|
|||||||||||||||
|
31
|
7.18
|
6.82
|
6.39
|
6.03
|
5.67
|
5.31
|
4.52
|
3.02
|
1.51
|
0.00
|
|||||||||||||||
|
|
|
|
|
|
|
|
|
|
|
|
|||||||||||||||
|
32
|
7.57
|
7.19
|
6.74
|
6.36
|
5.98
|
5.60
|
4.77
|
3.18
|
1.59
|
0.00
|
|||||||||||||||
|
|
|
|
|
|
|
|
|
|
|
|
|||||||||||||||
|
33
|
8.02
|
7.62
|
7.14
|
6.74
|
6.34
|
5.93
|
5.05
|
3.37
|
1.68
|
0.00
|
|||||||||||||||
|
|
|
|
|
|
|
|
|
|
|
|
|||||||||||||||
|
34
|
8.44
|
8.02
|
7.51
|
7.09
|
6.67
|
6.25
|
5.32
|
3.54
|
1.77
|
0.00
|
|||||||||||||||
|
|
|
|
|
|
|
|
|
|
|
|
|||||||||||||||
|
35
|
8.83
|
8.39
|
7.86
|
7.42
|
6.98
|
6.53
|
5.56
|
3.71
|
1.85
|
0.00
|
|||||||||||||||
|
|
|
|
|
|
|
|
|
|
|
|
|||||||||||||||
|
36
|
9.21
|
8.75
|
8.20
|
7.74
|
7.28
|
6.82
|
5.80
|
3.87
|
1.93
|
0.00
|
|||||||||||||||
|
|
|
|
|
|
|
|
|
|
|
|
|||||||||||||||
|
37
|
9.62
|
9.14
|
8.56
|
8.08
|
7.60
|
7.12
|
6.06
|
4.04
|
2.02
|
0.00
|
|||||||||||||||
|
|
|
|
|
|
|
|
|
|
|
|
|||||||||||||||
|
38
|
10.05
|
9.55
|
8.94
|
8.44
|
7.94
|
7.44
|
6.33
|
4.22
|
2.11
|
0.00
|
|||||||||||||||
|
|
|
|
|
|
|
|
|
|
|
|
|||||||||||||||
|
39
|
10.48
|
9.96
|
9.33
|
8.80
|
8.28
|
7.76
|
6.60
|
4.40
|
2.20
|
0.00
|
|||||||||||||||
|
|
|
|
|
|
|
|
|
|
|
|
|||||||||||||||
|
40
|
10.92
|
10.37
|
9.72
|
9.17
|
8.63
|
8.08
|
6.88
|
4.59
|
2.29
|
0.00
|
|||||||||||||||
|
|
|
|
|
|
|
|
|
|
|
|
|||||||||||||||
|
41
|
11.37
|
10.80
|
10.12
|
9.55
|
8.98
|
8.41
|
7.16
|
4.78
|
2.39
|
0.00
|
|||||||||||||||
|
|
|
|
|
|
|
|
|
|
|
|
|||||||||||||||
|
42
|
11.83
|
11.24
|
10.53
|
9.94
|
9.35
|
8.75
|
7.45
|
4.97
|
2.48
|
0.00
|
|||||||||||||||
|
|
|
|
|
|
|
|
|
|
|
|
|||||||||||||||
|
43
|
12.30
|
11.69
|
10.95
|
10.33
|
9.72
|
9.10
|
7.75
|
5.17
|
2.58
|
0.00
|
|||||||||||||||
|
|
|
|
|
|
|
|
|
|
|
|
|||||||||||||||
|
44
|
12.75
|
12.11
|
11.35
|
10.71
|
10.07
|
9.44
|
8.03
|
5.36
|
2.68
|
0.00
|
|||||||||||||||
|
|
|
|
|
|
|
|
|
|
|
|
|||||||||||||||
|
45
|
13.13
|
12.47
|
11.69
|
11.03
|
10.37
|
9.72
|
8.27
|
5.51
|
2.76
|
0.00
|
|||||||||||||||
|
|
|
|
|
|
|
|
|
|
|
|
|||||||||||||||
|
46
|
13.43
|
12.76
|
11.95
|
11.28
|
10.61
|
9.94
|
8.46
|
5.64
|
2.82
|
0.00
|
|||||||||||||||
|
|
|
|
|
|
|
|
|
|
|
|
|||||||||||||||
|
47
|
14.08
|
13.38
|
12.53
|
11.83
|
11.12
|
10.42
|
8.87
|
5.91
|
2.96
|
0.00
|
|||||||||||||||
|
|
|
|
|
|
|
|
|
|
|
|
|||||||||||||||
|
48
|
14.75
|
14.01
|
13.13
|
12.39
|
11.65
|
10.92
|
9.29
|
6.20
|
3.10
|
0.00
|
|||||||||||||||
|
|
|
|
|
|
|
|
|
|
|
|
|||||||||||||||
|
49
|
15.47
|
14.70
|
13.77
|
12.99
|
12.22
|
11.45
|
9.75
|
6.50
|
3.25
|
0.00
|
|||||||||||||||
|
|
|
|
|
|
|
|
|
|
|
|
|||||||||||||||
|
50
|
16.23
|
15.42
|
14.44
|
13.63
|
12.82
|
12.01
|
10.22
|
6.82
|
3.41
|
0.00
|
|||||||||||||||
|
|
|
|
|
|
|
|
|
|
|
|
|||||||||||||||
|
51
|
17.16
|
16.30
|
15.27
|
14.41
|
13.56
|
12.70
|
10.81
|
7.21
|
3.60
|
0.00
|
|||||||||||||||
|
|
|
|
|
|
|
|
|
|
|
|
|||||||||||||||
|
52
|
17.94
|
17.04
|
15.97
|
15.07
|
14.17
|
13.28
|
11.30
|
7.53
|
3.77
|
0.00
|
|||||||||||||||
|
|
|
|
|
|
|
|
|
|
|
|
|||||||||||||||
|
53
|
18.72
|
17.78
|
16.66
|
15.72
|
14.79
|
13.85
|
11.79
|
7.86
|
3.93
|
0.00
|
|||||||||||||||
|
|
|
|
|
|
|
|
|
|
|
|
|||||||||||||||
|
54
|
19.58
|
18.60
|
17.43
|
16.45
|
15.47
|
14.49
|
12.34
|
8.22
|
4.11
|
0.00
|
|||||||||||||||
|
|
|
|
|
|
|
|
|
|
|
|
|||||||||||||||
|
55
|
20.53
|
19.50
|
18.27
|
17.25
|
16.22
|
15.19
|
12.93
|
8.62
|
4.31
|
0.00
|
|||||||||||||||
|
|
|
|
|
|
|
|
|
|
|
|
|||||||||||||||
|
56
|
21.75
|
20.66
|
19.36
|
18.27
|
17.18
|
16.10
|
13.70
|
9.14
|
4.57
|
0.00
|
|||||||||||||||
|
|
|
|
|
|
|
|
|
|
|
|
|||||||||||||||
|
57
|
23.05
|
21.90
|
20.51
|
19.36
|
18.21
|
17.06
|
14.52
|
9.68
|
4.84
|
0.00
|
|||||||||||||||
|
|
|
|
|
|
|
|
|
|
|
|
|||||||||||||||
|
58
|
24.44
|
23.22
|
21.75
|
20.53
|
19.31
|
18.09
|
15.40
|
10.26
|
5.13
|
0.00
|
|||||||||||||||
|
|
|
|
|
|
|
|
|
|
|
|
|||||||||||||||
|
59
|
26.21
|
24.90
|
23.33
|
22.02
|
20.71
|
19.40
|
16.51
|
11.01
|
5.50
|
0.00
|
|||||||||||||||
|
|
|
|
|
|
|
|
|
|
|
|
|||||||||||||||
|
60
|
27.40
|
26.03
|
24.39
|
23.02
|
21.65
|
20.28
|
17.26
|
11.51
|
5.75
|
0.00
|
|||||||||||||||
|
|
|
|
|
|
|
|
|
|
|
|
|||||||||||||||
|
61
|
28.90
|
27.46
|
25.72
|
24.28
|
22.83
|
21.39
|
18.21
|
12.14
|
6.07
|
0.00
|
|||||||||||||||
|
|
|
|
|
|
|
|
|
|
|
|
|||||||||||||||
|
62
|
30.40
|
28.88
|
27.06
|
25.54
|
24.02
|
22.50
|
19.15
|
12.77
|
6.38
|
0.00
|
|||||||||||||||
|
|
|
|
|
|
|
|
|
|
|
|
|||||||||||||||
|
63
|
31.90
|
30.31
|
28.39
|
26.80
|
25.20
|
23.61
|
20.10
|
13.40
|
6.70
|
0.00
|
|||||||||||||||
|
|
|
|
|
|
|
|
|
|
|
|
|||||||||||||||
|
64
|
33.40
|
31.73
|
29.73
|
28.06
|
26.39
|
24.72
|
21.04
|
14.03
|
7.01
|
0.00
|
|||||||||||||||
|
|
|
|
|
|
|
|
|
|
|
|
|||||||||||||||
|
65
|
34.90
|
33.16
|
31.06
|
29.32
|
27.57
|
25.83
|
21.99
|
14.66
|
7.33
|
0.00
|
|||||||||||||||
|
|
|
|
|
|
|
|
|
|
|
|
|||||||||||||||
|
66
|
36.40
|
34.58
|
32.40
|
30.58
|
28.76
|
26.94
|
22.93
|
15.29
|
7.64
|
0.00
|
|||||||||||||||
|
|
|
|
|
|
|
|
|
|
|
|
|||||||||||||||
|
67
|
37.90
|
36.01
|
33.73
|
31.84
|
29.94
|
28.05
|
23.88
|
15.92
|
7.96
|
0.00
|
|||||||||||||||
|
|
|
|
|
|
|
|
|
|
|
|
|||||||||||||||
|
68
|
39.40
|
37.43
|
35.06
|
33.09
|
31.12
|
29.15
|
24.82
|
16.54
|
8.27
|
0.00
|
|||||||||||||||
|
|
|
|
|
|
|
|
|
|
|
|
|||||||||||||||
|
69
|
40.90
|
38.85
|
36.40
|
34.35
|
32.31
|
30.26
|
25.76
|
17.17
|
8.58
|
0.00
|
|||||||||||||||
|
|
|
|
|
|
|
|
|
|
|
|
|||||||||||||||
|
70
|
42.40
|
40.28
|
37.73
|
35.61
|
33.49
|
31.37
|
26.71
|
17.80
|
8.90
|
0.00
|
|||||||||||||||
|
|
|
|
|
|
|
|
|
|
|
|
|||||||||||||||
|
71
|
43.90
|
41.70
|
39.07
|
36.87
|
34.68
|
32.48
|
27.65
|
18.43
|
9.21
|
0.00
|
|||||||||||||||
|
|
|
|
|
|
|
|
|
|
|
|
|||||||||||||||
|
72
|
43.90
|
41.70
|
39.07
|
36.87
|
34.68
|
32.48
|
27.65
|
18.43
|
9.21
|
0.00
|
|||||||||||||||
|
TABLE OF SURRENDER CHARGE FACTORS
|
|||||||||||||||||||||||||
|
Female Nicotine (Ages 0-20 are juvenile issues.)
|
|||||||||||||||||||||||||
|
Number of Full Policy Years Completed Since the Issue Date or Since Increase in Face Amount
|
|||||||||||||||||||||||||
|
Issue
Age
|
0
|
1
|
2
|
3
|
4
|
5
|
6
|
7
|
8
|
9 or
more
|
|||||||||||||||
|
|
|
|
|
|
|
|
|
|
|
|
|||||||||||||||
|
73
|
43.10
|
40.94
|
38.35
|
36.20
|
34.04
|
31.89
|
27.15
|
18.10
|
9.05
|
0.00
|
|||||||||||||||
|
|
|
|
|
|
|
|
|
|
|
|
|||||||||||||||
|
74
|
42.20
|
40.09
|
37.55
|
35.44
|
33.33
|
31.22
|
26.58
|
17.72
|
8.86
|
0.00
|
|||||||||||||||
|
|
|
|
|
|
|
|
|
|
|
|
|||||||||||||||
|
75
|
41.40
|
39.33
|
36.84
|
34.77
|
32.70
|
30.63
|
26.08
|
17.38
|
8.69
|
0.00
|
|||||||||||||||
|
|
|
|
|
|
|
|
|
|
|
|
|||||||||||||||
|
76
|
41.00
|
38.95
|
36.49
|
34.44
|
32.39
|
30.34
|
25.83
|
17.22
|
8.61
|
0.00
|
|||||||||||||||
|
|
|
|
|
|
|
|
|
|
|
|
|||||||||||||||
|
77
|
40.60
|
38.57
|
36.13
|
34.10
|
32.07
|
30.04
|
25.57
|
17.05
|
8.52
|
0.00
|
|||||||||||||||
|
|
|
|
|
|
|
|
|
|
|
|
|||||||||||||||
|
78
|
40.20
|
38.19
|
35.77
|
33.76
|
31.75
|
29.74
|
25.32
|
16.88
|
8.44
|
0.00
|
|||||||||||||||
|
|
|
|
|
|
|
|
|
|
|
|
|||||||||||||||
|
79
|
38.80
|
36.86
|
34.53
|
32.59
|
30.65
|
28.71
|
24.44
|
16.29
|
8.14
|
0.00
|
|||||||||||||||
|
|
|
|
|
|
|
|
|
|
|
|
|||||||||||||||
|
80
|
38.80
|
36.86
|
34.53
|
32.59
|
30.65
|
28.71
|
24.44
|
16.29
|
8.14
|
0.00
|
|||||||||||||||
These tables apply for Updated Policies.
|
TABLE OF SURRENDER CHARGE FACTORS, Male Nicotine/Juvenile
|
||||||||||
|
Per $1,000 of Face Amount
|
||||||||||
|
Number of Full Policy Years Completed Since the Issue Date or Since Increase in Face Amount
|
||||||||||
|
Issue
Age
|
0
|
1
|
2
|
3
|
4
|
5
|
6
|
7
|
8
|
9 or
more
|
|
|
|
|
|
|
|
|
|
|
|
|
|
0
|
3.27
|
3.11
|
2.91
|
2.75
|
2.58
|
2.42
|
2.06
|
1.37
|
0.69
|
—
|
|
|
|
|
|
|
|
|
|
|
|
|
|
1
|
3.30
|
3.14
|
2.94
|
2.77
|
2.61
|
2.44
|
2.08
|
1.39
|
0.69
|
—
|
|
|
|
|
|
|
|
|
|
|
|
|
|
2
|
3.36
|
3.19
|
2.99
|
2.82
|
2.65
|
2.49
|
2.12
|
1.41
|
0.71
|
—
|
|
|
|
|
|
|
|
|
|
|
|
|
|
3
|
3.44
|
3.27
|
3.06
|
2.89
|
2.72
|
2.55
|
2.17
|
1.44
|
0.72
|
—
|
|
|
|
|
|
|
|
|
|
|
|
|
|
4
|
3.51
|
3.33
|
3.12
|
2.95
|
2.77
|
2.60
|
2.21
|
1.47
|
0.74
|
—
|
|
|
|
|
|
|
|
|
|
|
|
|
|
5
|
3.60
|
3.42
|
3.20
|
3.02
|
2.84
|
2.66
|
2.27
|
1.51
|
0.76
|
—
|
|
|
|
|
|
|
|
|
|
|
|
|
|
6
|
3.68
|
3.50
|
3.28
|
3.09
|
2.91
|
2.72
|
2.32
|
1.55
|
0.77
|
—
|
|
|
|
|
|
|
|
|
|
|
|
|
|
7
|
3.78
|
3.59
|
3.36
|
3.18
|
2.99
|
2.80
|
2.38
|
1.59
|
0.79
|
—
|
|
|
|
|
|
|
|
|
|
|
|
|
|
8
|
3.88
|
3.69
|
3.45
|
3.26
|
3.07
|
2.87
|
2.44
|
1.63
|
0.81
|
—
|
|
|
|
|
|
|
|
|
|
|
|
|
|
9
|
3.98
|
3.78
|
3.54
|
3.34
|
3.14
|
2.95
|
2.51
|
1.67
|
0.84
|
—
|
|
|
|
|
|
|
|
|
|
|
|
|
|
10
|
4.09
|
3.89
|
3.64
|
3.44
|
3.23
|
3.03
|
2.58
|
1.72
|
0.86
|
—
|
|
|
|
|
|
|
|
|
|
|
|
|
|
11
|
4.17
|
3.96
|
3.71
|
3.50
|
3.29
|
3.09
|
2.63
|
1.75
|
0.88
|
—
|
|
|
|
|
|
|
|
|
|
|
|
|
|
12
|
4.26
|
4.05
|
3.79
|
3.58
|
3.37
|
3.15
|
2.68
|
1.79
|
0.89
|
—
|
|
|
|
|
|
|
|
|
|
|
|
|
|
13
|
4.34
|
4.12
|
3.86
|
3.65
|
3.43
|
3.21
|
2.73
|
1.82
|
0.91
|
—
|
|
|
|
|
|
|
|
|
|
|
|
|
|
14
|
4.43
|
4.21
|
3.94
|
3.72
|
3.50
|
3.28
|
2.79
|
1.86
|
0.93
|
—
|
|
|
|
|
|
|
|
|
|
|
|
|
|
15
|
4.52
|
4.29
|
4.02
|
3.80
|
3.57
|
3.34
|
2.85
|
1.90
|
0.95
|
—
|
|
|
|
|
|
|
|
|
|
|
|
|
|
16
|
4.63
|
4.40
|
4.12
|
3.89
|
3.66
|
3.43
|
2.92
|
1.94
|
0.97
|
—
|
|
|
|
|
|
|
|
|
|
|
|
|
|
17
|
4.75
|
4.51
|
4.23
|
3.99
|
3.75
|
3.52
|
2.99
|
2.00
|
1.00
|
—
|
|
|
|
|
|
|
|
|
|
|
|
|
|
18
|
4.87
|
4.63
|
4.33
|
4.09
|
3.85
|
3.60
|
3.07
|
2.05
|
1.02
|
—
|
|
|
|
|
|
|
|
|
|
|
|
|
|
19
|
5.00
|
4.75
|
4.45
|
4.20
|
3.95
|
3.70
|
3.15
|
2.10
|
1.05
|
—
|
|
|
|
|
|
|
|
|
|
|
|
|
|
20
|
5.13
|
4.87
|
4.57
|
4.31
|
4.05
|
3.80
|
3.23
|
2.15
|
1.08
|
—
|
|
|
|
|
|
|
|
|
|
|
|
|
|
21
|
7.23
|
6.87
|
6.43
|
6.07
|
5.71
|
5.35
|
4.55
|
3.04
|
1.52
|
—
|
|
|
|
|
|
|
|
|
|
|
|
|
|
22
|
7.46
|
7.09
|
6.64
|
6.27
|
5.89
|
5.52
|
4.70
|
3.13
|
1.57
|
—
|
|
|
|
|
|
|
|
|
|
|
|
|
|
23
|
7.67
|
7.29
|
6.83
|
6.44
|
6.06
|
5.68
|
4.83
|
3.22
|
1.61
|
—
|
|
|
|
|
|
|
|
|
|
|
|
|
|
24
|
7.87
|
7.48
|
7.00
|
6.61
|
6.22
|
5.82
|
4.96
|
3.31
|
1.65
|
—
|
|
|
|
|
|
|
|
|
|
|
|
|
|
25
|
8.10
|
7.70
|
7.21
|
6.80
|
6.40
|
5.99
|
5.10
|
3.40
|
1.70
|
—
|
|
|
|
|
|
|
|
|
|
|
|
|
|
26
|
8.39
|
7.97
|
7.47
|
7.05
|
6.63
|
6.21
|
5.29
|
3.52
|
1.76
|
—
|
|
|
|
|
|
|
|
|
|
|
|
|
|
27
|
8.77
|
8.33
|
7.81
|
7.37
|
6.93
|
6.49
|
5.53
|
3.68
|
1.84
|
—
|
|
|
|
|
|
|
|
|
|
|
|
|
|
28
|
9.20
|
8.74
|
8.19
|
7.73
|
7.27
|
6.81
|
5.80
|
3.86
|
1.93
|
—
|
|
|
|
|
|
|
|
|
|
|
|
|
|
29
|
9.61
|
9.13
|
8.55
|
8.07
|
7.59
|
7.11
|
6.05
|
4.04
|
2.02
|
—
|
|
|
|
|
|
|
|
|
|
|
|
|
|
30
|
10.01
|
9.51
|
8.91
|
8.41
|
7.91
|
7.41
|
6.31
|
4.20
|
2.10
|
—
|
|
|
|
|
|
|
|
|
|
|
|
|
|
31
|
10.42
|
9.90
|
9.27
|
8.75
|
8.23
|
7.71
|
6.56
|
4.38
|
2.19
|
—
|
|
|
|
|
|
|
|
|
|
|
|
|
|
32
|
10.85
|
10.31
|
9.66
|
9.11
|
8.57
|
8.03
|
6.84
|
4.56
|
2.28
|
—
|
|
|
|
|
|
|
|
|
|
|
|
|
|
33
|
11.31
|
10.74
|
10.07
|
9.50
|
8.93
|
8.37
|
7.13
|
4.75
|
2.38
|
—
|
|
|
|
|
|
|
|
|
|
|
|
|
|
34
|
11.80
|
11.21
|
10.50
|
9.91
|
9.32
|
8.73
|
7.43
|
4.96
|
2.48
|
—
|
|
|
|
|
|
|
|
|
|
|
|
|
|
35
|
12.32
|
11.70
|
10.96
|
10.35
|
9.73
|
9.12
|
7.76
|
5.17
|
2.59
|
—
|
|
|
|
|
|
|
|
|
|
|
|
|
|
36
|
12.86
|
12.22
|
11.45
|
10.80
|
10.16
|
9.52
|
8.10
|
5.40
|
2.70
|
—
|
|
|
|
|
|
|
|
|
|
|
|
|
|
37
|
13.44
|
12.77
|
11.96
|
11.29
|
10.62
|
9.95
|
8.47
|
5.64
|
2.82
|
—
|
|
|
|
|
|
|
|
|
|
|
|
|
|
38
|
14.05
|
13.35
|
12.50
|
11.80
|
11.10
|
10.40
|
8.85
|
5.90
|
2.95
|
—
|
|
|
|
|
|
|
|
|
|
|
|
|
|
39
|
14.70
|
13.97
|
13.08
|
12.35
|
11.61
|
10.88
|
9.26
|
6.17
|
3.09
|
—
|
|
|
|
|
|
|
|
|
|
|
|
|
|
40
|
15.43
|
14.66
|
13.73
|
12.96
|
12.19
|
11.42
|
9.72
|
6.48
|
3.24
|
—
|
|
|
|
|
|
|
|
|
|
|
|
|
|
41
|
16.22
|
15.41
|
14.44
|
13.62
|
12.81
|
12.00
|
10.22
|
6.81
|
3.41
|
—
|
|
|
|
|
|
|
|
|
|
|
|
|
|
42
|
17.02
|
16.17
|
15.15
|
14.30
|
13.45
|
12.59
|
10.72
|
7.15
|
3.57
|
—
|
|
|
|
|
|
|
|
|
|
|
|
|
|
43
|
17.83
|
16.94
|
15.87
|
14.98
|
14.09
|
13.19
|
11.23
|
7.49
|
3.74
|
—
|
|
|
|
|
|
|
|
|
|
|
|
|
|
44
|
18.67
|
17.74
|
16.62
|
15.68
|
14.75
|
13.82
|
11.76
|
7.84
|
3.92
|
—
|
|
|
|
|
|
|
|
|
|
|
|
|
|
45
|
19.55
|
18.57
|
17.40
|
16.42
|
15.44
|
14.47
|
12.32
|
8.21
|
4.11
|
—
|
|
|
|
|
|
|
|
|
|
|
|
|
|
46
|
20.47
|
19.45
|
18.22
|
17.19
|
16.17
|
15.15
|
12.90
|
8.60
|
4.30
|
—
|
|
|
|
|
|
|
|
|
|
|
|
|
|
47
|
21.43
|
20.36
|
19.07
|
18.00
|
16.93
|
15.86
|
13.50
|
9.00
|
4.50
|
—
|
|
|
|
|
|
|
|
|
|
|
|
|
|
48
|
22.46
|
21.34
|
19.99
|
18.87
|
17.74
|
16.62
|
14.15
|
9.43
|
4.72
|
—
|
|
|
|
|
|
|
|
|
|
|
|
|
|
49
|
23.59
|
22.41
|
21.00
|
19.82
|
18.64
|
17.46
|
14.86
|
9.91
|
4.95
|
—
|
|
|
|
|
|
|
|
|
|
|
|
|
|
50
|
24.75
|
23.51
|
22.03
|
20.79
|
19.55
|
18.32
|
15.59
|
10.40
|
5.20
|
—
|
|
|
|
|
|
|
|
|
|
|
|
|
|
51
|
25.86
|
24.57
|
23.02
|
21.72
|
20.43
|
19.14
|
16.29
|
10.86
|
5.43
|
—
|
|
|
|
|
|
|
|
|
|
|
|
|
|
52
|
26.95
|
25.60
|
23.99
|
22.64
|
21.29
|
19.94
|
16.98
|
11.32
|
5.66
|
—
|
|
|
|
|
|
|
|
|
|
|
|
|
|
53
|
28.18
|
26.77
|
25.08
|
23.67
|
22.26
|
20.85
|
17.75
|
11.84
|
5.92
|
—
|
|
|
|
|
|
|
|
|
|
|
|
|
|
54
|
29.61
|
28.13
|
26.35
|
24.87
|
23.39
|
21.91
|
18.65
|
12.44
|
6.22
|
—
|
|
|
|
|
|
|
|
|
|
|
|
|
|
55
|
31.03
|
29.48
|
27.62
|
26.07
|
24.51
|
22.96
|
19.55
|
13.03
|
6.52
|
—
|
|
|
|
|
|
|
|
|
|
|
|
|
|
56
|
32.43
|
30.81
|
28.86
|
27.24
|
25.62
|
24.00
|
20.43
|
13.62
|
6.81
|
—
|
|
|
|
|
|
|
|
|
|
|
|
|
|
57
|
34.24
|
32.53
|
30.47
|
28.76
|
27.05
|
25.34
|
21.57
|
14.38
|
7.19
|
—
|
|
|
|
|
|
|
|
|
|
|
|
|
|
58
|
36.45
|
34.63
|
32.44
|
30.62
|
28.80
|
26.97
|
22.96
|
15.31
|
7.65
|
—
|
|
|
|
|
|
|
|
|
|
|
|
|
|
59
|
38.40
|
36.48
|
34.18
|
32.26
|
30.34
|
28.42
|
24.19
|
16.13
|
8.06
|
—
|
|
|
|
|
|
|
|
|
|
|
|
|
|
60
|
38.40
|
36.48
|
34.18
|
32.26
|
30.34
|
28.42
|
24.19
|
16.13
|
8.06
|
—
|
|
|
|
|
|
|
|
|
|
|
|
|
|
61
|
38.40
|
36.48
|
34.18
|
32.26
|
30.34
|
28.42
|
24.19
|
16.13
|
8.06
|
—
|
|
|
|
|
|
|
|
|
|
|
|
|
|
62
|
38.40
|
36.48
|
34.18
|
32.26
|
30.34
|
28.42
|
24.19
|
16.13
|
8.06
|
—
|
|
|
|
|
|
|
|
|
|
|
|
|
|
63
|
38.40
|
36.48
|
34.18
|
32.26
|
30.34
|
28.42
|
24.19
|
16.13
|
8.06
|
—
|
|
|
|
|
|
|
|
|
|
|
|
|
|
64
|
39.90
|
37.91
|
35.51
|
33.52
|
31.52
|
29.53
|
25.14
|
16.76
|
8.38
|
—
|
|
|
|
|
|
|
|
|
|
|
|
|
|
65
|
41.40
|
39.33
|
36.85
|
34.78
|
32.71
|
30.64
|
26.08
|
17.39
|
8.69
|
—
|
|
|
|
|
|
|
|
|
|
|
|
|
|
66
|
42.90
|
40.76
|
38.18
|
36.04
|
33.89
|
31.75
|
27.03
|
18.02
|
9.01
|
—
|
|
|
|
|
|
|
|
|
|
|
|
|
|
67
|
44.40
|
42.18
|
39.52
|
37.30
|
35.08
|
32.86
|
27.97
|
18.65
|
9.32
|
—
|
|
|
|
|
|
|
|
|
|
|
|
|
|
68
|
44.40
|
42.18
|
39.52
|
37.30
|
35.08
|
32.86
|
27.97
|
18.65
|
9.32
|
—
|
|
|
|
|
|
|
|
|
|
|
|
|
|
69
|
43.90
|
41.71
|
39.07
|
36.88
|
34.68
|
32.49
|
27.66
|
18.44
|
9.22
|
—
|
|
|
|
|
|
|
|
|
|
|
|
|
|
70
|
43.30
|
41.14
|
38.54
|
36.37
|
34.21
|
32.04
|
27.28
|
18.19
|
9.09
|
—
|
|
|
|
|
|
|
|
|
|
|
|
|
|
71
|
42.50
|
40.38
|
37.83
|
35.70
|
33.58
|
31.45
|
26.78
|
17.85
|
8.93
|
—
|
|
|
|
|
|
|
|
|
|
|
|
|
|
72
|
41.60
|
39.52
|
37.02
|
34.94
|
32.86
|
30.78
|
26.21
|
17.47
|
8.74
|
—
|
|
|
|
|
|
|
|
|
|
|
|
|
|
73
|
40.70
|
38.67
|
36.22
|
34.19
|
32.15
|
30.12
|
25.64
|
17.09
|
8.55
|
—
|
|
|
|
|
|
|
|
|
|
|
|
|
|
74
|
39.90
|
37.91
|
35.51
|
33.52
|
31.52
|
29.53
|
25.14
|
16.76
|
8.38
|
—
|
|
|
|
|
|
|
|
|
|
|
|
|
|
75
|
39.00
|
37.05
|
34.71
|
32.76
|
30.81
|
28.86
|
24.57
|
16.38
|
8.19
|
—
|
|
|
|
|
|
|
|
|
|
|
|
|
|
76
|
38.60
|
36.67
|
34.35
|
32.42
|
30.49
|
28.56
|
24.32
|
16.21
|
8.11
|
—
|
|
|
|
|
|
|
|
|
|
|
|
|
|
77
|
38.10
|
36.20
|
33.91
|
32.00
|
30.10
|
28.19
|
24.00
|
16.00
|
8.00
|
—
|
|
|
|
|
|
|
|
|
|
|
|
|
|
78
|
37.60
|
35.72
|
33.46
|
31.58
|
29.70
|
27.82
|
23.69
|
15.79
|
7.90
|
—
|
|
|
|
|
|
|
|
|
|
|
|
|
|
79
|
37.20
|
35.34
|
33.11
|
31.25
|
29.39
|
27.53
|
23.44
|
15.62
|
7.81
|
—
|
|
|
|
|
|
|
|
|
|
|
|
|
|
80
|
36.70
|
34.87
|
32.66
|
30.83
|
28.99
|
27.16
|
23.12
|
15.41
|
7.71
|
—
|
|
TABLE OF SURRENDER CHARGE FACTORS, Male Non-Nicotine
|
||||||||||||||||||||
|
Per $1,000 of Face Amount
|
||||||||||||||||||||
|
Number of Full Policy Years Completed Since the Issue Date or Since Increase in Face Amount
|
||||||||||||||||||||
|
Issue
Age
|
0
|
1
|
2
|
3
|
4
|
5
|
6
|
7
|
8
|
9 or
more
|
||||||||||
|
|
|
|
|
|
|
|
|
|
|
|
||||||||||
|
21
|
5.22
|
4.96
|
4.65
|
4.38
|
4.12
|
3.86
|
3.29
|
2.19
|
1.10
|
—
|
||||||||||
|
|
|
|
|
|
|
|
|
|
|
|
||||||||||
|
22
|
5.33
|
5.06
|
4.74
|
4.48
|
4.21
|
3.94
|
3.36
|
2.24
|
1.12
|
—
|
||||||||||
|
|
|
|
|
|
|
|
|
|
|
|
||||||||||
|
23
|
5.47
|
5.20
|
4.87
|
4.59
|
4.32
|
4.05
|
3.45
|
2.30
|
1.15
|
—
|
||||||||||
|
|
|
|
|
|
|
|
|
|
|
|
||||||||||
|
24
|
5.63
|
5.35
|
5.01
|
4.73
|
4.45
|
4.17
|
3.55
|
2.36
|
1.18
|
—
|
||||||||||
|
|
|
|
|
|
|
|
|
|
|
|
||||||||||
|
25
|
5.83
|
5.54
|
5.19
|
4.90
|
4.61
|
4.31
|
3.67
|
2.45
|
1.22
|
—
|
||||||||||
|
|
|
|
|
|
|
|
|
|
|
|
||||||||||
|
26
|
6.11
|
5.80
|
5.44
|
5.13
|
4.83
|
4.52
|
3.85
|
2.57
|
1.28
|
—
|
||||||||||
|
|
|
|
|
|
|
|
|
|
|
|
||||||||||
|
27
|
6.48
|
6.16
|
5.77
|
5.44
|
5.12
|
4.80
|
4.08
|
2.72
|
1.36
|
—
|
||||||||||
|
|
|
|
|
|
|
|
|
|
|
|
||||||||||
|
28
|
6.92
|
6.57
|
6.16
|
5.81
|
5.47
|
5.12
|
4.36
|
2.91
|
1.45
|
—
|
||||||||||
|
|
|
|
|
|
|
|
|
|
|
|
||||||||||
|
29
|
7.35
|
6.98
|
6.54
|
6.17
|
5.81
|
5.44
|
4.63
|
3.09
|
1.54
|
—
|
||||||||||
|
|
|
|
|
|
|
|
|
|
|
|
||||||||||
|
30
|
7.78
|
7.39
|
6.92
|
6.54
|
6.15
|
5.76
|
4.90
|
3.27
|
1.63
|
—
|
||||||||||
|
|
|
|
|
|
|
|
|
|
|
|
||||||||||
|
31
|
8.22
|
7.81
|
7.32
|
6.90
|
6.49
|
6.08
|
5.18
|
3.45
|
1.73
|
—
|
||||||||||
|
|
|
|
|
|
|
|
|
|
|
|
||||||||||
|
32
|
8.67
|
8.24
|
7.72
|
7.28
|
6.85
|
6.42
|
5.46
|
3.64
|
1.82
|
—
|
||||||||||
|
|
|
|
|
|
|
|
|
|
|
|
||||||||||
|
33
|
9.13
|
8.67
|
8.13
|
7.67
|
7.21
|
6.76
|
5.75
|
3.83
|
1.92
|
—
|
||||||||||
|
|
|
|
|
|
|
|
|
|
|
|
||||||||||
|
34
|
9.59
|
9.11
|
8.54
|
8.06
|
7.58
|
7.10
|
6.04
|
4.03
|
2.01
|
—
|
||||||||||
|
|
|
|
|
|
|
|
|
|
|
|
||||||||||
|
35
|
10.06
|
9.56
|
8.95
|
8.45
|
7.95
|
7.44
|
6.34
|
4.23
|
2.11
|
—
|
||||||||||
|
|
|
|
|
|
|
|
|
|
|
|
||||||||||
|
36
|
10.63
|
10.10
|
9.46
|
8.93
|
8.40
|
7.87
|
6.70
|
4.46
|
2.23
|
—
|
||||||||||
|
|
|
|
|
|
|
|
|
|
|
|
||||||||||
|
37
|
11.28
|
10.72
|
10.04
|
9.48
|
8.91
|
8.35
|
7.11
|
4.74
|
2.37
|
—
|
||||||||||
|
|
|
|
|
|
|
|
|
|
|
|
||||||||||
|
38
|
11.94
|
11.34
|
10.63
|
10.03
|
9.43
|
8.84
|
7.52
|
5.01
|
2.51
|
—
|
||||||||||
|
|
|
|
|
|
|
|
|
|
|
|
||||||||||
|
39
|
12.60
|
11.97
|
11.21
|
10.58
|
9.95
|
9.32
|
7.94
|
5.29
|
2.65
|
—
|
||||||||||
|
|
|
|
|
|
|
|
|
|
|
|
||||||||||
|
40
|
13.25
|
12.59
|
11.79
|
11.13
|
10.47
|
9.81
|
8.35
|
5.57
|
2.78
|
—
|
||||||||||
|
|
|
|
|
|
|
|
|
|
|
|
||||||||||
|
41
|
13.85
|
13.16
|
12.33
|
11.63
|
10.94
|
10.25
|
8.73
|
5.82
|
2.91
|
—
|
||||||||||
|
|
|
|
|
|
|
|
|
|
|
|
||||||||||
|
42
|
14.43
|
13.71
|
12.84
|
12.12
|
11.40
|
10.68
|
9.09
|
6.06
|
3.03
|
—
|
||||||||||
|
|
|
|
|
|
|
|
|
|
|
|
||||||||||
|
43
|
15.09
|
14.34
|
13.43
|
12.68
|
11.92
|
11.17
|
9.51
|
6.34
|
3.17
|
—
|
||||||||||
|
|
|
|
|
|
|
|
|
|
|
|
||||||||||
|
44
|
15.74
|
14.95
|
14.01
|
13.22
|
12.43
|
11.65
|
9.92
|
6.61
|
3.31
|
—
|
||||||||||
|
|
|
|
|
|
|
|
|
|
|
|
||||||||||
|
45
|
16.26
|
15.45
|
14.47
|
13.66
|
12.85
|
12.03
|
10.24
|
6.83
|
3.41
|
—
|
||||||||||
|
|
|
|
|
|
|
|
|
|
|
|
||||||||||
|
46
|
16.76
|
15.92
|
14.92
|
14.08
|
13.24
|
12.40
|
10.56
|
7.04
|
3.52
|
—
|
||||||||||
|
|
|
|
|
|
|
|
|
|
|
|
||||||||||
|
47
|
17.48
|
16.61
|
15.56
|
14.68
|
13.81
|
12.94
|
11.01
|
7.34
|
3.67
|
—
|
||||||||||
|
|
|
|
|
|
|
|
|
|
|
|
||||||||||
|
48
|
18.37
|
17.45
|
16.35
|
15.43
|
14.51
|
13.59
|
11.57
|
7.72
|
3.86
|
—
|
||||||||||
|
|
|
|
|
|
|
|
|
|
|
|
||||||||||
|
49
|
19.41
|
18.44
|
17.27
|
16.30
|
15.33
|
14.36
|
12.23
|
8.15
|
4.08
|
—
|
||||||||||
|
|
|
|
|
|
|
|
|
|
|
|
||||||||||
|
50
|
20.60
|
19.57
|
18.33
|
17.30
|
16.27
|
15.24
|
12.98
|
8.65
|
4.33
|
—
|
||||||||||
|
|
|
|
|
|
|
|
|
|
|
|
||||||||||
|
51
|
21.81
|
20.72
|
19.41
|
18.32
|
17.23
|
16.14
|
13.74
|
9.16
|
4.58
|
—
|
||||||||||
|
|
|
|
|
|
|
|
|
|
|
|
||||||||||
|
52
|
22.91
|
21.76
|
20.39
|
19.24
|
18.10
|
16.95
|
14.43
|
9.62
|
4.81
|
—
|
||||||||||
|
|
|
|
|
|
|
|
|
|
|
|
||||||||||
|
53
|
24.04
|
22.84
|
21.40
|
20.19
|
18.99
|
17.79
|
15.15
|
10.10
|
5.05
|
—
|
||||||||||
|
|
|
|
|
|
|
|
|
|
|
|
||||||||||
|
54
|
25.27
|
24.01
|
22.49
|
21.23
|
19.96
|
18.70
|
15.92
|
10.61
|
5.31
|
—
|
||||||||||
|
|
|
|
|
|
|
|
|
|
|
|
||||||||||
|
55
|
26.35
|
25.03
|
23.45
|
22.13
|
20.82
|
19.50
|
16.60
|
11.07
|
5.53
|
—
|
||||||||||
|
|
|
|
|
|
|
|
|
|
|
|
||||||||||
|
56
|
27.03
|
25.68
|
24.06
|
22.71
|
21.35
|
20.00
|
17.03
|
11.35
|
5.68
|
—
|
||||||||||
|
|
|
|
|
|
|
|
|
|
|
|
||||||||||
|
57
|
27.80
|
26.41
|
24.74
|
23.35
|
21.96
|
20.57
|
17.51
|
11.68
|
5.84
|
—
|
||||||||||
|
|
|
|
|
|
|
|
|
|
|
|
||||||||||
|
58
|
28.67
|
27.24
|
25.52
|
24.08
|
22.65
|
21.22
|
18.06
|
12.04
|
6.02
|
—
|
||||||||||
|
|
|
|
|
|
|
|
|
|
|
|
||||||||||
|
59
|
29.64
|
28.16
|
26.38
|
24.90
|
23.42
|
21.93
|
18.67
|
12.45
|
6.22
|
—
|
||||||||||
|
|
|
|
|
|
|
|
|
|
|
|
||||||||||
|
60
|
30.73
|
29.19
|
27.35
|
25.81
|
24.28
|
22.74
|
19.36
|
12.91
|
6.45
|
—
|
||||||||||
|
|
|
|
|
|
|
|
|
|
|
|
||||||||||
|
61
|
32.05
|
30.45
|
28.52
|
26.92
|
25.32
|
23.72
|
20.19
|
13.46
|
6.73
|
—
|
||||||||||
|
62
|
33.51
|
31.83
|
29.82
|
28.15
|
26.47
|
24.80
|
21.11
|
14.07
|
7.04
|
—
|
||||||||||
|
|
|
|
|
|
|
|
|
|
|
|
||||||||||
|
63
|
35.10
|
33.35
|
31.24
|
29.48
|
27.73
|
25.97
|
22.11
|
14.74
|
7.37
|
—
|
||||||||||
|
|
|
|
|
|
|
|
|
|
|
|
||||||||||
|
64
|
36.83
|
34.99
|
32.78
|
30.94
|
29.10
|
27.25
|
23.20
|
15.47
|
7.73
|
—
|
||||||||||
|
|
|
|
|
|
|
|
|
|
|
|
||||||||||
|
65
|
38.72
|
36.78
|
34.46
|
32.52
|
30.59
|
28.65
|
24.39
|
16.26
|
8.13
|
—
|
||||||||||
|
|
|
|
|
|
|
|
|
|
|
|
||||||||||
|
66
|
40.74
|
38.70
|
36.26
|
34.22
|
32.18
|
30.15
|
25.67
|
17.11
|
8.56
|
—
|
||||||||||
|
|
|
|
|
|
|
|
|
|
|
|
||||||||||
|
67
|
42.97
|
40.82
|
38.24
|
36.09
|
33.95
|
31.80
|
27.07
|
18.05
|
9.02
|
—
|
||||||||||
|
|
|
|
|
|
|
|
|
|
|
|
||||||||||
|
68
|
44.40
|
42.18
|
39.52
|
37.30
|
35.08
|
32.86
|
27.97
|
18.65
|
9.32
|
—
|
||||||||||
|
|
|
|
|
|
|
|
|
|
|
|
||||||||||
|
69
|
43.90
|
41.71
|
39.07
|
36.88
|
34.68
|
32.49
|
27.66
|
18.44
|
9.22
|
—
|
||||||||||
|
|
|
|
|
|
|
|
|
|
|
|
||||||||||
|
70
|
43.30
|
41.14
|
38.54
|
36.37
|
34.21
|
32.04
|
27.28
|
18.19
|
9.09
|
—
|
||||||||||
|
|
|
|
|
|
|
|
|
|
|
|
||||||||||
|
71
|
42.50
|
40.38
|
37.83
|
35.70
|
33.58
|
31.45
|
26.78
|
17.85
|
8.93
|
—
|
||||||||||
|
|
|
|
|
|
|
|
|
|
|
|
||||||||||
|
72
|
41.60
|
39.52
|
37.02
|
34.94
|
32.86
|
30.78
|
26.21
|
17.47
|
8.74
|
—
|
||||||||||
|
|
|
|
|
|
|
|
|
|
|
|
||||||||||
|
73
|
40.70
|
38.67
|
36.22
|
34.19
|
32.15
|
30.12
|
25.64
|
17.09
|
8.55
|
—
|
||||||||||
|
|
|
|
|
|
|
|
|
|
|
|
||||||||||
|
74
|
39.90
|
37.91
|
35.51
|
33.52
|
31.52
|
29.53
|
25.14
|
16.76
|
8.38
|
—
|
||||||||||
|
|
|
|
|
|
|
|
|
|
|
|
||||||||||
|
75
|
39.00
|
37.05
|
34.71
|
32.76
|
30.81
|
28.86
|
24.57
|
16.38
|
8.19
|
—
|
||||||||||
|
|
|
|
|
|
|
|
|
|
|
|
||||||||||
|
76
|
38.60
|
36.67
|
34.35
|
32.42
|
30.49
|
28.56
|
24.32
|
16.21
|
8.11
|
—
|
||||||||||
|
|
|
|
|
|
|
|
|
|
|
|
||||||||||
|
77
|
38.05
|
36.15
|
33.86
|
31.96
|
30.06
|
28.16
|
23.97
|
15.98
|
7.99
|
—
|
||||||||||
|
|
|
|
|
|
|
|
|
|
|
|
||||||||||
|
78
|
37.50
|
35.63
|
33.38
|
31.50
|
29.63
|
27.75
|
23.63
|
15.75
|
7.88
|
—
|
||||||||||
|
|
|
|
|
|
|
|
|
|
|
|
||||||||||
|
79
|
36.65
|
34.82
|
32.62
|
30.79
|
28.95
|
27.12
|
23.09
|
15.39
|
7.70
|
—
|
||||||||||
|
|
|
|
|
|
|
|
|
|
|
|
||||||||||
|
80
|
35.85
|
34.06
|
31.91
|
30.11
|
28.32
|
26.53
|
22.59
|
15.06
|
7.53
|
—
|
||||||||||
|
TABLE OF SURRENDER CHARGE FACTORS, Female Nicotine/Juvenile
|
|||||||||||||||||||||||||||||
|
Per $1,000 of Face Amount
|
|||||||||||||||||||||||||||||
|
Number of Full Policy Years Completed Since the Issue Date or Since Increase in Face Amount
|
|||||||||||||||||||||||||||||
|
Issue
Age
|
0
|
1
|
2
|
3
|
4
|
5
|
6
|
7
|
8
|
9 or
more
|
|||||||||||||||||||
|
|
|
|
|
|
|
|
|
|
|
|
|||||||||||||||||||
|
0
|
3.00
|
2.85
|
2.67
|
2.52
|
2.37
|
2.22
|
1.89
|
1.26
|
0.63
|
—
|
|||||||||||||||||||
|
|
|
|
|
|
|
|
|
|
|
|
|||||||||||||||||||
|
1
|
3.03
|
2.88
|
2.70
|
2.55
|
2.39
|
2.24
|
1.91
|
1.27
|
0.64
|
—
|
|||||||||||||||||||
|
|
|
|
|
|
|
|
|
|
|
|
|||||||||||||||||||
|
2
|
3.08
|
2.93
|
2.74
|
2.59
|
2.43
|
2.28
|
1.94
|
1.29
|
0.65
|
—
|
|||||||||||||||||||
|
|
|
|
|
|
|
|
|
|
|
|
|||||||||||||||||||
|
3
|
3.15
|
2.99
|
2.80
|
2.65
|
2.49
|
2.33
|
1.98
|
1.32
|
0.66
|
—
|
|||||||||||||||||||
|
|
|
|
|
|
|
|
|
|
|
|
|||||||||||||||||||
|
4
|
3.22
|
3.06
|
2.87
|
2.70
|
2.54
|
2.38
|
2.03
|
1.35
|
0.68
|
—
|
|||||||||||||||||||
|
|
|
|
|
|
|
|
|
|
|
|
|||||||||||||||||||
|
5
|
3.29
|
3.13
|
2.93
|
2.76
|
2.60
|
2.43
|
2.07
|
1.38
|
0.69
|
—
|
|||||||||||||||||||
|
|
|
|
|
|
|
|
|
|
|
|
|||||||||||||||||||
|
6
|
3.36
|
3.19
|
2.99
|
2.82
|
2.65
|
2.49
|
2.12
|
1.41
|
0.71
|
—
|
|||||||||||||||||||
|
|
|
|
|
|
|
|
|
|
|
|
|||||||||||||||||||
|
7
|
3.45
|
3.28
|
3.07
|
2.90
|
2.73
|
2.55
|
2.17
|
1.45
|
0.72
|
—
|
|||||||||||||||||||
|
|
|
|
|
|
|
|
|
|
|
|
|||||||||||||||||||
|
8
|
3.53
|
3.35
|
3.14
|
2.97
|
2.79
|
2.61
|
2.22
|
1.48
|
0.74
|
—
|
|||||||||||||||||||
|
|
|
|
|
|
|
|
|
|
|
|
|||||||||||||||||||
|
9
|
3.62
|
3.44
|
3.22
|
3.04
|
2.86
|
2.68
|
2.28
|
1.52
|
0.76
|
—
|
|||||||||||||||||||
|
|
|
|
|
|
|
|
|
|
|
|
|||||||||||||||||||
|
10
|
3.72
|
3.53
|
3.31
|
3.12
|
2.94
|
2.75
|
2.34
|
1.56
|
0.78
|
—
|
|||||||||||||||||||
|
|
|
|
|
|
|
|
|
|
|
|
|||||||||||||||||||
|
11
|
3.79
|
3.60
|
3.37
|
3.18
|
2.99
|
2.80
|
2.39
|
1.59
|
0.80
|
—
|
|||||||||||||||||||
|
|
|
|
|
|
|
|
|
|
|
|
|||||||||||||||||||
|
12
|
3.86
|
3.67
|
3.44
|
3.24
|
3.05
|
2.86
|
2.43
|
1.62
|
0.81
|
—
|
|||||||||||||||||||
|
|
|
|
|
|
|
|
|
|
|
|
|||||||||||||||||||
|
13
|
3.94
|
3.74
|
3.51
|
3.31
|
3.11
|
2.92
|
2.48
|
1.65
|
0.83
|
—
|
|||||||||||||||||||
|
|
|
|
|
|
|
|
|
|
|
|
|||||||||||||||||||
|
14
|
4.02
|
3.82
|
3.58
|
3.38
|
3.18
|
2.97
|
2.53
|
1.69
|
0.84
|
—
|
|||||||||||||||||||
|
|
|
|
|
|
|
|
|
|
|
|
|||||||||||||||||||
|
15
|
4.10
|
3.90
|
3.65
|
3.44
|
3.24
|
3.03
|
2.58
|
1.72
|
0.86
|
—
|
|||||||||||||||||||
|
|
|
|
|
|
|
|
|
|
|
|
|||||||||||||||||||
|
16
|
4.19
|
3.98
|
3.73
|
3.52
|
3.31
|
3.10
|
2.64
|
1.76
|
0.88
|
—
|
|||||||||||||||||||
|
|
|
|
|
|
|
|
|
|
|
|
|||||||||||||||||||
|
17
|
4.28
|
4.07
|
3.81
|
3.60
|
3.38
|
3.17
|
2.70
|
1.80
|
0.90
|
—
|
|||||||||||||||||||
|
|
|
|
|
|
|
|
|
|
|
|
|||||||||||||||||||
|
18
|
4.38
|
4.16
|
3.90
|
3.68
|
3.46
|
3.24
|
2.76
|
1.84
|
0.92
|
—
|
|||||||||||||||||||
|
|
|
|
|
|
|
|
|
|
|
|
|||||||||||||||||||
|
19
|
4.47
|
4.25
|
3.98
|
3.75
|
3.53
|
3.31
|
2.82
|
1.88
|
0.94
|
—
|
|||||||||||||||||||
|
|
|
|
|
|
|
|
|
|
|
|
|||||||||||||||||||
|
20
|
4.57
|
4.34
|
4.07
|
3.84
|
3.61
|
3.38
|
2.88
|
1.92
|
0.96
|
—
|
|||||||||||||||||||
|
|
|
|
|
|
|
|
|
|
|
|
|||||||||||||||||||
|
21
|
5.09
|
4.84
|
4.53
|
4.28
|
4.02
|
3.77
|
3.21
|
2.14
|
1.07
|
—
|
|||||||||||||||||||
|
|
|
|
|
|
|
|
|
|
|
|
|||||||||||||||||||
|
22
|
5.18
|
4.92
|
4.61
|
4.35
|
4.09
|
3.83
|
3.26
|
2.18
|
1.09
|
—
|
|||||||||||||||||||
|
|
|
|
|
|
|
|
|
|
|
|
|||||||||||||||||||
|
23
|
5.28
|
5.02
|
4.70
|
4.44
|
4.17
|
3.91
|
3.33
|
2.22
|
1.11
|
—
|
|||||||||||||||||||
|
|
|
|
|
|
|
|
|
|
|
|
|||||||||||||||||||
|
24
|
5.35
|
5.08
|
4.76
|
4.49
|
4.23
|
3.96
|
3.37
|
2.25
|
1.12
|
—
|
|||||||||||||||||||
|
|
|
|
|
|
|
|
|
|
|
|
|||||||||||||||||||
|
25
|
5.45
|
5.18
|
4.85
|
4.58
|
4.31
|
4.03
|
3.43
|
2.29
|
1.14
|
—
|
|||||||||||||||||||
|
|
|
|
|
|
|
|
|
|
|
|
|||||||||||||||||||
|
26
|
5.65
|
5.37
|
5.03
|
4.75
|
4.46
|
4.18
|
3.56
|
2.37
|
1.19
|
—
|
|||||||||||||||||||
|
|
|
|
|
|
|
|
|
|
|
|
|||||||||||||||||||
|
27
|
5.95
|
5.65
|
5.30
|
5.00
|
4.70
|
4.40
|
3.75
|
2.50
|
1.25
|
—
|
|||||||||||||||||||
|
|
|
|
|
|
|
|
|
|
|
|
|||||||||||||||||||
|
28
|
6.29
|
5.98
|
5.60
|
5.28
|
4.97
|
4.65
|
3.96
|
2.64
|
1.32
|
—
|
|||||||||||||||||||
|
|
|
|
|
|
|
|
|
|
|
|
|||||||||||||||||||
|
29
|
6.59
|
6.26
|
5.87
|
5.54
|
5.21
|
4.88
|
4.15
|
2.77
|
1.38
|
—
|
|||||||||||||||||||
|
|
|
|
|
|
|
|
|
|
|
|
|||||||||||||||||||
|
30
|
6.87
|
6.53
|
6.11
|
5.77
|
5.43
|
5.08
|
4.33
|
2.89
|
1.44
|
—
|
|||||||||||||||||||
|
|
|
|
|
|
|
|
|
|
|
|
|||||||||||||||||||
|
31
|
7.18
|
6.82
|
6.39
|
6.03
|
5.67
|
5.31
|
4.52
|
3.02
|
1.51
|
—
|
|||||||||||||||||||
|
|
|
|
|
|
|
|
|
|
|
|
|||||||||||||||||||
|
32
|
7.57
|
7.19
|
6.74
|
6.36
|
5.98
|
5.60
|
4.77
|
3.18
|
1.59
|
—
|
|||||||||||||||||||
|
|
|
|
|
|
|
|
|
|
|
|
|||||||||||||||||||
|
33
|
8.02
|
7.62
|
7.14
|
6.74
|
6.34
|
5.93
|
5.05
|
3.37
|
1.68
|
—
|
|||||||||||||||||||
|
|
|
|
|
|
|
|
|
|
|
|
|||||||||||||||||||
|
34
|
8.44
|
8.02
|
7.51
|
7.09
|
6.67
|
6.25
|
5.32
|
3.54
|
1.77
|
—
|
|||||||||||||||||||
|
|
|
|
|
|
|
|
|
|
|
|
|||||||||||||||||||
|
35
|
8.83
|
8.39
|
7.86
|
7.42
|
6.98
|
6.53
|
5.56
|
3.71
|
1.85
|
—
|
|||||||||||||||||||
|
|
|
|
|
|
|
|
|
|
|
|
|||||||||||||||||||
|
36
|
9.21
|
8.75
|
8.20
|
7.74
|
7.28
|
6.82
|
5.80
|
3.87
|
1.93
|
—
|
|||||||||||||||||||
|
|
|
|
|
|
|
|
|
|
|
|
|||||||||||||||||||
|
37
|
9.62
|
9.14
|
8.56
|
8.08
|
7.60
|
7.12
|
6.06
|
4.04
|
2.02
|
—
|
|||||||||||||||||||
|
|
|
|
|
|
|
|
|
|
|
|
|||||||||||||||||||
|
38
|
10.05
|
9.55
|
8.94
|
8.44
|
7.94
|
7.44
|
6.33
|
4.22
|
2.11
|
—
|
|||||||||||||||||||
|
|
|
|
|
|
|
|
|
|
|
|
|||||||||||||||||||
|
39
|
10.48
|
9.96
|
9.33
|
8.80
|
8.28
|
7.76
|
6.60
|
4.40
|
2.20
|
—
|
|||||||||||||||||||
|
|
|
|
|
|
|
|
|
|
|
|
|||||||||||||||||||
|
40
|
10.92
|
10.37
|
9.72
|
9.17
|
8.63
|
8.08
|
6.88
|
4.59
|
2.29
|
—
|
|||||||||||||||||||
|
|
|
|
|
|
|
|
|
|
|
|
|||||||||||||||||||
|
41
|
11.37
|
10.80
|
10.12
|
9.55
|
8.98
|
8.41
|
7.16
|
4.78
|
2.39
|
—
|
|||||||||||||||||||
|
|
|
|
|
|
|
|
|
|
|
|
|||||||||||||||||||
|
42
|
11.83
|
11.24
|
10.53
|
9.94
|
9.35
|
8.75
|
7.45
|
4.97
|
2.48
|
—
|
|||||||||||||||||||
|
|
|
|
|
|
|
|
|
|
|
|
|||||||||||||||||||
|
43
|
12.30
|
11.69
|
10.95
|
10.33
|
9.72
|
9.10
|
7.75
|
5.17
|
2.58
|
—
|
|||||||||||||||||||
|
|
|
|
|
|
|
|
|
|
|
|
|||||||||||||||||||
|
44
|
12.75
|
12.11
|
11.35
|
10.71
|
10.07
|
9.44
|
8.03
|
5.36
|
2.68
|
—
|
|||||||||||||||||||
|
|
|
|
|
|
|
|
|
|
|
|
|||||||||||||||||||
|
45
|
13.13
|
12.47
|
11.69
|
11.03
|
10.37
|
9.72
|
8.27
|
5.51
|
2.76
|
—
|
|||||||||||||||||||
|
|
|
|
|
|
|
|
|
|
|
|
|||||||||||||||||||
|
46
|
13.43
|
12.76
|
11.95
|
11.28
|
10.61
|
9.94
|
8.46
|
5.64
|
2.82
|
—
|
|||||||||||||||||||
|
|
|
|
|
|
|
|
|
|
|
|
|||||||||||||||||||
|
47
|
14.08
|
13.38
|
12.53
|
11.83
|
11.12
|
10.42
|
8.87
|
5.91
|
2.96
|
—
|
|||||||||||||||||||
|
|
|
|
|
|
|
|
|
|
|
|
|||||||||||||||||||
|
48
|
14.75
|
14.01
|
13.13
|
12.39
|
11.65
|
10.92
|
9.29
|
6.20
|
3.10
|
—
|
|||||||||||||||||||
|
|
|
|
|
|
|
|
|
|
|
|
|||||||||||||||||||
|
49
|
15.47
|
14.70
|
13.77
|
12.99
|
12.22
|
11.45
|
9.75
|
6.50
|
3.25
|
—
|
|||||||||||||||||||
|
|
|
|
|
|
|
|
|
|
|
|
|||||||||||||||||||
|
50
|
16.23
|
15.42
|
14.44
|
13.63
|
12.82
|
12.01
|
10.22
|
6.82
|
3.41
|
—
|
|||||||||||||||||||
|
|
|
|
|
|
|
|
|
|
|
|
|||||||||||||||||||
|
51
|
17.16
|
16.30
|
15.27
|
14.41
|
13.56
|
12.70
|
10.81
|
7.21
|
3.60
|
—
|
|||||||||||||||||||
|
|
|
|
|
|
|
|
|
|
|
|
|||||||||||||||||||
|
52
|
17.94
|
17.04
|
15.97
|
15.07
|
14.17
|
13.28
|
11.30
|
7.53
|
3.77
|
—
|
|||||||||||||||||||
|
|
|
|
|
|
|
|
|
|
|
|
|||||||||||||||||||
|
53
|
18.72
|
17.78
|
16.66
|
15.72
|
14.79
|
13.85
|
11.79
|
7.86
|
3.93
|
—
|
|||||||||||||||||||
|
|
|
|
|
|
|
|
|
|
|
|
|||||||||||||||||||
|
54
|
19.58
|
18.60
|
17.43
|
16.45
|
15.47
|
14.49
|
12.34
|
8.22
|
4.11
|
—
|
|||||||||||||||||||
|
|
|
|
|
|
|
|
|
|
|
|
|||||||||||||||||||
|
55
|
20.53
|
19.50
|
18.27
|
17.25
|
16.22
|
15.19
|
12.93
|
8.62
|
4.31
|
—
|
|||||||||||||||||||
|
|
|
|
|
|
|
|
|
|
|
|
|||||||||||||||||||
|
56
|
21.75
|
20.66
|
19.36
|
18.27
|
17.18
|
16.10
|
13.70
|
9.14
|
4.57
|
—
|
|||||||||||||||||||
|
|
|
|
|
|
|
|
|
|
|
|
|||||||||||||||||||
|
57
|
23.05
|
21.90
|
20.51
|
19.36
|
18.21
|
17.06
|
14.52
|
9.68
|
4.84
|
—
|
|||||||||||||||||||
|
|
|
|
|
|
|
|
|
|
|
|
|||||||||||||||||||
|
58
|
24.44
|
23.22
|
21.75
|
20.53
|
19.31
|
18.09
|
15.40
|
10.26
|
5.13
|
—
|
|||||||||||||||||||
|
|
|
|
|
|
|
|
|
|
|
|
|||||||||||||||||||
|
59
|
26.21
|
24.90
|
23.33
|
22.02
|
20.71
|
19.40
|
16.51
|
11.01
|
5.50
|
—
|
|||||||||||||||||||
|
|
|
|
|
|
|
|
|
|
|
|
|||||||||||||||||||
|
60
|
27.40
|
26.03
|
24.39
|
23.02
|
21.65
|
20.28
|
17.26
|
11.51
|
5.75
|
—
|
|||||||||||||||||||
|
|
|
|
|
|
|
|
|
|
|
|
|||||||||||||||||||
|
61
|
28.90
|
27.46
|
25.72
|
24.28
|
22.83
|
21.39
|
18.21
|
12.14
|
6.07
|
—
|
|||||||||||||||||||
|
|
|
|
|
|
|
|
|
|
|
|
|||||||||||||||||||
|
62
|
30.40
|
28.88
|
27.06
|
25.54
|
24.02
|
22.50
|
19.15
|
12.77
|
6.38
|
—
|
|||||||||||||||||||
|
|
|
|
|
|
|
|
|
|
|
|
|||||||||||||||||||
|
63
|
31.90
|
30.31
|
28.39
|
26.80
|
25.20
|
23.61
|
20.10
|
13.40
|
6.70
|
—
|
|||||||||||||||||||
|
|
|
|
|
|
|
|
|
|
|
|
|||||||||||||||||||
|
64
|
33.40
|
31.73
|
29.73
|
28.06
|
26.39
|
24.72
|
21.04
|
14.03
|
7.01
|
—
|
|||||||||||||||||||
|
|
|
|
|
|
|
|
|
|
|
|
|||||||||||||||||||
|
65
|
34.90
|
33.16
|
31.06
|
29.32
|
27.57
|
25.83
|
21.99
|
14.66
|
7.33
|
—
|
|||||||||||||||||||
|
|
|
|
|
|
|
|
|
|
|
|
|||||||||||||||||||
|
66
|
36.40
|
34.58
|
32.40
|
30.58
|
28.76
|
26.94
|
22.93
|
15.29
|
7.64
|
—
|
|||||||||||||||||||
|
|
|
|
|
|
|
|
|
|
|
|
|||||||||||||||||||
|
67
|
37.90
|
36.01
|
33.73
|
31.84
|
29.94
|
28.05
|
23.88
|
15.92
|
7.96
|
—
|
|||||||||||||||||||
|
|
|
|
|
|
|
|
|
|
|
|
|||||||||||||||||||
|
68
|
39.40
|
37.43
|
35.07
|
33.10
|
31.13
|
29.16
|
24.82
|
16.55
|
8.27
|
—
|
|||||||||||||||||||
|
|
|
|
|
|
|
|
|
|
|
|
|||||||||||||||||||
|
69
|
40.90
|
38.86
|
36.40
|
34.36
|
32.31
|
30.27
|
25.77
|
17.18
|
8.59
|
—
|
|||||||||||||||||||
|
|
|
|
|
|
|
|
|
|
|
|
|||||||||||||||||||
|
70
|
42.40
|
40.28
|
37.74
|
35.62
|
33.50
|
31.38
|
26.71
|
17.81
|
8.90
|
—
|
|||||||||||||||||||
|
|
|
|
|
|
|
|
|
|
|
|
|||||||||||||||||||
|
71
|
43.90
|
41.71
|
39.07
|
36.88
|
34.68
|
32.49
|
27.66
|
18.44
|
9.22
|
—
|
|||||||||||||||||||
|
|
|
|
|
|
|
|
|
|
|
|
|||||||||||||||||||
|
72
|
43.80
|
41.61
|
38.98
|
36.79
|
34.60
|
32.41
|
27.59
|
18.40
|
9.20
|
—
|
|||||||||||||||||||
|
|
|
|
|
|
|
|
|
|
|
|
|||||||||||||||||||
|
73
|
42.95
|
40.80
|
38.23
|
36.08
|
33.93
|
31.78
|
27.06
|
18.04
|
9.02
|
—
|
|||||||||||||||||||
|
|
|
|
|
|
|
|
|
|
|
|
|||||||||||||||||||
|
74
|
42.15
|
40.04
|
37.51
|
35.41
|
33.30
|
31.19
|
26.55
|
17.70
|
8.85
|
—
|
|||||||||||||||||||
|
|
|
|
|
|
|
|
|
|
|
|
|||||||||||||||||||
|
75
|
41.30
|
39.24
|
36.76
|
34.69
|
32.63
|
30.56
|
26.02
|
17.35
|
8.67
|
—
|
|||||||||||||||||||
|
|
|
|
|
|
|
|
|
|
|
|
|||||||||||||||||||
|
76
|
40.90
|
38.86
|
36.40
|
34.36
|
32.31
|
30.27
|
25.77
|
17.18
|
8.59
|
—
|
|||||||||||||||||||
|
|
|
|
|
|
|
|
|
|
|
|
|||||||||||||||||||
|
77
|
40.45
|
38.43
|
36.00
|
33.98
|
31.96
|
29.93
|
25.48
|
16.99
|
8.49
|
—
|
|||||||||||||||||||
|
|
|
|
|
|
|
|
|
|
|
|
|||||||||||||||||||
|
78
|
39.95
|
37.95
|
35.56
|
33.56
|
31.56
|
29.56
|
25.17
|
16.78
|
8.39
|
—
|
|||||||||||||||||||
|
|
|
|
|
|
|
|
|
|
|
|
|||||||||||||||||||
|
79
|
38.80
|
36.86
|
34.53
|
32.59
|
30.65
|
28.71
|
24.44
|
16.30
|
8.15
|
—
|
|||||||||||||||||||
|
|
|
|
|
|
|
|
|
|
|
|
|||||||||||||||||||
|
80
|
38.80
|
36.86
|
34.53
|
32.59
|
30.65
|
28.71
|
24.44
|
16.30
|
8.15
|
—
|
|||||||||||||||||||
|
TABLE OF SURRENDER CHARGE FACTORS, Female Non-Nicotine
|
||||||||||
|
Per $1,000 of Face Amount
|
||||||||||
|
Number of Full Policy Years Completed Since the Issue Date or Since Increase in Face Amount
|
||||||||||
|
Issue
Age
|
0
|
1
|
2
|
3
|
4
|
5
|
6
|
7
|
8
|
9 or
more
|
|
|
|
|
|
|
|
|
|
|
|
|
|
21
|
4.65
|
4.42
|
4.14
|
3.91
|
3.67
|
3.44
|
2.93
|
1.95
|
0.98
|
—
|
|
|
|
|
|
|
|
|
|
|
|
|
|
22
|
4.75
|
4.51
|
4.23
|
3.99
|
3.75
|
3.52
|
2.99
|
2.00
|
1.00
|
—
|
|
|
|
|
|
|
|
|
|
|
|
|
|
23
|
4.84
|
4.60
|
4.31
|
4.07
|
3.82
|
3.58
|
3.05
|
2.03
|
1.02
|
—
|
|
|
|
|
|
|
|
|
|
|
|
|
|
24
|
4.94
|
4.69
|
4.40
|
4.15
|
3.90
|
3.66
|
3.11
|
2.07
|
1.04
|
—
|
|
|
|
|
|
|
|
|
|
|
|
|
|
25
|
5.03
|
4.78
|
4.48
|
4.23
|
3.97
|
3.72
|
3.17
|
2.11
|
1.06
|
—
|
|
|
|
|
|
|
|
|
|
|
|
|
|
26
|
5.25
|
4.99
|
4.67
|
4.41
|
4.15
|
3.89
|
3.31
|
2.21
|
1.10
|
—
|
|
|
|
|
|
|
|
|
|
|
|
|
|
27
|
5.48
|
5.21
|
4.88
|
4.60
|
4.33
|
4.06
|
3.45
|
2.30
|
1.15
|
—
|
|
|
|
|
|
|
|
|
|
|
|
|
|
28
|
5.72
|
5.43
|
5.09
|
4.80
|
4.52
|
4.23
|
3.60
|
2.40
|
1.20
|
—
|
|
|
|
|
|
|
|
|
|
|
|
|
|
29
|
5.98
|
5.68
|
5.32
|
5.02
|
4.72
|
4.43
|
3.77
|
2.51
|
1.26
|
—
|
|
|
|
|
|
|
|
|
|
|
|
|
|
30
|
6.26
|
5.95
|
5.57
|
5.26
|
4.95
|
4.63
|
3.94
|
2.63
|
1.31
|
—
|
|
|
|
|
|
|
|
|
|
|
|
|
|
31
|
6.59
|
6.26
|
5.87
|
5.54
|
5.21
|
4.88
|
4.15
|
2.77
|
1.38
|
—
|
|
|
|
|
|
|
|
|
|
|
|
|
|
32
|
6.96
|
6.61
|
6.19
|
5.85
|
5.50
|
5.15
|
4.38
|
2.92
|
1.46
|
—
|
|
|
|
|
|
|
|
|
|
|
|
|
|
33
|
7.37
|
7.00
|
6.56
|
6.19
|
5.82
|
5.45
|
4.64
|
3.10
|
1.55
|
—
|
|
TABLE OF SURRENDER CHARGE FACTORS, Female Non-Nicotine
|
||||||||||
|
Per $1,000 of Face Amount
|
||||||||||
|
Number of Full Policy Years Completed Since the Issue Date or Since Increase in Face Amount
|
||||||||||
|
Issue
Age
|
0
|
1
|
2
|
3
|
4
|
5
|
6
|
7
|
8
|
9 or
more
|
|
|
|
|
|
|
|
|
|
|
|
|
|
34
|
7.79
|
7.40
|
6.93
|
6.54
|
6.15
|
5.76
|
4.91
|
3.27
|
1.64
|
—
|
|
|
|
|
|
|
|
|
|
|
|
|
|
35
|
8.20
|
7.79
|
7.30
|
6.89
|
6.48
|
6.07
|
5.17
|
3.44
|
1.72
|
—
|
|
|
|
|
|
|
|
|
|
|
|
|
|
36
|
8.62
|
8.19
|
7.67
|
7.24
|
6.81
|
6.38
|
5.43
|
3.62
|
1.81
|
—
|
|
|
|
|
|
|
|
|
|
|
|
|
|
37
|
9.08
|
8.63
|
8.08
|
7.63
|
7.17
|
6.72
|
5.72
|
3.81
|
1.91
|
—
|
|
|
|
|
|
|
|
|
|
|
|
|
|
38
|
9.63
|
9.15
|
8.57
|
8.09
|
7.61
|
7.13
|
6.07
|
4.04
|
2.02
|
—
|
|
|
|
|
|
|
|
|
|
|
|
|
|
39
|
10.20
|
9.69
|
9.08
|
8.57
|
8.06
|
7.55
|
6.43
|
4.28
|
2.14
|
—
|
|
|
|
|
|
|
|
|
|
|
|
|
|
40
|
10.70
|
10.17
|
9.52
|
8.99
|
8.45
|
7.92
|
6.74
|
4.49
|
2.25
|
—
|
|
|
|
|
|
|
|
|
|
|
|
|
|
41
|
11.11
|
10.55
|
9.89
|
9.33
|
8.78
|
8.22
|
7.00
|
4.67
|
2.33
|
—
|
|
|
|
|
|
|
|
|
|
|
|
|
|
42
|
11.53
|
10.95
|
10.26
|
9.69
|
9.11
|
8.53
|
7.26
|
4.84
|
2.42
|
—
|
|
|
|
|
|
|
|
|
|
|
|
|
|
43
|
11.96
|
11.36
|
10.64
|
10.05
|
9.45
|
8.85
|
7.53
|
5.02
|
2.51
|
—
|
|
|
|
|
|
|
|
|
|
|
|
|
|
44
|
12.35
|
11.73
|
10.99
|
10.37
|
9.76
|
9.14
|
7.78
|
5.19
|
2.59
|
—
|
|
|
|
|
|
|
|
|
|
|
|
|
|
45
|
12.83
|
12.19
|
11.42
|
10.78
|
10.14
|
9.49
|
8.08
|
5.39
|
2.69
|
—
|
|
|
|
|
|
|
|
|
|
|
|
|
|
46
|
13.43
|
12.76
|
11.95
|
11.28
|
10.61
|
9.94
|
8.46
|
5.64
|
2.82
|
—
|
|
|
|
|
|
|
|
|
|
|
|
|
|
47
|
14.08
|
13.38
|
12.53
|
11.83
|
11.12
|
10.42
|
8.87
|
5.91
|
2.96
|
—
|
|
|
|
|
|
|
|
|
|
|
|
|
|
48
|
14.75
|
14.01
|
13.13
|
12.39
|
11.65
|
10.92
|
9.29
|
6.20
|
3.10
|
—
|
|
|
|
|
|
|
|
|
|
|
|
|
|
49
|
15.47
|
14.70
|
13.77
|
12.99
|
12.22
|
11.45
|
9.75
|
6.50
|
3.25
|
—
|
|
|
|
|
|
|
|
|
|
|
|
|
|
50
|
16.23
|
15.42
|
14.44
|
13.63
|
12.82
|
12.01
|
10.22
|
6.82
|
3.41
|
—
|
|
|
|
|
|
|
|
|
|
|
|
|
|
51
|
17.16
|
16.30
|
15.27
|
14.41
|
13.56
|
12.70
|
10.81
|
7.21
|
3.60
|
—
|
|
|
|
|
|
|
|
|
|
|
|
|
|
52
|
17.94
|
17.04
|
15.97
|
15.07
|
14.17
|
13.28
|
11.30
|
7.53
|
3.77
|
—
|
|
|
|
|
|
|
|
|
|
|
|
|
|
53
|
18.72
|
17.78
|
16.66
|
15.72
|
14.79
|
13.85
|
11.79
|
7.86
|
3.93
|
—
|
|
|
|
|
|
|
|
|
|
|
|
|
|
54
|
19.58
|
18.60
|
17.43
|
16.45
|
15.47
|
14.49
|
12.34
|
8.22
|
4.11
|
—
|
|
|
|
|
|
|
|
|
|
|
|
|
|
55
|
20.53
|
19.50
|
18.27
|
17.25
|
16.22
|
15.19
|
12.93
|
8.62
|
4.31
|
—
|
|
|
|
|
|
|
|
|
|
|
|
|
|
56
|
21.75
|
20.66
|
19.36
|
18.27
|
17.18
|
16.10
|
13.70
|
9.14
|
4.57
|
—
|
|
|
|
|
|
|
|
|
|
|
|
|
|
57
|
23.05
|
21.90
|
20.51
|
19.36
|
18.21
|
17.06
|
14.52
|
9.68
|
4.84
|
—
|
|
|
|
|
|
|
|
|
|
|
|
|
|
58
|
24.44
|
23.22
|
21.75
|
20.53
|
19.31
|
18.09
|
15.40
|
10.26
|
5.13
|
—
|
|
|
|
|
|
|
|
|
|
|
|
|
|
59
|
25.92
|
24.62
|
23.07
|
21.77
|
20.48
|
19.18
|
16.33
|
10.89
|
5.44
|
—
|
|
|
|
|
|
|
|
|
|
|
|
|
|
60
|
27.40
|
26.03
|
24.39
|
23.02
|
21.65
|
20.28
|
17.26
|
11.51
|
5.75
|
—
|
|
|
|
|
|
|
|
|
|
|
|
|
|
61
|
28.72
|
27.28
|
25.56
|
24.12
|
22.69
|
21.25
|
18.09
|
12.06
|
6.03
|
—
|
|
|
|
|
|
|
|
|
|
|
|
|
|
62
|
29.83
|
28.34
|
26.55
|
25.06
|
23.57
|
22.07
|
18.79
|
12.53
|
6.26
|
—
|
|
|
|
|
|
|
|
|
|
|
|
|
|
63
|
31.03
|
29.48
|
27.62
|
26.07
|
24.51
|
22.96
|
19.55
|
13.03
|
6.52
|
—
|
|
|
|
|
|
|
|
|
|
|
|
|
|
64
|
32.35
|
30.73
|
28.79
|
27.17
|
25.56
|
23.94
|
20.38
|
13.59
|
6.79
|
—
|
|
|
|
|
|
|
|
|
|
|
|
|
|
65
|
33.80
|
32.11
|
30.08
|
28.39
|
26.70
|
25.01
|
21.29
|
14.20
|
7.10
|
—
|
|
|
|
|
|
|
|
|
|
|
|
|
|
66
|
35.35
|
33.58
|
31.46
|
29.69
|
27.93
|
26.16
|
22.27
|
14.85
|
7.42
|
—
|
|
|
|
|
|
|
|
|
|
|
|
|
|
67
|
37.06
|
35.21
|
32.98
|
31.13
|
29.28
|
27.42
|
23.35
|
15.57
|
7.78
|
—
|
|
|
|
|
|
|
|
|
|
|
|
|
|
68
|
38.95
|
37.00
|
34.67
|
32.72
|
30.77
|
28.82
|
24.54
|
16.36
|
8.18
|
—
|
|
|
|
|
|
|
|
|
|
|
|
|
|
69
|
40.90
|
38.86
|
36.40
|
34.36
|
32.31
|
30.27
|
25.77
|
17.18
|
8.59
|
—
|
|
|
|
|
|
|
|
|
|
|
|
|
|
70
|
42.40
|
40.28
|
37.74
|
35.62
|
33.50
|
31.38
|
26.71
|
17.81
|
8.90
|
—
|
|
|
|
|
|
|
|
|
|
|
|
|
|
71
|
43.90
|
41.71
|
39.07
|
36.88
|
34.68
|
32.49
|
27.66
|
18.44
|
9.22
|
—
|
|
|
|
|
|
|
|
|
|
|
|
|
|
72
|
43.80
|
41.61
|
38.98
|
36.79
|
34.60
|
32.41
|
27.59
|
18.40
|
9.20
|
—
|
|
|
|
|
|
|
|
|
|
|
|
|
|
73
|
43.00
|
40.85
|
38.27
|
36.12
|
33.97
|
31.82
|
27.09
|
18.06
|
9.03
|
—
|
|
|
|
|
|
|
|
|
|
|
|
|
|
74
|
42.15
|
40.04
|
37.51
|
35.41
|
33.30
|
31.19
|
26.55
|
17.70
|
8.85
|
—
|
|
TABLE OF SURRENDER CHARGE FACTORS, Female Non-Nicotine
|
||||||||||
|
Per $1,000 of Face Amount
|
||||||||||
|
Number of Full Policy Years Completed Since the Issue Date or Since Increase in Face Amount
|
||||||||||
|
Issue
Age
|
0
|
1
|
2
|
3
|
4
|
5
|
6
|
7
|
8
|
9 or
more
|
|
|
|
|
|
|
|
|
|
|
|
|
|
75
|
41.30
|
39.24
|
36.76
|
34.69
|
32.63
|
30.56
|
26.02
|
17.35
|
8.67
|
—
|
|
|
|
|
|
|
|
|
|
|
|
|
|
76
|
40.90
|
38.86
|
36.40
|
34.36
|
32.31
|
30.27
|
25.77
|
17.18
|
8.59
|
—
|
|
|
|
|
|
|
|
|
|
|
|
|
|
77
|
40.45
|
38.43
|
36.00
|
33.98
|
31.96
|
29.93
|
25.48
|
16.99
|
8.49
|
—
|
|
|
|
|
|
|
|
|
|
|
|
|
|
78
|
39.95
|
37.95
|
35.56
|
33.56
|
31.56
|
29.56
|
25.17
|
16.78
|
8.39
|
—
|
|
|
|
|
|
|
|
|
|
|
|
|
|
79
|
38.80
|
36.86
|
34.53
|
32.59
|
30.65
|
28.71
|
24.44
|
16.30
|
8.15
|
—
|
|
|
|
|
|
|
|
|
|
|
|
|
|
80
|
38.80
|
36.86
|
34.53
|
32.59
|
30.65
|
28.71
|
24.44
|
16.30
|
8.15
|
—
|
|
Home Office
|
Service Center
|
|
3120 139th Ave SE, Suite 300
|
P. O. Box 724208
|
|
Bellevue, Washington 98005
|
Atlanta, Georgia 31139
|
|
Phone: 1-800-238-9671
|
Phone: 1-877-376-8008 (toll free) 8:00 a.m. to 6:00 p.m. Eastern Time
|
The Statement of Additional Information (“SAI”) dated May 1, 2025 contains additional information about the Policy and the Variable
Account. The Table of Contents for the SAI appears near the end of this prospectus. The SAI has been filed with the SEC and is incorporated by reference into this prospectus.
You can obtain the SAI (at no cost) by visiting our website athttps://vpx.broadridge.com/GetContract1.asp?cid=fnwl&fid=fvl, by
writing to the Service Center at the address shown above, or by calling 1-877-376-8008. You may also obtain reports and other information about the Variable Account on the SEC’s website at www.sec.gov, and copies of this information may
be obtained, upon payment of a duplicating fee, by electronic request at the following email address: publicinfo@sec.gov.
Farmers Financial Solutions, LLC (“FFS”) serves as the principal underwriter and distributor of the Policies. You may obtain more
information about FFS and its registered representatives at http://www.finra.org or by calling 1-800-289-9999. You also can obtain an investor brochure from the Financial Industry Regulatory Authority (“FINRA”), describing its Public Disclosure
Program.
EDGAR Contract Identifier: C000064226
Statement of Additional Information for the Farmers EssentialLife® Variable Universal Life
Individual Flexible Premium Variable Life Insurance Policy
Issued Through
Farmers Variable Life Separate Account A
Offered by
Farmers New World Life Insurance Company
3120 139th Ave SE, Suite 300
Bellevue, Washington 98005
Phone: 1-800-238-9671
Service Center:
P.O. Box 724208
Atlanta, Georgia 31139
Phone: 1-877-376-8008 (toll free)
8:00 a.m. to 6:00 p.m. Eastern Time
This Statement of Additional Information expands upon subjects discussed in the current Prospectus for Farmers EssentialLife® Variable Universal Life, an individual flexible premium variable life insurance policy, offered by Farmers New World Life Insurance Company. You may obtain a copy of the Prospectus for the Policy dated May 1,
2025 by calling 1-877-376-8008 or by writing to our Service Center at P.O. Box 724208, Atlanta, Georgia 31139.
This Statement of Additional Information is not a prospectus and should be read only in conjunction with the Prospectuses for your
Policy and the Portfolios.
The date of this Statement of Additional Information is May 1, 2025.
|
1
|
|
|
1
|
|
|
1
|
|
|
1
|
|
|
1
|
|
|
1
|
|
|
1
|
|
|
2
|
|
|
2
|
|
|
2
|
|
|
3
|
|
|
3
|
|
|
3
|
|
|
4
|
|
|
4
|
|
|
4
|
|
|
5
|
|
|
5
|
|
|
5
|
|
|
6
|
|
|
7
|
|
|
8
|
|
|
8
|
|
|
9
|
General Information and History
Farmers New World Life Insurance Company (“Farmers”) is the stock life insurance company issuing the Policy. Farmers is located at
3120 139th Ave SE, Suite 300, Bellevue, Washington 98005, and was incorporated under Washington law on February 21, 1910. Farmers established the Variable Account to support the investment options under the Policy and under other variable life
insurance policies Farmers issues. Farmers’ General Account supports the Fixed Account under the Policy.
Farmers is a direct wholly-owned subsidiary of Farmers Group, Inc. (“FGI”). FGI is a stock holding and management company. The
ultimate controlling parent of FGI is Zurich Insurance Group LTD (formerly Zurich Financial Services LTD), a publicly traded holding company listed on the Swiss Exchange, but not publicly traded in the U.S.
Farmers markets a broad line of individual life insurance products, including universal life, term life, and whole life insurance
products. Farmers currently is licensed to sell insurance in 49 states and the District of Columbia. Farmers is not licensed in New York.
Farmers established the Variable Account as a separate investment account under Washington law on April 6, 1999. Farmers owns the
assets in the variable account and is obligated to pay all benefits under the Policies. Farmers may use the variable account to support other variable life insurance policies Farmers issues. The variable account is registered with the U.S.
Securities and Exchange Commission (“SEC”) as a unit investment trust under the Investment Company Act of 1940 and qualifies as a “separate account” within the meaning of the Federal securities laws.
We hold the title to the assets of the variable account. The assets are kept physically segregated and held separate and apart from
our General Account assets and from the assets in any other separate account. We and our agent, McCamish, maintain records of all purchases and redemptions of portfolio shares held by each of the subaccounts. Additional protection for the assets
of the variable account is provided by a blanket fidelity bond issued by Federal Insurance Company to Farmers Group, Inc., providing coverage of $20,000,000 in the aggregate and $10,000,000 per occurrence (subject to a $1,000,000 deductible) for
all officers and employees of Farmers Group, Inc.
Resolution Life has entered into an Administration Agreement (the “Agreement”) with Infosys McCamish Systems, L.L.C. (“McCamish”), a
limited liability company organized and existing under the laws of Georgia. McCamish has its principal business address at 3225 Cumberland Blvd SE, Suite 201, Atlanta, Georgia 30339 (the “Service Center”). Under the Agreement, McCamish provides,
at the Service Center and at its Contact Center located at 500 SW 7th Street, Suite 304, Des Moines, IA 50309, significant administrative services for the Contract and the variable account, including the processing of all premium payments,
requests for transfers, partial withdrawals, and surrenders, and the calculation of accumulation unit values for each Contract and the variable account.
We and our agent, McCamish, maintain all records relating to the variable account and the Fixed Account.
All matters of state and federal law pertaining to the Policy have been passed upon by Corporate Counsel.
The financial statements of Farmers New World Life Insurance Company at December 31, 2024 and 2023, and for each of the three years in the period ended December 31, 2024, appearing in this Prospectus and
Registration Statement have been audited by Ernst & Young LLP, independent registered public accounting firm, as set forth in their report thereon appearing elsewhere herein, and are included in reliance upon such report given on the
authority of such firm as experts in accounting and auditing.
The financial statements of the subaccounts of Farmers Variable Life Separate Account A at December 31, 2024, and for each of the two years in the period ended December 31, 2024, appearing in this Prospectus and
Registration Statement have been audited by Ernst & Young LLP, independent auditors, as set forth in their report thereon appearing elsewhere herein, and are included in reliance upon such report given on the authority of such firm as
experts in accounting and auditing.
At least once each year, or more often as required by law, we will mail to Owners at their last known address a report showing at least the following
information as of the end of the report period:
|
• the current Face Amount
|
• any Policy Loan taken since the last report
|
|
|
|
|
• Death Benefit at the end of the report period
|
• premiums paid since the last report
|
|
|
|
|
• the Contract Value
|
• all deductions since the last report
|
|
|
|
|
• the Cash Surrender Value
|
• any outstanding Policy Loan Balance
|
|
|
|
|
• any other information required by the state where the Policy was
issued.
|
|
You may request additional copies of reports for a fee not to exceed $25. We will maintain all records relating to the variable account and the Fixed
Account.
We discontinued offering new Contracts in 2024. We will continue to accept premium and to process transactions for existing Contracts.
Farmers Financial Solutions, LLC (“FFS”) serves as the principal underwriter for the Policies. FFS is a Nevada limited liability
company and its home office is located at 31051 Agoura Road, Westlake Village, California 91361. FFS is registered as a broker- dealer with the Securities and Exchange Commission under the Securities Exchange Act of 1934, as well as with the
securities commissions in the states in which it operates. FFS is a member of the Financial Industry Regulatory Authority (“FINRA”), and of the Securities Investor Protection Corporation. Currently, the Policies are sold through FFS’ sales
representatives who are appointed as our insurance agents.
We pay commissions to FFS for sales of the Policies by its sales representatives. We also pay commissions to FFS for sales of other
variable life insurance policies supported by the variable account. FFS received sales commissions with respect to variable life insurance policies supported by the variable account, including the other policies (even prior to the date that sales
of the Policies began), in the following amounts during the periods indicated:
|
Fiscal year
|
Aggregate Amount of Commissions
Paid to FFS* |
Aggregate Amount of Commissions
Retained by FFS as Principal Underwriter |
|
2022
|
$ 9,723,937
|
0
|
|
2023
|
$ 7,746,303
|
0
|
|
2024
|
$ 5,634,276
|
0
|
| * |
Includes sales commissions paid to FFS for all variable life insurance policies issued by Farmers, including the other policies.
|
FFS passes through commissions it receives as principal underwriter and does not retain any portion of it in return for its services
as principal underwriter for the Policies. As a selling firm for the other variable life insurance policies supported by the variable account, FFS retained approximately $2,641,883.06 in commissions for all variable life insurance policies
supported by the variable account in 2024.
We pay for certain of FFS’ operating and other expenses, including overhead, legal, and accounting fees. We may also pay for certain
sales expenses of FFS: sales representative training materials; marketing materials and advertising expenses; and certain other expenses of distributing the Policies. In addition, we contribute indirectly to the deferred compensation for FFS’
sales representatives and managers.
FFS’ sales representatives and their managers also may be eligible for various cash benefits under certain circumstances. Such cash
benefits may include incentive bonuses for the sale of non-variable insurance products we issue as well as certain insurance benefits and financing arrangements.
Certain non-cash compensation also may be provided jointly with FFS. During 2024, we paid FFS sales representatives and district
managers $0.00 in bonus compensation for their sales of all of our variable life insurance policies supported by the variable account.
We may pay FFS additional cash amounts for: (1) exclusively offering the Policies; (2) costs associated with sales conferences and
educational seminars for FFS’ sales representatives; and (3) other sales expenses incurred by them.
On the Valuation Day that a Subaccount is first available, the Accumulation Unit Value is set at an initial value by us. The Accumulation Unit Value at the
end of any later Valuation Day is equal to A x B where:
“A” is equal to the Subaccount’s Accumulation Unit Value at the end of the immediately preceding Valuation Day.
“B” is equal to the Net Investment Factor at the end of the current Valuation Day. This Net Investment Factor equals (X / Y ) – Z where:
“X” equals:
| 1. |
the net asset value per fund portfolio share held in the Subaccount at the end of the current Valuation Day; plus
|
| 2. |
the per share amount of any dividend or capital gain distribution on the same fund portfolio shares held in the Subaccount during the current Valuation Day; less
|
| 3. |
the per share amount of any capital loss distribution on the same fund portfolio shares held in the Subaccount during the current Valuation Day; less
|
| 4. |
the per share amount of any taxes or any amount set aside during the Valuation Day as a reserve for taxes due to the investment results of the Subaccount;
|
“Y” equals the net asset value per fund portfolio share held in the Subaccount as of the end of the preceding Valuation Day; and “Z” equals the daily
equivalent of the annual Mortality and Expense Risk Charge for the Valuation Day times the number of days since the last Valuation Day.
The Net Investment Factor may be greater than, less than, or equal to one. Therefore, Your Subaccount Policy Value may increase, decrease or remain the
same.
The Policy
The entire contract consists of the Policy, the signed application attached at issue, any attached amendments and supplements to the
application, any attached reinstatement applications, any applications for changes, any revised Policy specifications page issued by us, any document we send you with instructions to attach it to your Policy, and any attached riders and
endorsements. In the absence of fraud, we consider all statements in the application or in any amendments or supplements to application to be representations and not warranties. We will not use any statement to contest a claim unless that
statement is in an attached application or in an amendment or supplement to the application attached to the Policy.
Any change in the Policy or waiver of its provisions must be in writing and signed by one of our officers. Any modification or waiver
must be in writing. No agent may bind us by making any promise not contained in the Policy.
Upon notice to you, we may modify the Policy to:
| • |
conform the Policy, our operations, or the variable account’s operations to the requirements of any law (or regulation issued by a government agency) to which the Policy, our company or the variable account is subject;
|
| • |
assure continued qualification of the Policy as a life insurance contract under the Federal tax laws; or
|
| • |
reflect a change in the variable account’s operations.
|
If we modify the Policy, we will make appropriate endorsements to the Policy. If any provision of the Policy conflicts with the laws of a jurisdiction that
govern the Policy, we will amend the provision to conform with such laws.
In issuing the Policy, we rely on all statements made by or for the insured in the application and in any amendments and supplements
to the application. Therefore, if you make any material misrepresentation of a fact in the application (or in any amendments or supplements to the application), then we may contest the Policy’s validity, any increases in Face Amount, any
reinstatement of the Policy, any attached rider, or we may resist a claim under the Policy.
In the absence of fraud, we cannot bring any legal action to contest the validity of the Policy after the Policy has been in force
during the insured’s lifetime for two years from the issue date, or if reinstated, for two years during the insured’s lifetime from the effective date of reinstatement. In the absence of fraud, we will not contest any increase in Face Amount
after the increase has been in force for two years during the insured’s lifetime. This limitation of our right to contest the validity of the Policy does not apply to any riders.
If, within two years after the Issue Date, the Insured dies by suicide, while sane or insane, we will limit the Death Benefit Amount Payable to:
| 1. |
the Premium Payments made; less
|
| 2. |
any Policy Loan Balance; less
|
| 3. |
any Partial Surrender amounts previously paid by Us.
|
A new two-year suicide period will apply to each Policy Change for which we require Evidence of Insurability starting on the effective
date of each such Policy Change. During this two-year period, if the Insured dies by suicide while sane or insane, the Death Benefit Amount Payable will be limited to the amount that would have been payable if the Policy Change had not been made,
plus any additional Cost of Insurance Charges and Monthly Underwriting and Sales Expense Charges that have been deducted from the Contract Value solely as a result of the Policy Change.
If the Insured’s age or gender has been misstated, we will adjust the death benefit. The adjusted death benefit will be that which
would have been purchased by the most recent Cost of Insurance Charge based on the Insured’s correct age or gender.
Proof of age or gender may be filed with us at any time. Once the insured’s age or gender is established to our satisfaction, we will
use this age or gender in any settlement.
We reserve the right, subject to applicable law, to make additions to, deletions from, or substitutions for the shares of a portfolio
that are held in the variable account. New or substitute portfolios may have different fees and expenses and their availability may be limited to certain classes of purchasers. If the shares of a portfolio are no longer available for investment
or if, in our judgment, further investment in any portfolio should become inappropriate, we may redeem the shares of that portfolio and substitute shares of another portfolio. We will not substitute any shares without notice and prior approval of
the SEC and state insurance authorities, to the extent required by the 1940 Act or other applicable law. We also reserve the right in our sole discretion to establish additional subaccounts, eliminate or combine one or more subaccounts, combine
the variable account with one or more other separate accounts, or operate the variable account as a different kind of investment company. Subject to obtaining any approvals or consents required by law, the assets of one or more subaccounts may
also be transferred to any other subaccount if, in our sole discretion, conditions warrant. In addition, we reserve the right to modify the provisions of the Policy to reflect changes to the subaccounts and the variable account and to comply with
applicable law.
The portfolios currently sell shares to registered separate accounts of insurance companies other than us to support other variable
annuity contracts and variable life insurance contracts. In addition, our other separate accounts and separate accounts of other affiliated life insurance companies may purchase some of the funds to support other variable annuity or variable life
insurance contracts. Moreover, qualified retirement plans may purchase shares of some of the funds. As a result, there is a possibility that an irreconcilable material conflict may arise between your interests as an Owner and the interests of
persons owning other contracts investing in the same funds. There is also the possibility that a material conflict may arise between the interests of Owners generally, or certain classes of Owners, and participating qualified retirement plans or
participants in such retirement plans.
We currently do not foresee any disadvantages to you that would arise from the sale of portfolio shares to support variable life
insurance contracts or variable annuity contracts of other companies or to qualified retirement plans. However, the management of each fund will monitor events related to its fund in order to identify any material irreconcilable conflicts that
might possibly arise as a result of such fund offering its shares to support both variable life insurance contracts and variable annuity contracts, or support the variable life insurance contracts and/or variable annuity contracts issued by
various affiliated and unaffiliated insurance companies. In addition, the management of the portfolios will monitor the portfolios in order to identify any material irreconcilable conflicts that might possibly arise as a result of the sale of its
shares to qualified retirement plans, if applicable.
In the event of such a conflict, the management of the appropriate fund would determine what action, if any, should be taken in
response to the conflict. In addition, if we believe that the response of the portfolios to any such conflict does not sufficiently protect you, then we will take our own appropriate action, including withdrawing the variable account’s investment
in such portfolios, as appropriate.
Changing Death Benefit Options
| • |
After the first Policy year, you may change death benefit options or change the Face Amount (but not both, unless done simultaneously) once each Policy year.
|
| • |
You must make your request in writing and sign the request.
|
| • |
We may require evidence of insurability. We can deny your request for reasons including but not limited to the following:
|
| • |
We do not wish to increase the death benefits due to the insured’s health, occupation, avocations, or any factor that we believe has a bearing on the insured’s risk of death.
|
| • |
We conclude the insured has an excessive amount of insurance coverage.
|
| • |
We conclude the Owner no longer has an insurable interest in the insured.
|
| • |
The effective date of the change will be the monthly due date following the date when we approve your request for a change.
|
| • |
The minimum premium will be recalculated.
|
| • |
We will send you a Policy endorsement with the change to attach to your Policy.
|
| • |
Changing the death benefit option may have tax consequences. You should consult a tax adviser before changing the death benefit option.
|
From Option A (variable death benefit) to Option B (level death benefit)
| • |
We do not require evidence of insurability.
|
| • |
The Face Amount will change. The new Option B Face Amount will equal the Option A Face Amount prior to the change plus the Contract Value on the effective date of the change.
|
| • |
We will not impose an additional underwriting and sales expense charge on the portions of any increase in Face Amount due to a change in death benefit option.
|
| • |
The minimum premium will increase.
|
| • |
The change in option affects the determination of the death benefit since Contract Value is no longer added to the Face Amount. The death benefit will equal the new Face Amount (or, if higher, the Contract Value times the applicable
death benefit percentage).
|
From Option B (level death benefit) to Option A (variable death benefit)
| • |
You must provide satisfactory evidence of insurability.
|
| • |
The Face Amount will change. The new Option A Face Amount will equal the Option B Face Amount prior to the change less the Contract Value on the effective date of the change, but the new Face Amount will not be less than the minimum
Face Amount shown on your Policy specifications page.
|
| • |
We will not impose any partial surrender charge solely as a result of this change in Face Amount.
|
| • |
The minimum premium will decrease.
|
| • |
The change in death benefit option affects the determination of the death benefit since Contract Value will be added to the new Face Amount, and the death benefit will then vary with the Contract Value.
|
| • |
Any underwriting and sales expense charge on the Policy will not be reduced as a result of any decrease in the Face Amount.
|
There are several ways of receiving proceeds under the death benefit and surrender provisions of the Policy, other than in a lump
sum. Below is information concerning settlement options described in your Policy. None of these options vary with the investment performance of the variable account.
Settlement Options. If you surrender the Policy, or if the Policy
matures, you may elect to receive the Cash Surrender Value in either a lump sum or as a series of regular income payments under one of five fixed settlement options described below. In either event, life insurance coverage ends. Also, when the
insured dies, the beneficiary may apply the lump sum Death Benefit Amount Payable proceeds to one of the same settlement options. The proceeds under any settlement option must be at least $2,500, and each payment must be at least $25, or we will
instead pay the proceeds in one lump sum. We may make other settlement options available in the future.
Once we begin making payments under a settlement option, you or the beneficiary will no longer have any value in the subaccounts or
the Fixed Account. Instead, the only entitlement will be the amount of the regular payment for the period selected under the terms of the settlement option chosen. Depending upon the circumstances, the effective date of a settlement option is the
surrender date, the maturity date or the insured’s date of death.
Under any settlement option, the dollar amount of each payment will depend on three things:
| • |
the amount of the surrender or Death Benefit Amount Payable proceeds on the surrender date, maturity date or insured’s date of death;
|
| • |
the interest rate we credit on those amounts (we guarantee a minimum interest rate); and
|
| • |
the specific option(s) you choose. The amount you would receive may depend on your adjusted age and gender.
|
If you select Option 1, 2, 3, or 4, as described below, and the payee dies before we have paid all amounts available under the selected option, we will pay
any remaining amount to the contingent payee, and if none, then to the estate of the payee.
Option 1 – Interest Accumulation:
| • |
Your proceeds will earn interest at a rate of not less than 2.5% per year compounded annually.
|
| • |
We may not keep the funds under this option for longer than five years, unless the Payee is a minor, in which case we may hold the funds until the Payee attains the age of majority.
|
Option 2 – Interest Income:
| • |
Each $1,000 of proceeds will yield an income of not less than $25 annually, $12.42 semi-annually, $6.19 quarterly, or $2.05 monthly for each $1,000 of proceeds.
|
| • |
Unless you direct otherwise, or the Payee is a minor, the Payee may withdraw the proceeds at any time.
|
| • |
After the first year, we may defer such withdrawal for up to six months.
|
Option 3 – Income—Period Certain:
| • |
We will pay installments for a specified period.
|
| • |
The amount of each installment per $1,000 of proceeds will not be less than the amounts shown in the table in your Policy.
|
Option 4 – Income—Amount Certain:
| • |
We will pay installments of a specified amount until the proceeds together with interest are paid in full.
|
| • |
We will credit interest at a rate of not less than 2.5% compounded annually.
|
Option 5 – Income—Life:
| • |
We will pay installments for the payee’s lifetime.
|
| • |
We will make payments for at least a specified guaranteed number of installments.
|
| • |
The amount of each installment will depend on the adjusted age and gender of the payee at the time the first payment is due.
|
| • |
We determine the adjusted age by calculating the age at the payee’s nearest birthday on the date of the first payment and subtracting a number that depends on the year in which the first payment begins:
|
|
First Payment Date
|
Adjusted Age is Age Minus
|
|
Prior to 2011
|
1 Year
|
|
2011 to 2020
|
2 Years
|
|
2021 to 2030
|
3 Years
|
|
2031 to 2040
|
4 Years
|
|
After 2040
|
5 Years
|
Tax Consequences. Even if the Death Benefit Amount Payable under the
Policy is excludible from income, payments under settlement options may not be excludible in full. This is because earnings on the Death Benefit Amount Payable after the insured’s death are taxable and payments under the settlement options
generally include such earnings. You should consult a tax adviser as to the tax treatment of payments under settlement options.
Under the Dollar Cost Averaging program, you may authorize us to transfer a fixed dollar amount at monthly intervals from the Fixed
Account to one or more subaccounts. You may designate up to eight subaccounts to receive the transfers. The fixed dollar amount will purchase more Accumulation Units of a subaccount when their value is lower and fewer units when their value is
higher. Over time, the cost per unit averages out to be less than if all purchases of units had been made at the highest value and greater than if all purchases had been made at the lowest value. The dollar cost averaging method of investment
reduces the risk of making purchases only when the price of Accumulation Units is high. It does not assure a profit or protect against a loss in declining markets.
You may cancel your participation in the program at any time.
You may enroll in the Dollar Cost Averaging program at any time by submitting a request to the Service Center. We make transfers on
the same day of every month as your issue date. Transfers under the Dollar Cost Averaging program are not included when we determine the number of free transfers permitted each year. We must receive the form at least 5 Business Days before the
transfer date, for your transfers to begin on that date. When you enroll in the Dollar Cost Averaging program, your total Contract Value in the Fixed Account must be at least equal to the amount you designate to be transferred on each transfer
date. Transfers from the Fixed Account must be at least $100. If on any transfer date the amount remaining in the Fixed Account is less than the amount designated to be transferred, the entire balance will be transferred out of the Fixed Account
and applied pro-rata to the selected subaccounts, and the dollar cost averaging request will expire.
We may modify or revoke the Dollar Cost Averaging program at any time. There is no charge for participating in the Dollar Cost
Averaging program. We do not assess transfer fees on dollar cost averaging transfers. The Dollar Cost Averaging program is not available if you elect to enroll in the Automatic Asset Rebalancing program discussed below.
If you select the Automatic Asset Rebalancing program (“AAR”), you can instruct us to automatically rebalance your money in the
subaccounts each quarter to reflect your most recent instructions for allocating premiums. (The AAR may not be used to transfer amounts into and out of the Fixed Account.) Investment performance will likely cause any allocation percentages you
selected to shift. With AAR, we will automatically make transfers among the subaccounts on the first day of each calendar quarter to bring your Policy back in line with the percentages you most recently provided to us.
For instance, assume you instructed us to put your Initial Premium into 5 subaccounts in equal proportions (20% in each) and you
selected AAR on your application. Over the next few months, investment performance caused the percentage of your Contract Value in the 5 subaccounts to change so that the 5 subaccounts were 10%, 30%, 10%, 30% and 20% of your Contract Value. On
the first day of the calendar quarter, we will transfer your money among the subaccounts so that 20% of your Contract Value is again in each of the 5 subaccounts.
If you select an asset allocation model on your application and you select AAR, then on the first day of each calendar quarter, we
will automatically transfer money among the subaccounts to match the percentages in the original asset allocation model you select. Unless you instruct us to update the asset allocation model, AAR will rebalance your money in the subaccounts to
the original model that was in place on the issue date (or to the model in place on the date you most recently told us to update the model).
Transfers under this program are not subject to the $100 minimum transfer limitation. There is no charge for using AAR and we do not
charge a transfer fee for asset rebalancing. We do not include any money allocated to the Fixed Account in the rebalancing.
You can start and stop AAR at any time, and you can change your instructions at any time by submitting a request to the Service
Center. Your AAR instructions are effective on the Business Day we receive them at the Service Center. We do not assess transfer fees on AAR transfers, nor do we count them toward the twelve free transfers permitted each Policy year.
We may suspend or modify AAR at any time. The AAR program is not available if you elect to enroll in the Dollar Cost Averaging Program discussed above.
We have filed a registration statement with the SEC under the Securities Act of 1933, as amended, with respect to the Policies
discussed in this Statement of Additional Information. The Statement of Additional Information does not include all of the information set forth in the registration statement, amendments and exhibits. Statements contained in this Statement of
Additional Information concerning the content of the Policies and other legal instruments are intended to be summaries. For a complete statement of the terms of these documents, you should refer to the instruments filed with the SEC.
The audited statutory financial statements of Farmers New World Life Insurance Company as of December 31, 2024 and 2023, and the
related statutory statements of operations and changes in capital and surplus, and of cash flows for the years ending December 31, 2024, 2023, and 2022, prepared in accordance with accounting practices prescribed or permitted by the Office of the
Insurance Commissioner of the State of Washington, which include the Independent Auditor’s Report, are set forth below. You should consider the financial statements of Farmers New World Life Insurance Company as bearing only upon our ability to
meet our obligations under the Policies.
The audited financial statements of Farmers Variable Life Separate Account A as of December 31, 2024 and for the period ending
December 31, 2024, as well as the Report of the Independent Registered Public Accounting Firm, are set forth below.
Reinsurance
Strategic partnership for Reinsurance and Administration. We have entered into a strategic partnership with Resolution Life US for the
reinsurance and administrative oversight of certain in-force FNWL variable universal life insurance policies and variable annuity contracts effective August 1, 2023. Security Life of Denver Insurance Company (“SLD”), a wholly owned subsidiary of
Resolution Life US, will provide servicing and administrative oversight in concert with third party administrator, Infosys McCamish, of certain in-force FNWL variable universal life insurance policies and variable annuities. There are no changes
to the provisions of your in-force variable universal life insurance policy.
Other Information
Exhibits
|
|
|
|||||
|
|
|
|||||
|
a.
|
Board of Directors Resolutions.
|
|||||
|
|
|
|
||||
|
|
1.
|
|||||
|
|
|
|||||
|
b.
|
Custodian Agreements.
|
|||||
|
|
|
|||||
|
|
Not applicable.
|
|||||
|
|
|
|||||
|
c.
|
Underwriting Contracts.
|
|||||
|
|
1.
|
|||||
|
|
2.
|
|||||
|
|
3.
|
|||||
|
|
4.
|
|||||
|
|
5.
|
|||||
|
|
|
|||||
|
d.
|
Contracts.
|
|||||
|
|
|
|
||||
|
|
1.
|
|||||
|
|
2.
|
|||||
|
|
3.
|
|||||
|
|
4.
|
|||||
|
|
5.
|
|||||
|
|
6.
|
|||||
|
|
7.
|
|||||
|
|
||||||
|
e.
|
Applications.
|
|||||
|
|
|
|
||||
|
|
1.
|
|||||
|
2.
|
||||||
|
|
3.
|
|||||
|
|
4.
|
|||||
|
|
5.
|
|||||
|
|
6.
|
|||||
|
|
7.
|
|||||
|
|
8.
|
|||||
|
|
9.
|
|||||
|
|
10.
|
|||||
|
|
11.
|
|||||
|
|
12.
|
|||||
|
|
13.
|
|||||
|
|
14.
|
|||||
|
|
15.
|
|||||
|
|
|
|||||
|
f.
|
Depositor’s Certificate of Incorporation and By-Laws.
|
|||||
|
|
|
|
||||
|
|
1.
|
|||||
|
|
2.
|
|||||
|
|
3.
|
|||||
|
|
4.
|
|||||
|
|
5.
|
|||||
|
|
6.
|
|||||
|
|
7.
|
|||||
|
|
8.
|
|||||
|
|
|
|||||
|
g.
|
Reinsurance Contracts.
|
|
|
|
|
|
|
|
1.
|
|
|
|
2.
|
|
|
|
3.
|
|
|
|
4.
|
|
|
|
5.
|
|
|
|
6.
|
|
|
|
7.
|
|
|
|
8.
|
|
|
|
9.
|
|
|
|
10.
|
|
|
|
11.
|
Commutation and Release Agreement between Farmers New World Life Insurance Company and Zurich Insurance Company, Ltd. dated as of August 1, 2023, redacted for confidentiality filed herewith.
|
|
|
12.
|
Coinsurance and Modified Coinsurance Agreement between Farmers New World Life Insurance Company and Security Life of Denver Insurance Company effective August 1, 2023.
|
|
|
|
|
|
h.
|
Agreements.
|
|||||
|
|
|
|
||||
|
|
1.
|
|||||
|
|
|
|
||||
|
|
2.
|
|||||
|
|
|
|
||||
|
|
3.
|
|||||
|
|
|
|
||||
|
|
4.
|
|||||
|
|
|
|
||||
|
|
5.
|
|||||
|
|
|
|
||||
|
|
6.
|
|||||
|
|
|
|
||||
|
|
7.
|
|||||
|
|
|
|
||||
|
|
8.
|
|||||
|
|
|
|
||||
|
|
9.
|
|||||
|
|
|
|
||||
|
|
10.
|
|||||
|
|
|
|
||||
|
|
11.
|
|||||
|
|
|
|
||||
|
|
12.
|
|||||
|
|
|
|
||||
|
|
13.
|
|||||
|
|
|
|
||||
|
|
14.
|
|||||
|
|
|
|
||||
|
|
15.
|
|||||
|
|
|
|
||||
|
|
16.
|
|||||
|
|
|
|
||||
|
|
17.
|
|||||
|
|
|
|
||||
|
|
18.
|
|||||
|
|
|
|
||||
|
|
19.
|
|||||
|
|
|
|
||||
|
|
20.
|
|||||
|
|
|
|
||||
|
|
21.
|
|||||
|
|
|
|
||||
|
|
22.
|
Amendment No. 3 to the Participation Agreement among Franklin Templeton Variable Insurance Products Trust, Franklin Templeton Distributors, Inc., and Farmers New World Life Insurance Company.
|
||||
|
|
|
|
||||
|
|
23.
|
|||||
|
|
|
|
||||
|
|
24.
|
|||||
|
|
|
|
||||
|
|
25.
|
|||||
|
|
|
|
||||
|
|
26.
|
|||||
|
|
|
|
||||
|
|
27.
|
|||||
|
|
|
|
||||
|
|
28.
|
|||||
|
|
|
|
||||
|
|
29.
|
|||||
|
|
|
|
||||
|
|
30.
|
|||||
|
|
|
|
||||
|
|
31.
|
|||||
|
|
|
|
||||
|
|
32.
|
|||||
|
|
|
|
||||
|
|
33.
|
|||||
|
|
34.
|
|
|
|
|
|
|
|
35.
|
|
|
|
|
|
|
|
36.
|
|
|
|
|
|
|
|
37.
|
|
|
|
|
|
|
|
38.
|
|
|
|
|
|
|
|
39.
|
|
|
|
|
|
|
|
40.
|
|
|
|
|
|
|
|
41.
|
|
|
|
|
|
|
|
42.
|
|
|
|
|
|
|
|
43.
|
|
|
|
|
|
|
|
44.
|
|
|
|
|
|
|
|
45.
|
|
|
|
|
|
|
|
46.
|
|
|
|
|
|
|
|
47.
|
|
|
|
|
|
|
48.
|
|
|
i.
|
Administrative Contracts.
|
|
|
|
1.
|
|
|
|
2.
|
|
|
j.
|
Other Material Contracts.
|
|
|
|
1.
|
Power of Attorney, Filed herewith
|
|
k.
|
Legal Opinion.
|
|
|
|
1.
|
Opinion of Ian Macleod, Attorney-in-Fact, Filed herewith
|
|
l.
|
Actuarial Opinion. Not applicable.
|
|
|
m.
|
Calculations. Not applicable.
|
|
|
n.
|
Other Opinions.
|
|
|
|
1.
|
Consent of Independent Registered Public Accounting Firm Filed herewith.
|
|
o.
|
Omitted Financial Statements.
|
|
|
|
Not applicable.
|
|
|
p.
|
Initial Capital Agreements.
|
|
|
|
Not applicable.
|
|
|
q.
|
Redeemability Exemption.
|
|
|
|
1.
|
|
|
|
2.
|
|
|
|
3.
|
|
|
|
4.
|
|
|
|
5.
|
|
|
|
6.
|
Revised Description of Issuance, Transfer and Redemption Procedures, is incorporated herein by reference to filed in Post Effective Amendment No. 18 to the initial registration statement on Form N-6 Farmers Variable Life Separate
Account A.
|
|
|
|
|
|
r.
|
Form of Initial Summary Prospectuses, Filed herewith.
|
|
Directors and Officers of the Depositor
|
Name and Principal Business Address
|
Positions and Offices with Depositor
|
|
|
|
|
Annette Thompson3
|
Director
|
|
Scott Stoll7
|
Director
|
|
David Travers5
|
Director
|
|
Warren Tucker
John Griek6
|
Director
Director
|
|
Walter Kiceleff2
|
Director, Chairman of the Board and President
|
|
Clay Callahan2
|
Chief Financial Officer
|
|
Michael Rohwetter4
|
Chief Investment Officer
|
|
Paula Gospel2
|
Chief Risk Officer
|
|
Jennie McGinnis2
|
Chief Actuary
|
|
Keith A. Terry2
|
Appointed Actuary and Illustration Actuary
|
|
James Levett2
|
Controller
|
|
Michael Hoetzel2
|
Chief Claims Officer
|
|
Robert Gibson2
|
38a-1 Chief Compliance Officer
|
|
David Swaim2
|
Chief Underwriting Officer
|
|
Tina de Jong2
|
Special Corporate Counsel and Corporate Secretary
|
|
Jim Taylor1
|
Chief Compliance Officer
|
|
Michael Langford1
|
Assistant Treasurer
|
|
Margaret S. Giles1
|
Assistant Secretary
|
|
Nicole J. Pryor1
|
Assistant Secretary
|
|
Matthew Bowman2
|
Assistant Secretary
|
| 1 |
The principal business address is 6301 Owensmouth Ave., Woodland Hills, CA 91367.
|
| 2 |
The principal business address is 3120 139th Ave, Suite 300, Bellevue, WA 98005.
|
| 3 |
The principal business address is 735 Avenida Alcola, Arroyo Grande, CA 93420.
|
| 4 |
The principal business address is 4 World Trade Center, 150 Greenwich St., New York, NY 10007.
|
| 5 |
The principal business address is 15700 Long Vista Dr., Austin, TX 78728.
|
| 6 |
The principal business address is 9618 SW Quartermaster Dr., Vashon, WA 98070.
|
| 7 |
The principal business address is 6900 Chileno Valley Road, Petaluma, CA 94952.
|
Persons Controlled by Under Common Control with the Depositor or Registrant
Organizations Affiliated with Zurich U.S. Insurance Group
|
Company
|
Domicile
|
Ownership
|
%
|
|
DE
|
ZSF/Dallas Tower LLC
|
63.770
|
|
|
Access Franchise Management Limited
|
GBR
|
Zurich Assurance Ltd
|
100.000
|
|
ACN 000 141 051 Ltd.
|
AUS
|
Zurich Financial Services Australia Limited
|
100.000
|
|
Afterland Limited
|
GBR
|
Zurich Assurance Ltd
|
100.000
|
|
AG Haus der Wirtschaft
|
CHE
|
Zurich Versicherungs-Gesellschaft AG
|
8.163
|
|
AIG Travel Asia Pacific Pte. Ltd.
|
SGP
|
Zurich Cover-More Global Travel, Inc.
|
100.000
|
|
AIG Travel Assist Consulting (Shanghai) Co., Ltd.
|
CHN
|
Zurich Cover-More Global Travel, Inc.
|
100.000
|
|
AIG Travel Assist Malaysia Sdn. Bhd.
|
MYS
|
Zurich Cover-More Global Travel, Inc.
|
100.000
|
|
Allied Dunbar Assurance plc
|
GBR
|
Zurich Financial Services (UKISA) Nominees Limited
|
100.000
|
|
Allied Dunbar Financial Services Limited
|
GBR
|
Allied Dunbar Assurance plc
|
100.000
|
|
Allied Dunbar Provident plc
|
GBR
|
Allied Dunbar Assurance plc
|
100.000
|
|
Allied Zurich Holdings Limited
|
JEY
|
Zurich Versicherungs-Gesellschaft AG
|
100.000
|
|
Allied Zurich Limited
|
GBR
|
Zurich Insurance Group Ltd.
|
100.000
|
|
American Guarantee and Liability Insurance Company
|
NY
|
Zurich American Insurance Company
|
100.000
|
|
American Zurich Insurance Company
|
IL
|
Steadfast Insurance Company
|
100.000
|
|
Applyhere Pty Ltd
|
AUS
|
Davidson Trahaire Holding Pty Ltd
|
100.000
|
|
Ashdale Land and Property Company Limited
|
GBR
|
Zurich Insurance plc
|
100.000
|
|
Asistbras S/A Assistência ao Viajante
|
BRA
|
Travel Ace Internacional de Servicios S.A.
|
65.000
|
|
Assistancee Online HK Ltd
|
HKG
|
Assistancee Online HK Ltd
|
|
|
Assistancee Online HK Ltd
|
HKG
|
Assistancee Online Pte. Ltd
|
100.000
|
|
Assistancee Online Pte. Ltd
|
SGP
|
Customer Care Assistance Pty Ltd
|
100.000
|
|
ASTIS Holdings Limited
|
AUS
|
Cover-More Finance Pty Limited
|
100.000
|
|
Aust Office 1, LLC
|
DE
|
Zurich American Insurance Company
|
100.000
|
|
autoSense AG
|
CHE
|
Zürich Versicherungs-Gesellschaft AG
|
33.330
|
|
Ballykilliane Holdings Limited
|
IRL
|
Zurich Insurance plc
|
100.000
|
|
Bansabadell Pensiones, E.G.F.P, S.A.
|
ESP
|
Zurich Vida, Companía de Seguros y Reaseguros, S.A. - Socied
|
50.000
|
|
Bansabadell Seguros Generales, S.A. de Seguros y Reaseguros
|
ESP
|
Zurich Versicherungs-Gesellschaft AG
|
50.000
|
|
Bansabadell Servicios Auxiliares De Seguros, S.L.
|
ESP
|
Bansabadell Seguros Generales, S.A. de Seguros y Reaseguros
|
100.000
|
|
Bansabadell Vida S.A. de Seguros y Reaseguros
|
ESP
|
Zurich Vida, Companía de Seguros y Reaseguros, S.A. - Socied
|
50.000
|
|
Benefit Finance Partners, L.L.C.
|
DE
|
Zurich Benefit Finance LLC
|
50.000
|
|
BFP Securities LLC
|
DE
|
Benefit Finance Partners, L.L.C.
|
100.000
|
|
Bloomington Office LP
|
DE
|
Zurich Structured Finance, Inc.
|
99.000
|
|
Bloomington Office MGP Manager, Inc
|
DE
|
Zurich Structured Finance, Inc.
|
100.000
|
|
Bloomington Office MGP, LLC
|
DE
|
Bloomington Office MGP Manager, Inc
|
1.000
|
|
Bloomington Office MGP, LLC
|
DE
|
Zurich Structured Finance, Inc.
|
99.000
|
|
Blue Insurance Australia Pty Ltd
|
AUS
|
Blue Insurance Limited
|
100.000
|
|
Blue Insurance Limited
|
IRL
|
Cover-More Australia Pty Ltd
|
97.610
|
|
Blue Marble Micro Limited
|
GBR
|
Zürich Versicherungs-Gesellschaft AG
|
100.000
|
|
Blue Marble Microinsurance, Inc.
|
DE
|
Blue Marble Micro Limited
|
100.000
|
|
Bonus Pensionskassen Aktiengesellschaft
|
AUT
|
Zurich Versicherungs-Aktiengesellschaft
|
87.500
|
|
BONUS Vorsorgekasse AG
|
AUT
|
Zurich Versicherungs-Aktiengesellschaft
|
50.000
|
|
BOS Apt 1, LLC
|
DE
|
Zurich American Insurance Company
|
100.000
|
|
BOS Apt 2, LLC
|
DE
|
Zurich American Insurance Company
|
100.000
|
|
BOS Office 3, LLC
|
DE
|
Farmers New World Life Insurance Company
|
100.000
|
|
BOS Office 4, LLC
|
DE
|
Zurich American Insurance Company
|
100.000
|
|
BOS Retail 1, LLC
|
DE
|
Zurich American Insurance Company
|
100.000
|
|
Boxx Cyber Services Middle East Ltd
|
ARE
|
Boxx Insurance Inc.
|
100.000
|
|
Boxx Insurance Inc.
|
CAN
|
Zürich Versicherungs-Gesellschaft AG
|
33.333
|
|
Boxx Insurance LLC
|
FL
|
Boxx Insurance Inc.
|
100.000
|
|
Boxx Services PTE Limited
|
SGP
|
Boxx Insurance Inc.
|
100.000
|
|
Boxx Solutions LLC
|
FL
|
Boxx Insurance LLC
|
100.000
|
|
Bristlecourt Limited
|
GBR
|
Zurich Assurance Ltd
|
100.000
|
|
brokerbusiness.ch AG
|
CHE
|
Zürich Versicherungs-Gesellschaft AG
|
25.000
|
|
Cayley Aviation Ltd.
|
BMU
|
Zurich Insurance Company Ltd, Bermuda Branch
|
100.000
|
|
Celta Assistance SL
|
ESP
|
Universal Assistance S.A.
|
100.000
|
|
Centre Group Holdings (U.S.) Limited
|
DE
|
Zurich Structured Finance, Inc.
|
100.000
|
|
Centre Insurance Company
|
DE
|
Centre Solutions (U.S.) Limited
|
100.000
|
|
Centre Life Insurance Company
|
MA
|
Centre Solutions (U.S.) Limited
|
100.000
|
|
Centre Reinsurance (U.S.) Limited
|
BMU
|
Centre Group Holdings (U.S.) Limited
|
100.000
|
|
Centre Solutions (Bermuda) Limited
|
BMU
|
Zurich Finance Company Ltd
|
100.000
|
|
Centre Solutions (U.S.) Limited
|
BMU
|
Centre Group Holdings (U.S.) Limited
|
100.000
|
|
Charlotte Industrial 3, LLC
|
DE
|
Farmers New World Life Insurance Company
|
100.000
|
|
Charlotte Office 1, LLC
|
DE
|
Zurich American Insurance Company
|
100.000
|
|
CHI APT 1, LLC
|
DE
|
Zurich American Insurance Company
|
100.000
|
|
CHI IND 1, LLC
|
DE
|
Farmers New World Life Insurance Company
|
100.000
|
|
CHI IND 6, LLC
|
DE
|
Farmers New World Life Insurance Company
|
100.000
|
|
Chilena Consolidada Seguros de Vida S.A.
|
CHL
|
Inversiones Suizo Chilena S.A.
|
98.977
|
|
Chilena Consolidada Seguros Generales S.A.
|
CHL
|
Chilena Consolidada Seguros de Vida S.A.
|
7.405
|
|
Chilena Consolidada Seguros Generales S.A.
|
CHL
|
Inversiones Suizo Chilena S.A.
|
82.732
|
|
COFITEM-COFIMUR
|
FRA
|
Zurich Versicherungs-Gesellschaft AG
|
12.405
|
|
Collective Benefits Ltd
|
GBR
|
Travel Guard Assist, Inc.
|
100.000
|
|
Collective Denmark ApS
|
DNK
|
AIG Travel Asia Pacific Pte. Ltd.
|
100.000
|
|
Collective Europe Holdings B.V.
|
NLD
|
Travel Guard Assist, Inc.
|
100.000
|
|
Collective Netherlands B.V.
|
NLD
|
AIG Travel Asia Pacific Pte. Ltd.
|
100.000
|
|
Collective Society Ltd
|
GBR
|
Travel Guard Assist, Inc.
|
100.000
|
|
Colonial American Casualty and Surety Company
|
IL
|
Fidelity and Deposit Company of Maryland
|
100.000
|
|
Concisa Vorsorgeberatung und Management AG
|
AUT
|
Bonus Pensionskassen Aktiengesellschaft
|
100.000
|
|
Cover-More (NZ) Limited
|
NZL
|
Cover-More Australia Pty Ltd
|
100.000
|
|
Cover-More Asia Pte. Ltd
|
SGP
|
Travel Assist Pty Limited
|
100.000
|
|
Cover-More Australia Pty Ltd
|
AUS
|
Cover-More Holdings Pty Ltd
|
100.000
|
|
Cover-More Finance Pty Limited
|
AUS
|
Cover-More Group Limited
|
100.000
|
|
Cover-More Group Limited
|
AUS
|
Zurich Travel Solutions Pty Limited
|
100.000
|
|
Cover-More Holdings Pty Ltd
|
AUS
|
Travel Assist Pty Limited
|
100.000
|
|
Cover-More Holdings USA Inc.
|
DE
|
Travel Assist Pty Limited
|
100.000
|
|
Cover-More Inc.
|
DE
|
Cover-More Holdings USA Inc.
|
100.000
|
|
Cover-More Insurance Services Limited
|
GBR
|
Cover-More Australia Pty Ltd
|
100.000
|
|
Cover-More Insurance Services Pty Ltd
|
AUS
|
Travel Assist Pty Limited
|
100.000
|
|
Cowbell Cyber India Private Limited
|
IND
|
Cowbell Cyber, Inc.
|
100.000
|
|
Cowbell Cyber Limited
|
GBR
|
Cowbell Cyber, Inc.
|
100.000
|
|
Cowbell Cyber Technologies ULC
|
CAN
|
Cowbell Cyber, Inc.
|
100.000
|
|
Cowbell Insurance Agency Inc.
|
CAN
|
Cowbell Cyber, Inc.
|
100.000
|
|
Cowbell Insurance Agency, LLC
|
CA
|
Cowbell Cyber, Inc.
|
100.000
|
|
Cowbell Managing General Agency Limited
|
GBR
|
Cowbell Cyber, Inc.
|
100.000
|
|
Cowbell Reinsurance Company
|
VT
|
Cowbell Cyber, Inc.
|
100.000
|
|
Cowbell Specialty Insurance Company
|
NE
|
Cowbell Cyber, Inc.
|
100.000
|
|
Cowbell, Inc.
|
DE
|
Cowbell Cyber, Inc.
|
100.000
|
|
CREC (Bloomington) Lender, LLC
|
DE
|
Zurich Structured Finance, Inc.
|
|
|
CREC (Dallas) Lender, LLC
|
DE
|
Zurich Structured Finance, Inc.
|
100.000
|
|
CREC (Florence), LLC
|
DE
|
ZSF/KY Annex LLC
|
50.000
|
|
CREC (Florence), LLC
|
DE
|
ZSF/Office KY, LLC
|
50.000
|
|
CREC (Las Vegas), LLC
|
DE
|
Zurich Structured Finance, Inc.
|
100.000
|
|
CREC (Sioux Falls) Lender, LLC
|
DE
|
Zurich Structured Finance, Inc.
|
100.000
|
|
CREC (Sioux Falls) Owner, LLC
|
DE
|
Zurich Structured Finance, Inc.
|
100.000
|
|
CREC (Sioux Falls), LLC
|
DE
|
Zurich Structured Finance, Inc.
|
100.000
|
|
Customer Care Assistance Pty Ltd
|
AUS
|
Customer Care Holdings Pty Ltd
|
100.000
|
|
Customer Care Holdings Pty Ltd
|
AUS
|
Travel Assist Pty Limited
|
100.000
|
|
Customer Care Pty Ltd
|
AUS
|
Customer Care Holdings Pty Ltd
|
100.000
|
|
DA Deutsche Allgemeine Versicherung Aktiengesellschaft
|
DEU
|
Zürich Beteiligungs-Aktiengesellschaft (Deutschland)
|
100.000
|
|
Dallas Office MGP Manager, Inc.
|
DE
|
Zurich Structured Finance, Inc.
|
100.000
|
|
Dallas Office MGP, LLC
|
DE
|
Dallas Office MGP Manager, Inc.
|
1.000
|
|
Dallas Office MGP, LLC
|
DE
|
Zurich Structured Finance, Inc.
|
99.000
|
|
Dallas Tower LP
|
DE
|
Zurich Structured Finance, Inc.
|
99.000
|
|
Davidson Trahaire Corpsych (Singapore) Pte. Limited
|
SGP
|
DTC Bidco Pty Ltd
|
100.000
|
|
Davidson Trahaire Corpsych Pty Ltd
|
AUS
|
Applyhere Pty Ltd
|
35.000
|
|
Davidson Trahaire Corpsych Pty Ltd
|
AUS
|
Davidson Trahaire Holding Pty Ltd
|
65.000
|
|
Davidson Trahaire Holding Pty Ltd
|
AUS
|
DTC Australia Pty Ltd
|
100.000
|
|
DB Vita S.A.
|
LUX
|
Deutscher Herold Aktiengesellschaft
|
25.000
|
|
DEN Industrial 2, LLC
|
DE
|
Zurich American Insurance Company
|
100.000
|
|
Dentolo Deutschland GmbH
|
DEU
|
Zürich Beteiligungs-Aktiengesellschaft (Deutschland)
|
100.000
|
|
Deutsche Zurich Pensiones, Entidad Gestora de Fondos de Pens
|
ESP
|
Zurich Vida, Companía de Seguros y Reaseguros, S.A. - Socied
|
50.000
|
|
Deutscher Herold Aktiengesellschaft
|
DEU
|
Zurich Beteiligungs-Aktiengesellschaft (Deutschland)
|
79.826
|
|
Deutscher Pensionsfonds Aktiengesellschaft
|
DEU
|
Deutscher Herold Aktiengesellschaft
|
74.900
|
|
Deutsches Institut fur Altersvorsorge GmbH
|
DEU
|
Deutscher Herold Aktiengesellschaft
|
22.000
|
|
DIG GmbH
|
DEU
|
Digital Insurance Group B.V.
|
100.000
|
|
DTC Australia Pty Ltd
|
AUS
|
DTC Bidco Pty Ltd
|
100.000
|
|
DTC Bidco Pty Ltd
|
AUS
|
DTC Holdco Pty Ltd
|
100.000
|
|
DTC Holdco Pty Ltd
|
AUS
|
ASTIS Holdings Limited
|
100.000
|
|
DTC NZ Bidco Limited
|
NZL
|
DTC Bidco Pty Ltd
|
100.000
|
|
Dunbar Assets Ireland
|
IRL
|
ZCM Asset Holding Company (Bermuda) Limited
|
|
|
Dunbar Assets Ireland
|
IRL
|
Zurich Finance Company Ltd
|
0.037
|
|
Dusfal S.A.
|
URY
|
Zürich Versicherungs-Gesellschaft AG
|
100.000
|
|
Eagle Star (Leasing) Limited
|
GBR
|
Zurich Assurance Ltd
|
100.000
|
|
Eagle Star European Life Assurance Company Limited
|
IRL
|
Zurich Life Assurance plc
|
100.000
|
|
Eagle Star Group Services Limited
|
GBR
|
Eagle Star Holdings Limited
|
100.000
|
|
Eagle Star Holding Company of Ireland
|
IRL
|
Zurich Assurance Ltd
|
0.001
|
|
Eagle Star Holding Company of Ireland
|
IRL
|
Zurich Assurance Ltd
|
99.999
|
|
Eagle Star Holdings Limited
|
GBR
|
Zurich Financial Services (UKISA) Limited
|
100.000
|
|
EcoHub AG
|
CHE
|
Zürich Versicherungs-Gesellschaft AG
|
6.164
|
|
Edilspettacolo SRL
|
ITA
|
Zurich Insurance Company Ltd - Rappresentanza Generale per l
|
35.712
|
|
Empire Fire and Marine Insurance Company
|
IL
|
Zurich American Insurance Company
|
100.000
|
|
Empire Indemnity Insurance Company
|
OK
|
Zurich American Insurance Company
|
100.000
|
|
Employee Services Limited
|
GBR
|
Allied Dunbar Financial Services Limited
|
100.000
|
|
Endsleigh Financial Services Limited
|
GBR
|
Zurich Holdings (UK) Limited
|
100.000
|
|
Endsleigh Pension Trustee Limited
|
GBR
|
Zurich Holdings (UK) Limited
|
100.000
|
|
ES Plympton Nominee 1 Limited
|
GBR
|
Zurich Assurance Ltd
|
100.000
|
|
ES Plympton Nominee 2 Limited
|
GBR
|
Zurich Assurance Ltd
|
100.000
|
|
Euclid KY Annex, LP
|
DE
|
Zurich Structured Finance, Inc.
|
99.000
|
|
Euclid Office LP
|
DE
|
Zurich Structured Finance, Inc.
|
99.000
|
|
Euclid Warehouses LP
|
DE
|
Zurich Structured Finance, Inc.
|
99.000
|
|
Euroamérica Administradora General de Fondos S.A
|
CHL
|
Chilena Consolidada Seguros de Vida S.A.
|
100.000
|
|
Extremus Versicherung-Aktiengesellschaft
|
DEU
|
Zurich Insurance plc Niederlassung fur Deutschland
|
5.000
|
|
Farmers Family Fund
|
CA
|
Farmers Group, Inc.
|
100.000
|
|
Farmers General Insurance Agency, Inc.
|
RI
|
FIG Leasing Co, Inc.
|
100.000
|
|
Farmers Group, Inc.
|
NV
|
Zurich Insurance Group Ltd.
|
12.100
|
|
Farmers Group, Inc.
|
NV
|
Zurich Versicherungs-Gesellschaft AG
|
87.900
|
|
Farmers Life Insurance Company of New York
|
NY
|
Farmers New World Life Insurance Company
|
100.000
|
|
Farmers New World Life Insurance Company
|
WA
|
Farmers Group, Inc.
|
100.000
|
|
Farmers Reinsurance Company
|
CA
|
Farmers Group, Inc.
|
100.000
|
|
Farmers Services Corporation
|
NV
|
Farmers Group, Inc.
|
100.000
|
|
Farmers Underwriters Association
|
CA
|
Farmers Group, Inc.
|
100.000
|
|
Fidelity and Deposit Company of Maryland
|
IL
|
Zurich American Insurance Company
|
100.000
|
|
FIG Holding Company
|
CA
|
Farmers Group, Inc.
|
100.000
|
|
FIG Leasing Co., Inc.
|
CA
|
Farmers Group, Inc.
|
100.000
|
|
Fire Underwriters Association
|
CA
|
Farmers Group, Inc.
|
100.000
|
|
Fitsense Insurance Services Pty Ltd
|
AUS
|
Travel Assist Pty Limited
|
100.000
|
|
Futuro de Bolivia S.A. Administradora de Fondos de Pensiones
|
BOL
|
Zurich Boliviana Seguros Personales S.A.
|
8.422
|
|
Futuro de Bolivia S.A. Administradora de Fondos de Pensiones
|
BOL
|
Zurich South America Invest AB
|
71.578
|
|
FX Insurance Agency Hawaii, LLC
|
HI
|
FIG Leasing Co., Inc.
|
100.000
|
|
FX Insurance Agency, LLC
|
DE
|
FIG Leasing Co., Inc.
|
100.000
|
|
General Surety & Guarantee Co Limited
|
GBR
|
Zurich Insurance Company (U.K.) Limited
|
100.000
|
|
Grovewood Property Holdings Limited
|
GBR
|
Eagle Star Holdings Limited
|
100.000
|
|
H4B Humboldthafen Einheitsgesellschaft GmbH&Co.KG
|
DEU
|
REX-ZDHL S.C.S. SICAV-SIF
|
94.900
|
|
Halo Holdco Limited
|
GBR
|
Cover-More Australia Pty Ltd
|
100.000
|
|
Halo Holdco Limited
|
GBR
|
Zürich Versicherungs-Gesellschaft AG
|
|
|
Halo Insurance Services Limited
|
GBR
|
Halo Holdco Limited
|
100.000
|
|
Halo Insurance Services Pty Ltd
|
AUS
|
Halo Insurance Services Limited
|
100.000
|
|
Hawkcentral Limited
|
GBR
|
Zurich Assurance Ltd
|
100.000
|
|
Healthinsite Proprietary Limited
|
ZAF
|
Zürich Versicherungs-Gesellschaft AG
|
100.000
|
|
Healthlogix Pty Ltd
|
AUS
|
Insite Holdings Pty Ltd
|
100.000
|
|
Healthlogix Technologia Eireli
|
BRA
|
Healthlogix Pty Ltd
|
100.000
|
|
Herengracht Investments B.V
|
DEU
|
RE Curve Holding B.V.
|
100.000
|
|
HOU IND 1, LLC
|
DE
|
Zurich American Insurance Company
|
100.000
|
|
HOU IND 2, LLC
|
DE
|
Zurich American Insurance Company
|
100.000
|
|
HOU IND 3, LLC
|
DE
|
Zurich American Insurance Company
|
100.000
|
|
Independence Center Realty L.P.
|
DE
|
Philadelphia Investor, LLC
|
89.000
|
|
INNATE, Inc.
|
DC
|
Cover-More Holdings USA Inc.
|
100.000
|
|
Insite Holdings Pty Ltd
|
AUS
|
Zürich Versicherungs-Gesellschaft AG
|
100.000
|
|
INTEGRA Versicherungsdienst GmbH
|
AUT
|
Zurich Versicherungs-Aktiengesellschaft
|
100.000
|
|
Intelligent Technologies OÜ
|
EST
|
Zürich Versicherungs-Gesellschaft AG
|
100.000
|
|
International Travel Assistance S.A.
|
PAN
|
Zürich Versicherungs-Gesellschaft AG
|
55.000
|
|
Inversiones Suizo Chilena S.A.
|
CHL
|
Inversiones Suizo-Argentina S.A.
|
0.001
|
|
Inversiones Suizo Chilena S.A.
|
CHL
|
Zurich Versicherungs-Gesellschaft AG
|
99.999
|
|
Inversiones Suizo-Argentina S.A.
|
ARG
|
Zurich Lebensversicherungs-Gesellschaft AG
|
5.004
|
|
Inversiones Suizo-Argentina S.A.
|
ARG
|
Zurich Versicherungs-Gesellschaft AG
|
94.996
|
|
Inversiones ZS America Dos Limitada
|
CHL
|
Inversiones ZS America SpA
|
100.000
|
|
Inversiones ZS America SpA
|
CHL
|
Zurich Santander Insurance America, S.L.
|
100.000
|
|
Inversiones ZS America Tres SpA
|
CHL
|
Zurich Santander Insurance America, S.L.
|
100.000
|
|
Irish National Insurance Company p.l.c.
|
IRL
|
Zurich Insurance plc
|
100.000
|
|
Isis S.A.
|
ARG
|
Inversiones Suizo-Argentina S.A.
|
60.501
|
|
Isis S.A.
|
ARG
|
Zurich Versicherungs-Gesellschaft AG
|
39.499
|
|
Karvat Cover-More Assist. Pvt Ltd.
|
IND
|
Cover-More Asia Pte. Ltd
|
100.000
|
|
Kennet Road 1 UK Limited
|
GBR
|
Zurich Assurance Ltd
|
100.000
|
|
Kennet Road 2 UK Limited
|
GBR
|
Zurich Assurance Ltd
|
100.000
|
|
Klare Corredora de Seguros S.A.
|
CHL
|
Zurich Insurance Mobile Solutions AG
|
49.900
|
|
Komparu B.V.
|
NLD
|
Digital Insurance Group B.V.
|
100.000
|
|
Kono Insurance Limited
|
HKG
|
Zurich Versicherungs-Gesellschaft AG
|
100.000
|
|
Kraft Lake Insurance Agency, Inc.
|
MI
|
FIG Leasing Co, Inc.
|
100.000
|
|
LA Apt. 1, LLC
|
DE
|
Zurich American Insurance Company
|
100.000
|
|
LA Industrial 1, LLC
|
DE
|
Zurich American Insurance Company
|
100.000
|
|
LA Industrial 4, LLC
|
DE
|
Zurich American Insurance Company
|
100.000
|
|
LA Retail 1 LLC
|
DE
|
Zurich American Insurance Company
|
100.000
|
|
Livetravel Inc.
|
WI
|
Zurich Cover-More Global Travel, Inc.
|
100.000
|
|
Manon Vision Co., Ltd.
|
THA
|
Centre Solutions (Bermuda) Limited
|
0.001
|
|
Manon Vision Co., Ltd.
|
THA
|
Zurich Finance Company Ltd
|
0.001
|
|
Manon Vision Co., Ltd.
|
THA
|
Zurich Versicherungs-Gesellschaft AG
|
99.999
|
|
Mapfre Ya?am Sigorta A.?.
|
TUR
|
Zurich Sigorta A.S.
|
99.778
|
|
MEATPACKING B.V.
|
NLD
|
Rock Inne Vastgoed B.V.
|
100.000
|
|
Medidata AG
|
CHE
|
Zurich Versicherungs-Gesellschaft AG
|
8.852
|
|
MI Administrators, LLC
|
DE
|
FIG Leasing Co., Inc.
|
100.000
|
|
MIAMI INDUSTRIAL 1, LLC
|
DE
|
Zurich American Insurance Company
|
100.000
|
|
Miami Office 2, LLC
|
DE
|
Zurich American Insurance Company
|
100.000
|
|
MIAMI OFFICE 3, LLC
|
DE
|
Zurich American Insurance Company
|
100.000
|
|
Miami Retail 1, LLC
|
DE
|
Zurich American Insurance Company
|
100.000
|
|
Minas Brasil Promotora de Servicos S/A
|
BRA
|
Zurich Minas Brasil Seguros S.A,
|
100.000
|
|
MSP APT 1, LLC
|
DE
|
Zurich American Insurance Company
|
100.000
|
|
Nashville Apt. 1, LLC
|
DE
|
Zurich American Insurance Company
|
|
|
Nashville Office 1, LLC
|
DE
|
Zurich American Insurance Company
|
100.000
|
|
Navigators and General Insurance Company Limited
|
GBR
|
Zurich Insurance plc
|
100.000
|
|
Nearheath Limited
|
GBR
|
Zurich Assurance Ltd
|
100.000
|
|
NY Industrial 1, LLC
|
DE
|
Zurich American Insurance Company
|
100.000
|
|
Oak Underwriting plc
|
GBR
|
Zurich Holdings (UK) Limited
|
100.000
|
|
OnePath General Insurance Pty Limited
|
AUS
|
Zurich Financial Services Australia Limited
|
100.000
|
|
OnePath Life Australia Holdings Pty Ltd
|
AUS
|
Zurich Financial Services Australia Limited
|
100.000
|
|
OnePath Life Limited
|
AUS
|
OnePath Life Australia Holdings Pty Ltd
|
100.000
|
|
Orange Stone Company
|
IRL
|
Zurich Finance Company AG
|
100.000
|
|
Orion Rechtsschutz-Versicherung AG
|
CHE
|
Zurich Versicherungs-Gesellschaft AG
|
78.000
|
|
Parcelgate Limited
|
GBR
|
Zurich Assurance Ltd
|
100.000
|
|
Perils AG
|
CHE
|
Zurich Versicherungs-Gesellschaft AG
|
11.111
|
|
Perunsel S.A.
|
URY
|
Zürich Versicherungs-Gesellschaft AG
|
60.000
|
|
PFS Pension Fund Services AG
|
CHE
|
Zürich Versicherungs-Gesellschaft AG
|
18.433
|
|
Philly Office 1, LLC
|
DE
|
Zurich American Insurance Company
|
100.000
|
|
Philly Office Land, LLC
|
DE
|
Zurich American Insurance Company
|
100.000
|
|
POR Apt 1, LLC
|
DE
|
Zurich American Insurance Company
|
100.000
|
|
POR Apt 2, LLC
|
DE
|
Zurich American Insurance Company
|
100.000
|
|
Prime Corporate Psychology Pty Ltd
|
AUS
|
DTC Bidco Pty Ltd
|
100.000
|
|
Protektor Lebensversicherungs-AG
|
DEU
|
Zurich Deutscher Herold Lebensversicherung Aktiengesellschaf
|
5.158
|
|
PT Asuransi Adira Dinamika Tbk
|
IDN
|
Zürich Versicherungs-Gesellschaft AG
|
98.488
|
|
PT Zurich Insurance Indonesia
|
IDN
|
Zürich Rückversicherungs-Gesellschaft AG
|
1.569
|
|
PT Zurich Insurance Indonesia
|
IDN
|
Zurich Versicherungs-Gesellschaft AG
|
97.091
|
|
PT Zurich Topas Life
|
IDN
|
Zurich Versicherungs-Gesellschaft AG
|
80.000
|
|
Qover
|
BEL
|
Zürich Versicherungs-Gesellschaft AG
|
21.260
|
|
Raleigh Office 2, LLC
|
DE
|
Farmers New World Life Insurance Company
|
100.000
|
|
RE Curve Holding B.V.
|
DEU
|
Zurich Deutscher Herold Lebensversicherung Aktiengesellschaf
|
100.000
|
|
Real Garant Espana S.L.
|
ESP
|
Real Garant GmbH Garantiesysteme
|
100.000
|
|
Real Garant GmbH Garantiesysteme
|
DEU
|
Real Garant Versicherung Aktiengesellschaft
|
100.000
|
|
Real Garant Versicherung Aktiengesellschaft
|
DEU
|
Zurich Beteiligungs-Aktiengesellschaft (Deutschland)
|
100.000
|
|
REX Baume S.C.I
|
FRA
|
REX Holding France
|
100.000
|
|
REX Holding France
|
FRA
|
REX OPPCI Fonds
|
100.000
|
|
REX Holding S.a.r.l.
|
LUX
|
REX-ZDHL S.C.S. SICAV-SIF
|
100.000
|
|
REX Mauchamps
|
FRA
|
REX Holding France
|
100.000
|
|
REX Vilette
|
FRA
|
REX Holding France
|
|
|
REX-Aurea-ZDHL S.C.S.
|
LUX
|
REX-ZDHL GP S.à r.l.
|
100.000
|
|
REX-De Baak B.V.
|
NLD
|
REX Holding S.à r.l.
|
100.000
|
|
REX-Germany-ZDHL S.C.S
|
LUX
|
REX-ZDHL S.C.S. SICAV-SIF
|
95.240
|
|
REX-Humboldthafen Verwaltungs GmbH
|
DEU
|
REX-ZDHL S.C.S. SICAV-SIF
|
100.000
|
|
Rex-Spain-ZDHL S.L.
|
ESP
|
Zurich Deutscher Herold Lebensversicherung Aktiengesellschaf
|
100.000
|
|
REX-The East S.à.r.l
|
LUX
|
REX-ZDHL S.C.S. SICAV-SIF
|
94.800
|
|
REX-ZDHL GP S.a.r.l.
|
LUX
|
Zurich Deutscher Herold Lebensversicherung Aktiengesellschaf
|
100.000
|
|
REX-ZDHL S.C.S. SICAV-SIF
|
LUX
|
Zurich Deutscher Herold Lebensversicherung Aktiengesellschaf
|
100.000
|
|
Rock Inne Vastgoed B.V.
|
NLD
|
REX Holding S.à.r.l.
|
100.000
|
|
Rokin 21 B.V.
|
NLD
|
Roxana Vastgoed B.V.
|
100.000
|
|
Rokin 49 B.V.
|
NLD
|
Rock Inne Vastgoed B.V.
|
100.000
|
|
Roxana Vastgoed B.V.
|
NLD
|
REX Holding S.à.r.l.
|
100.000
|
|
Rural Community Insurance Company
|
MN
|
Zurich American Insurance Company
|
100.000
|
|
San Diego Retail 1, LLC
|
DE
|
Zurich American Insurance Company
|
100.000
|
|
Santander Rio Seguros S.A.
|
ARG
|
Inversiones ZS America SpA
|
4.000
|
|
Santander Rio Seguros S.A.
|
ARG
|
Zurich Santander Insurance America, S.L.
|
96.000
|
|
Santander Seguros Sociedad Anónima
|
URY
|
Zurich Santander Insurance America, S.L.
|
100.000
|
|
Saudi National Insurance Company
|
BEL
|
Zurich Insurance Company Ltd (Bahrain Branch)
|
5.000
|
|
SEA APARTMENT 2, LLC
|
DE
|
Zurich American Insurance Company
|
100.000
|
|
Serviaide, S.A. - Sociedad Unipersonal
|
ESP
|
AIDE Asistencia Seguros y Reaseguros, S.A. - Sociedad Uniper
|
100.000
|
|
Servizurich S.A. - Sociedad Unipersonal
|
ESP
|
Zurich Insurance plc, Sucursal en Espana
|
100.000
|
|
SF Apt 1, LLC
|
DE
|
Zurich American Insurance Company
|
100.000
|
|
SpearTip, LLC
|
IL
|
Zurich Holding Company of America, Inc.
|
100.000
|
|
Special Insurance Services, Inc.
|
IL
|
Zurich American Insurance Company
|
100.000
|
|
Speigelhof Vastgoed B.V.
|
DEU
|
RE Curve Holding B.V.
|
100.000
|
|
Springboard Health and Performance Pty Ltd
|
AUS
|
DTC Bidco Pty Ltd
|
100.000
|
|
Springworks International AB
|
SWE
|
autoSense AG
|
50.000
|
|
Steadfast Insurance Company
|
IL
|
Zurich American Insurance Company
|
100.000
|
|
Stratos Limited
|
NZL
|
DTC NZ Bidco Limited
|
100.000
|
|
Swiss Insurance Management (Hong Kong) Limited
|
HKG
|
Zurich Services (Hong Kong) Limited
|
0.495
|
|
Swiss Insurance Management (Hong Kong) Limited
|
HKG
|
Zurich Insurance Holdings (Hong Kong) Limited
|
99.505
|
|
TDG Tele Dienste GmbH
|
DEU
|
Zurich Beteiligungs-Aktiengesellschaft (Deutschland)
|
100.000
|
|
Tennyson Insurance Limited
|
GBR
|
Zurich Holdings (UK) Limited
|
100.000
|
|
TGG Real Estate Holdings LLC
|
DE
|
Zurich Cover-More Global Travel, Inc.
|
100.000
|
|
The Liverpool Reversionary Company Limited
|
GBR
|
Zurich Legacy Solutions Services (UK) Limited
|
100.000
|
|
The Zurich Services Corporation
|
IL
|
Zurich Holding Company of America, Inc.
|
100.000
|
|
TopReport Schadenbesichtigungs GmbH
|
AUT
|
Zurich Versicherungs-Aktiengesellschaft
|
14.286
|
|
Travel Ace Chile S.A.
|
CHL
|
Travel Ace Internacional de Servicios S.A.
|
1.000
|
|
Travel Ace Chile S.A.
|
CHL
|
Zürich Versicherungs-Gesellschaft AG
|
99.000
|
|
Travel Ace Internacional de Servicios S.A.
|
URY
|
Zürich Versicherungs-Gesellschaft AG
|
100.000
|
|
Travel Assist Pty Limited
|
AUS
|
ASTIS Holdings Limited
|
100.000
|
|
Travel Guard Americas LLC
|
WI
|
Zurich Cover-More Global Travel, Inc.
|
100.000
|
|
Travel Guard Assist, Inc.
|
DE
|
Zurich Cover-More Global Travel, Inc.
|
100.000
|
|
Travel Guard EMEA Limited
|
GBR
|
Zurich Cover-More Global Travel, Inc.
|
100.000
|
|
Travel Guard Group Canada, Inc.
|
CAN
|
Zurich Cover-More Global Travel, Inc.
|
100.000
|
|
Travel Guard Group, Inc.
|
WI
|
Zurich Cover-More Global Travel, Inc.
|
100.000
|
|
Travel Insurance Partners Pty Ltd
|
AUS
|
Travel Assist Pty Limited
|
100.000
|
|
Travel Insurance Services Canada Inc.
|
CAN
|
World Travel Protection Canada Inc.
|
100.000
|
|
Travelex Insurance Services Limited
|
DE
|
Cover-More Holdings USA Inc.
|
100.000
|
|
Truck Underwriters Association
|
CA
|
Farmers Group, Inc.
|
100.000
|
|
Turegum Immobilien AG
|
CHE
|
Zurich Versicherungs-Gesellschaft AG
|
100.000
|
|
UA Assistance S.A. de C.V.
|
MEX
|
Travel Ace Internacional de Servicios S.A.
|
|
|
UA Assistance S.A. de C.V.
|
MEX
|
Zürich Versicherungs-Gesellschaft AG
|
100.000
|
|
Universal Assistance S.A.
|
ARG
|
World Wide Assistance S.A.
|
92.710
|
|
Universal Assistance S.A.
|
ARG
|
Zürich Versicherungs-Gesellschaft AG
|
7.290
|
|
Universal Assistance S.A.
|
URY
|
Zürich Versicherungs-Gesellschaft AG
|
100.000
|
|
Universal Travel Assistance S.A.S.
|
COL
|
Zürich Versicherungs-Gesellschaft AG
|
100.000
|
|
Universal Underwriters Insurance Company
|
IL
|
Zurich American Insurance Company
|
100.000
|
|
Universal Underwriters of Texas Insurance Company
|
IL
|
Universal Underwriters Insurance Company
|
100.000
|
|
Universal Underwriters Service Corporation
|
MO
|
Zurich Holding Company of America, Inc.
|
100.000
|
|
Unviversal Assistance Inc.
|
FL
|
Universal Assistance S.A.
|
|
|
Vehicle Dealer Solutions, Inc.
|
FL
|
Zurich Holding Company of America, Inc.
|
100.000
|
|
Western Star Insurance Services, Inc.
|
TX
|
FIG Leasing Co, Inc.
|
100.000
|
|
Wohnen H3B Humboldthafen GmbH&Co.KG
|
DEU
|
REX-ZDHL S.C.S. SICAV-SIF
|
94.900
|
|
World Travel Protection Canada Inc.
|
CAN
|
Zurich Canadian Holdings Limited
|
100.000
|
|
World Wide Assistance S.A.
|
ARG
|
Zürich Versicherungs-Gesellschaft AG
|
100.000
|
|
Z flex Gesellschaft fur Personaldienstleistungen mbH
|
DEU
|
Zurich Beteiligungs-Aktiengesellschaft (Deutschland)
|
100.000
|
|
ZCM (U.S.) Limited
|
DE
|
Zurich Finance Company Ltd
|
100.000
|
|
ZCM Asset Holding Company (Bermuda) Limited
|
BMU
|
Zurich Finance Company Ltd
|
100.000
|
|
ZFUS Services, LLC
|
DE
|
Zurich Holding Company of America, Inc.
|
100.000
|
|
ZGEE14 Limited
|
GBR
|
Zurich Legacy Solutions Services (UK) Limited
|
100.000
|
|
ZLS Aseguradora de Colombia S.A
|
COL
|
Zürich Lebensversicherungs-Gesellschaft AG
|
4.430
|
|
ZLS Aseguradora de Colombia S.A
|
|
Zürich Versicherungs-Gesellschaft AG
|
95.000
|
|
ZNA Services, LLC
|
DE
|
ZFUS Services, LLC
|
100.000
|
|
ZPC Capital Limited
|
GBR
|
Zurich Holdings (UK) Limited
|
100.000
|
|
ZSF / Office KY, LLC
|
DE
|
Euclid Office LP
|
100.000
|
|
ZSF / Office NV, LLC
|
DE
|
Euclid Office LP
|
100.000
|
|
ZSF KY Annex, LLC
|
DE
|
Euclid KY Annex, LP
|
100.000
|
|
ZSF/Bloomington, LLC
|
DE
|
Bloomington Office LP
|
100.000
|
|
ZSF/C1 MGP Manager, Inc
|
DE
|
Zurich Structured Finance, Inc.
|
100.000
|
|
ZSF/C1 MGP, LLC
|
DE
|
ZSF/C1 MGP Manager, Inc
|
1.000
|
|
ZSF/C1 MGP, LLC
|
DE
|
Zurich Structured Finance, Inc.
|
99.000
|
|
ZSF/C2 MGP Manager, Inc
|
DE
|
Zurich Structured Finance, Inc.
|
100.000
|
|
ZSF/C2 MGP, LLC
|
DE
|
ZSF/CF2 MGP Manager, Inc.
|
1.000
|
|
ZSF/C2 MGP, LLC
|
DE
|
Zurich Structured Finance, Inc.
|
99.000
|
|
ZSF/Dallas Tower, LLC
|
DE
|
Dallas Tower LP
|
100.000
|
|
ZSF/WD Hammond, LLC
|
DE
|
Euclid Warehouses LP
|
100.000
|
|
ZSF/WD Jacksonville, LLC
|
DE
|
Euclid Warehouses LP
|
100.000
|
|
ZSG Kfz-ZulassungsservicegesmbH
|
AUT
|
Zurich Versicherungs-Aktiengesellschaft
|
33.333
|
|
Zurich - Companhia de Seguros Vida S.A.
|
PRT
|
Zurich Finanz-Gesellschaft AG
|
0.001
|
|
Zurich - Companhia de Seguros Vida S.A.
|
PRT
|
Zurich Investments Life S.p.A.
|
0.001
|
|
Zurich - Companhia de Seguros Vida S.A.
|
PRT
|
Zurich Lebensversicherungs-Gesellschaft AG
|
99.996
|
|
Zurich - Companhia de Seguros Vida S.A.
|
PRT
|
Zurich Versicherungs-Gesellschaft AG
|
0.001
|
|
Zurich - Companhia de Seguros Vida S.A.
|
PRT
|
Zurich Vida, Companía de Seguros y Reaseguros, S.A. - Socied
|
0.001
|
|
Zurich (Scotland) Limited Partnership
|
GBR
|
Zurich General Partner (Scotland) Ltd
|
100.000
|
|
Zurich Advice Network Limited
|
GBR
|
Allied Dunbar Assurance plc
|
100.000
|
|
Zurich AFIN Mexico, S.A. DE C.V.
|
MEX
|
Zurich Compania de Sefuros, S.A.
|
0.002
|
|
Zurich AFIN Mexico, S.A. DE C.V.
|
MEX
|
Zurich Versicherungs-Gesellschaft AG
|
99.998
|
|
Zurich Agency Services Inc.
|
MA
|
Zurich Holding Company of America, Inc.
|
100.000
|
|
Zurich Alternative Asset Management, LLC
|
DE
|
Zurich Holding Company of America, Inc.
|
100.000
|
|
Zurich America Latina Serviços Brasil Ltda.
|
BRA
|
Zurich Lebensversicherungs-Gesellschaft AG
|
0.010
|
|
Zurich America Latina Serviços Brasil Ltda.
|
BRA
|
Zurich Versicherungs-Gesellschaft AG
|
99.990
|
|
Zurich American Insurance Company
|
NY
|
Zurich Holding Company of America, Inc.
|
100.000
|
|
Zurich American Insurance Company of Illinois
|
IL
|
American Zurich Insurance Company
|
100.000
|
|
Zurich American Life Insurance Company
|
IL
|
Zurich Holding Company of America, Inc.
|
100.000
|
|
Zurich American Life Insurance Company of New York
|
NY
|
Zurich American Life Insurance Company.
|
100.000
|
|
Zurich Argentina Cia. de Seguros S.A.
|
ARG
|
Inversiones Suizo-Argentina S.A.
|
55.461
|
|
Zurich Argentina Cia. de Seguros S.A.
|
ARG
|
Zurich Versicherungs-Gesellschaft AG
|
44.536
|
|
Zurich Argentina Companía de Seguros de Retiro S.A.
|
ARG
|
Zurich Argentina Cia. de Seguros S.A.
|
46.642
|
|
Zurich Argentina Companía de Seguros de Retiro S.A.
|
ARG
|
Zurich Versicherungs-Gesellschaft AG
|
53.358
|
|
Zurich Aseguradora Argentina S.A.
|
ARG
|
Zürich Versicherungs-Gesellschaft AG
|
99.900
|
|
Zurich Aseguradora Mexicana, S.A. de C.V.
|
MEX
|
Zürich Lebensversicherungs-Gesellschaft AG
|
|
|
Zurich Aseguradora Mexicana, S.A. de C.V.
|
MEX
|
Zürich Versicherungs-Gesellschaft AG
|
100.000
|
|
Zurich Asset Management Gerente de Fondos Comunes de Inversi
|
ARG
|
Inversiones Suizo-Argentina S.A.
|
90.000
|
|
Zurich Asset Management Gerente de Fondos Comunes de Inversi
|
ARG
|
Isis S.A.
|
10.000
|
|
Zurich Assurance Ltd
|
GBR
|
Eagle Star Holdings Limited
|
100.000
|
|
Zurich Assure Australia Pty Limited
|
AUS
|
Zurich Financial Services Australia Limited
|
100.000
|
|
Zurich Australia Limited
|
AUS
|
Zurich Financial Services Australia Limited
|
100.000
|
|
Zurich Australian Insurance Limited
|
AUS
|
Zurich Financial Services Australia Limited
|
100.000
|
|
Zurich Australian Insurance Properties Pty Limited
|
AUS
|
Zurich Australia Limited
|
40.000
|
|
Zurich Australian Insurance Properties Pty Limited
|
AUS
|
Zurich Australian Insurance Limited
|
60.000
|
|
Zurich Australian Property Holdings Pty Ltd
|
AUS
|
Zürich Versicherungs-Gesellschaft AG
|
100.000
|
|
Zurich Bank International Limited
|
GBR
|
Dunbar Assets Ireland
|
100.000
|
|
Zurich Benefit Finance LLC
|
DE
|
Zurich Holding Company of America, Inc.
|
100.000
|
|
Zurich Beteiligungs-Aktiengesellschaft (Deutschland)
|
DEU
|
Zurich IT Service AG Niederlassung fur Deutschland
|
82.617
|
|
Zurich Beteiligungs-Aktiengesellschaft (Deutschland)
|
DEU
|
Zurich Leben Service AG Niederlassung fur Deutschland
|
17.383
|
|
Zurich Brand and Experience Studio Spain, S.L.
|
ESP
|
Zürich Versicherungs-Gesellschaft AG
|
100.000
|
|
Zurich Brasil Capitalizacao S.A
|
BRA
|
Zurich Versicherungs-Gesellschaft AG
|
100.000
|
|
Zurich Brasil Companhia de Seguros
|
BRA
|
Zurich Minas Brasil Seguros S.A.
|
100.000
|
|
Zurich Building Control Services Limited
|
GBR
|
Zurich Holdings (UK) Limited
|
100.000
|
|
Zurich Canadian Holdings Limited
|
CAN
|
Zurich Insurance Company Ltd, Canadian Branch
|
68.819
|
|
Zurich Canadian Holdings Limited
|
CAN
|
Zurich Versicherungs-Gesellschaft AG
|
31.181
|
|
Zurich Commercial Services (Europe) GmbH
|
DEU
|
Zürich Beteiligungs-Aktiengesellschaft (Deutschland)
|
100.000
|
|
Zurich Community Trust (UK) Limited
|
GBR
|
Zurich Financial Services (UKISA) Limited
|
50.000
|
|
Zurich Community Trust (UK) Limited
|
GBR
|
Zurich Financial Services (UKISA) Nominees Limited
|
50.000
|
|
Zurich Compania de Reaseguros Argentina S.A.
|
ARG
|
Inversiones Suizo-Argentina S.A.
|
95.000
|
|
Zurich Compania de Reaseguros Argentina S.A.
|
ARG
|
Zurich Versicherungs-Gesellschaft AG
|
5.000
|
|
Zurich Companía de Seguros, S.A.
|
MEX
|
Zurich Versicherungs-Gesellschaft AG
|
99.883
|
|
Zurich Corredora de Bolsa S.A.
|
CHL
|
Inversiones Suizo Chilena S.A.
|
99.000
|
|
Zurich Corredora de Bolsa S.A.
|
CHL
|
Zurich Investments Chile S.A.
|
1.000
|
|
Zurich Cover-More Global Travel, Inc.
|
DE
|
Zurich Holding Company of America, Inc.
|
100.000
|
|
Zurich Customer Active Management, d.o.o.
|
SVN
|
Zürich Versicherungs-Gesellschaft AG
|
100.000
|
|
Zurich CZI Management Holding Ltd.
|
DE
|
Zurich Global Investment Management Inc.
|
100.000
|
|
Zurich Deutscher Herold Lebensversicherung Aktiengesellschaf
|
DEU
|
Deutscher Herold Aktiengesellschaft
|
67.540
|
|
Zurich Deutscher Herold Lebensversicherung Aktiengesellschaf
|
DEU
|
Zurich Beteiligungs-Aktiengesellschaft (Deutschland)
|
32.460
|
|
Zurich E&S Insurance Brokerage, Inc.
|
CA
|
Zurich American Insurance Company
|
100.000
|
|
Zurich Employment Services Limited
|
GBR
|
Zurich Financial Services (UKISA) Limited
|
100.000
|
|
Zurich Engineering Inspection Services Ireland Limited
|
IRL
|
Zurich Insurance plc
|
100.000
|
|
Zurich Eurolife S.A.
|
LUX
|
Zurich Lebensversicherungs-Gesellschaft AG
|
90.000
|
|
Zurich Eurolife S.A.
|
LUX
|
Zurich Versicherungs-Gesellschaft AG
|
10.000
|
|
Zurich F&I Reinsurance T&C Limited
|
TCA
|
Universal Underwriters Service Corporation
|
100.000
|
|
Zurich F&I Reinsurance T&C Limited
|
TCA
|
Zurich Agency Services Inc.
|
0.001
|
|
Zurich Fianzas Mexico, S.A.DE C.V.
|
MEX
|
Zurich Versicherungs-Gesellschaft AG
|
100.000
|
|
Zurich Finance (Australia) Limited
|
AUS
|
Zürich Versicherungs-Gesellschaft AG
|
100.000
|
|
Zurich Finance (Ireland) DAC
|
IRL
|
Zürich Versicherungs-Gesellschaft AG
|
100.000
|
|
Zurich Finance (Ireland) II DAC
|
IRL
|
Zürich Versicherungs-Gesellschaft AG
|
100.000
|
|
Zurich Finance (UK) plc
|
GBR
|
Zurich Financial Services (UKISA) Limited
|
99.998
|
|
Zurich Finance (UK) plc
|
GBR
|
Zurich Financial Services (UKISA) Nominees Limited
|
0.002
|
|
Zurich Finance Company Ltd
|
CHE
|
Zurich Versicherungs-Gesellschaft AG
|
100.000
|
|
Zurich Financial Services (Isle of Man) Group Services Limit
|
GBR
|
Zurich Versicherungs-Gesellschaft AG
|
100.000
|
|
Zurich Financial Services (Isle of Man) Holdings Limited
|
GBR
|
Zurich Versicherungs-Gesellschaft AG
|
100.000
|
|
Zurich Financial Services (Isle of Man) Insurance Manager Lt
|
GBR
|
Zurich Versicherungs-Gesellschaft AG
|
100.000
|
|
Zurich Financial Services (UKISA) Limited
|
GBR
|
Allied Zurich Holdings Limited
|
90.316
|
|
Zurich Financial Services (UKISA) Limited
|
GBR
|
Zurich Insurance plc
|
9.684
|
|
Zurich Financial Services (UKISA) Nominees Limited
|
GBR
|
Zurich Financial Services (UKISA) Limited
|
100.000
|
|
Zurich Financial Services Australia Limited
|
AUS
|
Zurich Versicherungs-Gesellschaft AG
|
100.000
|
|
Zurich Financial Services EUB Holdings Limited
|
IRL
|
Zurich Ins Group
|
0.083
|
|
Zurich Financial Services EUB Holdings Limited
|
IRL
|
Zurich Insurance Group Ltd.
|
99.917
|
|
Zurich Financial Services UK Pension Trustee Limited
|
GBR
|
Zurich Financial Services (UKISA) Limited
|
99.000
|
|
Zurich Finanz-Gesellschaft AG
|
CHE
|
Zurich Versicherungs-Gesellschaft AG
|
100.000
|
|
Zurich General Insurance (Hong Kong) Limited
|
HKG
|
Zurich Insurance Company Ltd, Hong Kong Branch
|
100.000
|
|
Zurich General Insurance Company (China) Limited
|
CHN
|
Zurich Versicherungs-Gesellschaft AG
|
100.000
|
|
Zurich General Insurance Malaysia Berhad
|
MYS
|
Zürich Versicherungs-Gesellschaft AG
|
100.000
|
|
Zurich General Partner (Scotland) Ltd
|
GBR
|
Allied Zurich Holdings Limited
|
100.000
|
|
Zurich General Takaful Malaysia Berhad
|
MYS
|
Zurich Holdings Malaysia Berhad
|
100.000
|
|
Zurich GL Servicios Mexico, S.A. de C.V.
|
MEX
|
Zurich Companía de Seguros, S.A.
|
5.000
|
|
Zurich GL Servicios Mexico, S.A. de C.V.
|
MEX
|
Zurich Vida, Compañía de Seguros, S.A.
|
95.000
|
|
Zurich Global Corporate UK Limited
|
GBR
|
Zurich Holdings (UK) Limited
|
100.000
|
|
Zurich Global Investment Management Inc.
|
DE
|
Zurich Holding Company of America, Inc.
|
100.000
|
|
Zurich Global Ventures MGA Solutions (SA)
|
|
Zürich Versicherungs-Gesellschaft AG
|
100.000
|
|
Zurich Global, Ltd.
|
BMU
|
Zurich Holding Company of America, Inc.
|
100.000
|
|
Zurich Group Pension Services (UK) Ltd
|
GBR
|
Zurich Assurance Ltd
|
100.000
|
|
Zurich GSG Limited
|
GBR
|
Zurich GSH Limited
|
100.000
|
|
Zurich GSH Limited
|
GBR
|
Zurich Holdings (UK) Limited
|
100.000
|
|
Zurich Holding Company of America, Inc.
|
DE
|
Zurich Versicherungs-Gesellschaft AG
|
100.000
|
|
Zurich Holding Ireland Limited
|
IRL
|
Zurich Versicherungs-Gesellschaft AG
|
100.000
|
|
Zurich Holdings (UK) Limited
|
GBR
|
Zurich Versicherungs-Gesellschaft AG
|
100.000
|
|
Zurich Immobilien (Deutschland) AG & Co. KG
|
DEU
|
Zurich Immobilientreuhand (Deutschland) GmbH
|
|
|
Zurich Immobilien Liegenschaftsverwaltungs-GesmbH
|
AUT
|
Zurich Versicherungs-Gesellschaft AG
|
100.000
|
|
Zurich Immobilientreuhand (Deutschland) GmbH
|
DEU
|
Zurich Deutscher Herold Lebensversicherung Aktiengesellschaf
|
100.000
|
|
Zurich Insurance Company (U.K.) Limited
|
GBR
|
Zurich Versicherungs-Gesellschaft AG
|
100.000
|
|
Zurich Insurance Company Escritorio de Representacao no Bras
|
BRA
|
Zurich Versicherungs-Gesellschaft AG
|
100.000
|
|
Zurich Insurance Company Ltd., Representative Office Buenos Aires
|
ARG
|
Zurich Versicherungs-Gesellschaft AG
|
100.000
|
|
Zurich Insurance Group Ltd.
|
CHE
|
Board of Directors
|
|
|
Zurich Insurance Holdings (Hong Kong) Limited
|
HKG
|
Zurich Versicherungs-Gesellschaft AG
|
100.000
|
|
Zurich Insurance Malaysia Berhad
|
MYS
|
Zurich Versicherungs-Gesellschaft AG
|
100.000
|
|
Zurich Insurance plc
|
IRL
|
Zurich Beteiligungs-Aktiengesellschaft (Deutschland)
|
25.074
|
|
Zurich Insurance plc
|
IRL
|
Zurich Holding Ireland Limited
|
70.405
|
|
Zurich Insurance plc
|
IRL
|
Zurich Insurance Company Ltd - Rappresentanza Generale per l
|
4.521
|
|
Zurich Insurance plc, Representative Office Buenos Aires
|
ARG
|
Zurich Insurance plc
|
100.000
|
|
Zurich Intermediary Group Limited
|
GBR
|
Zurich Financial Services (UKISA) Limited
|
99.999
|
|
Zurich Intermediary Group Limited
|
GBR
|
Zurich Financial Services (UKISA) Nominees Limited
|
0.001
|
|
Zurich International (UK) Limited
|
GBR
|
Zurich Holdings (UK) Limited
|
100.000
|
|
Zurich International Life Limited
|
GBR
|
Zurich Versicherungs-Gesellschaft AG
|
100.000
|
|
Zurich International Pensions Administration Limited
|
IMN
|
Zurich International Life Limited
|
100.000
|
|
Zurich Invest AG
|
CHE
|
Zurich Versicherungs-Gesellschaft AG
|
100.000
|
|
Zurich Investment Management Limited
|
AUS
|
Zurich Australia Limited
|
100.000
|
|
Zurich Investment Services Limited
|
BMU
|
Zurich Finance Company Ltd
|
100.000
|
|
Zurich Investments Life S.p.A.
|
ITA
|
Zurich Insurance Company Ltd - Rappresentanza Generale per l
|
100.000
|
|
ZURICH IRELAND MASTER TRUSTEE DESIGNATED ACTIVITY COMPANY
|
IRL
|
Zurich Life Assurance plc
|
100.000
|
|
Zurich Italy S.p.A.
|
ITA
|
Zürich Versicherungs-Gesellschaft AG
|
100.000
|
|
Zurich JVCompany Servicios Mexico, S.A. DE C.V.
|
MEX
|
Zurich Santander Seguros Mexico, S.A.
|
99.998
|
|
Zurich JVCompany Servicios Mexico, S.A. DE C.V.
|
MEX
|
Zurich Vida, Compania de Seguros, S.A.
|
0.002
|
|
Zurich Kotak General Insurance Company (India) Limited
|
IND
|
Zurich Shared Services Malaysia Sdn Bhd
|
|
|
Zurich Kotak General Insurance Company (India) Limited
|
IND
|
Zürich Versicherungs-Gesellschaft AG
|
70.000
|
|
Zurich Kotak General Insurance Company (India) Limited
|
IND
|
Zurich Finance Company AG
|
|
|
Zurich Kotak General Insurance Company (India) Limited
|
IND
|
Zurich Services Malaysia Sdn Bhd
|
|
|
Zurich Kotak General Insurance Company (India) Limited
|
IND
|
Zurich Australian Insurance Properties Pty Limited
|
|
|
Zurich Kotak General Insurance Company (India) Limited
|
IND
|
Zurich Insurance Mobile Solutions AG
|
|
|
Zurich Kunden Center GmbH
|
DEU
|
Zurich Beteiligungs-Aktiengesellschaft (Deutschland)
|
100.000
|
|
Zurich Latin America Corporation
|
FL
|
Zurich Holding Company of America, Inc.
|
100.000
|
|
Zurich Latin America Holding S.L. - Sociedad Unipersonal
|
ESP
|
Zurich Lebensversicherungs-Gesellschaft AG
|
100.000
|
|
Zurich Latin American Services S.A.
|
ARG
|
Inversiones Suizo-Argentina S.A.
|
6.320
|
|
Zurich Latin American Services S.A.
|
ARG
|
Zurich Versicherungs-Gesellschaft AG
|
93.680
|
|
Zurich Lebensversicherungs-Gesellschaft AG
|
CHE
|
Zurich Versicherungs-Gesellschaft AG
|
100.000
|
|
Zurich Legacy Solutions Services (UK) Limited
|
GBR
|
Zurich Versicherungs-Gesellschaft AG
|
100.000
|
|
Zurich Life Assurance plc
|
IRL
|
Zurich Holding Ireland Limited
|
100.000
|
|
Zurich Life Insurance (Hong Kong) Limited
|
HKG
|
Zürich Versicherungs-Gesellschaft AG
|
100.000
|
|
Zurich Life Insurance Company Ltd., Representative office Buenos Aires
|
ARG
|
Zurich Lebensversicherungs-Gesellschaft AG
|
100.000
|
|
Zurich Life Preparatory Japan Co. Ltd.
|
JPN
|
Zürich Lebensversicherungs-Gesellschaft AG
|
100.000
|
|
Zurich LiveWell Services and Solutions AG
|
CHE
|
Zürich Versicherungs-Gesellschaft AG
|
100.000
|
|
Zurich Management (Bermuda) Ltd
|
BMU
|
Zurich Versicherungs-Gesellschaft AG
|
100.000
|
|
Zurich Management Services Limited
|
GBR
|
Zurich Holdings (UK) Limited
|
100.000
|
|
Zurich Medical Analytics Pty Ltd
|
AUS
|
Zürich Versicherungs-Gesellschaft AG
|
100.000
|
|
Zurich Minas Brasil Seguros S.A,
|
BRA
|
Zurich Versicherungs-Gesellschaft AG
|
100.000
|
|
Zurich Pension Trustees Ireland Limited
|
IRL
|
Zurich Insurance plc
|
50.000
|
|
Zurich Pension Trustees Ireland Limited
|
IRL
|
Zurich Trustee Services Limited
|
50.000
|
|
Zurich Pension Trustees Limited
|
GBR
|
Zurich Assurance Ltd
|
100.000
|
|
Zurich Pensions Management Limited
|
GBR
|
Allied Dunbar Assurance plc
|
100.000
|
|
Zurich Pensionskassen-Beratung AG
|
CHE
|
Zurich Lebensversicherungs-Gesellschaft AG
|
100.000
|
|
Zurich Professional Limited
|
GBR
|
Zurich Holdings (UK) Limited
|
100.000
|
|
Zurich Project Finance (UK) Limited
|
GBR
|
Zürich Versicherungs-Gesellschaft AG
|
100.000
|
|
Zurich Properties Pty Limited
|
AUS
|
Zurich Australia Limited
|
40.001
|
|
Zurich Properties Pty Limited
|
AUS
|
Zurich Australian Insurance Limited
|
59.999
|
|
Zurich Property Services Malaysia Sdn Bhd
|
MYS
|
Zurich Versicherungs-Gesellschaft AG
|
100.000
|
|
Zurich Realty, Inc.
|
MD
|
Zurich Holding Company of America, Inc.
|
100.000
|
|
Zurich Rechtsschutz-Schadenservice GmbH
|
DEU
|
Zurich Beteiligungs-Aktiengesellschaft (Deutschland)
|
100.000
|
|
Zurich Resseguradora Brasil S.A.
|
BRA
|
Zurich Lebensversicherungs-Gesellschaft AG
|
0.001
|
|
Zurich Resseguradora Brasil S.A.
|
BRA
|
Zurich Versicherungs-Gesellschaft AG
|
99.999
|
|
Zurich Risk Management Services (India) Private Limited
|
IND
|
Zürich Rückversicherungs-Gesellschaft AG
|
1.000
|
|
Zurich Risk Management Services (India) Private Limited
|
|
Zurich Versicherungs-Gesellschaft AG
|
99.000
|
|
Zurich Ruckversicherungs-Gesellschaft AG
|
CHE
|
Zurich Versicherungs-Gesellschaft AG
|
100.000
|
|
Zurich Sander Vermögensverwaltungs AG (Deutschland)
|
DEU
|
Zürich Beteiligungs-Aktiengesellschaft (Deutschland)
|
32.460
|
|
Zurich Sander Vermögensverwaltungs AG (Deutschland)
|
DEU
|
Deutscher Herold Aktiengesellschaft
|
67.540
|
|
Zurich Santander Brasil Odonto LTDA.
|
BRA
|
Zurich Santander Brasil Seguros e Previdência S.A.
|
99.000
|
|
Zurich Santander Brasil Odonto LTDA.
|
BRA
|
Zurich Santander Brasil Seguros S.A.
|
1.000
|
|
Zurich Santander Brasil Seguros e Previdência S.A.
|
BRA
|
Zurich Latin America Holding S.L. - Sociedad Unipersonal
|
0.220
|
|
Zurich Santander Brasil Seguros e Previdência S.A.
|
BRA
|
Zurich Santander Holding (Spain), S.L.
|
99.568
|
|
Zurich Santander Brasil Seguros S.A.
|
BRA
|
Zurich Santander Brasil Seguros e Previdência S.A.
|
100.000
|
|
Zurich Santander Holding (Spain), S.L.
|
ESP
|
Zurich Santander Insurance America, S.L.
|
100.000
|
|
Zurich Santander Holding Dos (Spain), S.L.
|
ESP
|
Zurich Santander Insurance America, S.L.
|
100.000
|
|
Zurich Santander Insurance America, S.L.
|
ESP
|
Zurich Latin America Holding S.L. - Sociedad Unipersonal
|
51.000
|
|
Zurich Santander Seguros Argentina S.A.
|
ARG
|
Inversiones ZS America SpA
|
4.000
|
|
Zurich Santander Seguros Argentina S.A.
|
ARG
|
Zurich Santander Insurance America, S.L.
|
96.000
|
|
Zurich Santander Seguros de Vida Chile S.A.
|
CHL
|
Inversiones ZS America Dos Limitada
|
99.782
|
|
Zurich Santander Seguros de Vida Chile S.A.
|
CHL
|
Inversiones ZS America SpA
|
0.218
|
|
Zurich Santander Seguros Generales Chile S.A.
|
CHL
|
Inversiones ZS America Dos Limitada
|
99.505
|
|
Zurich Santander Seguros Generales Chile S.A.
|
CHL
|
Inversiones ZS America SpA
|
0.495
|
|
Zurich Santander Seguros Mexico, S.A.
|
MEX
|
Inversiones ZS America SpA
|
0.001
|
|
Zurich Santander Seguros Mexico, S.A.
|
MEX
|
Zurich Santander Insurance America, S.L.
|
99.999
|
|
Zurich Schweiz Services AG
|
CHE
|
Zürich Versicherungs-Gesellschaft AG
|
100.000
|
|
Zurich Seguros Ecuador, S.A.
|
ECU
|
Zürich Versicherungs-Gesellschaft AG
|
100.000
|
|
Zurich Seguros Rentas Vitalicias Chile S.A.
|
CHL
|
Zurich Servicios e Inversiones S.A
|
0.010
|
|
Zurich Service GmbH
|
DEU
|
Zurich Versicherungs-Aktiengesellschaft
|
100.000
|
|
Zurich Services (Australia) Pty Limited
|
AUS
|
Zurich Financial Services Australia Limited
|
100.000
|
|
Zurich Services (Hong Kong) Limited
|
HKG
|
Zurich Insurance Holdings (Hong Kong) Limited
|
99.997
|
|
Zurich Services (Hong Kong) Limited
|
HKG
|
Zürich Versicherungs-Gesellschaft AG
|
0.003
|
|
Zurich Services A.I.E.
|
ESP
|
AIDE Asistencia Seguros y Reaseguros, S.A. - Sociedad Uniper
|
0.001
|
|
Zurich Services A.I.E.
|
ESP
|
Bansabadell Pensiones, E.G.F.P, S.A.
|
0.001
|
|
Zurich Services A.I.E.
|
ESP
|
Bansabadell Seguros Generales, S.A. de Seguros y Reaseguros
|
0.001
|
|
Zurich Services A.I.E.
|
ESP
|
Bansabadell Vida S.A. de Seguros y Reaseguros
|
0.001
|
|
Zurich Services A.I.E.
|
ESP
|
Zurich Insurance plc, Sucursal en Espana
|
97.180
|
|
Zurich Services A.I.E.
|
ESP
|
Zurich Vida, Companía de Seguros y Reaseguros, S.A. - Socied
|
2.816
|
|
Zurich Services Company (Pty) Ltd
|
AUS
|
Zürich Versicherungs-Gesellschaft AG
|
100.000
|
|
Zurich Services US. LLC
|
|
Farmers Group, Inc.
|
50.000
|
|
Zurich Services US. LLC
|
|
Zurich Holding Company of America, Inc.
|
50.000
|
|
Zurich Servicios de Mexico, S.A. de. C.V.
|
MEX
|
Zurich Vida, Compania de Seguros, S.A.
|
90.000
|
|
Zurich Servicios de Mexico, S.A. de. C.V.
|
MEX
|
Zurich, Compania de Seguros, S.A.
|
10.000
|
|
ZURICH SERVICIOS DIRECTO ESPAÑA, S.L.
|
ESP
|
Zurich Insurance Mobile Solutions AG
|
100.000
|
|
Zurich Servicios y Soporte México, S.A. de C.V.
|
MEX
|
Zürich Lebensversicherungs-Gesellschaft AG
|
0.020
|
|
Zurich Servicios y Soporte México, S.A. de C.V.
|
MEX
|
Zürich Versicherungs-Gesellschaft AG
|
99.980
|
|
Zurich Shared Services S.A.
|
CHL
|
Inversiones Suizo Chilena S.A.
|
99.987
|
|
Zurich Shared Services S.A.
|
CHL
|
Zurich Investments Chile S.A.
|
0.013
|
|
Zurich Sigorta A.S.
|
TUR
|
Zurich Versicherungs-Gesellschaft AG
|
100.000
|
|
Zurich Small Amount and Short Term Insurance Ltd
|
|
Zürich Versicherungs-Gesellschaft AG
|
100.000
|
|
Zurich South America Invest AB
|
SWE
|
Zurich Versicherungs-Gesellschaft AG
|
100.000
|
|
Zurich Specialties London Limited
|
GBR
|
Zurich Holdings (UK) Limited
|
100.000
|
|
Zurich Structured Finance, Inc.
|
|
Zurich Finance Company Ltd
|
100.000
|
|
Zurich Takaful Malaysia Berhad (ZTMB)
|
MYS
|
Zurich Versicherungs-Gesellschaft AG
|
100.000
|
|
Zurich Technical and Consulting Services (Beijing) Co. Ltd.
|
CHN
|
Zurich Insurance Holdings (Hong Kong) Limited
|
100.000
|
|
Zurich Technical Development (China) Limited
|
CHN
|
Zurich Insurance Holdings (Hong Kong) Limited
|
100.000
|
|
Zurich Technology Malaysia Sdn Bhd
|
MYS
|
Zurich Technology Services Malaysia Sdn Bhd
|
100.000
|
|
Zurich Technology Services Malaysia Sdn Bhd
|
MYS
|
Zurich Versicherungs-Gesellschaft AG
|
100.000
|
|
Zurich Transitional Services Limited
|
GBR
|
Zurich Holdings (UK) Limited
|
100.000
|
|
Zurich Travel Solutions Pty Limited
|
AUS
|
Zürich Versicherungs-Gesellschaft AG
|
100.000
|
|
Zurich Treasury Services Limited
|
IRL
|
Zurich Financial Services EUB Holdings Limited
|
100.000
|
|
Zurich Trustee Services Limited
|
IRL
|
Zurich Life Assurance plc
|
100.000
|
|
Zurich UK General Employee Services Limited
|
GBR
|
Zurich UK General Services Limited
|
100.000
|
|
Zurich UK General Services Limited
|
GBR
|
Zurich Holdings (UK) Limited
|
100.000
|
|
Zurich Versicherungs-Aktiengesellschaft
|
AUT
|
Zurich Versicherungs-Gesellschaft AG
|
99.981
|
|
Zurich Versicherungs-Gesellschaft AG
|
CHE
|
Zurich Insurance Group Ltd.
|
100.000
|
|
Zurich Vida e Previdencia S.A.
|
BRA
|
Zurich Minas Brasil Seguros S.A,
|
100.000
|
|
Zurich Vida, Companía de Seguros y Reaseguros, S.A. - Socied
|
ESP
|
Zurich Lebensversicherungs-Gesellschaft AG
|
100.000
|
|
Zurich Vida, Companía de Seguros, S.A.
|
MEX
|
Zurich Versicherungs-Gesellschaft AG
|
100.000
|
|
Zurich Vorsorge-Beratungs und Vertriebs GmbH (Deutschland)
|
DEU
|
Zürich Beteiligungs-Aktiengesellschaft (Deutschland)
|
100.000
|
|
Zurich Workplace Solutions (Middle East) Limited
|
ARE
|
Zurich International Life Limited
|
100.000
|
Organizations Affiliated with Farmers Insurance Group
|
Company
|
Domicile
|
Ownership
|
%
|
|
DE
|
Mid-Century Insurance Company
|
100.000
|
|
|
11930 Narcoossee Road, LLC
|
DE
|
Mid-Century Insurance Company
|
100.000
|
|
12225 NE 60th Way, LLC
|
DE
|
Truck Insurance Exchange
|
100.000
|
|
145 Great Road LLC
|
DE
|
Mid Century Insurance Company
|
100.000
|
|
17885 Von Karman, LLC
|
CA
|
Farmers Insurance Exchange
|
100.000
|
|
201 Railroad Ave, LLC
|
DE
|
Farmers Insurance Exchange
|
100.000
|
|
21st Century Casualty Company
|
CA
|
21st Century Insurance Group
|
100.000
|
|
21st Century Centennial Insurance Company
|
PA
|
Mid-Century Insurance Company
|
100.000
|
|
21st Century Insurance and Financial Services, Inc.
|
DE
|
Mid-Century Insurance Company
|
100.000
|
|
21st Century Insurance Company
|
CA
|
21st Century Insurance Group
|
100.000
|
|
21st Century Insurance Group
|
DE
|
Mid-Century Insurance Company
|
100.000
|
|
21st Century North America Insurance Company
|
NY
|
Mid-Century Insurance Company
|
100.000
|
|
21st Century Pinnacle Insurance Company
|
NJ
|
21st Century North America Insurance Company
|
100.000
|
|
21st Century Premier Insurance Company
|
PA
|
21st Century Centennial Insurance Company
|
100.000
|
|
2475 Mill Center Parkway, LLC
|
DE
|
Farmers Insurance Exchange
|
100.000
|
|
280 Riverside Parkway, LLC
|
DE
|
Farmers Insurance Exchange
|
100.000
|
|
3049 East Washburn Road, LLC
|
DE
|
Farmers Insurance Exchange
|
100.000
|
|
3195 East Washburn Road, LLC
|
DE
|
Farmers Insurance Exchange
|
100.000
|
|
384 Santa Trinita Ave LLC
|
DE
|
Fire Insurance Exchange
|
100.000
|
|
4345 Hamilton Mill Road, LLC
|
DE
|
Farmers Insurance Exchange
|
100.000
|
|
475 Riverside Parkway, LLC
|
DE
|
Mid-Century Insurance Company
|
100.000
|
|
6671-6675 North Macarthur Blvd, LLC
|
DE
|
Mid-Century Insurance Company
|
100.000
|
|
American Federation Insurance Company
|
TX
|
21st Century Insurance Group
|
100.000
|
|
American Pacific Insurance Company, Inc.
|
HI
|
Farmers Insurance Hawaii, Inc.
|
100.000
|
|
Bristol West Casualty Insurance Company
|
OH
|
Coast National Insurance Company
|
100.000
|
|
Bristol West Holdings, Inc.
|
DE
|
Farmers Insurance Exchange
|
42.000
|
|
Bristol West Holdings, Inc.
|
DE
|
Fire Insurance Exchange
|
3.750
|
|
Bristol West Holdings, Inc.
|
DE
|
Mid-Century Insurance Company
|
47.500
|
|
Bristol West Holdings, Inc.
|
DE
|
Truck Insurance Exchange
|
6.750
|
|
Bristol West Insurance Company
|
OH
|
Coast National Insurance Company
|
100.000
|
|
Bristol West Insurance Services of California, Inc.
|
CA
|
Bristol West Holdings, Inc.
|
100.000
|
|
Bristol West Insurance Services, Inc. of Florida
|
FL
|
Bristol West Holdings, Inc.
|
100.000
|
|
Bristol West Preferred Insurance Company
|
MI
|
Bristol West Holdings, Inc.
|
100.000
|
|
BW GP, LLC
|
DE
|
Bristol West Holdings, Inc.
|
100.000
|
|
BWIS of Nevada, Inc.
|
NV
|
Bristol West Holdings, Inc.
|
100.000
|
|
Civic Property and Casualty Company
|
CA
|
Fire Insurance Exchange
|
80.000
|
|
Civic Property and Casualty Company
|
CA
|
Truck Insurance Exchange
|
20.000
|
|
Coast National General Agency, Inc.
|
TX
|
Bristol West Holdings, Inc.
|
100.000
|
|
Coast National Holding Company
|
CA
|
Bristol West Holdings, Inc.
|
100.000
|
|
Coast National Insurance Company
|
CA
|
Coast National Holding Company
|
100.000
|
|
Economy Fire & Casualty Company
|
IL
|
Farmers Property and Casualty Insurance Company
|
100.000
|
|
Economy Preferred Insurance Company
|
IL
|
Economy Fire & Casualty Company
|
100.000
|
|
Economy Premier Assurance Company
|
IL
|
Economy Fire & Casualty Company
|
100.000
|
|
Exact Property and Casualty Company
|
CA
|
Fire Insurance Exchange
|
80.000
|
|
Exact Property and Casualty Company
|
CA
|
Truck Insurance Exchange
|
20.000
|
|
Farmers Casualty Insurance Company
|
RI
|
Farmers Property and Casualty Insurance Company
|
100.000
|
|
Farmers Direct Property and Casualty Insurance Company
|
RI
|
Farmers Property and Casualty Insurance Company
|
100.000
|
|
Farmers Financial Solutions, LLC
|
NV
|
FFS Holding, LLC
|
100.000
|
|
Farmers Group Property and Casualty Insurance Company
|
RI
|
Farmers Property and Casualty Insurance Company
|
100.000
|
|
Farmers Insurance Company of Arizona
|
AZ
|
Farmers Insurance Exchange
|
70.000
|
|
Farmers Insurance Company of Arizona
|
AZ
|
Fire Insurance Exchange
|
10.000
|
|
Farmers Insurance Company of Arizona
|
AZ
|
Truck Insurance Exchange
|
20.000
|
|
Farmers Insurance Company of Idaho
|
ID
|
Farmers Insurance Exchange
|
80.000
|
|
Farmers Insurance Company of Idaho
|
ID
|
Fire Insurance Exchange
|
6.700
|
|
Farmers Insurance Company of Idaho
|
ID
|
Truck Insurance Exchange
|
13.300
|
|
Farmers Insurance Company of Oregon
|
OR
|
Farmers Insurance Exchange
|
80.000
|
|
Farmers Insurance Company of Oregon
|
OR
|
Truck Insurance Exchange
|
20.000
|
|
Farmers Insurance Company of Washington
|
WA
|
Fire Insurance Exchange
|
80.000
|
|
Farmers Insurance Company of Washington
|
WA
|
Truck Insurance Exchange
|
20.000
|
|
Farmers Insurance Company, Inc.
|
KS
|
Farmers Insurance Exchange
|
90.000
|
|
Farmers Insurance Company, Inc.
|
KS
|
Fire Insurance Exchange
|
10.000
|
|
Farmers Insurance Exchange
|
CA
|
See Note 1
|
|
|
Farmers Insurance Hawaii, Inc.
|
HI
|
Mid-Century Insurance Company
|
100.000
|
|
Farmers Insurance of Columbus, Inc.
|
OH
|
Farmers Insurance Exchange
|
100.000
|
|
Farmers Lloyds Insurance Company of Texas
|
TX
|
See Note 12
|
|
|
Farmers Lloyds, Inc.
|
TX
|
Farmers Property and Casualty Insurance Company
|
100.000
|
|
Farmers New Century Insurance Company
|
IL
|
Illinois Farmers Insurance Company
|
100.000
|
|
Farmers Property and Casualty Insurance Company
|
RI
|
Farmers Insurance Exchange
|
80.000
|
|
Farmers Property and Casualty Insurance Company
|
RI
|
Truck Insurance Exchange
|
10.000
|
|
Farmers Property and Casualty Insurance Company
|
RI
|
Fire Insurance Exchange
|
10.000
|
|
Farmers Services Insurance Agency
|
CA
|
Truck Insurance Exchange
|
100.000
|
|
Farmers Specialty Insurance Company
|
MI
|
Foremost Insurance Company Grand Rapids, Michigan
|
100.000
|
|
Farmers Texas County Mutual Insurance Company
|
TX
|
See Note 2
|
|
|
FCOA, LLC
|
DE
|
Foremost Insurance Company Grand Rapids, Michigan
|
100.000
|
|
FFS Holding, LLC
|
|
Mid-Century Insurance Company
|
100.000
|
|
Fire Insurance Exchange
|
CA
|
See Note 3
|
|
|
Foremost County Mutual Insurance Company
|
TX
|
See Note 4
|
|
|
Foremost Insurance Company Grand Rapids, Michigan
|
MI
|
Farmers Insurance Exchange
|
80.000
|
|
Foremost Insurance Company Grand Rapids, Michigan
|
MI
|
Fire Insurance Exchange
|
10.000
|
|
Foremost Insurance Company Grand Rapids, Michigan
|
MI
|
Truck Insurance Exchange
|
10.000
|
|
Foremost Lloyds of Texas
|
TX
|
See Note 5
|
|
|
Foremost Property & Casualty Insurance Company
|
MI
|
Foremost Insurance Company Grand Rapids, Michigan
|
100.000
|
|
Foremost Signature Insurance Company
|
MI
|
Foremost Insurance Company Grand Rapids, Michigan
|
100.000
|
|
Hawaii Insurance Consultants, Ltd.
|
HI
|
Mid-Century Insurance Company
|
100.000
|
|
Illinois Farmers Insurance Company
|
IL
|
Farmers Insurance Exchange
|
100.000
|
|
Insurance Data Systems, G.P.
|
FL
|
Bristol West Holdings, Inc.
|
99.900
|
|
Insurance Data Systems, G.P.
|
FL
|
BW GP, LLC
|
0.100
|
|
MC Maple Tree, LLC
|
DE
|
Mid-Century Insurance Company
|
100.000
|
|
Mid-Century Insurance Company
|
CA
|
Farmers Insurance Exchange
|
80.000
|
|
Mid-Century Insurance Company
|
CA
|
Fire Insurance Exchange
|
10.000
|
|
Mid-Century Insurance Company
|
CA
|
Truck Insurance Exchange
|
10.000
|
|
Mid-Century Insurance Company of Texas
|
TX
|
Farmers Insurance Exchange
|
100.000
|
|
Neighborhood Spirit Property and Casualty Company
|
CA
|
Fire Insurance Exchange
|
80.000
|
|
Neighborhood Spirit Property and Casualty Company
|
CA
|
Truck Insurance Exchange
|
20.000
|
|
Northwest Distribution Center Apopka Road, LLC
|
DE
|
Farmers Insurance Exchange
|
100.000
|
|
Security National Insurance Company
|
FL
|
Bristol West Holdings, Inc.
|
100.000
|
|
Texas Farmers Insurance Company
|
TX
|
Farmers Insurance Exchange
|
86.280
|
|
Texas Farmers Insurance Company
|
TX
|
Mid Century Insurance Company
|
13.720
|
|
Toggle Insurance Company
|
DE
|
Mid-Century Insurance Company
|
100.000
|
|
Toggle Services, LLC
|
DE
|
Toggle Insurance Company
|
100.000
|
|
Truck Insurance Exchange
|
CA
|
See Note 6
|
|
Note 1: Farmers Insurance Exchange is a California “interinsurance exchange” owned by its policyholders. Its attorney-in-fact is Farmers Group, Inc, dba
Farmers Underwriters Association, which is a subsidiary of Zurich Insurance Group Ltd.
Note 2: Farmers Group Inc, as attorney-in-fact for Farmers Insurance Exchange, provides management services to Farmers Texas County Mutual Insurance
Company.
Note 3: Fire Insurance Exchange is a California “interinsurance exchange” owned by its policyholders. Its attorney-in-fact is Fire Underwriters
Association, which is a subsidiary of Zurich Insurance Group Ltd.
Note 4: Foremost County Mutual Insurance Company is a Texas County mutual insurance company managed by Foremost Insurance Company Grand Rapids, Michigan.
Note 5: Foremost Lloyds of Texas underwriters are officers and/or directors of Foremost Insurance Company Grand Rapids, Michigan.
Note 6: Truck Insurance Exchange is a California “interinsurance exchange” owned by its policyholders. Its attorney-in-fact is Truck Underwriters
Association, which is a subsidiary of Zurich Insurance Group Ltd.
Note 7: Zurich Insurance Plc operates branches in the following countries: Italy (AA-1364106), Portugal (AA-1820001), Spain (AA-1840150), and United
Kingdom (AA-1780059).
Note 8: Zurich Versicherungs-Aktiengesellschaft operates a branch in Germany (AA-1340017)
Note 9: Zurich Versicherungs-Gesellschaft AG also known as Zurich Insurance Company, Ltd operates branches in the following countries: Bermuda
(AA-3190825), Canada (AA-1560999), Hong Kong (AA-5324112), Ireland (AA-1780042), Japan (AA-1584115), and Singapore (AA-5760036). It also operates a management entity Alpina International (AA-1460010) in Switzerland.
Note 10: An affiliate entity is the attorney-in-fact of Farmers Insurance Exchange, Fire Insurance Exchange and Truck Insurance Exchange (collectively
“Exchanges”). The reporting entity’s relationship to the Exchanges, their subsidiaries, and the affiliates that they manage is classified as OTHER.
Note 11: This company is a subsidiary of Zurich Insurance Group Ltd., and is an affiliate of Farmers Group, Inc.
Note 12: Farmers Lloyds Insurance Company of Texas is a Texas company managed by Farmers Lloyds, Inc.
Zurich Insurance Group Ltd conducts its primary insurance operations in the United States through two holding companies, each operating INDEPENDENTLY with its own staff:
Zurich Holding Company of America, Inc., an entity organized under the laws of the State of Delaware
Farmers Group, Inc., an entity organized under the laws of the State of Nevada
Country Code Key (Standard USPS Codes are used for U.S. States)
|
ANO
|
Netherlands Antilles
|
DEU
|
Germany
|
|
PRT
|
Portugal
|
|
ARG
|
Argentina
|
ESP
|
Spain
|
|
RUS
|
Russian Federation
|
|
AUT
|
Austria
|
FRA
|
France
|
|
SGP
|
Singapore
|
|
AUS
|
Australia
|
GBR
|
United Kingdom
|
|
SWE
|
Sweden
|
|
BHR
|
Bahrain
|
HKG
|
Hong Kong
|
|
SWZ
|
Swaziland
|
|
BMU
|
Bermuda
|
IDN
|
Indonesia
|
|
TCA
|
Turks & Caicos
|
|
BOL
|
Bolivia
|
IRL
|
Ireland
|
|
THA
|
Thailand
|
|
BRA
|
Brazil
|
IND
|
India
|
|
TUR
|
Turkey
|
|
BHS
|
Bahamas
|
ITA
|
Italy
|
|
TWN
|
Taiwan
|
|
CAN
|
Canada
|
JPN
|
Japan
|
|
URY
|
Uruguay
|
|
CHE
|
Switzerland
|
LBN
|
Lebanon
|
|
VEN
|
Venezuela
|
|
CHL
|
Chile
|
LUX
|
Luxembourg
|
|
VGB
|
Virgin Islands
|
|
CHN
|
China
|
MLT
|
Malta
|
|
ZAF
|
South Africa
|
|
COL
|
Colombia
|
MEX
|
Mexico
|
|
|
|
|
CYM
|
Cayman Islands
|
MYS
|
Malaysia
|
|
|
|
Indemnification
Under its By-Laws, Farmers New World Life Insurance Company, to the full extent permitted by the Washington Business Corporation Act,
will indemnify any person who was or is a party to any proceeding by reason of the fact that he or she is or was a director of Farmers, as provided below.
By-Laws of Farmers New World Life Insurance Company (as amended May 27, 2015)
INDEMNIFICATION OF DIRECTORS, OFFICERS, AND EMPLOYEES
SECTION 58. Indemnification. (a) Each person who acts as a Director, Officer
or employee of the Corporation shall be indemnified by the Corporation for all sums which he or she becomes obligated to pay (including counsel fees, expenses and court costs actually and necessarily incurred by him or her) in connection with any
action, suit or proceeding in which he or she is made a party by reason of his being, or having been a Director, Officer, or employee of the Corporation, except in relation to matters as to which he or she shall be adjudged in such action, suit
or proceeding to be liable for bad faith or misconduct in the performance of his or her duties as such Director, Officer or employee, and except any sum paid to the Corporation in settlement of an action, suit or proceeding based upon bad faith
or misconduct in the performance of his or her duties.
(b) The right of indemnification in this article provided shall inure to each Director, Officer and employee of the Corporation,
whether or not he or she is such Director, Officer or employee at the time he or she shall become obligated to pay such sums, and whether or not the claim asserted against him or her is based on matters which predate the adoption of this article;
and in the event of his or her death shall extend to his or her legal representatives. Each person who shall act as a Director, Officer or employee of the Corporation shall be deemed to be doing so in reliance upon such right of indemnification;
and such right shall not be deemed exclusive of any other right to which any such person may be entitled, under any By-Law, agreement, vote of stockholders, or otherwise.
(c) The Board of Directors of the Corporation, acting at a meeting at which a majority of the quorum is unaffected by self-interest
(notwithstanding that other members of the quorum present but not voting may be so affected), shall determine the propriety and reasonableness of any indemnity claimed under this article, and such determination shall be final and conclusive. If,
however, a majority of a quorum of the Board of Directors which is unaffected by self-interest and willing to act is not obtainable, the Board of Directors in its discretion may appoint from among the stockholders who are not Directors or
Officers or employees of the Corporation, a committee of two (2) or more persons to consider and determine any such question, and the determination of such committee shall be final and conclusive.
RULE 484 UNDERTAKING
Insofar as indemnification for liability arising under the Securities Act of 1933 (the “Act”) may be permitted to directors, officers
and controlling persons of the Registrant pursuant to the foregoing provisions, or otherwise, the Registrant has been advised that in the opinion of the Securities and Exchange Commission such indemnification is against public policy as expressed
in the Act and is, therefore, unenforceable. In the event that a claim for indemnification against such liabilities (other than the payment by the Registrant of expenses incurred or paid by a director, officer or controlling person of the
Registrant in the successful defense of any action, suit or proceeding) is asserted by such director, officer or controlling person in connection with the securities being registered, the Registrant will, unless in the opinion of its counsel the
matter has been settled by controlling precedent, submit to a court of appropriate jurisdiction the question whether such indemnification by it is against public policy as expressed in the Act and will be governed by the final adjudication of
such issue.
Principal Underwriter
(a) Farmers Financial Solutions, LLC is the registrant’s principal underwriter. It is also the principal underwriter for Farmers Variable Life Separate
Account A.
(b) Officers and Directors of Farmers Financial Solutions, LLC, and their addresses, are as follows
|
Name and Principal Address
|
Positions and Officers with FFS
|
|
Janice Scott1
|
Director
|
|
Guy Meade Hanson1
|
Director
|
|
Al Gildemeister1
|
Director
|
|
Zachary Schear1
|
President
|
|
Taretha Ann Robinson1
|
Chief Compliance Officer
|
|
Joshua Alan Borkin1
|
Treasurer and Chief Financial Officer
|
|
Chau Do2
|
Secretary
|
| 1. |
The principal business address is 31051 Agoura Road, Westlake Village, CA 91361
|
| 2. |
The principal business address is 6301 Owensmouth Ave., Woodland Hills, CA 91367.
|
(c) Compensation from the Registrant. The following commissions and other compensation were received by the principal underwriter, directly or indirectly,
from the Registrant during the Registrant’s last fiscal year:
|
(1) Name of Principal Underwriter
|
(2) Net Underwriting
Discounts and Commissions |
(3) Compensation
on Redemption |
(4) Brokerage
Commissions |
(5) Compensation
|
|
|
|
|
|
|
|
Farmers Financial Solutions, LLC
|
N/A
|
N/A
|
$
5,634,276.37
|
$ 0.00
|
Location of Books and Records
All accounts and records required to be maintained by Section 31(a) of the Investment Company Act of 1940, as amended, and the
rules thereunder (including Rule 38a-1) are maintained by Farmers New World Life Insurance Company at 3120 139th Ave SE, Suite 300, Bellevue, WA 98005, and at Infosys McCamish Systems, LLC, Insurance Administrators, 3225 Cumberland Center Blvd
SE, Suite 201, Atlanta, GA 30339.
Management Services
All management contracts are discussed in Part A or Part B.
Fee Representations
Farmers New World Life Insurance Company hereby represents that the fees and charges deducted under the Policy, in the aggregate, are
reasonable in relation to the services rendered, the expenses expected to be incurred, and the risks assumed by Farmers New World Life Insurance Company.
SIGNATURES
Pursuant to the requirements of the Securities Act of 1933 and the Investment Company Act of 1940, Farmers Variable Life Separate
Account A certifies that it meets all of the requirements for effectiveness of this registration statement under rule 485(b) under the Securities Act and has duly caused this registration statement to be signed on its behalf by the undersigned,
duly authorized, in the City of Bellevue, and the State of Washington, on this 30th day of April, 2025.
|
|
FARMERS VARIABLE LIFE SEPARATE ACCOUNT
A (Registrant) |
||
|
|
|
|
|
|
Attest:
|
/s/ Ian Macleod
|
By:
|
/s/ Walter Kiceleff
|
|
|
|
|
|
|
|
Ian Macleod
|
|
Walter Kiceleff
|
|
|
Attorney-in-Fact
|
|
President
|
|
|
Security Life of Denver Insurance Company
|
|
Farmers New World Life Insurance Company
|
|
|
|
||
|
|
FARMERS NEW WORLD LIFE INSURANCE COMPANY (Depositor)
|
||
|
|
|
|
|
|
Attest:
|
/s/ Ian Macleod
|
By:
|
/s/ Walter Kiceleff
|
|
|
|
|
|
|
|
Ian Macleod
|
|
Walter Kiceleff
|
|
|
Attorney-in-Fact
|
|
President
|
|
|
Security Life of Denver Insurance Company
|
|
Farmers New World Life Insurance Company
|
Pursuant to the requirements of the Securities Act of 1933, this Post-Effective Amendment No. 19 to the registration statement has been signed by the
following persons in the capacities and on the dates indicated.
|
Signature
|
Title
|
|
|
|
|
/s/ Walter Kiceleff
|
Director, Chairman of the Board and President
|
|
Walter Kiceleff
|
|
|
|
|
|
/s/ Clay Callahan
|
Chief Financial Officer
|
|
Clay Callahan
|
|
|
|
|
|
/s/ James Levett
|
Controller
|
|
James Levett
|
|
|
|
|
|
*/s/ David Travers
|
Director
|
|
David Travers
|
|
|
|
|
|
*/s/ Scott Stoll
|
Director
|
|
Scott Stoll
|
|
|
|
|
|
*/s/ Annette Thompson
|
Director
|
|
Annette Thompson
|
|
|
|
|
|
*/s/ Warren Tucker
|
Director
|
|
Warren Tucker
|
|
|
*/s/ John Griek
|
Director
|
|
John Griek
|
|
|
|
|
|
*/s/ Ian Macleod
|
*On April 30, 2025 as Attorney-In-Fact pursuant to Powers of Attorney filed herewith or by previous amendment
|
|
* by Ian Macleod
|
|
EXHIBIT INDEX
|
Exhibit (g)(11)
|
Commutation and Release Agreement between Farmers New World Life Insurance Company and Zurich Insurance Company, Ltd. dated as of August 1, 2023.
|
|
|
|
|
Exhibit (g)(12)
|
Coinsurance and Modified Coinsurance Agreement between Farmers New World Life Insurance Company and Security Life of Denver Insurance Company effective August 1, 2023.
|
|
|
|
|
Exhibit (j)(1)
|
Power of Attorney
|
|
|
|
|
Exhibit (k)(1)
|
Opinion of Ian Macleod, Attorney-in-Fact
|
|
|
|
|
Exhibit (n)(1)
|
Consent of Independent Registered Public Accounting Firm
|
Farmers New World Life Insurance Company
(A Wholly Owned Subsidiary of Farmers Group, Inc.)
Statutory Financial Statements
December 31, 2024 and 2023 and
For the Years Ended December 31, 2024, 2023
and 2022
Farmers New World Life Insurance Company
(A Wholly Owned Subsidiary of Farmers Group, Inc.)
Index
December 31, 2024, 2023 and 2022
| Page(s) | |
|
Report of Independent Auditors
|
1 |
| Statutory Financial Statements | |
|
Statutory Statements of Admitted Assets, Liabilities and Capital and Surplus
|
2 |
|
Statutory Statements of Operations
|
3 |
|
Statutory Statements of Changes in Capital and Surplus
|
4 |
|
Statutory Statements of Cash Flows
|
5
|
|
Notes to Statutory Financial Statements
|
6-44 |

Ernst & Young LLP
55 Ivan Allen Jr. Blvd.
Suite 1000,
Atlanta, GA 30308
Report of Independent Auditors
The Board of Directors
Farmers New World Life Insurance Company
Opinion
We have audited the statutory-basis financial statements of Farmers New World Life Insurance Company (the Company), which comprise the statutory statements of admitted
assets, liabilities, and capital and surplus as of December 31, 2024 and December 31, 2023, and the related statutory statements of operations, changes in capital and surplus and cash flows for each of the three years ended December 31, 2024, and
the related notes to the financial statements (collectively referred to as the “financial statements”).
Unmodified Opinion on Statutory Basis of Accounting
In our opinion, the accompanying financial statements present fairly, in all material respects, the financial position of the Company at December 31, 2024
and December 31, 2023, and the results of its operations and its cash flows for each of the three years ended December 31, 2024, on the basis of accounting described in Note 2.
Adverse Opinion on U.S. Generally Accepted Accounting Principles
In our opinion, because of the significance of the matter described in the Basis for Adverse Opinion on U.S. Generally Accepted Accounting Principles
section of our report, the financial statements do not present fairly, in accordance with accounting principles generally accepted in the United States of America, the financial position of the Company at December 31, 2024 and December 31, 2023,
or the results of its operations or its cash flows for each of the three years ended December 31, 2024.
Basis for Opinion
We conducted our audit in accordance with auditing standards generally accepted in the United States of America (GAAS). Our responsibilities under those standards are further
described in the Auditor’s Responsibilities for the Audit of the Financial Statements section of our report. We are required to be independent of the Company and to meet our other ethical responsibilities in accordance with the relevant ethical
requirements relating to our audit. We believe that the audit evidence we have obtained is sufficient and appropriate to provide a basis for our audit opinions.
Basis for Adverse Opinion on U.S. Generally Accepted Accounting Principles
As described in Note 2 to the financial statements, the Company prepared these financial statements using accounting practices prescribed or permitted by the Washington State
Office of the Insurance Commissioner, which is a basis of accounting other than accounting principles generally accepted in the United States of America. The effects on the financial statements of the variances between these statutory accounting
practices described in Note 2 and accounting principles generally accepted in the United States of America, although not reasonably determinable, are presumed to be material and pervasive.
Responsibilities of Management for the Financial Statements
Management is responsible for the preparation and fair presentation of the financial statements in accordance with the accounting practices prescribed or
permitted by the Washington State Office of the Insurance Commissioner. Management is also responsible for the design, implementation, and maintenance of internal control relevant to the preparation and fair presentation of financial statements
that are free from material misstatement, whether due to fraud or error.
In preparing the financial statements, management is required to evaluate whether there are conditions or events, considered in the aggregate, that raise substantial doubt
about the Company's ability to continue as a going concern for one year after the date that the financial statements are issued.
Auditor’s Responsibilities for the Audit of the Financial Statements
Our objectives are to obtain reasonable assurance about whether the financial statements as a whole are free from material misstatement, whether due to
fraud or error, and to issue an auditor’s report that includes our opinion. Reasonable assurance is a high level of assurance but is not absolute assurance and therefore is not a guarantee that an audit conducted in accordance with GAAS will
always detect a material misstatement when it exists. The risk of not detecting a material misstatement resulting from fraud is higher than for one resulting from error, as fraud may involve collusion, forgery, intentional omissions,
misrepresentations, or the override of internal control. Misstatements are considered material if there is a substantial likelihood that, individually or in the aggregate, they would influence the judgment made by a reasonable user based on the
financial statements.
In performing an audit in accordance with GAAS, we:
|
•
|
Exercise professional judgment and maintain professional skepticism throughout the audit.
|
|
•
|
Identify and assess the risks of material misstatement of the financial statements, whether due to fraud or error, and design and perform audit procedures responsive to those risks.
Such procedures include examining, on a test basis, evidence regarding the amounts and disclosures in the financial statements.
|
|
•
|
Obtain an understanding of internal control relevant to the audit in order to design audit procedures that are appropriate in the circumstances, but not for the purpose of expressing
an opinion on the effectiveness of the Company’s internal control. Accordingly, no such opinion is expressed.
|
|
•
|
Evaluate the appropriateness of accounting policies used and the reasonableness of significant accounting estimates made by management, as well as evaluate the overall presentation of
the financial statements.
|
|
•
|
Conclude whether, in our judgment, there are conditions or events, considered in the aggregate, that raise substantial doubt about the Company’s ability to continue as a going concern
for a reasonable period of time.
|
We are required to communicate with those charged with governance regarding, among other matters, the planned scope and timing of the audit, significant audit findings, and
certain internal control-related matters that we identified during the audit.
April 25, 2025
1
Farmers New World Life Insurance Company
Farmers New World Life Insurance Company
(A wholly owned subsidiary of Farmers Group, Inc.)
Statutory Statements of Admitted Assets, Liabilities and Capital and Surplus
December 31, 2024 and 2023
|
(in thousands of dollars)
|
2024
|
2023
|
|
|
Admitted Assets
Bonds, at amortized cost
|
$ 546,661
|
$ 270,492
|
|
|
Investment real estate:
Properties held for the production of income, net
|
29,759
|
88,948
|
|
|
Properties held for sale, net
|
-
|
23,852
|
|
|
Cash, cash equivalents and short-term investments
|
15,660
|
258,306
|
|
|
Total cash and invested assets
|
592,080
|
641,598
|
|
|
Accrued investment income
|
5,345
|
6,331
|
|
|
Other assets
|
371,851
|
389,855
|
|
|
Current federal income tax recoverable and interest thereon
|
329
|
8,804
|
|
|
Net deferred tax asset
|
26,208
|
7,797
|
|
|
Separate accounts
|
1,422,472
|
1,244,925
|
|
|
Total admitted assets
|
$ 2,418,285
|
$ 2,299,310
|
|
|
Liabilities
Aggregate reserves for life and annuity policies
|
$ 132,832
|
$ 138,850
|
|
|
General expenses due and accrued
|
10,171
|
15,019
|
|
|
Taxes, licenses, and fees due and accrued
|
3,435
|
6,272
|
|
|
Amounts withheld or retained by company as agent or trustee
|
391
|
389
|
|
|
Amounts held for agents’ account
|
4,697
|
5,172
|
|
|
Remittances and items not allocated
|
12,112
|
13,477
|
|
|
Asset valuation reserve
|
3,922
|
11,089
|
|
|
Other liabilities
|
321,655
|
336,759
|
|
|
Separate accounts
|
1,422,472
|
1,244,925
|
|
|
Total liabilities
|
$ 1,911,687
|
$ 1,771,952
|
Capital and Surplus
Common capital stock ($1 par value, 25,000,000 shares authorized,
|
6,600,000 shares issued and outstanding December 31, 2024 and
|
|||
|
2023)
|
6,600
|
6,600
|
|
|
Gross paid-in and contributed surplus
|
3,199
|
3,199
|
|
|
Unassigned and special surplus
|
496,799
|
517,559
|
|
|
Total capital and surplus
|
506,598
|
527,358
|
|
|
Total liabilities and capital and surplus
|
$ 2,418,285
|
$ 2,299,310
|
|
The accompanying notes are an integral part of these statutory financial statements.
2
(A wholly owned subsidiary of Farmers Group, Inc.)
Statutory Statements of Operations
Years Ended December 31, 2024, 2023 and 2022
|
(in thousands of dollars)
|
2024
|
2023
|
2022
|
||
|
Revenues
|
|||||
|
Premiums and annuity considerations
|
$ -
|
$ (4,291,652)
|
$ 534,530
|
||
|
Net investment income
|
22,922
|
120,465
|
167,978
|
||
|
Amortization of interest maintenance reserve
|
(8,941)
|
(5,007)
|
1,981
|
||
|
Commissions and expense allowances on reinsurance ceded
|
217,410
|
2,701,351
|
226,752
|
||
|
Reserve adjustments on reinsurance ceded
|
-
|
4,736,464
|
-
|
||
|
Other
|
11,572
|
90,116
|
9,848
|
||
|
Total revenues
|
$ 242,963
|
$ 3,351,737
|
$ 941,089
|
||
|
Benefits and expenses
|
|||||
|
Death and other benefits
|
-
|
113,761
|
266,397
|
||
|
Surrender benefits and other fund withdrawals
|
-
|
88,983
|
139,933
|
||
|
Interest on policy or contract funds
|
-
|
6,673
|
10,385
|
||
|
Increase in aggregate reserves
|
(6,018)
|
2,741
|
21,788
|
||
|
Commissions
|
75,398
|
79,776
|
77,890
|
||
|
General insurance expenses
|
122,515
|
195,263
|
187,561
|
||
|
Taxes, licenses and fees
|
28,278
|
34,095
|
28,972
|
||
|
Increase / (decrease) in loading on
|
|||||
|
deferred and uncollected premiums
|
-
|
(65,919)
|
(427)
|
||
|
Transfers (from) / to separate accounts
|
-
|
7,964
|
29,468
|
||
|
Aggregate write-ins for deductions
|
64,936
|
1,097,940
|
2,431
|
||
|
Total benefits and expenses
|
$ 285,109
|
$ 1,561,277
|
$ 764,398
|
||
|
Net gain from operations before federal income
|
|||||
|
taxes and realized capital gains
|
(42,146)
|
1,790,460
|
176,691
|
||
|
Federal income taxes (recoverable)
|
(1,155)
|
364,454
|
37,414
|
||
|
Net gain from operations before realized capital
|
|||||
|
gains
|
(40,991)
|
1,426,006
|
139,277
|
||
|
Net realized capital gains (losses) net of taxes of
|
|||||
|
($1,256), $78,104 and ($7,968) and transfers to (from) interest
|
|||||
|
maintenance reserve of ($5), $307,280 and ($8,506)
|
|||||
|
at December 31, 2024, 2023 and 2022, respectively.
|
|||||
|
Refer to note 3 for further breakout.
|
(3,790)
|
3,688
|
(5,029)
|
||
|
Net income
|
$ (44,781)
|
$ 1,429,694
|
$ 134,248
|
The accompanying notes are an integral part of these statutory
financial statements.
3
Farmers New World Life Insurance Company
(A wholly owned subsidiary of Farmers Group, Inc.)
Statutory Statements of Changes in Capital and Surplus
December 31, 2024, 2023 and 2022
|
(in thousands of dollars)
|
Common Capital Stock
|
Gross Paid-In and Contributed
Surplus
|
Unassigned and Special Surplus
|
Total Capital and
Surplus
|
|||||||
|
Balances at December 31, 2021
|
$ 6,600
|
$ 3,199
|
$ 332,206
|
$ 342,005
|
|||||||
|
Net Income
|
-
|
-
|
134,248
|
134,248
|
|||||||
|
Change in net deferred taxes
|
-
|
-
|
7,067
|
7,067
|
|||||||
|
Change in nonadmitted assets
|
-
|
-
|
(10,002)
|
(10,002)
|
|||||||
|
Change in asset valuation reserve
|
(1,882)
|
(1,882)
|
|||||||||
|
Extraordinary dividends to stockholder
|
-
|
-
|
(152,000)
|
(152,000)
|
|||||||
|
Balances at December 31, 2022
|
6,600
|
3,199
|
309,637
|
319,436
|
|||||||
|
Net Income
|
-
|
-
|
1,429,694
|
1,429,694
|
|||||||
|
Change in net deferred taxes
|
-
|
-
|
(59,774)
|
(59,774)
|
|||||||
|
Change in nonadmitted assets
Change in liability for reinsurance in unauthorized and certified companies
|
-
-
-
|
-
-
-
|
28,618
(663)
|
28,618
- (663)
|
|||||||
|
Change in asset valuation reserve
|
25,287
|
25,287
|
|||||||||
|
Change in surplus as a result of reinsurance
|
(15,240)
|
(15,240)
|
|||||||||
|
Extraordinary dividends to stockholder
|
|
|
(1,200,000)
|
(1,200,000)
|
|||||||
|
Balances at December 31, 2023
|
6,600
|
3,199
|
517,559
|
527,358
|
|||||||
|
Net Income
|
-
|
-
|
(44,781)
|
(44,781)
|
|||||||
|
Change in net deferred taxes
|
-
|
-
|
10,140
|
10,140
|
|||||||
|
Change in nonadmitted assets
Change in liability for reinsurance in unauthorized and certified companies
|
-
-
|
-
-
|
448
663
|
448
663
|
|||||||
|
Change in asset valuation reserve
|
-
|
-
|
7,167
|
7,167
|
|||||||
|
Aggregate write-ins for gains and losses in surplus
|
-
|
-
|
5,603
|
5,603
|
|||||||
|
Balances at December 31, 2024
|
$
|
6,600
|
$
|
3,199
|
$
|
496,799
|
$
|
506,598
|
|||
The accompanying notes are an integral part of these statutory
financial statements.
4
Farmers New World Life Insurance Company
(A wholly owned subsidiary of Farmers Group, Inc.)
Statutory Statements of Cash Flows
For the Years Ended December 31, 2024, 2023 and 2022
|
(in thousands of dollars)
|
2024
|
2023
|
2022
|
||
|
Cash from operations
Premiums collected net of reinsurance
|
$ -
|
$ (4,144,126)
|
$ 538,166
|
||
|
Net investment income
|
25,772
|
148,397
|
175,578
|
||
|
Miscellaneous income
|
120,282
|
2,791,467
|
236,600
|
||
|
Cash provided by operating activities
|
146,054
|
(1,204,262)
|
950,344
|
||
|
Benefits and loss related payments
|
(1,050)
|
(1,151,622)
|
412,846
|
||
|
Net transfers (from) / to separate accounts
|
-
|
(21,996)
|
11,693
|
||
|
Commissions, expenses paid and write-ins
|
295,882
|
1,173,612
|
284,647
|
||
|
Federal and foreign income taxes paid
|
(8,375)
|
295,755
|
43,583
|
||
|
Cash used in operating activities
|
286,457
|
295,749
|
752,769
|
||
|
Net cash from operations
|
(140,403)
|
(1,500,011)
|
197,575
|
Cash from investments
Proceeds from investments sold, matured or repaid
|
Bonds
|
105,863
|
3,365,707
|
746,850
|
||
|
Mortgage loans
|
-
|
424,442
|
48,141
|
||
|
Real estate
|
78,955
|
34,062
|
-
|
||
|
Other invested assets
|
-
|
-
|
100,000
|
||
|
Net gains on cash, cash equivalents and short-term
|
|||||
|
investments
|
1
|
-
|
-
|
||
|
Miscellaneous proceeds
|
-
|
1,327
|
2,215
|
||
|
Cash provided by investing activities
|
184,819
|
3,825,538
|
897,206
|
||
|
ost of investments acquired (long-term only):
Bonds 381,460 896,387 729,228
|
|||||
|
Mortgage loans
|
-
|
-
|
32,250
|
||
|
Real estate
|
553
|
997
|
26,172
|
||
|
Miscellaneous applications
|
-
|
-
|
3,046
|
||
|
Cash paid for investing activities
|
382,013
|
897,384
|
790,696
|
||
|
Net (decrease) / increase in contract loans and
|
|||||
|
premium notes
|
-
|
(272,112)
|
(1,316)
|
||
|
Net cash provided by / (used in) investments
|
(197,194)
|
3,200,266
|
107,826
|
||
Cash from financing and miscellaneous sources
Net (withdrawals) / deposits on deposit-type contracts
|
and other insurance liabilities
|
-
|
(323,142)
|
20,978
|
||
|
Dividends to stockholder
|
-
|
(1,200,000)
|
(152,000)
|
||
|
Other cash (applied) / provided
|
94,951
|
(144,816)
|
6,447
|
||
|
Net cash used by financing and
miscellaneous sources
|
94,951
|
(1,667,958)
|
(124,575)
|
||
|
Net change in cash, cash equivalents and
short-term investments
|
(242,646)
|
32,297
|
180,826
|
Cash, cash equivalents and short-term investments
|
Beginning of year
|
258,306
|
226,009
|
45,183
|
||
|
End of year
|
$ 15,660
|
$ 258,306
|
$ 226,009
|
The accompanying notes are an integral part of these statutory financial statements.
5
Farmers New World Life Insurance Company
(A wholly owned subsidiary of Farmers Group, Inc.)
Notes to Statutory Financial Statements
For the Years Ended December 31, 2024, 2023 and 2022
1. Nature of Operations
The Company
The accompanying financial statements include the accounts of Farmers New World Life Insurance Company (the “Company”), a wholly owned subsidiary of Farmers Group,
Inc. (“FGI”), whose ultimate parent is Zurich Insurance Group Ltd (“ZIG”). FGI has attorney-in-fact relationships with three inter- insurance exchanges: Farmers Insurance Exchange, Fire Insurance Exchange, and Truck Insurance Exchange (the
“Exchanges”).
The Company is a stock life insurance company domiciled in the state of Washington and is subject to regulation by the Washington State Office of the Insurance
Commissioner (“OIC”). It is also subject to regulation by the states in which it transacts business.
Nature of Operations
The Company concentrates its sales activities in the individual life insurance markets. Principal lines of business include traditional term and whole life products
as well as indexed universal life products.
The Company and the Exchanges operate using federally registered trade names, including Farmers Insurance Group of Companies, Farmers Insurance Group, Farmers,
Farmers New World Life and Farmers Life. The Company and the Exchanges distribute their respective insurance products through a common network of direct writing agents and district managers. Each agent is required to first submit business
to the insurers in the Farmers Insurance Group of Companies within the classes and lines of business written by such insurers. The Company is currently licensed in 49 states and the District of Columbia.
Business Risks
The Company operates in a business environment that is subject to various risks and uncertainties, including but not limited to, mortality risk, market risk,
interest rate risk and legal and regulatory changes. The Company is subject to various state and federal regulatory authorities. The potential exists for changes in regulatory initiatives that could result in additional, unanticipated
expenses to the Company.
Existing federal laws and regulations affect the taxation of life insurance products and insurance companies. There can be no assurance as to what, if any, future
legislation might be enacted, or if enacted, whether such legislation would include provisions with possible negative effects on the Company’s life, accident and health or annuity products.
2. Summary of Significant Accounting Policies
Basis of Presentation
The financial statements have been prepared in conformity with accounting practices prescribed or
permitted by the OIC.
The OIC only recognizes statutory accounting practices prescribed or permitted by the State of Washington for reporting the financial condition and results of
operations of an insurance company for the purposes of determining its compliance with the Washington Insurance Law. The National Association of Insurance Commissioners’ (“NAIC”) Accounting Practices and Procedures Manual (“AIC SAP”) has
been adopted as a component of prescribed or permitted practices by the State of Washington. The Commissioner of Insurance of the OIC has the power to permit other specific practices that may deviate from prescribed practices. The Company
did not use any permitted practices that differed from NAIC statutory accounting practices (SAP) as of December 31, 2024.
6
Farmers New World Life Insurance Company
(A wholly owned subsidiary of Farmers Group, Inc.)
Notes to Statutory Financial Statements
For the Years Ended December 31, 2024, 2023 and 2022
For the December 31, 2023 reporting period, The Company received approval for a permitted practice from the OIC to fully amortize the reinsurance gains the
Company was holding in special surplus. As illustrated in Appendix 791 on life and health reinsurance agreements, the after-tax gains from a reinsurance transaction are to be amortized over the profits that emerge on the reinsured block
of business with a corresponding decrease in special surplus. This permitted practice differs from this accounting practice by allowing the Company to fully recognize the $1.6B of special surplus immediately through line 6 of page 4 with
a zero net impact on overall surplus as noted in the table below. The Company’s risk-based capital would not have triggered any regulatory event in the absence of this permitted practice and this permitted practice is only allowed for the
year-end 2023 reporting period.
|
|
SSAP
|
F/S Page
|
F/S Line
|
2024
|
2023
|
|
(1) Net Income, state basis (page 4, Line 35,
Columns 1 & 2)
|
|
|
|
($44,780,776)
|
$1,429,693,992
|
|
|
|
|
|
|
|
|
(2) State Prescribed Practices that increase/(decrease)
NAIC SAP
|
|
|
|
-
|
-
|
|
|
|
|
|
|
|
|
(3) State Permitted Practices that increase/(decrease)
NAIC SAP
|
61R
|
Pg 4
Summary of Operations
|
6-Commissions and expense allowances on reinsurance ceded
|
-
|
1,570,179,316
|
|
|
|
|
|
|
|
|
(4) Net Income, NAIC SAP
(1-2=3)
|
|
|
|
($44,780,776)
|
(140,485,324)
|
|
|
|
|
|
|
|
|
(5) Statutory surplus, state basis (Page 3, Line 38,
Columns 1 & 2)
|
|
|
|
$506,598,024
|
$527,358,275
|
|
|
|
|
|
|
|
|
(6) State Prescribed Practices that increase/(decrease)
NAIC SAP
|
61R
|
Pg 3
Liabilities, Surplus & Other funds
|
34 - Aggregate write-ins for special surplus funds
|
-
|
(1,570,179,316)
|
|
|
|
|
|
|
|
|
(7) State Permitted Practices that increase/(decrease)
NAIC SAP
|
61R
|
Pg 3
Liabilities, Surplus & Other funds
|
34 - Aggregate write-ins for special surplus funds
|
-
|
1,570,179,316
|
|
|
|
|
|
|
|
|
(8) Statutory Surplus,
NAIC SAP (5-6-7=8)
|
|
|
|
$506,598,024
|
$527,358,275
|
The effects on the financial statements of the variances between statutory basis of accounting and accounting principles generally accepted in the United States
of America, although not reasonably determinable, are presumed to be material. Statutory accounting practices differ from Generally Accepted Accounting Principles (“GAAP”) in the following respects (italicized items):
Investments
Investments in bonds are stated at amortized cost or at values required by the NAIC. Under GAAP, bonds are carried at fair value or amortized cost based upon
management’s intent as to whether bonds are available for sale, will be held until maturity or are available for trading.
7
Farmers New World Life Insurance Company
(A wholly owned subsidiary of Farmers Group, Inc.)
Notes to Statutory Financial Statements
For the Years Ended December 31, 2024, 2023 and 2022
Asset Valuation Reserve
The asset valuation reserve (“AVR”) is determined by NAIC prescribed formulas, which establish a provision for the risk of asset defaults and is reported as a
liability with changes recorded directly to unassigned surplus. Under GAAP, no such liability is established.
Interest Maintenance Reserve
An interest maintenance reserve (“IMR”) is provided as required by the NAIC in order to defer certain realized investment gains and losses, net of tax, related to
interest rate fluctuations, and to amortize such gains and losses through operating income over the remaining life of the securities sold. Any net unamortized deferred losses are non-admitted and charged directly to unassigned surplus.
Reporting entities are permitted to admit its negative IMR up to 10% of the Company’s adjusted capital and surplus. The Company elected to fully admit its negative IMR balance of $26,754,000 and $35,700,000 as of December 31, 2024 and
2023, respectively. Fixed income investments generating IMR losses comply with the reporting entity’s documented investment or liability management policies. Asset sales that were generating admitted negative IMR were not compelled by
liquidity pressures. The admitted negative IMR is reported in other assets section of the Statement of Admitted Assets. No such reserve is required by GAAP.
Life Policy and Contract Reserves
Life policy, annuity and contract reserves under statutory accounting practices are based on statutory mortality, morbidity, and interest requirements without
consideration of withdrawals and Company experience, unless annual asset adequacy analysis reveals the need to hold reserves in excess of the normal statutory reserves. One exception to this relates to deficiency reserves for certain term
insurance plans issued on or after January 1, 2000, while another relates to Principles-Based Valuation for Life Products as required under VM-20 for plans issued on or after January 1, 2017 and for Variable Annuity products as required
under VM-21. A third exception is the reserve held in accordance with SSAP A-791 Paragraph 2 due to reinsurance expense allowances not being sufficient to cover anticipated allocable direct renewal expenses. All three exceptions are
mentioned in the Aggregate Reserves for Life and Annuity Policies section below.
Acquisition Costs
Under statutory accounting practices, costs of acquiring new business are charged to operations in the year such costs are incurred. Under GAAP, costs related to
the successful acquisition of new business are deferred and amortized over the premium paying period of the policies for traditional products, or as a level percentage of gross profits for interest sensitive products.
Recognition of Revenue and Related Expenses
Under statutory accounting practices, life premiums are recognized as income over the premium-paying period of the related policies. Annuity considerations are
recognized as revenue when received. Accident and health premiums are earned ratably over the terms of the related insurance policies or reinsurance contracts. Deposits received on contracts that do not incorporate policyholder mortality
or morbidity risks are recorded directly to liability for deposit-type contracts. Interest credited to deposit-type contracts is recorded as an expense in the statement of operations when earned under the terms of the contract.
Expenses incurred in connection with acquisition of new insurance business, including acquisition costs such as sales commissions, are expensed as incurred in the
statement of operations. Under statutory accounting practices, deferred premiums, representing gross premiums less loading, are reported as an admitted asset.
8
Farmers New World Life Insurance Company
(A wholly owned subsidiary of Farmers Group, Inc.)
Notes to Statutory Financial Statements
For the Years Ended December 31, 2024, 2023 and 2022
For GAAP purposes, premiums for traditional life insurance products, which include those products with fixed and guaranteed premiums and benefits and consist principally of whole and term life insurance policies, are recognized as
revenues when due. Under GAAP, revenues for universal life insurance policies and for investment products consist of policy charges for the cost of insurance, policy administration charges, and surrender charges assessed against
policyholder account balances, benefit claims incurred in excess of policy account balances and commissions and expense allowances on reinsurance assumed. Revenues also include commissions and expense allowances on reinsurance ceded. Under
GAAP, uncollected premiums are stated at gross amounts and deferred premiums are reflected as a reduction of the related aggregate reserve.
Reinsurance
Under statutory accounting practices, ceded reserves are netted with direct reserves within the aggregate reserve lines of the liabilities page. Reinsurance recoverable on unpaid claims on reinsured business are netted in aggregate with
the liability for contract claims line. Under GAAP, these reinsurance amounts are reflected as assets.
Under statutory accounting practices, reinsured commissions are reported with expense allowance within the revenue section of the summary of operations. Under GAAP, reinsured
commissions are netted against direct commissions within expenses.
Federal Income Taxes
Under statutory accounting practices, deferred income taxes are provided for temporary differences between the financial statement and tax bases of assets and liabilities at the end of each year based on enacted tax rates. Deferred
income tax assets are reduced by a valuation allowance if it is more likely than not some portion or all of the deferred tax assets will not be realized. In addition to a valuation allowance, statutory accounting limits deferred tax assets
to their admissible amount according to a prescribed formula. Changes in deferred income tax assets and liabilities are reported as adjustments to surplus. Under GAAP, changes in deferred income taxes are included in income tax expense or
benefit and are allocated to continuing operations, discontinued operations, extraordinary items and items charged directly to shareholders equity consistently with the pre-tax income item to which they relate.
Nonadmitted Assets
Under statutory accounting practices, assets are reported at admitted assets values and nonadmitted assets are excluded through a charge against surplus, because there are no nonadmitted assets for GAAP purposes, the nonadmitted balances
of these assets are included in the balance sheet.
Nonadmitted assets, such as electronic data processing equipment and software, furniture and equipment, receivables over 90 days past due and certain deferred tax assets, are considered nonadmitted assets for statutory purposes as they
may not be fully realizable at their carrying values in a liquidation scenario and, therefore, these nonadmitted assets and any changes in such assets are charged directly to unassigned surplus. As of December 31, 2024 and 2023 the total
nonadmitted assets are $68,897,000 and $69,345,000, respectively.
Separate Accounts
Separate accounts assets are carried at fair value. Separate accounts liabilities represent the contract holders’ claims to the related assets. Investment income and realized capital gains and losses of the separate accounts accrue
directly to the contract holders and, therefore, are not included in the Company’s statutory basis statements of operations. Under GAAP these investment amounts and resulting changes in separate account liabilities are shown net of
applicable fees. Mortality, policy administration, and surrender charges to all accounts are included in the revenues of the Company and do not differ from GAAP.
9
Farmers New World Life Insurance Company
(A wholly owned subsidiary of Farmers Group, Inc.)
Notes to Statutory Financial Statements
For the Years Ended December 31, 2024, 2023 and 2022
The Company is licensed to issue variable universal life (“VUL”) and deferred variable annuity contracts although it suspended issuance of “new” VUL and variable annuities, effective February 28, 2024 and September 30, 2012, respectively.
The assets and liabilities held for VUL, Farmers EssentialLife VUL, Life Accumulator VUL and deferred variable annuity contracts are held in the Separate Accounts (the “Accounts”), which are legally segregated from the general assets of the
Company.
Please see Note 13 for additional information on separate accounts.
Statements of Cash Flows
The statutory basis statement of cash flows is presented as required under statutory accounting principles and differs in certain respects from the GAAP presentation.
Use of Estimates
The preparation of financial statements in conformity with accounting practices prescribed or permitted by the OIC requires management to make estimates and assumptions that affect the reported amounts of assets and liabilities and
disclosure of contingent assets and liabilities at the date of the financial statements and the reported amounts of revenues and expenses during the reporting period. Actual results could differ from those estimates.
Aggregate Reserves for Life and Annuity Policies
Life reserves are based on mortality tables approved by the NAIC using statutory specified interest rates and valuation methods that provide, in the aggregate, reserves that are greater than or equal to the minimum required by the OIC.
|
•
|
Reserves for life insurance are based on the American Experience, 1941, 1958, 1980, 2001, or 2017 Commissioner’s Standard Ordinary (“CSO”) and Commissioners Extended Term (“CET”) mortality tables with interest rates from 0.00% to
5.50%. For certain term insurance plans issued on or after January 1, 2000, the Company calculates deficiency reserves using valuation mortality rates representative of actual Company experience, as permitted by the Valuation of Life
Insurance Policies Model Regulation of the NAIC. For term life insurance policies issued on or after January 1, 2017 and all other life insurance policies issued after January 1, 2020, the Company calculates Principles- Based Reserves
using Company experience, as required in VM-20. There is an exception for some plans that pass the exclusion tests as defined in VM-20. Additionally, a reserve is held per SSAP A- 791 Paragraph 2 due to reinsurance expense allowances
not being sufficient to cover anticipated allocable direct renewal expenses; this calculation uses Company experience.
|
|
•
|
Reserves for fixed deferred annuities are based on 1971 Individual Annuity Mortality (“IAM”), 1983 Table A, Annuity 2000, or 2012 IAR mortality tables with interest rates from 3.50% to 6.00%.
|
|
•
|
For variable deferred annuities, the Company calculates Principles-Based Reserves using Company experience, as required in VM-21.
|
|
•
|
Reserves for equity-indexed annuities are based on 1983 Table A or Annuity 2000 mortality tables with interest rates from 4.50% to 5.50%.
|
|
•
|
Reserves for immediate annuity contracts, other than structured settlements, are based on the Annuity Table for 1949, 1971 IAM, 1983 Table A, Annuity 2000, or 2012 IAR mortality tables with interest rates from 1.75% to 5.25%. For
immediate annuities issued on or after January 1, 2018, the Company uses valuation interest rates as prescribed in VM-22.
|
|
•
|
Reserves for structured settlement annuities are based on the 1983 Table A mortality table with interest rates from 4.75% to 7.00%. The reserves held for structured settlement annuity contracts with a substandard rating are based
on a rated age approach and are compliant with the approach specified by Actuarial Guideline 9A of the NAIC.
|
10
Farmers New World Life Insurance Company
(A wholly owned subsidiary of Farmers Group, Inc.)
Notes to Statutory Financial Statements
For the Years Ended December 31, 2024, 2023 and 2022
The Company waives deduction of deferred fractional premiums upon the death of the insured. For all plans, with the exception of its universal life plans, any portion of the final premium beyond the month of death is returned. For universal
life plans, premiums beyond the date of death are not refunded. Surrender values are not promised in excess of the legally computed reserves.
For certain universal life policies, reserves for substandard lives are not separately identified and are calculated in the aggregate. For all other life policies, substandard lives are charged an extra premium plus the regular gross premium
for the rated issue age. For the Farmers Level Term 2000 plan group, the Farmers Value Term group, and Farmers Term Life, the reserve is the standard interpolated terminal reserve at the rated age, plus the regular net unearned premium reserve
at the rated age, plus an additional gross unearned premium reserve using the substandard extra premium charge for the premium payment mode. For all other plan groups, mean reserves are determined by computing the regular mean reserve for the
plan at the rated age and holding, in addition, a substandard reserve of one-half of the annualized substandard extra premium charge. The reserves held for structured settlement annuity contracts with a substandard rating are based on a rated
age approach.
As of December 31, 2024, and 2023, the Company had approximately $2,480,603,000 and $2,510,460,000 respectively, of insurance in force for which the gross premiums are less than the net premiums according to the standard valuation set by the
OIC. The premiums deficiency reserve amount is
$12,873,000 before reinsurance and $0 after reinsurance. Company does not utilize anticipated investment income as a factor in the premium deficiency calculation.
As of December 31, 2024, and 2023, the total in force for which VM-20 deterministic/stochastic reserves are calculated are $106,525,819,000 and $97,338,114,000 respectively. The excess VM- 20 deterministic/stochastic reserve over NPR after
reinsurance are $112,118,000 for 2024 and
$117,026,000 for 2023.
As of December 31, 2024, and 2023, the reserves required by SSAP A-791 Paragraph 2 due to insufficient reinsurance expense allowances are $19,421,000 and $20,229,000 respectively.
For tabular interest on annuities involving life contingencies, the tabular less actual reserve released, and the tabular cost have been determined by formula. For annuities and other deposits not involving life contingencies the tabular
interest was determined by one of the following methods: 1) serially using the actual interest credited to funds on deposit for the year, or 2) estimated in the aggregate from the beginning and the ending balances, assuming a uniform
distribution of cash flows during the year, and the average statutory valuation interest rate.
Excess of Minimum Reserves
As of December 31, 2024, the only life insurance plan written after January 1, 2001 for which the statutory reserve basis is specifically selected to be more conservative than specified in Appendix A-820 is the Farmers Graded Death Benefit
Whole Life product (FGDBWL). The mortality assumption used in the statutory reserve calculation is the 1980 CSO ALB Ultimate mortality, rather than the 2001 CSO ALB Select & Ultimate mortality; and the 2017 GI ALB Ultimate mortality, rather
than the 2017 CSO ALB Select & Ultimate mortality.
As of December 31, 2024, the FGDBWL statutory reserves net of deferred and uncollected premiums is $31,329,000. If they had instead been calculated using 2001 CSO ALB Select & Ultimate mortality and 2017 CSO ALB Select & Ultimate
mortality, the amount would be $28,259,000 or $3,070,000 lower.
11
Farmers New World Life Insurance Company
(A wholly owned subsidiary of Farmers Group, Inc.)
Notes to Statutory Financial Statements
For the Years Ended December 31, 2024, 2023 and 2022
To comply with VM-20 Section 3.C.1.g, scalars are applied to the valuation mortality for standard non- smoker classes of the following plans: Farmers Term Life –
135% for Male, 120% for Female; Farmers Value Term – 120% for Male, 110% for Female; Farmers Essential Life Universal Life and Farmers Index Universal Life – 120% for Male and Female. A 140% scalar is applied for all classes of FESWL. An
additional 125% scalar is applied to the valuation mortality for all FVT policies that used accelerated underwriting. A 120% scalar is applied for the Male standard non-smoker class of VUL, Female non- smokers have no additional scalar. An
additional 130% scalar is applied for conversion policies. Scaled mortality rates are capped at 1,000 per unit. All classes of Simple Term have a scalar of 200% applied to valuation mortality for Male and Female, capped at the 2017 CSO GI
(Loaded) Ultimate rates.
Unpaid Loss/Claim Adjustment Expenses
The Company accrues an operating expense for the cost of settling benefit claims incurred in the current period, with settlement in future periods. The estimate is
based upon the time duration of expected transactions and the total expected costs of settlement, including overhead expenses for each transaction. The balance in the liability for the unpaid loss/claim adjustment expense as of December 31,
2024 and 2023 was approximately $230,000 and $298,000, respectively.
Reinsurance
Premiums, commissions, expense reimbursements, benefits and reserves related to reinsured business are accounted for on bases consistent with those used in
accounting for the original policies issued and the terms of the reinsurance contracts. Premiums ceded to other companies have been reported as a reduction of premium income. Commissions ceded to other companies have been reported as income
with the expense allowance in the revenue section of the summary of operation. Amounts applicable to reinsurance ceded for future policy benefits, unearned premium reserves and claim liabilities have been reported as reductions of these
items.
Investments
Investments are valued as prescribed by the NAIC and as required by the OIC. Security transactions are recorded on a trade date basis and private placements are
recorded on a funding date basis. Investments are recorded on the following bases:
|
•
|
Bonds–at amortized cost. Bonds with NAIC designations of 6 are carried at the lower of amortized cost or fair value. Discount or premium on bonds is amortized using the interest method on a prospective basis. A yield to worst
amortization method is used to take into consideration any bond call or sinking fund feature. Loan-backed securities are amortized using the interest method including anticipated prepayments at the date of purchase. Prepayment
assumptions are obtained from broker dealer surveys or internal estimates and are based on the current interest rate and economic environment. Significant changes in estimated cash flows from the original purchase assumptions are
accounted for using the prospective method.
|
|
•
|
Unaffiliated common stocks- at fair value. In determining the estimated fair value disclosed for these securities, management obtained quotations from independent sources, generally pricing services.
|
|
•
|
Mortgage loans– at the aggregate unpaid balance less allowance for uncollectible amounts. The Company measures impaired loans based on the present value of expected future cash flows discounted at the loan’s effective interest
rate or estimated, at the loan’s observable market price or the fair value of the collateral, if the loan is collateral dependent. Interest income on impaired loans would be recognized to the extent the borrower is currently
paying interest according to their contractual obligation. Any future cash receipts will be identified as either reductions of principal or interest income depending on the facts and circumstances of the individual loan’s
investment and the risk profile of the collateral.
|
12
Farmers New World Life Insurance Company
(A wholly owned subsidiary of Farmers Group, Inc.)
Notes to Statutory Financial Statements
For the Years Ended December 31, 2024, 2023 and 2022
|
•
|
Real estate, including related improvements–at the depreciated historical cost or market if impaired. This invested asset is comprised of the following classifications: held for production of income, held for own use, and held
for sale. Depreciation is computed on a straight-line basis over the estimated useful life of the acquired assets. Independent appraisals are obtained at least every three years on investment held for production of income and held
for sale; if fair value is less than book value and the amount is deemed non-recoverable, an impairment loss is recognized. These properties are accounted for under NAIC Statement of Statutory Accounting Principles (“SSAP”) 40R.
|
|
•
|
Contract loans–at unpaid balances, not in excess of policy cash surrender value.
|
|
•
|
Other invested assets, Surplus Notes – at amortized cost. This is in accordance with SSAP 41R, Surplus Notes
|
|
•
|
Short-term investments – at cost or amortized cost.
|
Realized gains and losses on sales of investments, recognized in the statement of operations, are determined based on the sale price, and carrying value of the
specific security.
Changes in interest rates have a direct, inverse impact on the fair value of fixed income investments. It is reasonably possible that changes in interest rates will
occur in the near term and could, as a result of such changes, have a material impact on the fair value of fixed income investments. If a decline in the fair value of an individual investment, except for loan-backed securities, is
considered to be other-than-temporary, the difference between amortized book value or original cost and fair value is recorded as a realized investment loss. If the fair value of loan‑backed securities declines below its amortized cost
basis, the Company determines whether the decline is other-than-temporary. Loan-backed securities with evidence of deterioration of credit quality and for which it is probable that the Company will be unable to collect all contractually
required payments receivable, are written down to the present value of cash flows expected to be received.
Accrued Investment Income
Investment income due and accrued with amounts over 90 days past due are nonadmitted.
Federal Income Taxes
The Company has applied the SSAP No. 101, “Income Taxes.” Income tax incurred is recognized by applying the enacted income tax law. Deferred income taxes are
provided for temporary differences between the financial statement and tax bases of assets and liabilities at the end of each year based on enacted tax rates. Changes in admitted deferred income tax assets and liabilities are recognized as
adjustments to surplus. Deferred tax assets are first subjected to a valuation allowance assessment and then are admitted to the extent they meet specific criteria but are limited to the amount of gross deferred tax assets expected to be
reversed within a limited time period and are limited to a percentage of adjusted capital and surplus. The reversal and surplus limitation parameters in the admission tests are determined based on the risk-based capital levels.
13
Farmers New World Life Insurance Company
(A wholly owned subsidiary of Farmers Group, Inc.)
Notes to Statutory Financial Statements
For the Years Ended December 31, 2024, 2023 and 2022
Leases
The Company has long-term lease commitments with options to renew at the end of the lease periods. Operating lease payments are charged to the income statement in the
period in which they are incurred. See Note 12 for additional information on lease commitments.
Death, Disability and Other Benefits
Death and disability benefits represent the estimated ultimate net cost of all reported and unreported claims incurred through year end. Such estimates are based on
projections applied to historical claim payment data.
Electronic Data Processing Equipment
Depreciation on electronic data processing equipment, a non-admitted asset, is calculated using the straight-line basis over 3 years. Gross electronic data processing
equipment, accumulated depreciation and net admitted assets of EDP for December 31, 2024 and 2023 are as follows:
(in thousands of dollars)
|
2024
|
2023
|
|
|
Gross EDP Equipment
|
$ 1,276
|
$ 1,253
|
|
Accumulated Depreciation
|
(1,256)
|
(1,253)
|
|
Net EDP
|
20
|
-
|
|
Non-Admitted EDP
|
(20)
|
-
|
|
Net Admitted EDP
|
$ -
|
$ -
|
Depreciation expense on electronic data processing equipment assets was $3,000, $251,000, $251,000 and for the year ended December 31, 2024, 2023 and 2022,
respectively, and has been included in general insurance expenses.
Financial Instruments and Concentrations of Credit Risk
The Company’s financial instruments that are exposed to concentrations of credit risk consist primarily of cash, investments, and reinsurance receivables and
payables.
The Company cedes insurance risk to various reinsurance companies that have low default risk based on different rating agencies risk assessments. The Company’s
management reviews the financial strength of its reinsurers at the inception of a reinsurance contract and periodically thereafter for the purpose of assessing the financial ability of the reinsurers to perform. Management believes that its
reinsurers have the financial strength to perform on their financial obligations.
The Company places its cash with high credit quality institutions. At times, such amounts may be in excess of the FDIC insurance limits. Management believes that risk
with respect to these balances is minimal, due to the high credit quality of the depositories.
The Company invests in high quality securities with no significant concentration of risk.
Accounting Changes and Corrections of Errors
At March 31, 2024, the Company included a SSAP No. 3 Accounting Changes and Corrections of Errors adjustment on page 4 Line 5301 Column 1 in the amount of $5,602,000
net of tax to correct a prior year error in the calculation of Commissions.
14
Farmers New World Life Insurance Company
(A wholly owned subsidiary of Farmers Group, Inc.)
Notes to Statutory Financial Statements
For the Years Ended December 31, 2024, 2023 and 2022
Change in Valuation Basis
There were no changes in reserve valuation basis for 2024.
Statements of Cash Flows
For purposes of the statement of cash flows the following are included: cash, cash equivalents and short- term investments. Short-term investments consist
principally of money market funds with remaining maturities at date of purchase of 12 months or less.
3. Investments
The components of investment income by type of investment for the years ended December 31, 2024, 2023 and 2022 are as follows:
|
(in thousands of dollars)
|
2024
|
2023
|
2022
|
||
|
Bonds
|
$ 20,034
|
$ 63,318
|
$ 130,292
|
||
|
Mortgage loans
|
-
|
15,433
|
19,078
|
||
|
Investment real estate
|
5,968
|
11,297
|
11,348
|
||
|
Contract loans
|
-
|
9,915
|
17,010
|
||
|
Short-term investments
|
5,245
|
40,351
|
2,394
|
||
|
Other
|
262
|
1,033
|
3,880
|
||
|
Gross investment income
|
31,509
|
141,347
|
184,002
|
||
|
Less: Investment expenses
|
(8,587)
|
(20,882)
|
(16,024)
|
||
|
Net investment income
|
$ 22,922
|
$ 120,465
|
$ 167,978
|
||
Investment expenses included the following fees paid to the Company’s various affiliated investment managers:
In 2024, 2023 and 2022, the Company’s investment expense included fees of approximately $234,000,
$353,000 and $344,000, respectively, to its Parent Company, FGI.
In 2024, 2023 and 2022, the Company’s investment expenses included fees of approximately $51,000,
$331,000 and $360,000, respectively, to Zurich Investment Services.
In 2024, 2023 and 2022, the Company’s investment expenses included fees of approximately
$1,930,000, $2,315,000, $2,429,000, respectively, to Zurich Global Investment Management.
In 2024, 2023 and 2022, the Company’s investment expenses included fees of approximately $521,000,
$713,000 and $505,000, respectively, to Zurich Alternative Asset Management.
Interest Income Due and Accrued
The gross, non-admitted and admitted amounts for interest income due and accrued as of December 31, 2024, 2023 and 2022 are as follows:
|
(in thousands of dollars)
|
|||||
|
2024
|
2023
|
2022
|
|||
|
Gross
|
$ 5,349
|
$ 6,362
|
$ 30,613
|
||
|
Nonadmitted
|
(4)
|
(31)
|
(39)
|
||
|
Admitted
|
$ 5,345
|
$ 6,331
|
$ 30,574
|
||
15
Farmers New World Life Insurance Company
(A wholly owned subsidiary of Farmers Group, Inc.)
Notes to Statutory Financial Statements
For the Years Ended December 31, 2024, 2023 and 2022
Realized Gains and Losses
Realized gains and losses on sales, redemptions and impairments of investments are determined based on the actual cost of the securities. Realized investment
gains and losses for the years ended December 31, 2024, 2023 and 2022 are as follows:
|
(in thousands of dollars)
|
2024
|
2023
|
2022
|
||
|
Bonds
|
$ 5
|
$ (296,820)
|
$ 11,445
|
||
|
Short-term investments
|
1
|
8,271
|
-
|
||
|
Investment real estate
|
(2,535)
|
||||
|
Mortgage Loans
|
-
|
(93,147)
|
-
|
||
|
(2,529)
|
(381,696)
|
11,445
|
|||
|
Transfer to(from) interest maintenance reserve
|
(5)
|
307,280
|
(8,506)
|
||
|
Add: Tax expense on net realized gains
|
(1,256)
|
78,104
|
(7,968)
|
||
|
Net realized gains
|
$ (3,790)
|
$ 3,688
|
$ (5,029)
|
Impairment losses included in realized gains and losses above were $17,217,000, $3,445,000 and
$4,000 for the years ended December 31, 2024, 2023 and 2022, respectively.
Unrealized Gains and Losses on Fixed Maturities
Amortized cost, gross unrealized gains, gross unrealized losses, fair value of fixed maturities and equity securities as of December 31, 2024 and 2023 are as
follows:
|
2024
|
|||||||
|
Gross
|
Gross
|
||||||
|
Amortized
|
Unrealized
|
Unrealized
|
Fair
|
||||
|
(in thousands of dollars)
|
Cost
|
Gains
|
Losses
|
Value
|
|||
|
Fixed Maturities
U.S. governments
|
$ 125,094
|
$ 348
|
$
|
(3,158)
|
$ 122,284
|
||
|
Political subdivisions
|
500
|
-
|
(78)
|
422
|
|||
|
Special revenues
|
1,085
|
-
|
(67)
|
1,018
|
|||
|
Industrial and miscellaneous
|
201,555
|
934
|
(1,983)
|
200,505
|
|||
|
Total bonds
|
328,234
|
1,282
|
(5,286)
|
324,229
|
|||
|
Loan-backed securities
|
218,427
|
1,246
|
(2,862)
|
216,811
|
|||
|
Short-term fixed income securities
|
2,498
|
1
|
-
|
2,499
|
|||
|
Total fixed maturities
|
$ 549,159
|
$ 2,529
|
$
|
(8,148)
|
$ 543,540
|
||
16
Farmers New World Life Insurance Company
(A wholly owned subsidiary of Farmers Group, Inc.)
Notes to Statutory Financial Statements
For the Years Ended December 31, 2024, 2023 and 2022
|
2023
|
|||||||
|
Gross
|
Gross
|
||||||
|
Amortized
|
Unrealized
|
Unrealized
|
Fair
|
||||
|
(in thousands of dollars)
|
Cost
|
Gains
|
Losses
|
Value
|
|||
|
Fixed Maturities
U.S. governments
|
$ 41,980
|
$ 120
|
$
|
(2,761)
|
$ 39,339
|
||
|
Political subdivisions
|
500
|
-
|
(91)
|
409
|
|||
|
Special revenues
|
1,085
|
-
|
(95)
|
990
|
|||
|
Industrial and miscellaneous
|
78,900
|
491
|
(1,876)
|
77,515
|
|||
|
Total bonds
|
122,465
|
611
|
(4,823)
|
118,253
|
|||
|
Loan-backed securities
|
148,027
|
435
|
(4,633)
|
143,829
|
|||
|
Short-term fixed income securities
|
249,134
|
42
|
-
|
249,176
|
|||
|
Total fixed maturities
|
$ 519,626
|
$ 1,088
|
$
|
(9,456)
|
$ 511,258
|
Unrealized Losses on Fixed Maturities and Equity Securities
Fair value and gross unrealized losses of fixed maturities and equity securities as of December 31, 2024 and 2023 were as follows:
2024
Unrealized Losses Unrealized Losses
Less Than 12 Months 12 Months or Greater Unrealized Unrealized
|
(in thousands of dollars)
|
Fair Value
|
Losses
|
Fair Value
|
Losses
|
|||
|
Fixed maturities
U.S. governments
|
$ 46,271
|
$ (746)
|
$ 16,190
|
$ (2,412)
|
|||
|
U.S. Political Subdivisions Bonds
|
-
|
-
|
422
|
(78)
|
|||
|
Special revenues
|
-
|
-
|
1,018
|
(67)
|
|||
|
Industrial and miscellaneous
|
55,021
|
(744)
|
39,422
|
(1,239)
|
|||
|
Total bonds
|
101,292
|
(1,490)
|
57,052
|
(3,796)
|
|||
|
Loan-backed securities
|
20,355
|
(147)
|
75,484
|
(2,715)
|
|||
|
Total fixed maturities
|
$ 121,647
|
$ (1,637)
|
$ 132,536
|
$ (6,511)
|
2023
Unrealized Losses Unrealized Losses
Less Than 12 Months 12 Months or Greater Unrealized Unrealized
|
(in thousands of dollars)
|
Fair Value
|
Losses
|
Fair Value
|
Losses
|
|||
|
Fixed maturities
U.S. governments
|
$ -
|
$ -
|
$ 36,251
|
$ (2,761)
|
|||
|
U.S. Political Subdivisions Bonds
|
-
|
-
|
409
|
(91)
|
|||
|
Special revenues
|
-
|
-
|
990
|
(95)
|
|||
|
Industrial and miscellaneous
|
11,375
|
(79)
|
48,000
|
(1,797)
|
|||
|
Total bonds
|
11,375
|
(79)
|
85,650
|
(4,744)
|
|||
|
Loan-backed securities
|
4,981
|
(18)
|
122,422
|
(4,615)
|
|||
|
Total fixed maturities
|
$ 16,356
|
$ (97)
|
$ 208,072
|
$ (9,359)
|
17
Farmers New World Life Insurance Company
(A wholly owned subsidiary of Farmers Group, Inc.)
Notes to Statutory Financial Statements
For the Years Ended December 31, 2024, 2023 and 2022
As of December 31, 2024, fixed maturities represented 100% of the Company’s total unrealized loss amount, which was comprised of 166 securities. The Company
held 1 security that was in an unrealized loss position in excess of 20%.
Fixed maturities in an unrealized loss position for less than 12 months were comprised of 66 securities, of which 100%, or $121,647,000 were comprised of
securities with fair value to amortized cost ratios at or greater than 95%. Most of these securities are investment grade fixed maturities that have decreased in fair values due to changes in interest rates since the date of purchase.
Fixed maturities in an unrealized loss position for 12 months or more as of December 31, 2024 were comprised of 100 securities, with a total fair value of
approximately $132,535,000. The decline in market value for these securities is primarily attributable to changes in interest rates. A variety of data is reviewed, including the aging and severity of unrealized losses; watch lists
distributed by the asset managers, deviations in market prices between months, and results of tests indicating if any bond holdings with unrealized losses have a credit rating below investment grade for 12 consecutive months. If a
fixed maturity security, except for loan-backed securities, is deemed other-than-temporarily impaired, then the security’s book value basis is written down to current market value with the Company recognizing an impairment loss in
current period’s earnings.
Because the decline in market value is attributable to changes in interest rates and not credit quality and because the Company has the ability and intent to
hold the fixed income investments until a recovery of fair value, which may be maturity, the Company does not consider these investments to be other-than- temporarily impaired as of December 31, 2024.
Loan-Backed Securities
There were no loan-backed securities impaired during 2024 due to intent to sell or inability or lack of intent to retain the security for a period of time
sufficient to recover the amortized cost basis. Loan-backed securities with evidence of deterioration of credit quality for which it is probable that the Company will be unable to collect all contractually required payments
receivable, are written down to the present value of expected cash flows to be received. In determining the impairments for loan-backed securities, a review of default rate, credit support and other key assumptions is made on the
security level.
Prepayment Penalty and Acceleration Fees
For securities sold, redeemed or otherwise disposed as a result of a callable feature, the following table discloses the number of CUSIPs sold, redeemed or
otherwise disposed and the aggregate amount of investment income generated as a result of a prepayment penalty and/or acceleration fee for the years ended December 31, 2024 and 2023 are as follows:
|
(in thousands of dollars)
|
2024
|
2023
|
|||
|
Number of CUSIPs
|
2
|
1
|
|||
|
Aggregate Amount of Investment Income
|
$
|
8
|
$
|
245
|
Subprime Mortgage Related Risk Exposure
The Company has no direct exposure through investments in subprime mortgage loans.
18
Farmers New World Life Insurance Company
Farmers New World Life Insurance Company
Farmers New World Life Insurance Company
(A wholly owned subsidiary of Farmers Group, Inc.)
Notes to Statutory Financial Statements
For the Years Ended December 31, 2024, 2023 and 2022
5GI Securities
The Company does not have any 5GI securities as of December 31, 2024 and 2023.
Maturities of Bonds
The amortized cost and fair value of bonds and short-term investments, by contractual maturity, at December 31, 2024 are shown below. Expected maturities
may differ from contractual maturities because borrowers may have the right to call or prepay obligations with or without call or prepayment penalty:
|
(in thousands of dollars)
|
Amortized
Cost
|
Fair
Value
|
|
|
Due to 1 year or less
|
$ 27,082
|
$ 26,958
|
|
|
Due after 1 year through 5 years
|
245,957
|
244,545
|
|
|
Due after 5 years through 10 years
|
48,196
|
47,826
|
|
|
Due after 10 years
|
9,497
|
7,399
|
|
|
330,732
|
326,728
|
||
|
Loan-backed securities
|
218,427
|
216,811
|
|
|
Total bonds
|
$ 549,159
|
$ 543,539
|
|
Sales of Bonds and Common Stocks
The gross gains, gross losses and proceeds from sales on bonds and common stocks for the years ended December 31, 2024, 2023 and 2022 are as follows:
|
(in thousands of dollars)
|
Gross
Gains
|
Gross
Losses
|
Proceeds
|
|
2024 Bonds
|
$ 86
|
$ (52)
|
$ 53,268
|
|
|
$ 86
|
$ (52)
|
$ 53,268
|
|
2023 Bonds
|
$ 3,820
|
$ (300,641)
|
$3,215,347
|
|
|
$ 3,820
|
$ (300,641)
|
$3,215,347
|
|
2022 Bonds
|
$ 20,378
|
$ (3,318)
|
$ 415,860
|
|
|
$ 20,378
|
$ (3,318)
|
$ 415,860
|
Bonds with an amortized cost of approximately $5,253,000 and $5,209,000 were on deposit with regulatory authorities at December 31, 2024 and 2023, respectively, to satisfy
regulatory requirements. The fair value of these securities was approximately $3,662,000 and $3,926,000 as of December 31, 2024 and 2023, respectively.
On January 18, 2022, Mount Rosa/Mount Evans bonds were called and the Company received total proceeds of $104,303,000. The Company recorded a prepayment penalty income of
$26,155,000 and realized loss of $6,241,000 in accordance with SSAP No. 26R.
19
Farmers New World Life Insurance Company
(A wholly owned subsidiary of Farmers Group, Inc.)
Notes to Statutory Financial Statements
For the Years Ended December 31, 2024, 2023 and 2022
Commercial Mortgage Loans
As of December 31, 2024, the Company no longer has any investment in mortgage loans. The Company disposed of all mortgage loans on November 1, 2023.
Real Estate
Real estate investments at December 31, 2024 and 2023 were as follows:
|
(in thousands of dollars)
|
|||
|
2024
|
2023
|
||
|
Actual Costs:
Property held for the production of income
|
$ 53,358
|
$ 105,751
|
|
|
Property held for sale
|
-
|
28,803
|
|
|
Accumulated depreciation
|
(6,382)
|
(18,309)
|
|
|
Other than temporary impairment
|
(17,217)
|
(3,445)
|
|
|
Total real estate carrying value
|
$ 29,759
|
$ 112,800
|
|
The Company establishes wholly owned subsidiary single member LLC legal entities to invest in direct real estate properties held for the production of
income. As of December 31, 2024, the Company owned the following legal entities: BOS Office 3, LLC, CHI Ind 6, LLC, and Raleigh Office 2, LLC. The Company recognized $17,217,000 and $3,445,000 impairments on real estate for the
years ended December 31, 2024 and 2023, respectively. At December 31, 2024, no properties were classified as held for sale. During 2024, The Company sold five real estate properties: LA Industrial 2, LLC, DC Retail 1, LLC,
Charlotte Industrial 2, LLC, CHI Ind 1, LLC, and Charlotte Industrial 3, LLC. The Company also partially sold one real estate property: BOS Office 3, LLC. The Company recognized a total capital gain of $14,681,000.
Both the impairment loss and the net capital gain on disposal are reported in the Statement of Operations under net realized capital gains/losses net of
taxes.
Other Invested Assets
On December 20, 2017, the Company purchased a surplus debenture of $100,000,000 issued by Farmers Insurance Exchange and the asset has been carried at
cost. The Insurance Commissioner of the State of California authorized the purchase with a maturity date of December 20, 2027. The note has an annual interest rate of 3.758% due semi-annually on June 20 and December 20. On
December 20, 2022, the surplus note was paid off in full by Farmers Insurance Exchange for $100,000,000.
20
(A wholly owned subsidiary of Farmers Group, Inc.)
Notes to Statutory Financial Statements
For the Years Ended December 31, 2024, 2023 and 2022
Restricted Assets
As of December 31,2024, and 2023, total restricted assets amounted to $5,253,000 and $5,209,000 respectively. Of these assets, bonds and short-term
investments on deposit were for state insurance departments to satisfy regulatory requirements.
(in thousands) December 31, 2024
|
Restricted Asset Category
|
Total General
Account (G/A)
|
Total
|
Total from
Prior Year
|
Increase/ (Decrease)
|
Total
Admitted
Restricted
|
Gross
Restricted
to Total
Assets
|
Admitted
Restricted
to Total
Admitted
Assets
|
|
On deposit with states regulatory bodies
|
5,253
|
5,253
|
5,209
|
45
|
5,253
|
0.211%
|
0.217%
|
|
Total restricted assets
|
5,253
|
5,253
|
5,209
|
45
|
5,253
|
0.211%
|
0.217%
|
(in thousands) December 31, 2023
|
Restricted Asset Category
|
Total General
Account (G/A)
|
Total
|
Total from
Prior Year
|
Increase/ (Decrease)
|
Total
Admitted
Restricted
|
Gross
Restricted
to Total
Assets
|
Admitted
Restricted
to Total
Admitted
Assets
|
|
On deposit with states regulatory bodies
|
5,209
|
5,209
|
3,918
|
1,290
|
5,209
|
0.220%
|
0.226%
|
|
Total restricted assets
|
5,209
|
5,209
|
3,918
|
1,290
|
5,209
|
0.220%
|
0.226%
|
4. Fair Value of Financial Instruments
Included in various investment related line items in the financial statements are certain financial instruments carried at fair value on a recurring basis.
Other financial instruments are periodically measured at fair value, such as when impaired, or, for certain bonds when carried at the lower of cost or market.
The Company’s financial assets and liabilities carried at fair value have been classified, for disclosure purposes, based on a hierarchy defined by SSAP No.
100R. The hierarchy gives the highest ranking to fair values determined using unadjusted quoted prices in active markets for identical assets and liabilities (Level 1) and the lowest ranking to fair values determined using
methodologies and models with unobservable inputs (Level 3). An asset’s or liability’s classification is based on the lowest level input that is significant to its measurement. For example, a Level 3 fair value measurement may
include inputs that are both observable (Levels 1 and 2) and unobservable (Level 3).
21
(A wholly owned subsidiary of Farmers Group, Inc.)
Notes to Statutory Financial Statements
For the Years Ended December 31, 2024, 2023 and 2022
The levels of the fair value hierarchy are as follows:
Level 1 Fair value measurements based on observable inputs that reflect quoted prices for identical assets or liabilities in active markets that the
company has the ability to access at the measurement date. Level 1 securities include money market funds.
Level 2 Fair value measurements based on quoted prices in markets that are not active or significant inputs that are observable either directly or
indirectly. Level 2 inputs include the following:
|
a)
|
Quoted prices for similar assets or liabilities in active markets.
|
|
b)
|
Quoted prices for identical or similar assets or liabilities in non-active markets.
|
|
c)
|
Inputs other than quoted market prices that are observable.
|
|
d)
|
Inputs that are derived principally from or corroborated by observable market data through correlation or other means.
|
Level 3 Fair value measurements based on valuation techniques that require significant inputs that are both unobservable and significant to the overall fair value measurement. These
measurements include circumstances in which there is little, if any, market activity for the asset or liability and reflect management’s own judgments about the assumptions a market participant would use in pricing the asset or
liability.
There were no revisions to the Company’s fair value level classifications policy for 2024 or 2023.
Financial Assets and Liabilities Measured at Fair Value on a Recurring Basis
The following table provides information as of December 31, 2024 and 2023 about the Company’s financial assets measured at fair value:
(in thousands of dollars)
|
|
2024
|
|
|||||
|
Level 1
|
Level 2
|
Level 3
|
Total
|
||||
|
Assets at fair value
Separate account assets
Total assets at fair value
|
$ 1,422,472
|
$ -
|
$ -
|
$ 1,422,472
|
|||
|
$ 1,422,472
|
$ -
|
$ -
|
$ 1,422,472
|
||||
(in thousands of dollars)
|
|
2023
|
|
|||||
|
Level 1
|
Level 2
|
Level 3
|
Total
|
||||
|
Assets at fair value
Separate account assets
Total assets at fair value
|
$ 1,244,925
|
$ -
|
$ -
|
$ 1,244,925
|
|||
|
$ 1,244,925
|
$ -
|
$ -
|
$ 1,244,925
|
||||
22
Farmers New World Life Insurance Company
(A wholly owned subsidiary of Farmers Group, Inc.)
Notes to Statutory Financial Statements
For the Years Ended December 31, 2024, 2023 and 2022
Level 1 Financial Assets
Separate Account Assets
Fair values and changes in the fair values of separate account assets generally accrue directly to the contract holders and are not included in the
Company’s revenues and expenses or surplus.
Separate account assets in Level 1 include actively traded institutional and retail mutual fund investments valued by the respective mutual fund
companies.
Changes in Level 3 Assets Measured at Fair Value on a Recurring Basis
There were no changes in assets classified as Level 3 for the years ended December 31, 2024 and 2023.
Policy on Transfers In and Out of Level 3
At the end of each reporting period, the Company evaluates whether or not any event has occurred, or circumstances have changed that would cause an
investment to be transferred in or out of Level 3. There were no transfers in or out of Level 3 in 2024 and 2023.
Fair Values of Financial Instruments and its Level within the Fair Value Hierarchy
The following tables provide information as of December 31, 2024 and 2023 about the fair values of the Company’s financial instruments and their levels
within the fair value hierarchy.
(in thousands of dollars) December 31, 2024
|
Type of Financial Instrument
|
Aggregate Fair Value
|
Statement Value
|
Level 1
|
Level 2
|
Level 3
|
Not Practicable (Carrying Value)
|
|
Assets at Fair Value
|
||||||
|
Bonds
|
$ 541,041
|
$ 546,661
|
$ -
|
$ 537,539
|
$ 3,501
|
$ -
|
|
Cash, cash equivalents and short-term investments
|
15,660
|
15,660
|
13,161
|
2,499
|
-
|
-
|
|
Accrued investment income
|
5,345
|
5,345
|
5,345
|
-
|
-
|
-
|
|
Separate accounts
|
1,422,472
|
1,422,472
|
1,422,472
|
-
|
-
|
-
|
|
Total assets at fair value
|
$ 1,984,518
|
$ 1,990,138
|
$ 1,440,978
|
$ 540,038
|
$ 3,501
|
$ -
|
|
Liabilities at Fair Value
|
||||||
|
Separate accounts
|
1,422,472
|
1,422,472
|
-
|
1,422,472
|
||
|
Total liabilities at fair value
|
$ 1,422,472
|
$ 1,422,472
|
$ -
|
$ 1,422,472
|
$ -
|
$ -
|
23
Farmers New World Life Insurance Company
(A wholly owned subsidiary of Farmers Group, Inc.)
Notes to Statutory Financial Statements
For the Years Ended December 31, 2024, 2023 and 2022
(in thousands of dollars) December 31, 2023
|
Type of Financial Instrument
|
Aggregate Fair Value
|
Statement Value
|
Level 1
|
Level 2
|
Level 3
|
Not Practicable (Carrying Value)
|
|
Assets at Fair Value
|
||||||
|
Bonds
|
$ 262,082
|
$ 270,492
|
$ -
|
$ 259,492
|
$ 2,590
|
$ -
|
|
Cash, cash equivalents and short-term investments
|
258,348
|
258,306
|
9,172
|
249,176
|
-
|
-
|
|
Accrued investment income
|
6,331
|
6,331
|
6,331
|
-
|
-
|
-
|
|
Separate accounts
|
1,244,925
|
1,244,925
|
1,244,925
|
-
|
-
|
-
|
|
Total assets at fair value
|
$ 1,771,686
|
$ 1,780,054
|
$ 1,260,428
|
$ 508,668
|
$ 2,590
|
$ -
|
|
Liabilities at Fair Value
|
||||||
|
Separate accounts
|
1,244,925
|
1,244,925
|
-
|
1,244,925
|
||
|
Total liabilities at fair value
|
$ 1,244,925
|
$ 1,244,925
|
$ -
|
$ 1,244,925
|
$ -
|
$ -
|
The following methods and assumptions were used to estimate the fair value of financial instruments as of December 31, 2024 and 2023:
Bonds
The fair values of bonds are valued using quoted market prices from third party sources. If quotes from these sources were not available, a broker
dealer estimate was used. Unless representative trades of securities actually occurred at year end, these quotes are generally estimates of market value based on an evaluation of appropriate factors such as trading in
similar securities, yields, credit quality, coupon rate, maturity, type of issues and other market data. Major inputs include yield curves, yields, and expected future cash flows. Level 3 bonds consist of non-agency
mortgage-backed securities with significant unobservable inputs.
Contract Loans
The carrying value of contract loans is the unpaid loan balance not in excess of policy cash surrender values. The estimated fair value of contract
loans is based upon the present value of the future cash flows discounted at a mid-market swap rate. The excess of fair value over carrying value is due to interest rates on contract loans (some as high as 8%) being much
higher than interest rates available in the current persistent low interest rate environment. Due to the contract loans asset balance currently being 100% ceded, the Company has a zero net balance as of December 31, 2024 and
2023.
Receivables/Payables for Securities
The fair value for receivables/payables for securities are based on quoted market prices from third party sources.
Cash, Cash Equivalents and Short-Term Investments
The costs of these items are a reasonable estimate of their fair value. The fair value of money market mutual funds are valued using NAV.
Accrued Investment Income
The cost of accrued investment income approximates fair value unless otherwise noted.
24
Farmers New World Life Insurance Company
(A wholly owned subsidiary of Farmers Group, Inc.)
Notes to Statutory Financial Statements
For the Years Ended December 31, 2024, 2023 and 2022
Separate Accounts
The separate accounts assets are carried at fair value based on the reported net asset value (NAV) per share of the respective portfolios at December
31, 2024 and 2023. Accumulation values are computed daily based on the change in fair market value of the NAV of the subaccount less mortality and expense risk charges for the subaccount. The Company uses the value of the
assets as a reasonable estimate of the value of the liabilities.
5. Related Parties
The Company is a subsidiary of Farmers Group Inc (FGI), an insurance holding company domiciled in the state of Nevada. As the Parent Company, FGI
performs legal, investment, and marketing services on behalf of the Company. Fees for these services are determined by using various cost allocation methods.
FGI has an agreement with the Company to provide sales and marketing, human resource, information technology, real estate, tax, payroll, investments,
purchasing, warehousing, corporate legal and other services. Fees charged to the Company by FGI were approximately $22,830,000, $31,853,000, and
$37,202,000, for the years ended December 31, 2024, 2023 and 2022 respectively, and are expensed as incurred.
The Exchanges have an agreement with the Company to provide distribution and other services. Fees charged to the Company by the Exchanges were
approximately $19,836,000, $24,566,000, and
$25,421,000 for the years ended December 31, 2024, 2023 and 2022, respectively, and are expensed as incurred.
MI Administrators, LLC is a wholly owned subsidiary of Farmers Insurance Group Leasing and was formed on September 24, 2008 under the laws of the
State of Delaware. MI Administrators serves as a paymaster entity for the Company and affiliate entities and facilitates cash settlement of related party transactions in accordance with the State of Washington’s business and
occupation regulations.
The Company has a service agreement with its affiliate, Zurich American Life Insurance Company (“ZALICO”), for the Company to perform administrative
services reasonably necessary in the ordinary course of business, including but not limited to data processing, financial services, investment services, and certain other services as deemed necessary. Fees charged by the
Company to ZALICO were approximately $56,000, $56,000, and $56,000 for the years ended December 31, 2024, 2023 and 2022 respectively and are expensed as incurred.
As part of a tax sharing agreement with FGI, FNWL received a net refund of $8,375,000 for the year ended December 31, 2024 and remitted a net payment
of $295,755,000 for the year ended December 31, 2023. The current year prepayment was $500,000 and $295,200,000 for December 31, 2024 and 2023, respectively.
For information on investment fees paid to affiliates or affiliated investments, please refer to Note 3. For information related to dividends paid to
FGI, please refer to note 7.
For the period ended December 31, 2024 and 2023, the Company reported the following amounts due from or to related parties, excluding reinsurance
related balances: (Please refer to Note 6 for reinsurance related balances.)
25
Farmers New World Life Insurance Company
(A wholly owned subsidiary of Farmers Group, Inc.)
Notes to Statutory Financial Statements
For the Years Ended December 31, 2024, 2023 and 2022
(in thousands of dollars)
|
Receivables from related parties Farmers Insurance Group Leasing
Total receivables from related parties
Payables to related parties
|
2024
$ -
-
|
2023
$ -
-
|
|
|
FGI
|
(2,486)
|
(5,079)
|
|
|
Farmers Insurance Exchange
|
(3,649)
|
(2,933)
|
|
|
Zurich Investment Services Limited
|
(337)
|
(826)
|
|
|
Farmers Insurance Group Leasing
|
(74)
|
(14)
|
|
|
Total payables to related parties
|
(6,546)
|
(8,852)
|
|
|
Net payables to related parties
|
$ (6,546)
|
$ (8,852)
|
6. Reinsurance
The Company assumes business from and cedes business to reinsurers to share risks under certain term, whole life, universal life and annuity policies for the purpose of reducing exposure to large losses.
Reinsurance ceded contracts do not relieve the Company from its obligations to policyholders. The Company remains liable to its policyholders for the portion reinsured to the extent that any reinsurer does not meet its
obligations for reinsurance ceded to it under the reinsurance agreements. Failure of the reinsurers to honor their obligations could result in losses to the Company. Provisions are established for amounts deemed or estimated to be
uncollectible. As of December 31, 2024 and 2023, no amounts have been recorded in relation to uncollectible reinsurance balances.
Beginning January 1, 2010, the Company ceded to its affiliate, Zurich Insurance Company (“ZIC”), 50% of contractual risk for new issues of its critical illness rider and a portion of business that is ceded through reinsurance
pools. Effective January 1, 2012, new business previously ceded to Leschi, a wholly owned subsidiary, was ceded to ZIC. Effective October 1, 2013, the Company recaptured the Level Term business reinsured with Leschi and
simultaneously reinsured the recaptured in force block with ZIC. Effective January 1, 2015, the Company cedes to ZIC 75% of its contractual risk for new issues of certain term insurance policies subject to simplified underwriting.
Effective December 1, 2015, the Company cedes to ZIC 100% of its contractual risk for new and in-force issues of its indexed universal life product. Effective August 1, 2023 all previously reinsured business with ZIC was
recaptured. Premiums ceded to ZIC approximated $0, $101,817,000, and $438,084,000 for the years ended December 31, 2024, 2023, and 2022, respectively. Claims ceded to ZIC were approximately $0, $58,948,000, and $168,625,000 for
the years ended December 31, 2024, 2023 and 2022, respectively. Changes in reserves ceded to ZIC were approximately $0, ($1,587,178,000) and $66,603,000 for the years ended December 31, 2024, 2023 and 2022, respectively.
On May 17, 2023 the Company entered into an agreement with Security Life of Denver (“SLD”) effective August 1, 2023 to reinsure the remaining inforce life, A&H and annuity blocks of business of the Company. In connection
with, and at the same time, the Company recaptured all reinsurance from ZIC and placed it with Resolution Life Group. Specific to the transaction with Resolution, the Company ceded approximately $4.0 billion in assets and $5.2
billion in statutory reserves through the reinsurance transaction.
Premiums assumed from unaffiliated companies approximated $180,000, $165,000 and $162,000 for the years ended December 31, 2024, 2023 and 2022, respectively. Premiums ceded to unaffiliated companies approximated $1,199,403,000,
$5,374,166,000 and $191,524,000 for the years ended December 31, 2024, 2023 and 2022, respectively. There were no claims paid to unaffiliated companies on assumed reinsurance for the years ended December 31, 2024, 2023 and 2022.
Claims ceded to unaffiliated companies were approximately $576,295,000, $387,550,000 and $153,653,000 for the years ended December 31, 2024, 2023 and 2022, respectively. Changes in reserves assumed from unaffiliated companies were
approximately ($122,000), ($64,000), and ($513,000) for the years ended December 31, 2024, 2023 and 2022, respectively. Changes in reserves ceded to unaffiliated companies were approximately ($117,051,000), $5,205,741,000 and
($112,519,000) for the years ended December 31, 2024, 2023 and 2022, respectively.
26
Farmers New World Life Insurance Company
(A wholly owned subsidiary of Farmers Group, Inc.)
Notes to Statutory Financial Statements
For the Years Ended December 31, 2024, 2023 and 2022
The estimated amounts of aggregate reduction in surplus due to termination of all reinsurance agreements by either party as of December 31, 2024 and 2023 would be approximately $1,884,218,000 and $1,812,317,000, respectively.
As of December 31, 2024, there are no Covered Policies subject to the requirements of Actuarial Guideline XLVIII as defined in Section 4.B and per exemptions in Section 3.
7. Surplus and Restrictions
Statutory surplus of approximately $506,598,000 and $527,358,000 as of December 31, 2024 and 2023, respectively, is the amount held for the benefit of the stockholder. The entire amount in 2024 and 2023 is designated as
stockholder’s surplus for tax purposes and would not subject the Company to taxation if paid as a cash dividend.
The amount of dividends that can be paid by the Company to its stockholder without prior approval (or non-disapproval) of the OIC is limited to the lesser of: (i) 10% of its statutory earned surplus or (ii) the statutory net
income before realized gains and losses from the preceding calendar year. All dividends paid during the preceding 12 month rolling period are considered for this calculation. Earned surplus consists of funds derived from any
realized net profits and does not include unrealized capital gains or re- evaluation of assets. A dividend paid that does not meet the above specifications is defined in total as an “extraordinary dividend” and requires advance
approval from the OIC. The maximum dividend payouts that could be made without prior approval of the OIC for the years 2025 and 2024 are $0 and
$52,736,000, respectively. Dividends are approved by the board of directors.
On November 8, 2023, the Company declared extraordinary dividends in the amount of $1,200,000,000 that was paid to FGI on December 27, 2023, with the non-disapproval of the Washington Office of Insurance Commissioner.
8. Employees’ Retirement Plans
Prior to January 1, 2009, FGI sponsored a qualified, noncontributory defined benefit pension plan where benefits were based on years of service and the employee’s compensation during the last five years of employment. Effective
January 1, 2009 the Company transitioned to a Cash Balance Program. Under the Cash Balance Program, FGI makes regular contributions to the employee’s account. The amount of these contributions is based on a percentage of an employee
base pay and will vary depending on an employee’s age and length of service. However, vested employees who were age 40 and over or who had 10 or more years of service as of December 31, 2008 were “grandfathered” in the previous
Pension Program. This approach helped employees closer to retirement to maintain the full value of their anticipated pension benefit.
27
Farmers New World Life Insurance Company
(A wholly owned subsidiary of Farmers Group, Inc.)
Notes to Statutory Financial Statements
For the Years Ended December 31, 2024, 2023 and 2022
The FGI funding policy is to make sufficient contributions to the pension plan to fully provide for employees benefits at the time of retirement.
FGI announced on October 20, 2016 that it would freeze all pension plan benefits (final average earnings and cash balance formulas) effective December 31,
2018. The impacted employees kept all benefits accrued through December 31, 2018, but no longer accrue benefits after that date. As part of this change, starting January 1, 2019, FGI contributes an additional 4% of eligible pay to
employees’ 401K Savings Plan as explained in note 9.
In addition, the Company provides post-retirement benefits to retired employees through a plan also sponsored by FGI. The Company has no legal obligation
for benefits under these plans. FGI charges the Company an allocated share of such contributions based on characteristics of the population of plan participants.
The expenses allocated for pension and post-retirement benefit costs were approximately $329,000,
$561,000, and $555,000 for the years 2024, 2023 and 2022, respectively. Pension plan and post- retirement plan assets and liabilities are carried by FGI.
9. Employees’ Incentive Plans
Prior to January 1, 2009, FGI and its subsidiaries had two profit sharing plans providing for cash payments to all eligible employees, the Cash Profit
Sharing Plan and Deferred Profit-Sharing Plan. Effective January 1, 2009 the Company transitioned from the two profit sharing plans to a 401K Savings Plan and the Short-Term Incentive Plan (“STIP”) award program.
The 401K Savings Plan includes a dollar-for-dollar Company match up to 6% of employees earned base pay. Vesting is immediate for employee contributions
and employer match. Effective January 1, 2019, FGI contributes an additional 4% Company Base Contribution to employees 401(k) Savings Plan, regardless of employee contribution. Three years of eligible service is required to vest
in the 4% Company Base Contribution. The cost to the Company for the 401(k) Savings Plan is included in the overhead and administrative charges paid by the Company to FGI.
The STIP program has two drivers. The award pool funding is determined by the Company meeting predetermined business performance metrics each year.
Secondly, the pool is distributed based on annual individual performance ratings. The majority of Farmers employees participate in the STIP award program. Up to 85% of the award can be deferred into the Company’s 401K Savings
Plan.
The Company’s share of expenses for the STIP award program for the years ended December 31, 2024, 2023 and 2022 was approximately $3,682,000, $4,946,000,
and $5,198,000, respectively. Additionally, the Company’s contributions to the 401K Savings Plan totaled $2,721,000, $3,486,000 and $4,048,000 for the years ended December 31, 2024, 2023, and 2022 respectively.
10. Federal Income Taxes
The components of the Company’s net deferred tax asset (“DTA”) / deferred tax liability (“DTL”) as of December 31, 2024 and 2023 are as follows:
|
2024
|
|||||
|
(in thousands of dollars)
|
Ordinary
|
Capital
|
Total
|
||
|
Gross deferred tax assets
Statutory valuation allowance adjustment
|
$ 85,450
-
|
$ 2,009
-
|
$ 87,459
-
|
||
|
Adjusted gross deferred tax assets
|
85,450
|
2,009
|
87,459
|
||
|
Deferred tax assets nonadmitted
|
(56,393)
|
-
|
(56,393)
|
||
|
Subtotal net admitted deferred tax assets
|
29,057
|
2,009
|
31,066
|
||
|
Deferred tax liabilities
|
(4,858)
|
-
|
(4,858)
|
||
|
Net admitted deferred tax asset
|
$ 24,199
|
$ 2,009
|
$ 26,208
|
||
28
Farmers New World Life Insurance Company
(A wholly owned subsidiary of Farmers Group, Inc.)
Notes to Statutory Financial Statements
For the Years Ended December 31, 2024, 2023 and 2022
|
2023
|
|||||
|
(in thousands of dollars)
|
Ordinary
|
Capital
|
Total
|
||
|
Gross deferred tax assets
Statutory valuation allowance adjustment
|
$ 75,706
-
|
$ 723
-
|
$ 76,429
-
|
||
|
Adjusted gross deferred tax assets
|
75,706
|
723
|
76,429
|
||
|
Deferred tax assets nonadmitted
|
(65,429)
|
(723)
|
(66,152)
|
||
|
Subtotal net admitted deferred tax assets
|
10,277
|
-
|
10,277
|
||
|
Deferred tax liabilities
|
(2,479)
|
-
|
(2,479)
|
||
|
Net admitted deferred tax asset
|
$ 7,798
|
-
|
$ 7,798
|
||
|
Change
|
|||||
|
(in thousands of dollars)
|
Ordinary
|
Capital
|
Total
|
||
|
Gross deferred tax assets
Statutory valuation allowance adjustment
|
$ 9,744
-
|
$ 1,286
-
|
$ 11,030
-
|
||
|
Adjusted gross deferred tax assets
|
9,744
|
1,286
|
11,030
|
||
|
Deferred tax assets nonadmitted
|
9,036
|
723
|
9,759
|
||
|
Subtotal net admitted deferred tax assets
|
18,780
|
2,009
|
20,789
|
||
|
Deferred tax liabilities
|
(2,379)
|
-
|
(2,379)
|
||
|
Net admitted deferred tax asset
|
$ 16,401
|
$ 2,009
|
$ 18,410
|
||
29
Farmers New World Life Insurance Company
(A wholly owned subsidiary of Farmers Group, Inc.)
Notes to Statutory Financial Statements
For the Years Ended December 31, 2024, 2023 and 2022
The SSAP No. 101 admission calculation components are as follows:
|
2024
|
|||
|
(in thousands of dollars)
|
Ordinary
|
Capital
|
Total
|
|
Federal income taxes paid in prior years recoverable through loss carrybacks
|
$ -
|
$ 2,009
|
$ 2,009
|
|
Adjusted gross deferred tax assets expected to be realized (excluding the amount of deferred tax assets from above) after application of the threshold limitation below
|
24,199
|
-
|
24,199
|
|
Adjusted gross deferred tax assets expected to be realized following the balance sheet date
|
24,199
|
-
|
24,199
|
|
Adjusted gross deferred tax assets allowed per limitation threshold
|
NA
|
NA
|
72,058
|
|
Adjusted gross deferred tax assets (excluding the amount of deferred tax assets from above offset by gross deferred tax liabilities)
|
4,858
|
-
|
4,858
|
|
Deferred tax assets admitted as the result of application of SSAP No. 101
|
$ 29,057
|
$ 2,009
|
$ 31,066
|
|
Ratio percentage used to determine recovery period and threshold limitation amount
|
1884.%
|
||
|
Amount of adjusted capital and surplus used to determine recovery period and threshold limitation above
|
$ 480,390
|
|
2023
|
|||
|
(in thousands of dollars)
|
Ordinary
|
Capital
|
Total
|
|
Federal income taxes paid in prior years recoverable through loss carrybacks
|
$ -
|
$ 723
|
$ 723
|
|
Adjusted gross deferred tax assets expected to be realized (excluding the amount of deferred tax assets from above) after application of the threshold limitation below
|
7,798
|
(723)
|
7,075
|
|
Adjusted gross deferred tax assets expected to be realized following the balance sheet date
|
7,798
|
(723)
|
7,075
|
|
Adjusted gross deferred tax assets allowed per limitation threshold
|
NA
|
NA
|
77,034
|
|
Adjusted gross deferred tax assets (excluding the amount of deferred tax assets from above offset by gross deferred tax liabilities)
|
2,479
|
-
|
2,479
|
|
Deferred tax assets admitted as the result of application of SSAP No. 101
|
$ 10,277
|
$ -
|
$ 10,277
|
|
Ratio percentage used to determine recovery period and threshold limitation amount
|
1642.%
|
||
|
Amount of adjusted capital and surplus used to determine recovery period and threshold limitation above
|
$ 519,561
|
30
Farmers New World Life Insurance Company
Farmers New World Life Insurance Company
Farmers New World Life Insurance Company
(A wholly owned subsidiary of Farmers Group, Inc.)
Notes to Statutory Financial Statements
For the Years Ended December 31, 2024, 2023 and 2022
|
Change
|
|||
|
(in thousands of dollars)
|
Ordinary
|
Capital
|
Total
|
|
Federal income taxes paid in prior years recoverable through loss carrybacks
|
$ -
|
$ 1,286
|
$ 1,286
|
|
Adjusted gross deferred tax assets expected to be realized (excluding the amount of deferred tax assets from above) after application of the threshold limitation below
|
16,401
|
723
|
17,124
|
|
Adjusted gross deferred tax assets expected to be realized following the balance sheet date
|
16,401
|
723
|
17,124
|
|
Adjusted gross deferred tax assets allowed per limitation threshold
|
NA
|
NA
|
(5,876)
|
|
Adjusted gross deferred tax assets (excluding the amount of deferred tax assets from above offset by gross deferred tax liabilities)
|
2,379
|
-
|
2,379
|
|
Deferred tax assets admitted as the result of application of SSAP No. 101
|
$ 18,780
|
$ 2,009
|
$ 20,789
|
|
Ratio percentage used to determine recovery period and threshold limitation amount
|
242%
|
||
|
Amount of adjusted capital and surplus used to determine recovery period and threshold limitation above
|
$ (39,171)
|
The impacts of tax planning strategies on the Company’s DTAs are as follows:
|
2024
|
|||
|
Ordinary
Percent
|
Capital
Percent
|
||
|
Determination of adjusted gross deferred tax assets
and net admitted deferred tax assets by tax character as a percentage
|
|||
|
Adjusted gross DTAs
|
$ 85,450
|
$ 2,009
|
|
|
Percentage of total adjusted gross DTAs by tax character
|
|||
|
admitted due to the tax impact of tax planning strategies
|
0%
|
0%
|
|
|
Net admitted adjusted gross DTAs
|
$ 29,057
|
$ 2,009
|
|
|
Percentage of net admitted adjusted gross DTAs by tax character
|
|||
|
admitted due to the impact of tax planning strategies
|
0%
|
0%
|
|
|
2023
|
|||
|
Ordinary
Percent
|
Capital
Percent
|
||
|
Determination of adjusted gross deferred tax assets
and net admitted deferred tax assets by tax character as a percentage
|
|||
|
Adjusted gross DTAs
|
$ 75,706
|
$ 723
|
|
|
Percentage of total adjusted gross DTAs by tax character
|
|||
|
admitted due to the tax impact of tax planning strategies
|
0%
|
0%
|
|
|
Net admitted adjusted gross DTAs
|
$ 10,277
|
$ -
|
|
|
Percentage of net admitted adjusted gross DTAs by tax character
|
|||
|
admitted due to the impact of tax planning strategies
|
0%
|
0%
|
|
31
(A wholly owned subsidiary of Farmers Group, Inc.)
Notes to Statutory Financial Statements
For the Years Ended December 31, 2024, 2023 and 2022
|
Change
|
|||
|
Ordinary
Percent
|
Capital
Percent
|
||
|
Determination of adjusted gross deferred tax assets
and net admitted deferred tax assets by tax character as a percentage
|
|||
|
Adjusted gross DTAs
|
$999,744
|
$ 1,286
|
|
|
Percentage of total adjusted gross DTAs by tax character
|
|||
|
admitted due to the tax impact of tax planning strategies
|
0%
|
0%
|
|
|
Net admitted adjusted gross DTAs
|
$ 18,780
|
$ 2,009
|
|
|
Percentage of net admitted adjusted gross DTAs by tax character
|
|||
|
admitted due to the impact of tax planning strategies
|
0%
|
0%
|
|
The Company’s tax planning strategies do not include the use of reinsurance. The Company is currently recognizing all deferred tax liabilities.
Current income taxes incurred for the years ended December 31, 2024, 2023 and 2022 consisted of the following major components:
|
(in thousands of dollars)
|
2024
|
2023
|
2022
|
||
|
Current income tax Federal income tax
|
$(1,156)
|
$364,454
|
$37,414
|
||
|
Federal income tax on net capital gains / (losses)
|
1,256
|
(78,104)
|
7,968
|
||
|
Federal income taxes incurred
|
$100
|
$286,350
|
$45,382
|
The tax effects of temporary differences that give rise to significant portions of the deferred tax assets and liabilities as of December 31, 2024 and 2023 were as
follows:
(in thousands of dollars)
|
2024
|
2023
|
Change
|
|||
|
Deferred tax assets
|
|||||
|
Ordinary
|
|||||
|
Deferred acquisition costs
|
$ 69,359
|
$ 61,444
|
$ 7,915
|
||
|
Life insurance reserves
|
9,742
|
10,498
|
(756)
|
||
|
Compensation and benefits accrual
|
933
|
1,286
|
(353)
|
||
|
Nonadmitted assets
|
2,626
|
671
|
1,955
|
||
|
Other
|
2,790
|
1,807
|
983
|
||
|
85,450
|
75,706
|
9,744
|
|||
|
Statutory valuation allowance adjustment
|
-
|
-
|
-
|
||
|
Nonadmitted deferred tax assets
|
(56,393)
|
(65,429)
|
9,036
|
||
|
Admitted ordinary deferred tax assets
|
29,057
|
10,277
|
18,780
|
||
|
Capital Investments
|
2,009
|
723
|
1,286
|
||
|
Unrealized loss on investments
|
-
|
-
|
-
|
||
|
Subtotal
|
2,009
|
723
|
1,286
|
||
|
Statutory valuation allowance adjustment
|
-
|
-
|
-
|
||
|
Nonadmitted deferred tax assets
|
-
|
(723)
|
723
|
||
|
Admitted capital deferred tax assets
|
2,009
|
-
|
2,009
|
||
|
Admitted deferred tax assets
|
31,066
|
10,277
|
20,789
|
||
|
Deferred tax liabilities Ordinary
|
|||||
|
Fixed assets
|
2,795
|
2,005
|
790
|
||
|
Market discount on bonds
|
481
|
265
|
216
|
||
|
Policyholder reserves
|
93
|
184
|
(91)
|
||
|
Deferred and uncollected premium
|
-
|
-
|
-
|
||
|
Other
|
1,489
|
25
|
1,464
|
||
|
Total ordinary deferred tax liabilities
|
4,858
|
2,479
|
2,379
|
||
|
Capital
|
|||||
|
Investments
|
-
|
-
|
-
|
||
|
Unrealized gain on investments
|
-
|
-
|
-
|
||
|
Total capital deferred tax liabilities
|
-
|
-
|
-
|
||
|
Total deferred tax liabilities
|
4,858
|
2,479
|
2,379
|
||
|
Net admitted deferred tax assets
|
$ 26,208
|
$ 7,798
|
$ 18,410
|
32
Farmers New World Life Insurance Company
(A wholly owned subsidiary of Farmers Group, Inc.)
Notes to Statutory Financial Statements
For the Years Ended December 31, 2024, 2023 and 2022
The change in net deferred income taxes as of December 31, 2024 and 2023 was composed of the following:
(in thousands of dollars)
|
2024
|
2023
|
Change
|
|||
|
Total deferred tax assets
|
$ 87,459
|
$ 76,429
|
$ 11,030
|
||
|
Total deferred tax liabilities
|
(4,858)
|
(2,479)
|
(2,379)
|
||
|
Net deferred tax asset (liability)
|
$ 82,601
|
$73,950
|
8,651
|
||
|
Tax effect of unrealized gains (losses)
|
-
|
||||
|
Change in net deferred income tax
|
$ 8,651
|
||||
|
(charge) benefit
|
The provision for federal income taxes incurred is different from that which would be obtained by applying the statutory federal income tax rate at 21% to income before
income taxes. The significant items causing this difference are as follows:
|
(in thousands of dollars)
|
2024
|
2023
|
2022
|
||
|
Provision computed at statutory rate
|
$ (9,382)
|
$ 295,841
|
$ 39,509
|
||
|
Interest maintenance reserve
|
1,878
|
54,842
|
(416)
|
||
|
Reinsurance gain adjustment
|
-
|
(3,200)
|
-
|
||
|
Transaction costs
|
-
|
(1,269)
|
-
|
||
|
Separate account dividend received deduction
|
(480)
|
(407)
|
(620)
|
||
|
Prior year under/(over) accrual of income taxes
|
(160)
|
(306)
|
(235)
|
||
|
Nonadmitted assets
|
(1,955)
|
570
|
27
|
||
|
Aggregate write in adjustments included in surplus
|
1,489
|
-
|
-
|
||
|
Other
|
59
|
53
|
50
|
||
|
$ (8,551)
|
$ 346,124
|
$ 38,315
|
|||
|
Federal income tax incurred-operations
|
$ (1,156)
|
$ 364,454
|
$ 37,414
|
||
|
Tax on capital gains (losses)
|
1,256
|
(78,104)
|
7,968
|
||
|
Change in net deferred income tax
|
(8,651)
|
59,774
|
(7,067)
|
||
|
Total statutory income taxes
|
$ (8,551)
|
$ 346,124
|
$ 38,315
|
||
As of December 31, 2024, the Company did not have any operating loss carry-forwards or capital loss carry forwards.
The following are income taxes incurred in the current and prior years that will be available for recoupment in the event of future net losses:
(in thousands of dollars)
|
Amount
|
|
|
2024
|
$ 1,256
|
|
2023
|
174,149
|
|
2022
|
7,968
|
There were no deposits admitted under IRC §6603.
33
Farmers New World Life Insurance Company
(A wholly owned subsidiary of Farmers Group, Inc.)
Notes to Statutory Financial Statements
For the Years Ended December 31, 2024, 2023 and 2022
The Company’s federal income tax return is consolidated with the following entities, with Farmers Group, Inc. (d.b.a Farmers Underwriters Association) as the parent:
Farmers Group, Inc. (d.b.a. Farmers Underwriters Association)
Truck Underwriters Association
Fire Underwriters Association
FIG Holding Company
FIG Leasing Company, Inc.
Farmers Services Corporation
Farmers Underwriters Association
Farmers Reinsurance Company
Kraft Lake Insurance Agency, Inc.
Western Star Insurance Services, Inc.
Farmers General Insurance Agency, Inc
The method of allocation between the companies is subject to a written agreement, which has been approved by the Board of Directors. Allocation is based upon separate
return calculations with an immediate benefit for a taxable loss which is utilized in the current year consolidated return. Intercompany tax balances are settled annually within 30 days after the filing of the consolidated federal income tax
return, the payment of an estimated payment, an additional assessment of the consolidated tax liability, a refund of the consolidated tax liability or any other reduction to the member’s apportioned tax liability in accordance with the tax
sharing agreement.
The Company adheres to the provisions of the Life Insurance Company Income Tax Act of 1959 as amended by the 1984 and 1986 Tax Reform Acts.
The significant tax jurisdiction for the Company is U.S. federal tax. The tax years prior to 2015 and 2019 for U.S. federal tax are closed to tax authority
examinations. The Farmers Group Inc. consolidated tax group is currently under examination by the Internal Revenue Service for years 2015, 2016, 2017, and 2018.
The Company records any potential net interest and penalties in the income tax expense component of the statement of operations.
The Company does not have any tax loss contingencies for which it is reasonably possible that the total liability will significantly increase within twelve months of
the reporting date.
34
Farmers New World Life Insurance Company
(A wholly owned subsidiary of Farmers Group, Inc.)
Notes to Statutory Financial Statements
For the Years Ended December 31, 2024, 2023 and 2022
During 2024 and 2023, the Company did not accrue any interest and penalties related to income tax contingencies.
The Company does not have any liability for Repatriation Tax.
The Company does not have any Alternative Minimum Tax Credits.
On August 16, 2022, the Inflation Reduction Act of 2022 was signed into law by President Biden. The Act includes a new federal corporate alternative minimum tax (CAMT),
effective in 2023, that is based on the adjusted financial statement income set forth on the applicable financial statement of an applicable corporation.
The CAMT applies to companies with average annual book income exceeding $1 billion and assesses a 15% tax on financial statement income (adjusted for certain items)
based on the applicable financial statement to the extent that amount exceeds the regular corporate tax.
The Company is an applicable reporting entity. The controlled group of corporations of which the Company is a member has determined that it is an applicable
corporation. However, the Company has determined that it does not have a CAMT liability based on the current information.
The Accounting policy election is to disregard CAMT when evaluating the need for a valuation allowance for its non-CAMT deferred tax assets.
11. Contingencies
The Company is subject to guaranty fund and other assessments by the states in which it writes business. Guaranty fund assessments are accrued at the time of
insolvencies as they become known to the Company if they are material. Other assessments are accrued at the time of assessment, or, in the case of loss-based assessments, at the time the losses are incurred. Based upon information provided by
the National Organization of Life and Health Insurance Guaranty Associations (NOLHGA), the Company has accrued liabilities for guaranty fund assessments of $1,277,000 and $1,266,000 for December 31, 2024 and December 31, 2023, respectively; and
related premium tax benefit assets of $944,000 and
$911,000 for December 31, 2024 and December 31, 2023, respectively. The amounts represent management's best estimates based on information received from the states in
which the Company writes business and may change due to many factors including the Company's share of the ultimate cost of current insolvencies.
The Company is periodically subject to lawsuits arising from the normal course of its business activities. These actions are in various stages of discovery and
development, and some seek punitive as well as compensatory damages. The Company intends to vigorously defend its position in each case, and management believes that, while it is not possible to predict the outcome of such matters with absolute
certainty, ultimate disposition of these proceedings should not have a material adverse effect on the Company’s statements of assets, liabilities, capital and surplus, results of operations or cash flows.
35
Farmers New World Life Insurance Company
(A wholly owned subsidiary of Farmers Group, Inc.)
Notes to Statutory Financial Statements
For the Years Ended December 31, 2024, 2023 and 2022
12. Commitments
Statutory guidance provides that an operating expense lease should be recognized on a straight‑line basis over the lease term, even if payments are not made on a
straight-line basis.
As of December 31, 2024, the total minimum aggregate rental commitment for the length of the lease period was $7,904,000, the future minimum rental payments required by
leases are as follows:
(in thousands of dollars)
|
Years Ending December 31,
|
|
|
2025
|
$ 1,824
|
|
2026
|
1,824
|
|
2027
|
1,824
|
|
2028
|
1,824
|
|
2029 & later
|
608
|
|
Total future minimum payments required
|
$ 7,904
|
The following schedule shows the composition of total rental expense for all operating leases except those with terms of a month or less that were not renewed:
(in thousands of dollars)
|
Years Ending December 31,
|
||||
|
2024
|
2023
|
2022
|
||
|
Minimum rentals
|
$ 1,824
|
$ 2,037
|
$ 2,336
|
|
|
Less: Sublease rentals
|
-
|
-
|
-
|
|
|
$ 1,824
|
$ 2,037
|
$ 2,336
|
||
13. Separate Accounts
The Company is licensed to issue VUL and deferred variable annuity contracts although it suspended issuance of “new” VUL and variable annuities, effective February
28, 2024, and September 30, 2012, respectively. The assets and liabilities held for VUL, Farmers EssentialLife VUL, Accumulator VUL and deferred variable annuity contracts are held in the Accounts, which are legally segregated from the
general assets of the Company. As of December 31, 2024, there were 33 subaccounts available for the VUL products, 43 subaccounts available for variable annuity, 38 subaccounts available for Farmers EssentialLife VUL and 21 subaccounts
available for the Accumulator VUL product. The sub-accounts invest in underlying mutual fund portfolios. Shares of each portfolio are purchased and redeemed at net asset value, without a sales charge. Any dividends and distributions from a
portfolio are reinvested at net asset value in shares of that same portfolio. The deposits collected for variable contracts are invested at the direction of the contract holders in the subaccounts that comprise the Accounts. Absent any
contract provisions wherein the Company contractually guarantees either a minimum return or account value, the contract holders bear the investment risk that the subaccounts may not meet their stated objectives. The assets of the Accounts are
carried at fair value. The Accounts’ liabilities represent the contract holders’ claims to the related assets. Investment income and realized capital gains and losses of the Accounts accrue directly to the contract holders and, therefore, are
not included in the Company’s statutory basis statements of operations. Mortality, policy administration, and surrender charges to all accounts are included in the revenues of the Company.
36
Farmers New World Life Insurance Company
(A wholly owned subsidiary of Farmers Group, Inc.)
Notes to Statutory Financial Statements
For the Years Ended December 31, 2024, 2023 and 2022
As of December 31, 2024, the separate account assets that are legally insulated from the general account claims are as follows:
(in thousands of dollars)
|
Legally Insulated Assets
|
|
|
Farmers Variable Annuity
|
$ 186,406
|
|
Farmers Variable Universal Life
|
522,699
|
|
Farmers LifeAccumulator VUL
|
35,460
|
|
Farmers EssentialLife VUL
|
677,907
|
|
$ 1,422,472
|
Only the Company’s Variable Annuity has separate account products with guarantees backed by the general account. The maximum guarantee for separate account products as
of December 31, 2024 is
$275,032,000. The fund value is $270,037,000. The maximum guaranteed excess is $4,995,000.
The risk charges paid by the separate account to the general account for the past five years as compensation for the risk taken by the general account are as follows:
|
(in thousands of dollars)
|
|
|
Year
|
Risk Charges
|
|
2024
|
$ 262
|
|
2023
|
241
|
|
2022
|
281
|
|
2021
|
309
|
|
2020
|
289
|
The amounts paid by the general account due to separate account guarantees during the past five years consisted of the following:
|
(in thousands of dollars)
|
Separate Account
Guarantees
|
|
Year
|
|
|
2024
|
$ 66
|
|
2023
|
75
|
|
2022
|
41
|
|
2021
|
26
|
|
2020
|
7
|
Premiums, considerations, or deposits received for the years ended December 31, 2024, 2023 and 2022, were approximately $119,410,000, $122,694,000 and $125,540,000,
respectively.
37
Farmers New World Life Insurance Company
(A wholly owned subsidiary of Farmers Group, Inc.)
Notes to Statutory Financial Statements
For the Years Ended December 31, 2024, 2023 and 2022
Reserves for accounts with assets as of December 31, 2024 and 2023, at market value are approximately
$1,416,104,000 and $1,235,168,000, respectively. The entire reserve amount is subject to discretionary withdrawal. Since all investment returns are credited directly to
the policyholders, no reserves are held for asset default risk in lieu of AVR.
A reconciliation of net transfers to separate accounts for the years ended December 31, 2024, 2023 and 2022 is as follows:
|
(in thousands of dollars)
|
2024
|
2023
|
2022
|
||
|
Transfers (from)/to as reported in the statements of operations of the separate accounts
|
$ (32,342)
|
$ (9,674)
|
$ 15,032
|
||
|
Less: Sundry general income/(expense)
|
98
|
536
|
(112)
|
||
|
Transfers ceded to Reinsurer
|
32,244
|
17,016
|
14,484
|
||
|
Net transfers (from)/to separate accounts
|
$ -
|
$ 7,878
|
$ 29,404
|
14. Premium and Annuity Considerations Deferred and Uncollected
There are no deferred and uncollected life and accident and health insurance premiums and annuity considerations as of December 31, 2024 and 2023.
15. Analysis of Annuity Actuarial Reserves and Deposit-Type Liabilities By Withdrawal Characteristics
The following is the analysis of annuity actuarial reserves and deposit-type liabilities by withdrawal characteristics as of December 31, 2024 and 2023.
|
Individual Annuities
|
|
2024
|
||||||
|
(in thousands of dollars)
|
|
|
|
|
|
|
|
|
|
|
|
General
Account
|
|
Separate Account
with Guarantees
|
|
Total
|
|
% of Total
|
|
Subject to discretionary withdrawal:
At book value less current surrender charge of 5% or more
|
|
$ 83,425
|
|
$ -
|
|
$ 83,425
|
|
5.2 %
|
|
At fair value
|
-
|
186,047
|
186,047
|
11.7
|
||||
|
Total with market value adjustment or at fair value
|
83,425
|
186,047
|
269,472
|
16.9
|
||||
|
At book value without adjustment
(minimal or no charge or adjustment)
|
|
1,051,602
|
|
-
|
|
1,051,602
|
|
66.0
|
|
Not subject to discretionary withdrawal
|
|
271,792
|
|
-
|
|
271,792
|
|
17.1
|
|
Total
|
|
1,406,819
|
|
186,047
|
|
1,592,866
|
|
100.00%
|
|
Reinsurance ceded
|
|
1,405,526
|
|
-
|
|
1,405,526
|
|
|
|
Total (net)
|
|
$ 1,293
|
|
186,047
|
|
$ 187,340
|
|
|
|
With current surrender charge of 5% or more that will have less than 5% surrender charge in the subsequent year
|
|
0
|
|
-
|
|
0
|
|
|
|
Deposit-Type Contracts
|
|
|
|
|
|
|
|
|
|
(in thousands of dollars)
|
|
2024
|
||||||
|
|
|
|
|
|
|
|
|
|
|
|
|
General
Account
|
|
Separate Account
with Guarantees
|
|
Total
|
|
% of Total
|
|
Subject to discretionary withdrawal:
At book value less current surrender charge of 5% or more
|
|
$ -
|
|
$ -
|
|
$ -
|
|
0.0 %
|
|
At fair value
|
|
-
|
|
$ -
|
|
-
|
|
0.0
|
|
Total with market value adjustment or at fair value
|
|
-
|
|
$ -
|
|
-
|
|
0.0
|
|
At book value without adjustment
|
|
|
|
$ -
|
|
|
|
|
|
(minimal or no charge or adjustment)
|
|
265,982
|
|
$ -
|
|
265,982
|
|
68.4
|
|
Not subject to discretionary withdrawal
|
|
122,661
|
|
$ -
|
|
122,661
|
|
31.6
|
|
Total
|
|
388,643
|
|
$ -
|
|
388,643
|
|
100.0%
|
|
Reinsurance ceded
|
|
388,643
|
|
$ -
|
|
388,643
|
|
|
|
Total (net)
|
|
|
|
$ -
|
|
|
|
|
|
With current surrender charge of 5% or more that will have less than 5% surrender charge in the subsequent year
|
|
-
|
|
-
|
|
-
|
|
|
|
|
|
|
|
|
|
|
|
|
38
Farmers New World Life Insurance Company
(A wholly owned subsidiary of Farmers Group, Inc.)
Notes to Statutory Financial Statements
For the Years Ended December 31, 2024, 2023 and 2022
|
Individual Annuities
|
2023
|
|||||||
|
(in thousands of dollars)
|
||||||||
|
General
Account
|
Separate Account
with Guarantees
|
Total
|
% of Total
|
|||||
|
Subject to discretionary withdrawal:
At book value less current surrender charge of 5% or more
|
$ 95, 864
|
$ -
|
$ 95, 864
|
5.6 %
|
||||
|
At fair value
|
-
|
178,420
|
178,420
|
10.5
|
||||
|
Total with market value adjustment or at fair value
|
95, 864
|
178,420
|
274,284
|
16.1
|
||||
|
At book value without adjustment
(minimal or no charge or adjustment)
|
1,152,294
|
-
|
1,152,294
|
67.6
|
||||
|
Not subject to discretionary withdrawal
|
278,738
|
-
|
278,738
|
16.3
|
||||
|
Total
|
1,526,896
|
178,420
|
1,705,316
|
100.00%
|
||||
|
Reinsurance ceded
|
1,525,301
|
-
|
1,525,301
|
|||||
|
Total (net)
|
$ 1,595
|
178,420
|
$ 180,015
|
|||||
|
With current surrender charge of 5% or more that will have less than 5% surrender charge in the subsequent year
|
0
|
-
|
0
|
|||||
|
Deposit-Type Contracts
|
||||||||
|
(in thousands of dollars)
|
2023
|
|||||||
|
General
Account
|
Separate Account
with Guarantees
|
Total
|
% of Total
|
|||||
|
Subject to discretionary withdrawal:
At book value less current surrender charge of 5% or more
|
$ -
|
$ -
|
$ -
|
0.0 %
|
||||
|
At fair value
|
-
|
$ -
|
-
|
0.0
|
||||
|
Total with market value adjustment or at fair value
|
-
|
$ -
|
-
|
0.0
|
||||
|
At book value without adjustment
|
$ -
|
|||||||
|
(minimal or no charge or adjustment)
|
285,667
|
$ -
|
285,667
|
68.0
|
||||
|
Not subject to discretionary withdrawal
|
134,283
|
$ -
|
134,283
|
32.0
|
||||
|
Total
|
419,950
|
$ -
|
419,950
|
100.0%
|
||||
|
Reinsurance ceded
|
419,950
|
$ -
|
419,950
|
|||||
|
Total (net)
|
$ -
|
|||||||
|
With current surrender charge of 5% or more that will have less than 5% surrender charge in the subsequent year
|
-
|
-
|
-
|
|||||
39
Farmers New World Life Insurance Company
(A wholly owned subsidiary of Farmers Group, Inc.)
Notes to Statutory Financial Statements
For the Years Ended December 31, 2024, 2023 and 2022
|
Reconciliation
|
2024
|
2023
|
|||||
|
(in thousands of dollars)
|
|||||||
|
Life and Accident & Health Annual Statement:
|
|||||||
|
Exhibit 5, Annuities Section, Total (net)
|
$ - |
|
$ - |
-
|
|||
|
Exhibit 5, Supplementary Contracts w/Life
Contigencies Section, Total (net)
|
- |
|
- |
|
|||
|
Exhibit 5, Miscellaneous Section, Additional Actuarial Reserves - AG43
Exhibit 7, Deposit - Type Contracts, Line 14, Col. 1
|
1,293
-
|
1,595
-
|
|||||
|
Subtotal
|
1,293
|
1,595
|
|||||
|
Separate Accounts Annual Statement:
Exhibit 3, Line 0299999, Col. 2
Exhibit 3, Line 0399999, Col. 2
Policyholder dividend & coupon accumulations
Policyholder premiums
Guaranteed interest contracts
|
186,047
-
-
-
-
|
178,420
-
-
-
-
|
|||||
|
Other contract deposit funds
|
-
|
-
|
|||||
|
186,047
|
178,420
|
||||||
|
Combined Total
|
$ 187,340
|
$ 180,015
|
|||||
The following is the analysis of life actuarial reserves by withdrawal characteristics as of December 31, 2024 and 2023:
|
Life
(in thousands of dollars)
|
2024
|
|||||
|
General Account
|
||||||
|
General Account
|
Account Value
|
Cash Value
|
Reserve
|
|||
|
Subject to Discretionary Withdrawal, Surrender Values or Policy Loans:
Term policies with cash value
|
$ 13,634
|
$ 13,634
|
$ 15,187
|
|||
|
Universal Life
|
1,914,737
|
1,911,938
|
1,942,909
|
|||
|
Universal Life with Secondary Guarantees
Indexed Universal Life
Indexed Universal Life with Secondary Guarantees
Indexed Life
Other Permanent Cash Value Life Insurance
Variable Lfie
Variable Universal Life
Miscellaneous Reserves |
301,769
-
323,454
-
754,089
-
141,739
-
|
290,287
-
207,880
-
754,089
-
140,159
-
|
317,061
-
370,912
-
926,466
-
147,173 -
|
|||
|
Not Subject to Discretionary Withdrawal or Cash Values:
Term Policies without Cash Value
|
-
|
-
|
2,015,254
|
|||
|
Accidental Death Benefits
|
-
|
-
|
3,154
|
|||
|
Disability - Active Lives
|
-
|
-
|
25,941
|
|||
|
Disability - Disabled Lives
|
-
|
-
|
28,641
|
|||
|
Miscellaneous Reserves
|
-
|
-
|
36,849
|
|||
|
Total
|
3,449,422
|
3,317,987
|
5,829,547
|
|||
|
Reinsurance ceded
|
3,449,422
|
3,317,987
|
5,698,008
|
|||
|
Total (net)
|
$ -
|
$ -
|
$ 131,539
|
|||
40
Farmers New World Life Insurance Company
(A wholly owned subsidiary of Farmers Group, Inc.)
Notes to Statutory Financial Statements
For the Years Ended December 31, 2024, 2023 and 2022
|
Life
|
|||||||
|
(in thousands of dollars)
|
2024
|
||||||
|
Separate Account
|
|||||||
|
Account
|
Cash
|
||||||
|
Separate Account with Nonguarantees
|
Value
|
Value
|
Reserve
|
||||
|
Subject to Discretionary Withdrawal:
|
|||||||
|
Term policies with cash value
|
$ -
|
$ -
|
$ -
|
||||
|
Universal With market value adjustment
|
-
|
-
|
-
|
||||
|
Universal Life with Secondary Guarantees
|
-
|
-
|
-
|
||||
|
Indexed Universal Life
|
-
|
-
|
-
|
||||
|
Indexed Universal Life with Secondary Guarantees
|
-
|
-
|
-
|
||||
|
Indexed Life
|
-
|
-
|
-
|
||||
|
Other Permanent Cash Value Life Insurance
|
-
|
-
|
-
|
||||
|
Variable Lfie
|
-
|
-
|
-
|
||||
|
Variable Universal Life
|
1,235,999
|
1,205,291
|
1,230,057
|
||||
|
Miscellaneous Reserves
|
-
|
-
|
-
|
||||
|
Not Subject to Discretionary Withdrawal:
|
|||||||
|
Term Policies without Cash Value
|
-
|
-
|
-
|
||||
|
Accident With market value adjustment
|
-
|
-
|
-
|
||||
|
Disability - Active Lives
|
-
|
-
|
-
|
||||
|
Disability - Disabled Lives
|
-
|
-
|
-
|
||||
|
Miscellaneous Reserves
|
-
|
-
|
-
|
||||
|
Total
|
1,235,999
|
1,205,291
|
1,230,057
|
||||
|
Reinsurance ceded
|
-
|
||||||
|
Total (net)
|
1,235,999
|
1,205,291
|
1,230,057
|
||||
41
(A wholly owned subsidiary of Farmers Group, Inc.)
Notes to Statutory Financial Statements
For the Years Ended December 31, 2024, 2023 and 2022
|
Life
|
|||||||
|
(in thousands of dollars)
|
2023
|
||||||
|
General Account
|
|||||||
|
Account
|
Cash
|
||||||
|
General Account
|
Value
|
Value
|
Reserve
|
||||
|
Subject to Discretionary Withdrawal, Surrender Values or Policy Loans:
|
|||||||
|
Term policies with cash value
|
$ 13,147
|
$ 13,147
|
$ 14,675
|
||||
|
Universal Life
|
1,953,918
|
1,950,879
|
1,983,052
|
||||
|
Universal Life with Secondary Guarantees
|
282,592
|
269,180
|
297,969
|
||||
|
Indexed Universal Life
|
-
|
-
|
-
|
||||
|
Indexed Universal Life with Secondary Guarantees
|
251,538
|
155,419
|
313,166
|
||||
|
Indexed Life
|
-
|
-
|
-
|
||||
|
Other Permanent Cash Value Life Insurance
|
740,770
|
740,770
|
909,341
|
||||
|
Variable Lfie
|
-
|
-
|
-
|
||||
|
Variable Universal Life
|
127,537
|
125,801
|
131,871
|
||||
|
Miscellaneous Reserves
|
-
|
-
|
-
|
||||
|
Not Subject to Discretionary Withdrawal or Cash Values:
|
|||||||
|
Term Policies without Cash Value
|
-
|
-
|
2,063,918
|
||||
|
Accident Death Benefits
|
-
|
-
|
3,239
|
||||
|
Disability - Active Lives
|
-
|
-
|
26,561
|
||||
|
Disability - Disabled Lives
|
-
|
-
|
28,694
|
||||
|
Miscellaneous Reserves
|
-
|
-
|
35,666
|
||||
|
Total
|
3,369,502
|
3,255,196
|
5,808,152
|
||||
|
Reinsurance ceded
|
3,369,502
|
3,255,196
|
5,670,897
|
||||
|
Total (net)
|
$ -
|
$ -
|
$ 137,255
|
||||
42
Farmers New World Life Insurance Company
(A wholly owned subsidiary of Farmers Group, Inc.)
Notes to Statutory Financial Statements
For the Years Ended December 31, 2024, 2023 and 2022
|
Life
|
|||||||
|
(in thousands of dollars)
|
2023
|
||||||
|
Separate Account
|
|||||||
|
Account
|
Cash
|
||||||
|
Separate Account with Nonguarantees
|
Value
|
Value
|
Reserve
|
||||
|
Subject to Discretionary Withdrawal, Surrender Values or Policy Loans:
|
|||||||
|
Term policies with cash value
|
$ -
|
$ -
|
$ -
|
||||
|
Universal Life
|
-
|
-
|
-
|
||||
|
Universal Life with Secondary Guarantees
|
-
|
-
|
-
|
||||
|
Indexed Universal Life
|
-
|
-
|
-
|
||||
|
Indexed Universal Life with Secondary Guarantees
|
-
|
-
|
-
|
||||
|
Indexed Life
|
-
|
-
|
-
|
||||
|
Other Permanent Cash Value Life Insurance
|
-
|
-
|
-
|
||||
|
Variable Lfie
|
-
|
-
|
-
|
||||
|
Variable Universal Life
|
1,066,065
|
1,028,430
|
1,056,748
|
||||
|
Miscellaneous Reserves
|
-
|
-
|
-
|
||||
|
Not Subject to Discretionary Withdrawal or Cash Values:
|
|||||||
|
Term Policies without Cash Value
|
-
|
-
|
-
|
||||
|
Accidental Death Benefits
|
-
|
-
|
-
|
||||
|
Disability - Active Lives
|
-
|
-
|
-
|
||||
|
Disability - Disabled Lives
|
-
|
-
|
-
|
||||
|
Miscellaneous Reserves
|
-
|
-
|
-
|
||||
|
Total
|
1,066,065
|
1,028,430
|
1,056,748
|
||||
|
Reinsurance ceded
|
-
|
||||||
|
Total (net)
|
1,066,065
|
1,028,430
|
1,056,748
|
||||
|
Reconciliation
|
2024
|
2023
|
|
|
(in thousands of dollars)
|
|||
|
Life and Accident & Health Annual Statement:
Exhibit 5, Life Insurance Section, Total (net)
|
$ 131,539
|
$ 137,255
|
|
|
Exhibit 5, Accidental Death Benefits Section, Total (net)
Exhibit 5, Disability - Acitve Lives Section, Total (net)
Exhibit 5, Disability - Disabled Lives Section, Total (net)
Exhibit 5, Miscellaneous Reserves Section, Total (net)
|
-
-
-
-
|
-
-
-
-
|
|
|
Subtotal
|
131,539
|
137,255
|
|
|
Separate Accounts Annual Statement:
|
|||
|
Exhibit 3, Line 0199999, Col. 2
Exhibit 3, Line 0499999, Col. 2
Exhibit 3, Line 0599999, Col. 2
|
1,230,057
-
-
|
1,056,748
-
-
|
|
|
Subtotal (Lines (7) through (9)
|
1,230,057
|
1,056,748
|
|
|
Combined Total
|
$ 1,361,596
|
$ 1,194,003
|
43
Farmers New World Life Insurance Company
(A wholly owned subsidiary of Farmers Group, Inc.)
Notes to Statutory Financial Statements
For the Years Ended December 31, 2024, 2023 and 2022
16. Subsequent Events
No material subsequent events have occurred since December 31, 2024 through April 28 2025, the date at which the financial statements were issued, that would require adjustment to the financial statements.
17. Reconciliation to Annual Statement
For December 31, 2023, and 2022 there is an annual statement to audited statement adjustment for the statutory statements of operations related to a reclass of the variable annuity ceded separate account activity. As of 2024 reporting, the
Company began netting the variable portions of the ceded separate account activities for the variable annuity products within the line items they occurred as opposed to having these net through the transfer to separate account line. The
differences in the 3 line items that ultimately had a net zero effect on line 29 net for gain from operations as seen in the table below:
|
Statutory Statements of Operations
(in thousands of dollars)
|
2023 as reported in annual statements
|
2023 as reported in audited financial statements
|
2022 as reported in annual statements
|
2022 as reported in
audited financial statements
|
|
|
1.
|
Premiums collected net of reinsurance
|
$ (4,290,661)
|
$ (4,291,652)
|
$ 535,881
|
$ 534,530
|
|
15.
|
Surrender benefits and withdrawals for life contracts
|
$ 109,128
|
$ 88,983
|
$ 153,954
|
$ 139,933
|
|
26.
|
Net transfers to or (from) Separate Accounts net of reinsurance
|
$ (11,190)
|
$ 7,964
|
$ 16,798
|
$ 29,468
|
|
29.
|
Net gain from operations before dividends to policyholders, refunds to members and federal income taxes
|
$ 1,790,460
|
$ 1,790,460
|
$ 176,691
|
$ 176,691
|
44
Farmers Variable Life
Separate Account A of Farmers New World Life Insurance Company
(A Wholly Owned Subsidiary of Farmers Group, Inc.)
Financial Statements
December 31, 2024