| | | | | | | | |
| | |
| Financial Supplement | First Quarter 2025 |
| | | | | |
| Table of Contents | PAGE |
| |
| Corporate Profile | |
| Earnings Release (including guidance information) | |
| |
| Financial Information | |
Condensed Consolidated Balance Sheets | |
Condensed Consolidated Statements of Operations | |
| Reconciliation of Net (Loss) Income to NAREIT FFO, Core FFO and Adjusted FFO | |
| Reconciliation of Net (Loss) Income to NAREIT EBITDAre and Core EBITDA | |
| Debt Detail and Maturities | |
| |
| Operations Overview | |
| Global Warehouse Portfolio | |
| Fixed Commitment and Lease Maturity Schedules | |
Capital Expenditures and Repair and Maintenance Expenses | |
| |
| External Growth and Capital Deployment | |
| |
Other Supplemental Information | |
Same Store Historical Performance Trend | |
Unconsolidated Joint Ventures (Investments in Partially Owned Entities) | |
| |
Reconciliations, Notes and Definitions | |
Revenues and Contribution (NOI) by Segment | |
Notes and Definitions | |
| | | | | | | | |
| | |
| Financial Supplement | First Quarter 2025 |
Corporate Profile
Americold is a global leader in temperature-controlled logistics real estate and value-added services. Focused on the ownership, operation, acquisition and development of temperature-controlled warehouses, Americold owns and/or operates 238 temperature-controlled warehouses, with approximately 1.4 billion refrigerated cubic feet of storage, in North America, Europe, Asia-Pacific, and South America. Americold’s facilities are an integral component of the supply chain connecting food producers, processors, distributors and retailers to consumers.
Corporate Headquarters
10 Glenlake Parkway, Suite 600, South Tower
Atlanta, Georgia 30328
Telephone: (678) 441-1400
Website: www.americold.com
Senior Management
George F. Chappelle, Jr.: Chief Executive Officer and Director
E. Jay Wells: Chief Financial Officer and Executive Vice President
Robert S. Chambers: President, Americas
Richard C. Winnall: President, International
Samantha L. Charleston: Chief Human Resources Officer and Executive Vice President
Nathan H. Harwell: Chief Legal Officer and Executive Vice President
R. Scott Henderson: Chief Investment Officer and Executive Vice President
Michael P. Spires: Chief Information Officer and Executive Vice President
M. Bryan Verbarendse: Chief Operating Officer - North America and Executive Vice President
Robert E. Harris, Jr.: Chief Accounting Officer and Senior Vice President
Board of Directors
Mark R. Patterson: Chairman of the Board of Directors
George J. Alburger, Jr.: Director
Kelly H. Barrett: Director
Robert L. Bass: Director
George F. Chappelle, Jr.: Chief Executive Officer and Director
Antonio F. Fernandez: Director
Pamela K. Kohn: Director
David J. Neithercut: Director
Andrew P. Power: Director
Investor Relations
To request more information or to be added to our e-mail distribution list, please visit the investors section of our website: www.americold.com
Investor Relations
Telephone: 678-459-1959
Email: investor.relations@americold.com
| | | | | | | | |
| | |
| Financial Supplement | First Quarter 2025 |
| | | | | | | | | | | | | | |
| Analyst Coverage | | | | |
| | | | |
| Firm | Analyst Name | Contact | Email | |
| Baird Equity Research | Nicholas Thillman | 414-298-5053 | nthillman@rwbaird.com | |
| Bank of America Merrill Lynch | Samir Khanal | 646-855-1497 | samir.khanal@bofa.com | |
| Barclays | Brendan Lynch | 212-526-9428 | brendan.lynch@barclays.com | |
| BNP Paribas Exane Research | Nate Crossett | 646-725-3716 | nate.crossett@exanebnpparibas.com | |
| Citi | Craig Mailman | 212-816-4471 | craig.mailman@citi.com | |
| Evercore ISI | Steve Sakwa/
Michael Griffin | 212-446-9462 / 212-752-0886 | steve.sakwa@evercoreisi.com / michael.griffin@evercoreisi.com | |
| Green Street Advisors | Vince Tibone | 949-640-8780 | vtibone@greenstreet.com | |
| J.P. Morgan | Michael W. Mueller | 212-622-6689 | michael.w.mueller@jpmorgan.com | |
| KeyBanc | Todd Thomas | 917-368-2286 | tthomas@key.com | |
| MorningStar Research Services | Suryansh Sharma | 314-585-6793 | suryansh.sharma@morningstar.com | |
| Raymond James | Jonathan Hughes | 727-567-2438 | jonathan.hughes@raymondjames.com | |
| RBC | Michael Carroll | 440-715-2649 | michael.carroll@rbccm.com | |
Scotiabank | Greg McGinniss | 212-225-6906 | greg.mcginniss@scotiabank.com | |
| Truist | Ki Bin Kim | 212-303-4124 | kibin.kim@truist.com | |
Wells Fargo Securities | Blaine Heck | 410-662-2556 | blaine.heck@wellsfargo.com | |
| Wolfe Research | Andrew Rosivach | 646-582-9250 | arosivach@wolferesearch.com | |
Stock Listing Information
The shares of Americold Realty Trust, Inc. are traded on the New York Stock Exchange under the symbol “COLD”.
Credit Ratings
| | | | | | | | |
| DBRS Morningstar | | |
| Credit Rating: | BBB | (Positive Trend) |
| | |
| Fitch | | |
| Issuer Default Rating: | BBB | (Stable Outlook) |
| | |
| Moody’s | | |
| Issuer Rating: | Baa3 | (Stable Outlook) |
These credit ratings may not reflect the potential impact of risks relating to the structure or trading of the Company’s securities and are provided solely for informational purposes. Credit ratings are not recommendations to buy, hold or sell any security, and may be revised or withdrawn at any time by the issuing rating agency at its sole discretion. The Company does not undertake any obligation to maintain the ratings or to advise of any change in ratings. Each agency’s rating should be evaluated independently of any other agency’s rating. An explanation of the significance of the ratings may be obtained from each of the rating agencies.
| | | | | | | | |
| | |
| Financial Supplement | First Quarter 2025 |
AMERICOLD ANNOUNCES FIRST QUARTER 2025 RESULTS
Delivered $0.34 AFFO per share
Completed Houston Warehouse Acquisition Enabling a Significant New Retail Customer Win
Increased Quarterly Dividend by 5%
Updated 2025 Full-Year Outlook
Atlanta, GA, May 8, 2025 - Americold Realty Trust, Inc. (NYSE: COLD) (the “Company”), a global leader in temperature-controlled logistics, real estate, and value-added services focused on the ownership, operation, acquisition and development of temperature-controlled warehouses, today announced financial and operating results for the first quarter ended March 31, 2025.
George Chappelle, Chief Executive Officer of Americold Realty Trust, stated, “We are pleased with our first quarter 2025 results, which included delivering AFFO of $0.34 per share in line with expectations. This performance was enabled by our successful efforts over the past three years to create a more stable and productive workforce, as well as the enhancements we have made to our technology and operating platforms. We believe these initiatives have created a more solid and resilient foundation that allows us to effectively navigate in the current operating environment and positions us well for the long term.”
“We are continuing to make investments in our future and I’m particularly excited about the Houston acquisition which closed during the first quarter. The catalyst for this acquisition was a new fixed commitment contract with one of the world’s largest retailers, a significant win from our sales pipeline. The purchase of this facility allowed us to move inventory from an existing location into the newly acquired site, thereby opening space for this new customer and allowing for a more efficient allocation of inventory across both sites. Retail business is a key focus for us and customers continue to recognize Americold for our service and rigorous operational standards. This win further expands our industry-leading presence in the important retail segment of the market that requires the operational expertise that our platform provides.”
“In response to current headwinds created by the current macro-economic environment, we are prudently adjusting our near-term outlook, while remaining confident in our long-term growth trajectory. We believe the fundamentals of the cold storage industry remain attractive, and during the first quarter we increased our dividend by 5% to reflect our confidence in Americold’s resiliency and strong cash flow generation. I want to thank our experienced and talented team for their strong execution as we continue to successfully navigate through these evolving market conditions.”
First Quarter 2025 Highlights
•Total revenues of $629.0 million, a 5.4% decrease from $665.0 million in Q1 2024 and a decrease of 4.4% on a constant currency basis.
•Net loss of $16.5 million, or $0.06 loss per diluted share, as compared to net income per diluted share of $0.03 in Q1 2024.
•Global Warehouse segment same store revenues decreased 2.3% on an actual basis and decreased 1.4% on a constant currency basis as compared to Q1 2024.
•Global Warehouse same store services margin increased to 11.3% from 10.1% in Q1 2024.
•Global Warehouse segment same store NOI decreased 4.2%, or 3.4% on a constant currency basis, as compared to Q1 2024.
•Adjusted FFO of $95.7 million, or $0.34 per diluted common share, a 9.0% decrease from Q1 2024 Adjusted FFO per diluted common share.
•Core EBITDA of $147.6 million, decreased $8.2 million, or 5.3% (4.6% on a constant currency basis) from $155.8 million in Q1 2024.
•Core EBITDA margin of 23.5%, increased from 23.4% in Q1 2024.
| | | | | | | | |
| | |
| Financial Supplement | First Quarter 2025 |
2025 Outlook
The table below includes the details of our annual guidance. The Company’s guidance is provided for informational purposes based on current plans and assumptions and is subject to change. The ranges for these metrics do not include the impact of acquisitions, dispositions, or capital markets activity beyond that which has been previously announced.
| | | | | | | | |
| As of |
| May 8, 2025 | February 20, 2025 |
Warehouse segment same store revenue growth (constant currency) | 0.0% - 2.0% | 2.0% - 4.0% |
Warehouse segment same store NOI growth (constant currency) | 100 bps higher than associated revenues | 200 bps higher than associated revenues |
Warehouse segment non-same store NOI | $7M - $13M | $0M - $7M |
Transportation and Third-Party Managed segment NOI | $40M - $44M | $44M - $48M |
Total selling, general and administrative expense (guidance as of May 8, 2025 is inclusive of share-based compensation expense of $29M - $31M and $11M - $13M of Project Orion amortization) | $270M - $280M | $280M - $289M |
| Interest expense | $153M - $157M | $145M - $150M |
| Current income tax expense | $8M - $10M | $8M - $10M |
| Non real estate depreciation and amortization expense | $139M - $149M | $139M - $149M |
| Total maintenance capital expenditures | $80M - $85M | $82M - $88M |
Development starts(1) | $200M - $300M | $200M - $300M |
Adjusted FFO per share | $1.42 - $1.52 | $1.51 - $1.59 |
(1)Represents the aggregate invested capital for initiated development opportunities.
Investor Webcast and Conference Call
The Company will hold a webcast and conference call on Thursday, May 8, 2025 at 8:00 a.m. Eastern Time to discuss its first quarter 2025 results. A live webcast of the call will be available via the Investors section of Americold Realty Trust’s website at www.americold.com. To listen to the live webcast, please go to the site at least fifteen minutes prior to the scheduled start time in order to register, download and install any necessary audio software. Shortly after the call, a replay of the webcast will be available for 90 days on the Company’s website.
The conference call can also be accessed by dialing 1-877-407-3982 or 1-201-493-6780. The telephone replay can be accessed by dialing 1-844-512-2921 or 1-412-317-6671 and providing the conference ID#13750775. The telephone replay will be available starting shortly after the call until May 22, 2025.
The Company’s supplemental package will be available prior to the conference call in the Investors section of the Company’s website at http://ir.americold.com.
During the conference call, the Company may discuss and answer questions concerning business and financial developments and trends that have occurred after quarter-end. The Company’s responses to questions, as well as other matters discussed during the conference call, may contain or constitute information that has not been disclosed previously.
First Quarter 2025 Total Company Financial Results
Total revenues for the first quarter of 2025 were $629.0 million, a 5.4% decrease from $665.0 million in the same quarter of the prior year, primarily due to lower volumes in the warehouse segment and a decrease in transportation services revenue.
Total NOI for the first quarter of 2025 was $205.8 million, a decrease of 2.4% (1.5% decrease on a constant currency basis) from the same quarter of the prior year. This decrease is primarily related to a decrease in transportation NOI which was primarily due to customer exits.
| | | | | | | | |
| | |
| Financial Supplement | First Quarter 2025 |
For the first quarter of 2025, the Company reported a net loss of $16.5 million, or $0.06 loss per diluted share, compared to a net income of $9.8 million, or $0.03 income per diluted share, for the comparable quarter of the prior year. This was primarily driven by an increase in closed site related charges recognized within Acquisition, cyber incident, and other, net, increased Selling, general, and administrative expenses, and the factors driving the decrease in NOI mentioned above. The increase in Selling, general, and administrative is related to the go live of Project Orion in the second quarter of 2024.
Core EBITDA was $147.6 million for the first quarter of 2025, compared to $155.8 million for the comparable quarter of the prior year. This decrease (5.3% on an actual basis and 4.6% on a constant currency basis) was primarily driven by the same factors driving the decrease in NOI and the increase in Selling, general, and administrative mentioned above.
For the first quarter of 2025, Core FFO was $67.3 million, or $0.24 per diluted share, compared to $77.3 million, or $0.27 per diluted share, for the first quarter of 2024.
For the first quarter of 2025, Adjusted FFO was $95.7 million, or $0.34 per diluted share, compared to $104.9 million, or $0.37 per diluted share, for the first quarter of 2024.
Please see the Company’s supplemental financial information for the definitions and reconciliations of non-GAAP financial measures to the most comparable GAAP financial measures.
| | | | | | | | |
| | |
| Financial Supplement | First Quarter 2025 |
First Quarter 2025 Global Warehouse Segment Results
The following tables present revenues, contribution (NOI), margins, and certain operating metrics for our global, same store, and non-same store warehouses for the three months ended March 31, 2025 and 2024.
| | | | | | | | | | | | | | | | | | | | | | | | | | | | | | | | | | | |
| Three Months Ended March 31, | | Change | | | | |
Dollars and units in thousands, except per pallet data | 2025 Actual | | 2025 Constant Currency(1) | | 2024 Actual | | Actual | | Constant Currency | | | | | | |
| | | | | | | | | | | | | | | |
| TOTAL WAREHOUSE SEGMENT | | | | | | | | | | | | | | | |
| Global Warehouse revenues: | | | | | | | | | | | | | | | |
| Rent and storage | $ | 254,579 | | | $ | 256,901 | | | $ | 269,424 | | | (5.5) | % | | (4.6) | % | | | | | | |
| Warehouse services | 320,778 | | | 323,967 | | | 328,286 | | | (2.3) | % | | (1.3) | % | | | | | | |
Total revenues | $ | 575,357 | | | $ | 580,868 | | | $ | 597,710 | | | (3.7) | % | | (2.8) | % | | | | | | |
| Global Warehouse cost of operations: | | | | | | | | | | | | | | | |
| Power | 31,709 | | | 32,086 | | | 33,333 | | | (4.9) | % | | (3.7) | % | | | | | | |
Other facilities costs(2) | 57,550 | | | 58,095 | | | 65,595 | | | (12.3) | % | | (11.4) | % | | | | | | |
| Labor | 240,912 | | | 243,393 | | | 248,173 | | | (2.9) | % | | (1.9) | % | | | | | | |
Other services costs(3) | 48,601 | | | 49,095 | | | 53,478 | | | (9.1) | % | | (8.2) | % | | | | | | |
| Total warehouse segment cost of operations | $ | 378,772 | | | $ | 382,669 | | | $ | 400,579 | | | (5.4) | % | | (4.5) | % | | | | | | |
| | | | | | | | | | | | | | | |
| Global Warehouse contribution (NOI) | $ | 196,585 | | | $ | 198,199 | | | $ | 197,131 | | | (0.3) | % | | 0.5 | % | | | | | | |
Rent and storage contribution (NOI)(4) | $ | 165,320 | | | $ | 166,720 | | | $ | 170,496 | | | (3.0) | % | | (2.2) | % | | | | | | |
Services contribution (NOI)(5) | $ | 31,265 | | | $ | 31,479 | | | $ | 26,635 | | | 17.4 | % | | 18.2 | % | | | | | | |
| Global Warehouse margin | 34.2 | % | | 34.1 | % | | 33.0 | % | | 120 bps | | 110 bps | | | | | | |
Rent and storage margin(6) | 64.9 | % | | 64.9 | % | | 63.3 | % | | 160 bps | | 160 bps | | | | | | |
Warehouse services margin(7) | 9.7 | % | | 9.7 | % | | 8.1 | % | | 160 bps | | 160 bps | | | | | | |
| | | | | | | | | | | | | | | |
| Global Warehouse rent and storage metrics: | | | | | | | | | | | | | | | |
Average economic occupied pallets(8) | 4,128 | | | n/a | | 4,393 | | | (6.0) | % | | n/a | | | | | | |
Average physical occupied pallets(9) | 3,500 | | | n/a | | 3,810 | | | (8.1) | % | | n/a | | | | | | |
| Average physical pallet positions | 5,525 | | | n/a | | 5,531 | | | (0.1) | % | | n/a | | | | | | |
Economic occupancy percentage(8) | 74.7 | % | | n/a | | 79.4 | % | | -470 bps | | n/a | | | | | | |
Physical occupancy percentage(9) | 63.3 | % | | n/a | | 68.9 | % | | -560 bps | | n/a | | | | | | |
Total rent and storage revenues per average economic occupied pallet | $ | 61.67 | | | $ | 62.23 | | | $ | 61.33 | | | 0.6 | % | | 1.5 | % | | | | | | |
Total rent and storage revenues per average physical occupied pallet | $ | 72.74 | | | $ | 73.40 | | | $ | 70.71 | | | 2.9 | % | | 3.8 | % | | | | | | |
| Global Warehouse services metrics: | | | | | | | | | | | | | | | |
| Throughput pallets | 8,731 | | | n/a | | 9,050 | | | (3.5) | % | | n/a | | | | | | |
Total warehouse services revenues per throughput pallet | $ | 36.74 | | | $ | 37.11 | | | $ | 36.27 | | | 1.3 | % | | 2.3 | % | | | | | | |
(1)The adjustments from our U.S. GAAP operating results to calculate our operating results on a constant currency basis are the effect of changes in foreign currency exchange rates relative to the comparable prior period.
(2)Includes real estate rent expense of $6.5 million and $9.2 million for the three months ended March 31, 2025 and 2024, respectively.
(3)Includes non-real estate rent expense (equipment lease and rentals) of $2.4 million and $3.5 million for the three months ended March 31, 2025 and 2024, respectively.
(4)Calculated as warehouse rent and storage revenues less power and other facilities costs.
(5)Calculated as warehouse services revenues less labor and other services costs.
(6)Calculated as warehouse rent and storage contribution (NOI) divided by warehouse rent and storage revenues.
(7)Calculated as warehouse services contribution (NOI) divided by warehouse services revenues.
(8)We define average economic occupied pallets as the sum of the average number of physically occupied pallets and otherwise contractually committed pallets for a given period, without duplication. Economic occupancy percentage is calculated by dividing the average economic occupied pallets by the estimated average of total physical pallet positions in our warehouses, regardless of whether they are occupied, for the applicable period.
(9)We define average physical occupied pallets as the average number of physically occupied pallets positions in our warehouses for the applicable period. Physical occupancy percentage is calculated by dividing the average number of physically occupied pallets by the estimated average of total physical pallet positions in our warehouses, regardless of whether they are occupied, for the applicable period.
(n/a = not applicable)
| | | | | | | | |
| | |
| Financial Supplement | First Quarter 2025 |
| | | | | | | | | | | | | | | | | | | | | | | | | | | | | |
| Three Months Ended March 31, | | Change |
| Dollars and units in thousands, except per pallet data | 2025 Actual | | 2025 Constant Currency(1) | | 2024 Actual | | Actual | | Constant Currency |
| | | | | | | | | |
SAME STORE WAREHOUSE | | | | | | | | | |
Number of same store warehouses | 224 | | | | 224 | | | | |
Same store revenues: | | | | | | | | | |
| Rent and storage | $ | 245,196 | | | $ | 247,517 | | | $ | 256,771 | | | (4.5) | % | | (3.6) | % |
| Warehouse services | 314,823 | | | 318,005 | | | 316,492 | | | (0.5) | % | | 0.5 | % |
Total same store revenues | $ | 560,019 | | | $ | 565,522 | | | $ | 573,263 | | | (2.3) | % | | (1.4) | % |
Same store cost of operations: | | | | | | | | | |
| Power | 30,656 | | | 31,034 | | | 30,913 | | | (0.8) | % | | 0.4 | % |
| Other facilities costs | 57,245 | | | 57,790 | | | 56,567 | | | 1.2 | % | | 2.2 | % |
| Labor | 234,640 | | | 237,118 | | | 235,417 | | | (0.3) | % | | 0.7 | % |
| Other services costs | 44,763 | | | 45,254 | | | 49,164 | | | (9.0) | % | | (8.0) | % |
Total same store cost of operations | $ | 367,304 | | | $ | 371,196 | | | $ | 372,061 | | | (1.3) | % | | (0.2) | % |
| | | | | | | | | |
Same store contribution (NOI) | $ | 192,715 | | | $ | 194,326 | | | $ | 201,202 | | | (4.2) | % | | (3.4) | % |
Same store rent and storage contribution (NOI)(2) | $ | 157,295 | | | $ | 158,693 | | | $ | 169,291 | | | (7.1) | % | | (6.3) | % |
Same store services contribution (NOI)(3) | $ | 35,420 | | | $ | 35,633 | | | $ | 31,911 | | | 11.0 | % | | 11.7 | % |
Same store margin | 34.4 | % | | 34.4 | % | | 35.1 | % | | -70 bps | | -70 bps |
Same store rent and storage margin(4) | 64.2 | % | | 64.1 | % | | 65.9 | % | | -170 bps | | -180 bps |
Same store services margin(5) | 11.3 | % | | 11.2 | % | | 10.1 | % | | 120 bps | | 110 bps |
| | | | | | | | | |
Same store rent and storage metrics: | | | | | | | | | |
Average economic occupied pallets(6) | 4,044 | | | n/a | | 4,267 | | | (5.2) | % | | n/a |
Average physical occupied pallets(7) | 3,434 | | | n/a | | 3,698 | | | (7.1) | % | | n/a |
| Average physical pallet positions | 5,279 | | | n/a | | 5,279 | | | — | % | | n/a |
Economic occupancy percentage(6) | 76.6 | % | | n/a | | 80.8 | % | | -420 bps | | n/a |
Physical occupancy percentage(7) | 65.1 | % | | n/a | | 70.1 | % | | -500 bps | | n/a |
Same store rent and storage revenues per average economic occupied pallet | $ | 60.63 | | | $ | 61.21 | | | $ | 60.18 | | | 0.7 | % | | 1.7 | % |
Same store rent and storage revenues per average physical occupied pallet | $ | 71.40 | | | $ | 72.08 | | | $ | 69.44 | | | 2.8 | % | | 3.8 | % |
Same store services metrics: | | | | | | | | | |
| Throughput pallets | 8,561 | | | n/a | | 8,815 | | | (2.9) | % | | n/a |
Same store warehouse services revenues per throughput pallet | $ | 36.77 | | | $ | 37.15 | | | $ | 35.90 | | | 2.4 | % | | 3.5 | % |
(1)The adjustments from our U.S. GAAP operating results to calculate our operating results on a constant currency basis are the effect of changes in foreign currency exchange rates relative to the comparable prior period.
(2)Calculated as same store rent and storage revenues less same store power and other facilities costs.
(3)Calculated as same store warehouse services revenues less same store labor and other services costs.
(4)Calculated as same store rent and storage contribution (NOI) divided by same store rent and storage revenues.
(5)Calculated as same store services contribution (NOI) divided by same store services revenues.
(6)We define average economic occupied pallets as the sum of the average number of physically occupied pallets and otherwise contractually committed pallets for a given period, without duplication. Economic occupancy percentage is calculated by dividing the average economic occupied pallets by the estimated average of total physical pallet positions in our warehouses, regardless of whether they are occupied, for the applicable period.
(7)We define average physical occupied pallets as the average number of physically occupied pallets positions in our warehouses for the applicable period. Physical occupancy percentage is calculated by dividing the average number of physically occupied pallets by the estimated average of total physical pallet positions in our warehouses, regardless of whether they are occupied, for the applicable period.
(n/a = not applicable)
| | | | | | | | |
| | |
| Financial Supplement | First Quarter 2025 |
| | | | | | | | | | | | | | | | | | | | | | | | | | | | | |
| Three Months Ended March 31, | | Change |
| Dollars and units in thousands, except per pallet data | 2025 Actual | | 2025 Constant Currency(1) | | 2024 Actual | | Actual | | Constant Currency |
| | | | | | | | | |
NON-SAME STORE WAREHOUSE | | | | | | | | | |
Number of non-same store warehouses(2) | 11 | | | | 12 | | | | |
Non-same store revenues: | | | | | | | | | |
| Rent and storage | $ | 9,383 | | | $ | 9,384 | | | $ | 12,653 | | | n/r | | n/r |
| Warehouse services | 5,955 | | | 5,962 | | | 11,794 | | | n/r | | n/r |
Total non-same store revenues | $ | 15,338 | | | $ | 15,346 | | | $ | 24,447 | | | n/r | | n/r |
Non-same store cost of operations: | | | | | | | | | |
| Power | 1,053 | | | 1,052 | | | 2,420 | | | n/r | | n/r |
| Other facilities costs | 305 | | | 305 | | | 9,028 | | | n/r | | n/r |
| Labor | 6,272 | | | 6,275 | | | 12,756 | | | n/r | | n/r |
| Other services costs | 3,838 | | | 3,841 | | | 4,314 | | | n/r | | n/r |
Total non-same store cost of operations | $ | 11,468 | | | $ | 11,473 | | | $ | 28,518 | | | n/r | | n/r |
| | | | | | | | | |
Non-same store contribution (NOI) | $ | 3,870 | | | $ | 3,873 | | | $ | (4,071) | | | n/r | | n/r |
Non-same store rent and storage contribution (NOI)(3) | $ | 8,025 | | | $ | 8,027 | | | $ | 1,205 | | | n/r | | n/r |
Non-same store services contribution (NOI)(4) | $ | (4,155) | | | $ | (4,154) | | | $ | (5,276) | | | n/r | | n/r |
| | | | | | | | | |
Non-same store rent and storage metrics: | | | | | | | | | |
Average economic occupied pallets(5) | 84 | | | n/a | | 126 | | | n/r | | n/a |
Average physical occupied pallets(6) | 66 | | | n/a | | 112 | | | n/r | | n/a |
| Average physical pallet positions | 246 | | | n/a | | 252 | | | n/r | | n/a |
Economic occupancy percentage(5) | 34.1 | % | | n/a | | 50.0 | % | | n/r | | n/a |
Physical occupancy percentage(6) | 26.8 | % | | n/a | | 44.4 | % | | n/r | | n/a |
Non-same store rent and storage revenues per average economic occupied pallet | $ | 111.70 | | | $ | 111.71 | | | $ | 100.42 | | | n/r | | n/r |
Non-same store rent and storage revenues per average physical occupied pallet | $ | 142.17 | | | $ | 142.18 | | | $ | 112.97 | | | n/r | | n/r |
Non-same store services metrics: | | | | | | | | | |
| Throughput pallets | 170 | | | n/a | | 235 | | | n/r | | n/a |
Non-same store warehouse services revenues per throughput pallet | $ | 35.03 | | | $ | 35.07 | | | $ | 50.19 | | | n/r | | n/r |
(1)The adjustments from our U.S. GAAP operating results to calculate our operating results on a constant currency basis are the effect of changes in foreign currency exchange rates relative to the comparable prior period.
(2)The non-same store facility count consists of: 8 facilities where the executive leadership team has approved exits in the current year (4 of which are leased facilities and 4 of which are owned facilities and the Company is in pursuit to sell), 2 sites in the recently completed expansion and development phase (further detailed in the External Development and Capital Deployment section of our quarterly supplement), and 1 facility that we purchased in 2025. As of March 31, 2025, there are 6 sites in the development and expansion phase that will be added to the non-same store pool when operations commence.
(3)Calculated as non-same store rent and storage revenues less non-same store power and other facilities costs.
(4)Calculated as non-same store warehouse services revenues less non-same store labor and other services costs.
(5)We define average economic occupied pallets as the sum of the average number of physically occupied pallets and otherwise contractually committed pallets for a given period, without duplication. Economic occupancy percentage is calculated by dividing the average economic occupied pallets by the estimated average of total physical pallet positions in our warehouses, regardless of whether they are occupied, for the applicable period.
(6)We define average physical occupied pallets as the average number of physically occupied pallets positions in our warehouses for the applicable period. Physical occupancy percentage is calculated by dividing the average number of physically occupied pallets by the estimated average of total physical pallet positions in our warehouses, regardless of whether they are occupied, for the applicable period.
(n/a = not applicable)
(n/r = not relevant)
| | | | | | | | |
| | |
| Financial Supplement | First Quarter 2025 |
Warehouse Results
For the first quarter of 2025, Global Warehouse segment revenues were $575.4 million, a decrease of $22.4 million, or 3.7% (2.8% decrease on a constant currency basis), compared to $597.7 million for the first quarter of 2024. This decrease was principally driven by lower volumes and throughput pallets as we are lapping unusually high, counter-cyclical inventory levels in the first quarter of 2024, partially offset by annual rate increases in the normal course of operations.
Global Warehouse segment contribution (NOI) was $196.6 million for the first quarter of 2025 as compared to $197.1 million for the first quarter of 2024, a decrease of $0.5 million or 0.3% (0.5% increase on a constant currency basis). Global Warehouse segment contribution (NOI) decreased primarily due to the factors noted above. Global Warehouse segment margin was 34.2% for the first quarter of 2025, a 120 basis point increase as to compared to the first quarter of 2024, driven by an increased focus on workforce performance, operational efficiency, and retention.
Fixed Commitment Rent and Storage Revenues
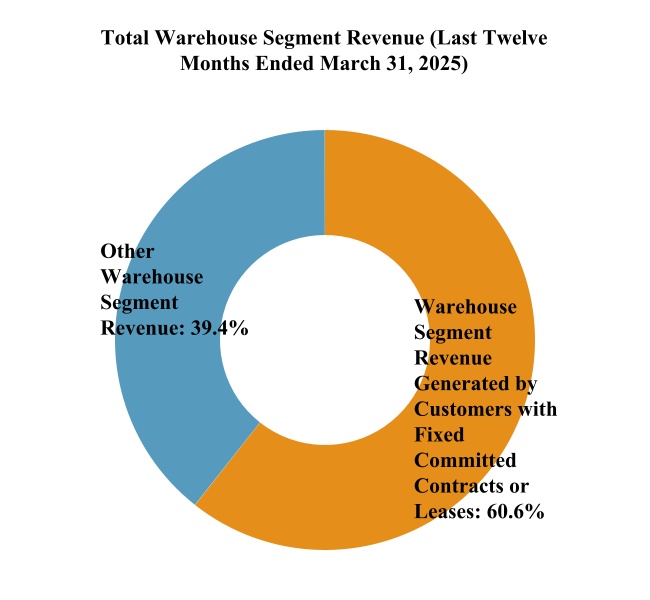
As of March 31, 2025, $629.3 million of the Company’s annualized rent and storage revenues were derived from customers with fixed commitment storage contracts compared to $625.3 million at the end of the fourth quarter of 2024 and $597.9 million at the end of the first quarter of 2024. On a combined basis, 60.1% of rent and storage revenues were generated from fixed commitment storage contracts. On a combined basis, 60.6% of total warehouse segment revenues were generated from customers with fixed committed contracts or leases.
Economic and Physical Occupancy
Fixed commitments storage contracts are designed to ensure the Company’s customers have space available when needed. For the first quarter of 2025, economic occupancy for the total warehouse segment was 74.7% and the warehouse segment same store pool was 76.6%, representing a 1,140 and 1,150 basis point increase above physical occupancy, respectively. Economic occupancy for the total warehouse segment decreased 470 basis points, and the warehouse segment same store pool decreased 420 basis points as compared to the first quarter of 2024. This was primarily due to unusually high inventory levels during the first quarter of 2024, therefore impacting comparability in the first quarter of 2025. Additionally, overall volumes are also impacted by recent regulatory shifts, a competitive and inflationary environment, and abnormal credit yields, all impacting consumer buying habits and the related food production levels.
Real Estate Portfolio
As of March 31, 2025, the Company’s portfolio consists of 238 facilities. The Company ended the first quarter of 2025 with 235 facilities in its Global Warehouse segment portfolio and 3 facilities in its Third-party managed segment. The same store population consists of 224 facilities for the quarter ended March 31, 2025. The non-same store facility count consists of: 8 facilities where the executive leadership team has approved exits in the current year (4 of which are leased facilities and 4 of which are owned facilities and the Company is in pursuit to sell), 2 sites in the recently completed expansion and development phase (further detailed in the External Development and Capital Deployment section of our quarterly supplement), and 1 facility that we purchased in 2025. As of March 31, 2025, there are 6 sites in the development and expansion phase that will be added to the non-same store pool when operations commence.
Balance Sheet Activity and Liquidity
As of March 31, 2025, the Company had total liquidity of approximately $651.2 million, including cash and available capacity on its revolving credit facility. Total net debt outstanding was approximately $3.7 billion (inclusive of approximately $187.0 million of financing leases/sale lease-backs and exclusive of unamortized deferred financing fees), of which 95.1% was in an unsecured structure. At quarter end, net debt to pro forma Core EBITDA (based on trailing twelve months Core EBITDA) was approximately 5.9x. The Company’s unsecured debt has a remaining weighted average term of 4.7 years, inclusive of extensions that the Company is expected to utilize, and carries a weighted average contractual interest rate of 4.0%. As of March 31, 2025, approximately 86.3% of the Company’s total debt outstanding was at a fixed rate, inclusive of hedged variable-rate for fixed-rate debt. The Company has no material debt maturities until 2026, inclusive of extension options.
| | | | | | | | |
| | |
| Financial Supplement | First Quarter 2025 |
Dividend
On March 17, 2025, the Company’s Board of Directors declared a 5% increase in the dividend to $0.23 per share for the first quarter of 2025, which was paid on April 15, 2025 to common stockholders of record as of March 28, 2025.
About the Company
Americold is a global leader in temperature-controlled logistics real estate and value-added services. Focused on the ownership, operation, acquisition and development of temperature-controlled warehouses, Americold owns and/or operates 238 temperature-controlled warehouses, with approximately 1.4 billion refrigerated cubic feet of storage, in North America, Europe, Asia-Pacific, and South America. Americold’s facilities are an integral component of the supply chain connecting food producers, processors, distributors and retailers to consumers.
Non-GAAP Measures
We use the following non-GAAP financial measures as supplemental performance measures of our business: NAREIT FFO, Core FFO, Adjusted FFO, NAREIT EBITDAre, Core EBITDA, Core EBITDA margin, net debt to pro-forma Core EBITDA, segment contribution (“NOI”) and margin, same store revenues and NOI, certain constant currency metrics, and maintenance capital expenditures. Definitions of these non-GAAP metrics are included in our quarterly financial supplement, and reconciliations of these non-GAAP measures to their most comparable US GAAP metrics are included herein. Each of the non-GAAP measures included in this press release has limitations as an analytical tool and should not be considered in isolation or as a substitute for an analysis of the Company’s results calculated in accordance with GAAP. In addition, because not all companies use identical calculations, the Company’s presentation of non-GAAP measures in this press release may not be comparable to similarly titled measures disclosed by other companies, including other REITs.
Forward-Looking Statements
This press release contains statements about future events and expectations that constitute forward-looking statements. Forward-looking statements are based on our beliefs, assumptions and expectations of our future financial and operating performance and growth plans, taking into account the information currently available to us. These statements are not statements of historical fact. Forward-looking statements involve risks and uncertainties that may cause our actual results to differ materially from the expectations of future results we express or imply in any forward-looking statements, and you should not place undue reliance on such statements. Factors that could contribute to these differences include the following: rising inflationary pressures, increased interest rates and operating costs; national, international, regional and local economic conditions, including impacts and uncertainty from trade disputes and tariffs on goods imported to the United States and goods exported to other countries; periods of economic slowdown or recession; labor and power costs; labor shortages; our relationship with our associates, the occurrence of any work stoppages or any disputes under our collective bargaining agreements and employment related litigation; the impact of supply chain disruptions; risks related to rising construction costs; risks related to expansions of existing properties and developments of new properties, including failure to meet budgeted or stabilized returns within expected time frames, or at all, in respect thereof; uncertainty of revenues, given the nature of our customer contracts; acquisition risks, including the failure to identify or complete attractive acquisitions or failure to realize the intended benefits from our recent acquisitions; difficulties in expanding our operations into new markets; uncertainties and risks related to public health crises; a failure of our information technology systems, systems conversions and integrations, cybersecurity attacks or a breach of our information security systems, networks or processes; risks related to implementation of the new ERP system, defaults or non-renewals of significant customer contracts; risks related to privacy and data security concerns, and data collection and transfer restrictions and related foreign regulations; changes in applicable governmental regulations and tax legislation; risks related to current and potential international operations and properties; actions by our competitors and their increasing ability to compete with us; changes in foreign currency exchange rates; the potential liabilities, costs and regulatory impacts associated with our in-house trucking services and the potential disruptions associated with our use of third-party trucking service providers for transportation services to our customers; liabilities as a result of our participation in multi-employer pension plans; risks related to the partial ownership of properties, including our JV investments; risks related to natural disasters; adverse economic or real estate developments in our geographic markets or the temperature-controlled warehouse industry; changes in real estate and zoning laws and increases in real property tax rates; general economic conditions; risks associated with the ownership of real estate generally and temperature-controlled warehouses in particular; possible environmental liabilities; uninsured losses or losses in excess of our insurance coverage; financial market fluctuations; our failure to obtain necessary outside financing on attractive terms, or at all; risks related to, or restrictions contained in, our debt financings; decreased storage rates or increased vacancy rates; the potential dilutive effect of our common stock offerings,
| | | | | | | | |
| | |
| Financial Supplement | First Quarter 2025 |
including our ongoing at the market program; the cost and time requirements as a result of our operation as a publicly traded REIT; and our failure to maintain our status as a REIT.
Words such as “anticipates,” “believes,” “continues,” “estimates,” “expects,” “goal,” “objectives,” “intends,” “may,” “opportunity,” “plans,” “potential,” “near-term,” “long-term,” “projections,” “assumptions,” “projects,” “guidance,” “forecasts,” “outlook,” “target,” “trends,” “should,” “could,” “would,” “will” and similar expressions are intended to identify such forward-looking statements, although not all forward-looking statements may contain such words. Examples of forward-looking statements included in this press release include, but are not limited to, those regarding our 2025 outlook and our migration of our customers to fixed commitment storage contracts. We qualify any forward-looking statements entirely by these cautionary factors. Other risks, uncertainties and factors, including those discussed under “Risk Factors” in our Annual Report on Form 10-K for the year ended December 31, 2024, and other reports filed with the Securities and Exchange Commission, could cause our actual results to differ materially from those projected in any forward-looking statements we make. We assume no obligation to update or revise these forward-looking statements for any reason, or to update the reasons actual results could differ materially from those anticipated in these forward-looking statements, even if new information becomes available in the future except to the extent required by law.
Contacts:
Americold Realty Trust, Inc.
Investor Relations
Telephone: 678-459-1959
Email: investor.relations@americold.com
| | | | | | | | |
| | |
| Financial Supplement | First Quarter 2025 |
Financial Information
| | | | | | | | | | | |
| Americold Realty Trust, Inc. and Subsidiaries |
| Condensed Consolidated Balance Sheets (Unaudited) |
| (In thousands, except shares and per share amounts) |
| March 31, 2025 | | December 31, 2024 |
| Assets | | | |
| Property, buildings, and equipment: | | | |
| Land | $ | 819,590 | | | $ | 806,981 | |
| Buildings and improvements | 4,524,128 | | | 4,462,565 | |
| Machinery and equipment | 1,633,310 | | | 1,598,502 | |
| Assets under construction | 708,200 | | | 606,233 | |
| 7,685,228 | | | 7,474,281 | |
| Accumulated depreciation | (2,533,658) | | | (2,453,597) | |
| Property, buildings, and equipment – net | 5,151,570 | | | 5,020,684 | |
| | | |
| Operating leases - net | 174,518 | | | 222,294 | |
| Financing leases - net | 115,445 | | | 104,216 | |
| | | |
| Cash, cash equivalents, and restricted cash | 38,946 | | | 47,652 | |
Accounts receivable – net of allowance of $21,987 and $24,426 at March 31, 2025 and December 31, 2024, respectively | 378,985 | | | 386,924 | |
| Identifiable intangible assets – net | 835,233 | | | 838,660 | |
| Goodwill | 831,937 | | | 784,042 | |
| Investments in and advances to partially owned entities | 46,535 | | | 40,252 | |
| Other assets | 252,210 | | | 291,230 | |
| Total assets | $ | 7,825,379 | | | $ | 7,735,954 | |
| | | |
| Liabilities and Equity | | | |
| Liabilities | | | |
| Borrowings under revolving line of credit | $ | 516,932 | | | $ | 255,052 | |
| Accounts payable and accrued expenses | 514,643 | | | 603,411 | |
Senior unsecured notes and term loans – net of deferred financing costs of $13,106 and $13,882 at March 31, 2025 and December 31, 2024, respectively | 3,067,120 | | | 3,031,462 | |
| Sale-leaseback financing obligations | 78,132 | | | 79,001 | |
| Financing lease obligations | 108,838 | | | 95,784 | |
| Operating lease obligations | 171,294 | | | 219,099 | |
| Unearned revenues | 22,933 | | | 21,979 | |
| Deferred tax liability - net | 118,976 | | | 115,772 | |
| Other liabilities | 7,452 | | | 7,389 | |
| Total liabilities | 4,606,320 | | | 4,428,949 | |
| | | |
| Equity | | | |
| Stockholders' equity: | | | |
Common stock, $0.01 par value per share – 500,000,000 authorized shares; 284,719,592 and 284,265,041 shares issued and outstanding at March 31, 2025 and December 31, 2024, respectively | 2,847 | | | 2,842 | |
| Paid-in capital | 5,653,251 | | | 5,646,879 | |
| Accumulated deficit and distributions in excess of net earnings | (2,423,607) | | | (2,341,654) | |
| Accumulated other comprehensive loss | (42,012) | | | (27,279) | |
| Total stockholders’ equity | 3,190,479 | | | 3,280,788 | |
| Noncontrolling interests | 28,580 | | | 26,217 | |
| Total equity | 3,219,059 | | | 3,307,005 | |
| Total liabilities and equity | $ | 7,825,379 | | | $ | 7,735,954 | |
| | | | | | | | |
| | |
| Financial Supplement | First Quarter 2025 |
| | | | | | | | | | | | | | | |
| Americold Realty Trust, Inc. and Subsidiaries |
| Condensed Consolidated Statements of Operations (Unaudited) |
| (In thousands, except per share amounts) |
| Three Months Ended March 31, | | |
| 2025 | | 2024 | | | | |
| Revenues: | | | | | | | |
| Rent, storage, and warehouse services | $ | 575,357 | | | $ | 597,710 | | | | | |
| Transportation services | 43,993 | | | 56,853 | | | | | |
| Third-party managed services | 9,630 | | | 10,417 | | | | | |
| Total revenues | 628,980 | | | 664,980 | | | | | |
| Operating expenses: | | | | | | | |
| Rent, storage, and warehouse services cost of operations | 378,772 | | | 400,579 | | | | | |
| Transportation services cost of operations | 36,739 | | | 45,331 | | | | | |
| Third-party managed services cost of operations | 7,621 | | | 8,234 | | | | | |
| Depreciation and amortization | 88,982 | | | 92,095 | | | | | |
| Selling, general, and administrative | 69,235 | | | 65,426 | | | | | |
| Acquisition, cyber incident, and other, net | 25,414 | | | 14,998 | | | | | |
| Net gain from sale of real estate | — | | | (3,514) | | | | | |
| Total operating expenses | 606,763 | | | 623,149 | | | | | |
| | | | | | | |
| Operating Income | 22,217 | | | 41,831 | | | | | |
| | | | | | | |
| Other income (expense): | | | | | | | |
| Interest expense | (36,117) | | | (33,430) | | | | | |
| Loss on debt extinguishment and termination of derivative instruments | — | | | (5,182) | | | | | |
| Loss from investments in partially owned entities | (1,363) | | | (949) | | | | | |
| Other, net | 1,296 | | | 9,526 | | | | | |
| (Loss) income before income taxes | (13,967) | | | 11,796 | | | | | |
| | | | | | | |
| Income tax benefit (expense): | | | | | | | |
| Current income tax | (1,933) | | | (1,375) | | | | | |
| Deferred income tax | (573) | | | (619) | | | | | |
| Total income tax expense | (2,506) | | | (1,994) | | | | | |
| | | | | | | |
| Net (loss) income | $ | (16,473) | | | $ | 9,802 | | | | | |
| Net (loss) income attributable to noncontrolling interests | (93) | | | 62 | | | | | |
| Net (loss) income attributable to Americold Realty Trust, Inc. | $ | (16,380) | | | $ | 9,740 | | | | | |
| | | | | | | |
| Weighted average common stock outstanding – basic | 285,363 | | | 284,644 | | | | | |
| Weighted average common stock outstanding – diluted | 285,363 | | | 284,878 | | | | | |
| | | | | | | |
| Net (loss) income per common share - basic | $ | (0.06) | | | $ | 0.03 | | | | | |
| Net (loss) income per common share - diluted | $ | (0.06) | | | $ | 0.03 | | | | | |
| | | | | | | | |
| | |
| Financial Supplement | First Quarter 2025 |
| | | | | | | | | | | |
| Reconciliation of Net (Loss) Income to NAREIT FFO, Core FFO, and Adjusted FFO |
| (In thousands, except per share amounts) |
| | Three Months Ended | | |
| Q1 25 | Q1 24 | | | |
| Net (loss) income | $ | (16,473) | | $ | 9,802 | | | | |
| Adjustments: | | | | | |
| Real estate related depreciation | 55,599 | | 56,275 | | | | |
| Net gain from sale of real estate | — | | (3,514) | | | | |
| Net loss on real estate related asset disposals | 1 | | 40 | | | | |
| Our share of reconciling items related to partially owned entities | 215 | | 148 | | | | |
| NAREIT FFO | $ | 39,342 | | $ | 62,751 | | | | |
| Adjustments: | | | | | |
| Net loss (gain) on sale of non-real assets | 134 | | (20) | | | | |
| Acquisition, cyber incident, and other, net | 25,414 | | 14,998 | | | | |
| Loss on debt extinguishment and termination of derivative instruments | — | | 5,182 | | | | |
| Foreign currency exchange loss | 221 | | 373 | | | | |
| Gain on legal settlement related to prior period operations | — | | (6,104) | | | | |
| Project Orion deferred costs amortization | 2,109 | | — | | | | |
| Our share of reconciling items related to partially owned entities | 118 | | 136 | | | | |
| Core FFO | $ | 67,338 | | $ | 77,316 | | | | |
| Adjustments: | | | | | |
| Amortization of deferred financing costs and pension withdrawal liability | 1,400 | | 1,289 | | | | |
| Amortization of below/above market leases | 351 | | 368 | | | | |
| Straight-line rent adjustment | 84 | | 589 | | | | |
| Deferred income tax expense | 573 | | 619 | | | | |
Stock-based compensation expense(1) | 7,259 | | 6,619 | | | | |
| Non-real estate depreciation and amortization | 33,383 | | 35,820 | | | | |
Maintenance capital expenditures(2) | (14,799) | | (17,933) | | | | |
| Our share of reconciling items related to partially owned entities | 137 | | 226 | | | | |
| Adjusted FFO | $ | 95,726 | | $ | 104,913 | | | | |
(1)Stock-based compensation expense excludes the stock compensation expense associated with employee awards granted in conjunction with Project Orion, which are recognized within Acquisition, cyber incident, and other, net.
(2)Maintenance capital expenditures include capital expenditures made to extend the life of, and provide future economic benefit from, our existing temperature-controlled warehouse network and its existing supporting personal property and information technology.
| | | | | | | | |
| | |
| Financial Supplement | First Quarter 2025 |
| | | | | | | | | | | |
Reconciliation of Net (Loss) Income to NAREIT FFO, Core FFO, and Adjusted FFO (continued) |
(In thousands, except per share amounts) |
| Three Months Ended | | |
| Q1 25 | Q1 24 | | | |
| | | | | |
| NAREIT FFO | $ | 39,342 | | $ | 62,751 | | | | |
| Core FFO | $ | 67,338 | | $ | 77,316 | | | | |
| Adjusted FFO | $ | 95,726 | | $ | 104,913 | | | | |
| | | | | |
| Reconciliation of weighted average shares: | | | | | |
| Weighted average basic shares for net income calculation | 285,363 | | 284,644 | | | | |
| Dilutive stock options and unvested restricted stock units | 266 | | 234 | | | | |
| Weighted average dilutive shares | 285,629 | | 284,878 | | | | |
| | | | | |
NAREIT FFO - basic per share | $ | 0.14 | | $ | 0.22 | | | | |
NAREIT FFO - diluted per share | $ | 0.14 | | $ | 0.22 | | | | |
| | | | | |
Core FFO - basic per share | $ | 0.24 | | $ | 0.27 | | | | |
Core FFO - diluted per share | $ | 0.24 | | $ | 0.27 | | | | |
| | | | | |
Adjusted FFO - basic per share | $ | 0.34 | | $ | 0.37 | | | | |
Adjusted FFO - diluted per share | $ | 0.34 | | $ | 0.37 | | | | |
| | | | | | | | |
| | |
| Financial Supplement | First Quarter 2025 |
| | | | | | | | | | | |
| Reconciliation of Net (Loss) Income to NAREIT EBITDAre and Core EBITDA |
| (In thousands) |
| | Three Months Ended | | |
| Q1 25 | Q1 24 | | | |
| Net (loss) income | $ | (16,473) | | $ | 9,802 | | | | |
| Adjustments: | | | | | |
| Depreciation and amortization | 88,982 | | 92,095 | | | | |
| Interest expense | 36,117 | | 33,430 | | | | |
| Income tax expense | 2,506 | | 1,994 | | | | |
| Net gain from sale of real estate | — | | (3,514) | | | | |
| Adjustment to reflect share of EBITDAre of partially owned entities | 1,516 | | 1,470 | | | | |
| NAREIT EBITDAre | $ | 112,648 | | $ | 135,277 | | | | |
| Adjustments: | | | | | |
| Acquisition, cyber incident, and other, net | 25,414 | | 14,998 | | | | |
| Loss from investments in partially owned entities | 1,363 | | 949 | | | | |
| Foreign currency exchange loss | 221 | | 373 | | | | |
Stock-based compensation expense(1) | 7,259 | | 6,619 | | | | |
| Loss on debt extinguishment and termination of derivative instruments | — | | 5,182 | | | | |
| Loss on other asset disposals | 135 | | 20 | | | | |
| Gain on legal settlement related to prior period operations | — | | (6,104) | | | | |
| Project Orion deferred costs amortization | 2,109 | | — | | | | |
| Reduction in EBITDAre from partially owned entities | (1,516) | | (1,470) | | | | |
| Core EBITDA | $ | 147,633 | | $ | 155,844 | | | | |
| | | | | |
Total revenues | $ | 628,980 | | $ | 664,980 | | | | |
| Core EBITDA margin | 23.5 | % | 23.4 | % | | | |
(1)Stock-based compensation expense excludes the stock compensation expense associated with employee awards granted in conjunction with Project Orion, which are recognized within Acquisition, cyber incident, and other, net.
| | | | | | | | |
| | |
| Financial Supplement | First Quarter 2025 |
| | | | | | | | | | | | | | | | | | | | | | | |
Debt Detail and Maturities |
| As of March 31, 2025 |
Indebtedness(1): (In thousands) | Carrying Value | | Contractual Interest Rate(2) | | Effective Interest Rate(3) | | Maturity Date(4) |
| | | | | | | |
Senior Unsecured Revolving Credit Facility - USD(5) | $ | 268,000 | | | SOFR + 0.84% | | 5.70% | | 08/2027 |
Senior Unsecured Revolving Credit Facility - C$35M(5) | 24,328 | | | CORRA + 0.84% | | 4.36% | | 08/2027 |
Senior Unsecured Revolving Credit Facility - A$202M(5) | 126,179 | | | BBSW + 0.84% | | 5.45% | | 08/2027 |
Senior Unsecured Revolving Credit Facility - €70.5M(5) | 76,277 | | | EURIBOR + 0.84% | | 3.67% | | 08/2027 |
Senior Unsecured Revolving Credit Facility - NZ$39M(5) | 22,148 | | | BKBM + 0.84% | | 5.19% | | 08/2027 |
Senior Unsecured Term Loan A Facility Tranche A-1 - USD(6) | 375,000 | | | SOFR + 0.94% | | 4.58% | | 08/2027 |
Senior Unsecured Term Loan A Facility Tranche A-2 - C$250M | 173,769 | | | CORRA + 0.94% | | 4.80% | | 01/2028 |
| Senior Unsecured Term Loan A Facility Tranche A-3 - USD | 270,000 | | | SOFR + 0.94% | | 4.27% | | 01/2028 |
Private Series A Unsecured Notes - USD | 200,000 | | | 4.68% | | 4.77% | | 01/2026 |
Private Series B Unsecured Notes - USD | 400,000 | | | 4.86% | | 4.92% | | 01/2029 |
Private Series C Unsecured Notes - USD | 350,000 | | | 4.10% | | 4.15% | | 01/2030 |
Private Series D Unsecured Notes - €400M | 432,777 | | | 1.62% | | 1.67% | | 01/2031 |
Private Series E Unsecured Notes - €350M | 378,680 | | | 1.65% | | 1.70% | | 01/2033 |
Public 5.409% Notes - USD | 500,000 | | | 5.41% | | 5.50% | | 09/2034 |
Total Unsecured Debt | $ | 3,597,158 | | | 3.98% | | 4.15% | | 4.7 years |
Sale-leaseback financing obligations | 78,132 | | | 10.07% | | | | |
Financing lease obligations | 108,838 | | | 4.82% | | | | |
Total Secured Debt | $ | 186,970 | | | 7.01% | | | | |
| | | | | | | |
Total Debt Outstanding | $ | 3,784,128 | | | 4.13% | | | | |
Less: unamortized deferred financing costs | (13,106) | | | | | | | |
Total Book Value of Debt | $ | 3,771,022 | | | | | | | |
| | | | | | | | |
Rate Type: | March 31, 2025 | % of Total |
Fixed(7) | $ | 3,267,196 | | 86.3% |
Variable-unhedged | 516,932 | | 13.7% |
Total Debt Outstanding | $ | 3,784,128 | | 100% |
| | | | | | | | |
Debt Type: | March 31, 2025 | % of Total |
Unsecured | $ | 3,597,158 | | 95.1% |
Secured | 186,970 | | 4.9% |
Total Debt Outstanding | $ | 3,784,128 | | 100% |
| | | | | |
| Capitalization: | March 31, 2025 |
Total Debt Outstanding | $ | 3,784,128 | |
| Less: Cash, cash equivalents and restricted cash | 38,946 | |
| Net Debt | $ | 3,745,182 | |
Pro forma Core EBITDA - last twelve months(9) | $ | 632,118 | |
| Net Debt to Pro Forma Core EBITDA | 5.9x |
| | | | | |
| Enterprise Value: | March 31, 2025 |
Fully Diluted Common Stock(8) | 288,529 |
| Common Stock Share Price | $ | 21.46 | |
Market Value of Common Equity | $ | 6,191,832 | |
| Net Debt | $ | 3,745,182 | |
| Total Enterprise Value | $ | 9,937,014 | |
(1)Borrowing currency and value presented in caption unless USD denominated.
(2)As of March 31, 2025, for the Senior Unsecured Revolving Credit Facility, the adjusted daily SOFR rate was 4.40% (which includes an adjustment of 0.10%), the adjusted daily CORRA rate was 3.06% (which includes an adjustment of 0.30%), the one-month weighted average BBSW rate was 4.14%, the one-month EURIBOR rate was 2.36%, and the one-month weighted average BKBM rate was 3.88%. Our Senior Unsecured Term Loan A Facility Tranche A-1 is hedged at a weighted average rate of 4.29%. Our Senior Unsecured Term Loan A Facility Tranche A-2 is hedged at a rate of 4.53%. Our Senior Unsecured Term Loan A Facility Tranche A-3 is hedged at a rate of 4.09%.
(3)The effective interest rates presented include the amortization of deferred financing costs and are based on the hedged rates for the $375.0 million Senior Unsecured Term Loan A Facility Tranche A-1, the C$250.0 million Senior Unsecured Term Loan A Facility Tranche A-2, and the $270.0 million Senior Unsecured Term Loan A Facility Tranche A-3. The effective interest rate of Total Unsecured Debt is calculated using the weighted average of the stated effective interest rates of the individual borrowings.
(4)Maturity date represents the remaining weighted average life of the debt and assumes the exercise of extension options on the Senior Unsecured Revolving Credit Facility and the Senior Unsecured Term A Facility Loan Tranche A-1 (see below).
(5)The Senior Unsecured Revolving Credit Facility maturity date assumes two six-month extension options past the contractual maturity date in August of 2026. The borrowing capacity as of March 31, 2025 is $1.2 billion less $20.8 million of outstanding letters of credit. The effective interest rates shown reflect deferred financing costs allocated on a pro rata basis over the outstanding balances.
(6)The Senior Unsecured Term Loan A Facility Tranche A-1 maturity date assumes two twelve-month extension options past the contractual maturity date in August of 2025.
(7)The total includes borrowings with a variable interest rate that have been effectively hedged through interest rate swaps.
(8)The fully diluted Common Stock presented herein is unweighted and assumes a payout at target for all unvested performance based awards.
(9)Calculated as Core EBITDA for the last twelve months plus pro forma adjustments of $6.2 million. Pro Forma adjustments consist of (1) inclusion of Core EBITDA from the Houston acquisition for the period from April 1, 2024 to Americold’s acquisition date and (2) exclusion of Core EBITDA for the last twelve months for the sites divested during the three months ended March 31, 2025.
| | | | | | | | |
| | |
| Financial Supplement | First Quarter 2025 |
Operations Overview
Global Warehouse Portfolio
| | | | | | | | |
| | |
| Financial Supplement | First Quarter 2025 |
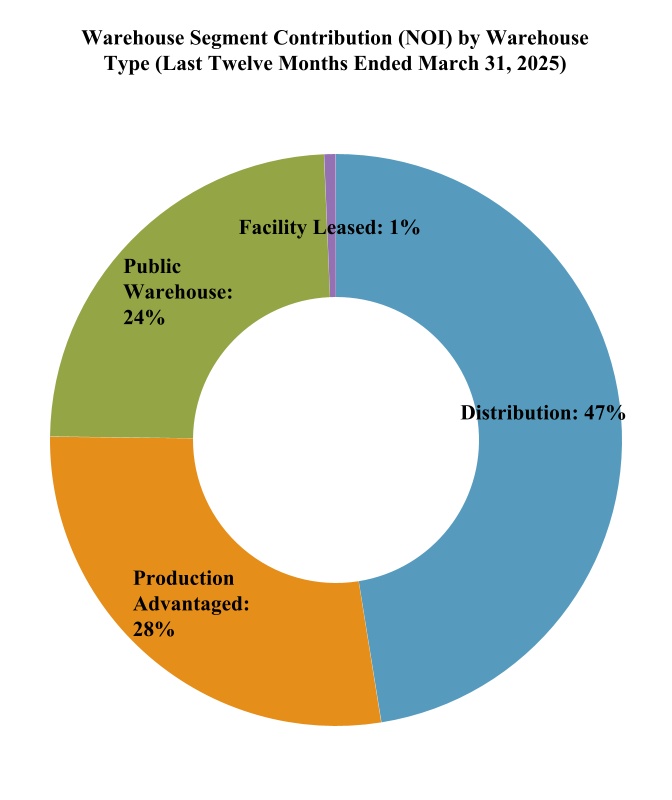
Fixed Commitment and Lease Maturity Schedules
The following table sets forth a summary schedule of the expirations for any defined contracts featuring fixed storage commitments and leases in effect as of March 31, 2025. Note that month to month contracts include expired contracts that are assumed to continue as month to month agreements until renewal or notice of intention to vacate. | | | | | | | | | | | | | | | | | | | | | | | | | | | | | | | | |
| Contract Expiration Year | | Number of Contracts | | Annualized Committed Rent & Storage Revenues | | % of Total Warehouse Rent & Storage Segment Revenues for the twelve months ended March 31, 2025 | | Total Warehouse Segment Revenues Generated by Customers with Fixed Commitment Contracts & Leases for the twelve months ended March 31, 2025(1) | | Annualized
Committed Rent
& Storage
Revenues at
Expiration(2) |
(Dollars in thousands) |
| Month-to-Month | | 186 | | | $ | 103,505 | | | 9.9 | % | | $ | 269,141 | | | $ | 103,505 | |
| 2025 | | 154 | | | 117,490 | | | 11.2 | % | | 254,769 | | | 117,500 | |
| 2026 | | 144 | | | 196,634 | | | 18.8 | % | | 428,267 | | | 199,115 | |
| 2027 | | 57 | | | 50,543 | | | 4.8 | % | | 131,952 | | | 52,836 | |
| 2028 | | 38 | | | 33,289 | | | 3.2 | % | | 97,498 | | | 35,597 | |
| 2029+ | | 42 | | | 127,792 | | | 12.2 | % | | 270,009 | | | 136,343 | |
| Total | | 621 | | | $ | 629,253 | | | 60.1 | % | | $ | 1,451,636 | | | $ | 644,896 | |
(1)Represents monthly fixed storage commitments and lease rental payments under the relevant expiring defined contract and lease as of March 31, 2025, plus the weighted average monthly warehouse services revenues attributable to these contracts and leases for the last twelve months ended March 31, 2025, multiplied by 12.
(2)Represents annualized monthly revenues from fixed storage commitments and lease rental payments under the defined contracts and relevant expiring leases as of March 31, 2025 based upon the monthly revenues attributable thereto in the last month prior to expiration, multiplied by 12.
| | | | | | | | |
| | |
| Financial Supplement | First Quarter 2025 |
The following table sets forth a summary schedule of the expirations of our facility leased warehouses and other leases pursuant to which we lease space to third parties in our warehouse portfolio, in each case, in place as of March 31, 2025. These leases had a weighted average remaining term of 42 months as of March 31, 2025.
| | | | | | | | | | | | | | | | | | | | | | | | | | | | | | | | | | | | | | |
| Lease Expiration Year | | No. of Leases Expiring | | Annualized Rent(1) | | % of Total Warehouse Rent & Storage Segment Revenues for the twelve months ended March 31, 2025 | | Leased Square Footage | | % Leased
Square
Footage | | Annualized Rent at Expiration(2) |
(Dollars in thousands) |
| Month-to-Month | | 13 | | | $ | 977 | | | 0.1 | % | | 63 | | | 1.5 | % | | $ | 977 | |
| 2025 | | 38 | | | 11,981 | | | 1.1 | % | | 720 | | | 16.6 | % | | 12,009 | |
| 2026 | | 29 | | | 7,997 | | | 0.8 | % | | 616 | | | 14.2 | % | | 8,150 | |
| 2027 | | 17 | | | 5,205 | | | 0.5 | % | | 414 | | | 9.5 | % | | 5,512 | |
| 2028 | | 26 | | | 10,119 | | | 1.0 | % | | 1,227 | | | 28.3 | % | | 10,586 | |
| 2029+ | | 23 | | | 22,326 | | | 2.1 | % | | 1,300 | | | 29.9 | % | | 26,956 | |
| Total | | 146 | | | $ | 58,605 | | | 5.6 | % | | 4,340 | | | 100 | % | | $ | 64,190 | |
(1)Represents monthly rental payments under the relevant leases as of March 31, 2025, multiplied by 12.
(2)Represents monthly rental payments under the relevant leases in the calendar year of expiration, multiplied by 12.
| | | | | | | | |
| | |
| Financial Supplement | First Quarter 2025 |
Capital Expenditures and Repair and Maintenance Expenses
Maintenance Capital Expenditures and Repair and Maintenance Expenses
We utilize a strategic approach to maintenance capital expenditures and repair and maintenance expenses to maintain the high quality and operational efficiency of our warehouses and equipment and ensure that our assets meet the “mission-critical” role they serve in the cold chain. The Company assesses its capital expenditure requirements regularly to ensure that it meets maintenance obligations in a timely manner.
Maintenance Capital Expenditures
Maintenance capital expenditures are capitalized funds used to uphold and extend the useful life of assets, resulting in future economic benefits. These expenditures relate to routine and recurring maintenance that are essential to sustain current operations. This includes the cost to purchase and install, repair, or construct assets when it results in a useful life longer than one year and the cost per asset is over a de minimis threshold.
Examples of maintenance capital expenditures related to real estate are roof replacements, refrigeration equipment refurbishment, and racking system repairs. Examples of maintenance capital expenditures related to personal property include expenditures on material handling equipment and transportation assets. Examples of maintenance capital expenditures related to information technology include maintenance on existing servers, networking equipment and minor software updates.
Repair and Maintenance Expenses
We incur repair and maintenance expenses that include costs of routine maintenance and repairs that do not materially extend the useful life of the asset and minor replacements with an asset value that are less than a de minimis threshold. These expenditures are included as an operating expense in our statement of operations. Examples of repair and maintenance expenses include ordinary repairs on roofs, racking, refrigeration and material handling equipment.
The following table sets forth our repair and maintenance expenses for the three months ended March 31, 2025 and 2024.
| | | | | | | | | | | | | | | |
| | | Three Months Ended March 31, |
| | | | 2025 | | 2024 |
| | | | | (In thousands) |
| Real estate | | | | | $ | 11,606 | | | $ | 14,588 | |
| Personal property | | | | | 19,915 | | | 16,304 | |
Total repair and maintenance expenses | | | | | $ | 31,521 | | | $ | 30,892 | |
External Growth and Integration Capital Expenditures
External growth and integration capital expenditures refer to investments to expand our operations and enhance market position through mergers and acquisitions. These expenditures typically include costs associated with acquiring new businesses, integrating operational systems, rebranding, and upgrading infrastructure to our standards. Unlike organic growth, which focuses on internal development through existing resources and capabilities, external growth strategies rely on leveraging external assets and synergies to drive value creation and achieve strategic objectives.
The Company completed the Houston acquisition on March 17, 2025 for total cash consideration of $108.4 million. The strategic benefits of the acquisition include the ability to accommodate a significant high-turn retail fixed committed customer.
| | | | | | | | |
| | |
| Financial Supplement | First Quarter 2025 |
Expansion, Development and Organic Capital Expenditures
Expansion, development and organic growth capital expenditures refer to investments to enhance our existing operations and increase storage capacity. Examples of capital expenditures associated with expansion, development and organic growth are warehouse and pallet position expansion, expansion of drop lots, greenfield developments, and purchase of leased facilities.
The expansion and development expenditures (inclusive of capitalized interest, compensation, and travel expenses) for the three months ended March 31, 2025 include $20.1 million related to the Kansas City, Missouri development; $18.6 million related to the Allentown, Pennsylvania expansion; $8.6 million for the Dallas Ft. Worth, Texas expansion; $7.1 million related to the Sydney, Australia expansion; $2.3 million for the Saint John, NB, Canada development; and $1.5 million related to the Christchurch, New Zealand expansion.
Customer Attraction and Retention Capital Expenditures
Customer attraction and retention capital expenditures refer to investments that enhance customer engagement, satisfaction, and loyalty to drive revenue growth for new and existing customers and reduce customer churn. These expenditures include replacing existing components of assets before the end of their functional lives, improvements to warehouse configurations to provide a more customer-friendly experience, and improvements to outdoor facades.
Technological Upgrades and Enhancements
Technological upgrades and enhancements refer to investments aimed at improving our technological infrastructure and capabilities to increase efficiency, productivity, and competitiveness. This category includes investments in hardware, software, and systems that automate processes, enhance data analytics, and improve cyber security. This category also includes ESG initiatives including the installation of LED lighting, solar panels, hydrogen fuel cells, high speed dock doors, and other asset modernization.
The following table sets forth our total capital expenditures for the three months ended March 31, 2025 and 2024.
| | | | | | | | | | | | | | | |
| | | Three Months Ended March 31, |
| | | | 2025 | | 2024 |
| | | (In thousands) |
| Maintenance | | | | | $ | 14,799 | | | $ | 17,933 | |
| External growth and integration | | | | | 108,448 | | | — | |
| Expansion, development and organic growth | | | | | 94,258 | | | 29,952 | |
| Technological upgrades and enhancements | | | | | 4,511 | | | 980 | |
Total capital expenditures(1) | | | | | $ | 222,016 | | | $ | 48,865 | |
(1) Capital expenditures in the Condensed Consolidated Statements of Cash Flows include $32.5 million of costs accrued in the prior period and paid in the current period and exclude $35.9 million of costs accrued in the current period that will be paid in a future period.
Capitalized Interest and Other Costs
We incurred capitalized interest of $4.0 million and $3.4 million for the three months ended March 31, 2025 and 2024, respectively, which is included in the capital expenditures noted in the table above. We also incurred capitalized compensation and travel expense aggregating to $7.5 million and $4.9 million during the three months ended March 31, 2025 and 2024, respectively.
| | | | | | | | |
| | |
| Financial Supplement | First Quarter 2025 |
External Growth and Capital Deployment
| | | | | | | | | | | | | | | | | | | | | | | | | | | | | | | | | | | | | | | | | | | | | | | | | | | | | | | | |
Recently Completed Expansion and Development Projects - Non-Same Store |
| Facility | | Opportunity Type | | Facility Type
(A = Automated)
(C = Conventional) | | Tenant Opportunity | | Cubic Feet (In millions) | | Pallet Positions (In thousands) | | Cost to Complete (In millions)(1) | | Expected
Stabilized
NOI ROIC | | Completion Date | | Expected Full Stabilized Quarter |
| Lancaster, PA | | Development | | Distribution (A) | | Build-to-suit | | 11.4 | | 28 | | $164 | | 10-12% | | Q1 2023 | | Q3 2025 |
| Plainville, CT | | Development | | Distribution (A) | | Build-to-suit | | 12.1 | | 31 | | $161 | | 10-12% | | Q4 2023 | | Q4 2025 |
(1)Cost to complete represents total costs incurred through the completion date. These amounts exclude additional costs incurred to reach stabilization, which do not materially impact the currently disclosed return on invested capital estimates.
| | | | | | | | | | | | | | | | | | | | | | | | | | | | | | | | | | | | | | | | | | | | | | | | | | | | | | | | | | | | | | | | | | | | |
Expansion and Development Projects In Process and Announced - Non-Same Store |
| | | | | Facility Type
(A = Automated)
(C = Conventional) | | | | Under
Construction | | Investment in Expansion / Development (In millions) | | Expected
Stabilized
NOI ROIC | | Target Completion Date | | Expected Full Stabilized Quarter |
| Facility | | Opportunity Type | | | Tenant Opportunity | Cubic Feet (In millions) (1) | | Pallet Positions (In thousands) (1) | Cost to Date (2) | | Estimate to Complete | | Total Estimated
Cost |
| Allentown, PA | | Expansion | | Distribution (C) | | Multi-tenant | | 14.6 | | | 37 | | | $55 | | $30 - $35 | | $85 - $90 | | 10-12% | | Q2 2025 | | Q1 2027 |
| Kansas City, MO | | Development | | Distribution (C) | | Multi-tenant | | 13.5 | | | 22 | | | $52 | | $75 - $81 | | $127 - $133 | | 10-12% | | Q2 2025 | | Q1 2026 |
| Sydney, Australia | | Expansion | | Distribution (C) | | Multi-tenant | | 2.8 | | | 13 | | | A$20 | | A$24 - A$26 | | A$44 - A$46 | | 10-12% | | Q1 2026 | | Q1 2027 |
Christchurch, New Zealand | | Expansion | | Distribution (C) | | Multi-tenant | | 3.8 | | | 16 | | | NZ$3 | | NZD53 - NZD57 | | NZ$56 - NZ$60 | | 10-12% | | Q1 2026 | | Q3 2027 |
Saint John, NB, Canada | | Development | | Distribution (C) | | Multi-tenant | | 7.4 | | | 22 | | | C$3 | | C$100 - C$110 | | C$103 - C$113 | | 10-12% | | Q3 2026 | | Q1 2028 |
| Dallas Ft. Worth, TX | | Expansion | | Distribution (A) | | Multi-tenant | | 18.8 | | | 50 | | | $15 | | $130 - $140 | | $145 - $155 | | 10-12% | | Q4 2026 | | Q2 2028 |
(1)Cubic feet and pallet positions are estimates while the facilities are under construction.
(2)Cost as of March 31, 2025.
| | | | | | | | | | | | | | | | | | | | | | | | | | | | | | | | | | | | | | | | | | | | | | | | | | | | | | | | |
Recent Acquisitions - Non-Same Store |
| Facility | | Metropolitan Area | | No. of Facilities | | Cubic Feet (In millions) | | Pallet Positions (In thousands) | | Acquisition Price (In millions) (1) | | Net Entry NOI Yield (1) | | Expected Three Year Stabilized
NOI ROIC | | Date Purchased | | Expected Full Stabilized Quarter |
| Baytown, TX | | Houston, TX | | 1 | | 10.7 | | 36 | | | $ | 127 | | | <2% | | 10-12% | | 3/17/2025 | | Q1 2027 |
(1)Inclusive of $16 million of capital to be invested to accommodate the new customers’ profile and get the facility up to Americold’s operating standards.
| | | | | | | | |
| | |
| Financial Supplement | First Quarter 2025 |
Other Supplemental Information
Same Store Historical Performance Trend - The following table reflects the actual results of our current same store pool, in USD, for the respective periods.
| | | | | | | | | | | | | | | | | | | | | | | | | | | | | |
(Dollars in thousands)(1) | Q1 25 | | Q4 24 | | Q3 24 | | Q2 24 | | Q1 24 |
Number of same store warehouses | 224 | | 224 | | 224 | | 224 | | 224 |
Same store revenues: | | | | | | | | | |
| Rent and storage | $245,196 | | $254,226 | | $256,287 | | $259,427 | | $256,771 |
| Warehouse services | 314,823 | | 338,351 | | 339,542 | | 322,446 | | 316,492 |
Total same store revenues | $560,019 | | $592,577 | | $595,829 | | $581,873 | | $573,263 |
Same store cost of operations: | | | | | | | | | |
| Power | 30,656 | | 34,287 | | 39,991 | | 35,379 | | 30,913 |
| Other facilities costs | 57,245 | | 56,170 | | 61,492 | | 56,025 | | 56,567 |
| Labor | 234,640 | | 243,021 | | 245,330 | | 235,609 | | 235,417 |
| Other services costs | 44,763 | | 52,706 | | 47,919 | | 46,857 | | 49,164 |
Total same store cost of operations | $367,304 | | $386,184 | | $394,732 | | $373,870 | | $372,061 |
| | | | | | | | | |
Same store contribution (NOI) | $192,715 | | $206,393 | | $201,097 | | $208,003 | | $201,202 |
Same store rent and storage contribution (NOI)(2) | $157,295 | | $163,769 | | $154,804 | | $168,023 | | $169,291 |
Same store services contribution (NOI)(3) | $35,420 | | $42,624 | | $46,293 | | $39,980 | | $31,911 |
| | | | | | | | | |
Same store margin | 34.4 | % | | 34.8 | % | | 33.8 | % | | 35.7 | % | | 35.1 | % |
Same store rent and storage margin(4) | 64.2 | % | | 64.4 | % | | 60.4 | % | | 64.8 | % | | 65.9 | % |
Same store services margin(5) | 11.3 | % | | 12.6 | % | | 13.6 | % | | 12.4 | % | | 10.1 | % |
| | | | | | | | | |
Same store rent and storage metrics: | | | | | | | | | |
| Economic occupancy | | | | | | | | | |
| Average economic occupied pallets | 4,044 | | 4,190 | | 4,137 | | 4,203 | | 4,267 |
| Economic occupancy percentage | 76.6 | % | | 79.3 | % | | 78.3 | % | | 79.6 | % | | 80.8 | % |
Same store rent and storage revenues per economic occupied pallet | $60.63 | | $60.67 | | $61.95 | | $61.72 | | $60.18 |
| | | | | | | | | |
| Physical occupancy | | | | | | | | | |
| Average physical occupied pallets | 3,434 | | 3,612 | | 3,584 | | 3,637 | | 3,698 |
| Average physical pallet positions | 5,279 | | 5,284 | | 5,284 | | 5,278 | | 5,279 |
| Physical occupancy percentage | 65.1 | % | | 68.4 | % | | 67.8 | % | | 68.9 | % | | 70.1 | % |
Same store rent and storage revenues per physical occupied pallet | $71.40 | | $70.38 | | $71.51 | | $71.33 | | $69.44 |
| | | | | | | | | |
Same store services metrics: | | | | | | | | | |
| Throughput pallets | 8,561 | | 9,047 | | 8,999 | | 8,819 | | 8,815 |
Same store warehouse services revenues per throughput pallet | $36.77 | | $37.40 | | $37.73 | | $36.56 | | $35.90 |
| | | | | | | | | |
Total non-same store results: | | | | | | | | | |
Non-same store revenues | $ | 15,338 | | | $ | 13,888 | | | $ | 16,352 | | | $ | 18,514 | | | $ | 24,447 | |
Non-same store cost of operations | $ | 11,468 | | | $ | 18,854 | | | $ | 18,825 | | | $ | 21,986 | | | $ | 28,518 | |
Non-same store contribution NOI | $ | 3,870 | | | $ | (4,966) | | | $ | (2,473) | | | $ | (3,472) | | | $ | (4,071) | |
(1)Total amounts in the table above and year to date calculations may not calculate exactly due to rounding.
(2)Calculated as rent and storage revenues less power and other facilities costs.
(3)Calculated as warehouse services revenues less labor and other services costs.
(4)Calculated as warehouse rent and storage contribution (NOI) divided by warehouse rent and storage revenues.
(5)Calculated as warehouse services contribution (NOI) divided by warehouse services revenues.
| | | | | | | | |
| | |
| Financial Supplement | First Quarter 2025 |
Unconsolidated Joint Ventures (Investments in Partially Owned Entities)
As of March 31, 2025, the Company owned a 14.99% equity share in the Brazil-based SuperFrio joint venture. The debt of our unconsolidated joint venture is non-recourse to us, except for customary exceptions pertaining to such matters as intentional misuse of funds, environmental conditions and material misrepresentations. During the 1st quarter of 2025, we entered into an agreement to sell our equity interest in the SuperFrio joint venture which was finalized in April of 2025.
| | | | | | | | | | | | | |
| SuperFrio |
| | | March 31, |
| Summary Balance Sheet - at the JV’s 100% share in BRLs | | | 2025 | | 2024 |
| (In thousands) | | | | | |
Net book value of property, buildings, and equipment | | | R$ | 960,483 | | R$ | 1,135,219 |
| Other assets | | | 547,620 | | 508,905 |
| Total assets | | | R$ | 1,508,103 | | R$ | 1,644,124 |
| | | | | |
| Debt | | | R$ | 726,288 | | R$ | 731,429 |
| Other liabilities | | | 542,236 | | 518,764 |
| Equity | | | 239,579 | | 393,931 |
| Total liabilities and equity | | | R$ | 1,508,103 | | R$ | 1,644,124 |
| | | | | |
| Americold’s ownership percentage | | | 14.99 | % | | 14.99 | % |
| | | | | |
BRL/USD end of period rate | | | 0.1755 | | 0.1994 |
| Americold’s pro rata share of debt at BRL/USD rate | | | $ | 19,107 | | $ | 21,877 |
| | | | | |
| | Three Months Ended March 31, |
| Summary Statement of Operations - at the JV’s 100% share in BRLs | | | 2025 | | 2024 |
| (In thousands) | | | | | |
| Revenues | | | R$ | 142,158 | | | R$ | 145,274 | |
| | | | | |
| Cost of operations | | | 118,507 | | | 111,612 | |
Selling, general, and administrative expense | | | 8,052 | | | 7,400 | |
M&A expense & other | | | 4,250 | | | 3,228 | |
| Depreciation & amortization | | | 15,609 | | | 18,654 | |
| Total operating expenses | | | 146,418 | | | 140,894 | |
Operating (loss) income | | | (4,260) | | | 4,380 | |
| | | | | |
| Interest expense | | | (45,444) | | | (30,349) | |
Other income | | | 524 | | | 779 | |
Income tax (expense) benefit | | | (231) | | | 48 | |
| Non-operating expenses | | | (45,151) | | | (29,522) | |
| Net loss | | | R$ | (49,411) | | | R$ | (25,142) | |
| | | | | |
| Americold’s ownership percentage | | | 14.99 | % | | 14.99 | % |
| | | | | |
| BRL/USD average rate | | | 0.1709 | | | 0.2019 | |
| Americold’s pro rata share of NOI | | | $ | 606 | | | $ | 1,019 | |
| Americold’s pro rata share of Net loss | | | $ | (1,266) | | | $ | (761) | |
| Americold’s pro rata share of Core FFO | | | $ | (936) | | | $ | (371) | |
Americold’s pro rata share of Adjusted FFO | | | $ | (794) | | | $ | (159) | |
| | | | | | | | |
| | |
| Financial Supplement | First Quarter 2025 |
Unconsolidated Joint Ventures (Investments in Partially Owned Entities) (Continued)
As of March 31, 2025, the Company owned a 49% equity share in the Dubai-based RSA joint venture. The debt of our unconsolidated joint venture is non-recourse to us, except for customary exceptions pertaining to such matters as intentional misuse of funds, environmental conditions and material misrepresentations.
| | | | | | | | | | |
| RSA |
| | | March 31, |
| Summary Balance Sheet - at the JV’s 100% share in AED | | | 2025 | 2024 |
| (In thousands) | | | | |
Net book value of property, buildings, and equipment | | | 147,489 | | 43,395 | |
| Other assets | | | 9,295 | | 3,763 | |
| Total assets | | | 156,784 | | 47,158 | |
| | | | |
| Debt | | | 101,810 | | 25,028 | |
| Other liabilities | | | 25,677 | | 3,540 | |
| Equity | | | 29,297 | | 18,590 | |
| Total liabilities and equity | | | 156,784 | | 47,158 | |
| | | | |
| Americold’s ownership percentage | | | 49 | % | 49 | % |
| | | | |
AED/USD end of period rate | | | 0.2723 | | 0.2723 | |
| Americold’s pro rata share of debt at AED/USD rate | | | $ | 13,584 | | $ | 3,339 | |
| | | | |
| | Three Months Ended March 31, |
| Summary Statement of Operations - at the JV’s 100% share in AED | | | 2025 | 2024 |
| (In thousands) | | | | |
| Revenues | | | 6,508 | | 2,762 | |
| | | | |
| Cost of operations | | | 5,261 | | 3,755 | |
Depreciation & amortization | | | 882 | | 414 | |
| Total operating expenses | | | 6,143 | | 4,169 | |
| Operating income (loss) | | | 365 | | (1,407) | |
| | | | |
| Interest expense | | | (653) | | (193) | |
| Non-operating expenses | | | (653) | | (193) | |
Net loss | | | (288) | | (1,600) | |
| | | | |
| Americold’s ownership percentage | | | 49 | % | 49 | % |
| | | | |
| AED/USD average rate | | | 0.2723 | 0.2723 |
| Americold’s pro rata share of NOI | | | $ | 166 | | $ | (132) | |
Americold’s pro rata share of Net loss | | | $ | (38) | | $ | (213) | |
| Americold’s pro rata share of Core FFO | | | $ | 60 | | $ | (164) | |
Americold’s pro rata share of Adjusted FFO | | | $ | 76 | | $ | (159) | |
| | | | | | | | |
| | |
| Financial Supplement | First Quarter 2025 |
Reconciliations, Notes, and Definitions
| | | | | | | | | | | | | | | |
| Revenues and Contribution (NOI) by Segment |
(In thousands) |
| Three Months Ended March 31, | | |
| 2025 | | 2024 | | | | |
| Segment revenues: | | | | | | | |
| Warehouse | $ | 575,357 | | | $ | 597,710 | | | | | |
| Transportation | 43,993 | | | 56,853 | | | | | |
| Third-party managed | 9,630 | | | 10,417 | | | | | |
| Total revenues | 628,980 | | | 664,980 | | | | | |
| | | | | | | |
| Segment contribution: | | | | | | | |
| Warehouse | 196,585 | | | 197,131 | | | | | |
| Transportation | 7,254 | | | 11,522 | | | | | |
| Third-party managed | 2,009 | | | 2,183 | | | | | |
| Total segment contribution (NOI) | 205,848 | | | 210,836 | | | | | |
| | | | | | | |
| Reconciling items: | | | | | | | |
| Depreciation and amortization expense | (88,982) | | | (92,095) | | | | | |
Selling, general, and administrative expense | (69,235) | | | (65,426) | | | | | |
| Acquisition, cyber incident, and other, net | (25,414) | | | (14,998) | | | | | |
| Net gain from sale of real estate | — | | | 3,514 | | | | | |
| Interest expense | (36,117) | | | (33,430) | | | | | |
| Loss on debt extinguishment and termination of derivative instruments | — | | | (5,182) | | | | | |
| Loss from investments in partially owned entities | (1,363) | | | (949) | | | | | |
| Other, net | 1,296 | | | 9,526 | | | | | |
| (Loss) income before income taxes | $ | (13,967) | | | $ | 11,796 | | | | | |
We view and manage our business through three primary business segments—warehouse, transportation, and third-party managed. Our core business is our warehouse segment, where we provide temperature-controlled warehouse storage and related handling and other warehouse services. In our warehouse segment, we collect rent and storage fees from customers to store their frozen and perishable food and other products within our real estate portfolio. We also provide our customers with handling and other warehouse services related to the products stored in our buildings that are designed to optimize their movement through the cold chain, such as the placement of food products for storage and preservation, the retrieval of products from storage upon customer request, case-picking, blast freezing, produce grading and bagging, ripening, kitting, protein boxing, repackaging, e-commerce fulfillment, and other recurring handling services.
In our transportation segment, we broker and manage transportation of frozen and perishable food and other products for our customers. Our transportation services include consolidation services (i.e., consolidating a customer’s products with those of other customers for more efficient shipment), freight under management services (i.e., arranging for and overseeing transportation of customer inventory) and dedicated transportation services, each designed to improve efficiency and reduce transportation and logistics costs to our customers. We provide these transportation services at cost plus a service fee or, in the case of our consolidation or dedicated services, we may charge a fixed fee. We supplemented our regional, national and truckload consolidation services with the transportation operations from various warehouse acquisitions. We also provide multi-modal global freight forwarding services to support our customers’ needs in certain markets.
Under our third-party managed segment, we manage warehouses on behalf of third parties and provide warehouse management services to leading food manufacturers and retailers in their owned facilities. We believe using our third-party management services allows our customers to increase efficiency, reduce costs, reduce supply-chain risks and focus on their core businesses. We also believe that providing third-party management services allows us to offer a complete and integrated suite of services across the cold chain.
| | | | | | | | |
| | |
| Financial Supplement | First Quarter 2025 |
| | |
| Notes and Definitions |
We use the following non-GAAP financial measures as supplemental performance measures of our business: NAREIT FFO, Core FFO, Adjusted FFO, NAREIT EBITDAre, Core EBITDA, Core EBITDA margin, net debt to pro-forma Core EBITDA, segment contribution (“NOI”) and margin, same store revenues and NOI, certain constant currency metrics, and maintenance capital expenditures. |
We calculate NAREIT funds from operations, or NAREIT FFO, in accordance with the standards established by the Board of Governors of the National Association of Real Estate Investment Trusts, or NAREIT. NAREIT defines FFO as net income or loss determined in accordance with U.S. GAAP, excluding extraordinary items as defined under U.S. GAAP and gains or losses from sales of previously depreciated operating real estate and other assets, plus specified non-cash items, such as real estate asset depreciation and amortization, impairment charges on real estate related assets, and our share of reconciling items for partially owned entities. We believe that NAREIT FFO is helpful to investors as a supplemental performance measure because it excludes the effect of real estate related depreciation, amortization and gains or losses from sales of real estate or real estate related assets, all of which are based on historical costs, which implicitly assumes that the value of real estate diminishes predictably over time. Since real estate values instead have historically risen or fallen with market conditions, NAREIT FFO can facilitate comparisons of operating performance between periods and among other equity REITs. |
We calculate core funds from operations, or Core FFO, as NAREIT FFO adjusted for the effects of Net loss (gain) on sale of non-real assets; Acquisition, cyber incident, and other, net; Loss on debt extinguishment and termination of derivative instruments; Foreign currency exchange loss; Gain on legal settlement related to prior period operations; Project Orion deferred costs amortization; and Our share of reconciling items related to partially owned entities. We believe that Core FFO is helpful to investors as a supplemental performance measure because it excludes the effects of certain items which can create significant earnings volatility, but which do not directly relate to our core business operations. We believe Core FFO can facilitate comparisons of operating performance between periods, while also providing a more meaningful predictor of future earnings potential. |
| However, because NAREIT FFO and Core FFO add back real estate depreciation and amortization and do not capture the level of maintenance capital expenditures necessary to maintain the operating performance of our properties, both of which have material economic impacts on our results from operations, we believe the utility of NAREIT FFO and Core FFO measures of our performance may be limited. |
We calculate adjusted funds from operations, or Adjusted FFO, as Core FFO adjusted for the effects of Amortization of deferred financing costs and pension withdrawal liability; Amortization of below/above market leases; Straight-line rent adjustment; Deferred income tax expense; Stock-based compensation expense; Non-real estate depreciation and amortization; Maintenance capital expenditures; and Our share of reconciling items related to partially owned entities. We believe that Adjusted FFO is helpful to investors as a meaningful supplemental comparative performance measure of our ability to make incremental capital investments in our business and to assess our ability to fund distribution requirements from our operating activities. |
NAREIT FFO, Core FFO and Adjusted FFO are used by management, investors and industry analysts as supplemental measures of operating performance of equity REITs. NAREIT FFO, Core FFO and Adjusted FFO should be evaluated along with U.S. GAAP net income and net income per diluted share (the most directly comparable U.S. GAAP measures) in evaluating our operating performance. NAREIT FFO, Core FFO and Adjusted FFO do not represent net income or cash flows from operating activities in accordance with U.S. GAAP and are not indicative of our results of operations or cash flows from operating activities as disclosed in our consolidated statements of operations included in our quarterly and annual reports. NAREIT FFO, Core FFO and Adjusted FFO should be considered as supplements, but not alternatives, to our net income or cash flows from operating activities as indicators of our operating performance. Moreover, other REITs may not calculate FFO in accordance with the NAREIT definition or may interpret the NAREIT definition differently than we do. Accordingly, our NAREIT FFO may not be comparable to FFO as calculated by other REITs. In addition, there is no industry definition of Core FFO or Adjusted FFO and, as a result, other REITs may also calculate Core FFO or Adjusted FFO, or other similarly-captioned metrics, in a manner different than we do. We reconcile NAREIT FFO, Core FFO and Adjusted FFO to Net (loss) income, which is the most directly comparable financial measure calculated in accordance with U.S. GAAP. |
We calculate NAREIT EBITDA for Real Estate, or NAREIT EBITDAre, in accordance with the standards established by the Board of Governors of NAREIT, defined as, Net (loss) income before Depreciation and amortization; Interest expense; Income tax expense; Net gain from sale of real estate; and Adjustment to reflect share of EBITDAre of partially owned entities. NAREIT EBITDAre is a measure commonly used in our industry, and we present NAREIT EBITDAre to enhance investor understanding of our operating performance. We believe that NAREIT EBITDAre provides investors and analysts with a measure of operating results unaffected by differences in capital structures, capital investment cycles and useful life of related assets among otherwise comparable companies. |
We also calculate our Core EBITDA as NAREIT EBITDAre further adjusted for Acquisition, cyber incident, and other, net; Loss from investments in partially owned entities; Foreign currency exchange loss; Stock-based compensation expense; Loss on debt extinguishment and termination of derivative instruments; Loss on other asset disposals; Gain on legal settlement related to prior period operations; Project Orion deferred costs amortization; and Reduction in EBITDAre from partially owned entities. We believe that the presentation of Core EBITDA provides a measurement of our operations that is meaningful to investors because it excludes the effects of certain items that are otherwise included in NAREIT EBITDAre but which we do not believe are indicative of our core business operations. We calculate Core EBITDA margin as Core EBITDA divided by revenues. NAREIT EBITDAre and Core EBITDA are not measurements of financial performance or liquidity under U.S. GAAP, and our NAREIT EBITDAre and Core EBITDA may not be comparable to similarly titled measures of other companies. You should not consider our NAREIT EBITDAre and Core EBITDA as alternatives to net income or cash flows from operating activities determined in accordance with U.S. GAAP. Our calculations of NAREIT EBITDAre and Core EBITDA have limitations as analytical tools, including: |
•these measures do not reflect our historical or future cash requirements for maintenance capital expenditures or growth and expansion capital expenditures; •these measures do not reflect changes in, or cash requirements for, our working capital needs; •these measures do not reflect the interest expense, or the cash requirements necessary to service interest or principal payments, on our indebtedness; •these measures do not reflect our tax expense or the cash requirements to pay our taxes; and •although depreciation and amortization are non-cash charges, the assets being depreciated will often have to be replaced in the future and these measures do not reflect any cash requirements for such replacements. |
| | | | | | | | |
| | |
| Financial Supplement | First Quarter 2025 |
| | |
| Net debt to proforma Core EBITDA is calculated using total debt outstanding less cash, cash equivalents, and restricted cash divided by pro-forma and/or Core EBITDA. If applicable, we calculate pro-forma Core EBITDA as Core EBITDA further adjusted for acquisitions. The pro-forma adjustment for acquisitions reflects the Core EBITDA for the period of time prior to acquisition. |
NOI is calculated as earnings/loss before interest expense, taxes, Depreciation and amortization, and excluding corporate Selling, general, and administrative expense; Acquisition, cyber incident, and other, net; Impairment of indefinite and long-lived assets; Net gain from sale of real estate and all components of non-operating other income and expense. Management believes that this is a helpful metric to measure period to period operating performance of the business. |
We define our “same store” population once annually at the beginning of the current calendar year. Our population includes properties owned or leased for the entirety of two comparable periods with at least twelve consecutive months of normalized operations prior to January 1 of the current calendar year. We define “normalized operations” as properties that have been open for operation or lease, after development, expansion, or significant modification (e.g., rehabilitation subsequent to a natural disaster). Acquired properties are included in the “same store” population if owned by us as of the first business day of the prior calendar year (e.g. January 1, 2024) and are still owned by us as of the end of the current reporting period, unless the property is under development. The “same store” pool is also adjusted to remove properties that are being exited (e.g. non-renewal of warehouse lease or held for sale to third parties), were sold, or entered development subsequent to the beginning of the current calendar year. Changes in ownership structure (e.g., purchase of a previously leased warehouse) does not result in a facility being excluded from the same store population, as management believes that actively managing its real estate is normal course of operations. Additionally, management classifies new developments (both conventional and automated facilities) as a component of the same store pool once the facility is considered fully operational and both inbounding and outbounding product for at least twelve consecutive months prior to January 1 of the current calendar year. |
We calculate “same store revenues” as revenues for the same store population. We calculate “same store contribution (NOI)” as revenues for the same store population less its cost of operations (excluding any Depreciation and amortization, Impairment of indefinite and long-lived assets, Selling, general, and administrative, Acquisition, cyber incident, and other, net and Net gain from sale of real estate). In order to derive an appropriate measure of period-to-period operating performance, we also calculate our same store contribution (NOI) on a constant currency basis to remove the effects of foreign currency exchange rate movements by using the comparable prior period exchange rate to translate from local currency into U.S. dollars for both periods. We evaluate the performance of the warehouses we own or lease using a “same store” analysis, and we believe that same store contribution (NOI) is helpful to investors as a supplemental performance measure because it includes the operating performance from the population of properties that is consistent from period to period and also on a constant currency basis, thereby eliminating the effects of changes in the composition of our warehouse portfolio and currency fluctuations on performance measures. Same store contribution (NOI) is not a measurement of financial performance under U.S. GAAP. In addition, other companies providing temperature-controlled warehouse storage and handling and other warehouse services may not define same store or calculate same store contribution (NOI) in a manner consistent with our definition or calculation. Same store contribution (NOI) should be considered as a supplement, but not as an alternative, to our results calculated in accordance with U.S. GAAP. |
| We define “maintenance capital expenditures” as capital expenditures made to extend the life of, and provide future economic benefit from, our existing temperature-controlled warehouse network and its existing supporting personal property and information technology. Maintenance capital expenditures do not include acquisition costs contemplated when underwriting the purchase of a building or costs which are incurred to bring a building up to Americold’s operating standards. |
| All quarterly amounts and non-GAAP disclosures within this filing shall be deemed unaudited. |