Performance Management - Fairlead Tactical Sector ETF
May 29, 2025
The performance information below provides some indication of the risks of investing in the Fund. The bar chart shows changes in the performance of the Fund from year to year. The table shows the average annual returns of the Fund for the periods of 1 Year and Since Inception compared to a broad-based market index. Visit www.fairleadfunds.com for current performance information.
Past performance, before and after taxes, is not necessarily predictive of future performance.
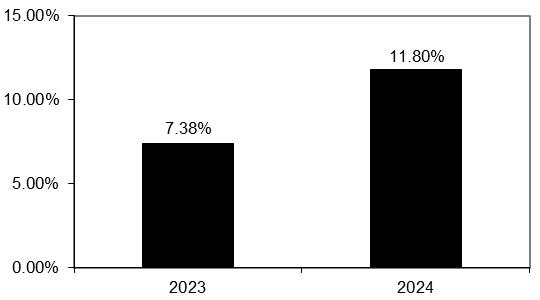
Highest and Lowest Quarter Returns
(for periods shown in the bar chart)
| Highest | 10/1/2023 – 12/31/2023 | 9.82% | |
| Lowest | 7/1/2023 – 9/30/2023 | (4.45)% |
The Fund’s year-to-date return as of March 31, 2025 was (0.48)%.
| 1 Year | Since Inception (3/22/2022) |
|||||
| Fairlead Tactical Sector ETF | ||||||
| Before Taxes | 11.80% | 4.61% | ||||
| After Taxes on Distributions(1) | 11.47% | 4.21% | ||||
| After Tax on Distributions and Sale of Fund Shares(1) | 7.22% | 3.44% | ||||
| Russell 1000 Equal Weight Total Return Index (reflects no deduction for fees, expenses or taxes)(2) | 11.53% | 3.57% | ||||
| Morningstar Moderate Target Risk Index (reflects no deduction for fees, expenses or taxes)(3) | 8.27% | 3.73% |
| (1) | After-tax returns are estimated using the highest historical individual federal marginal income tax rates and do not reflect the impact of state and local taxes. Actual after-tax returns depend on an investor’s tax situation and may differ from those shown. After-tax returns are not relevant to investors who hold Fund shares through tax-deferred arrangements such as 401(k) plans or individual retirement accounts. |
| (2) | Effective with the filing of the Fund’s financial statements and tailored shareholder report for the period ended January 30, 2025, the Fund changed its primary index to the Russell 1000® Equal Weight Total Return Index due to new regulatory requirements for broad-based securities index comparison. The Fund does not intend to deliver similar risk characteristics to the Russell 1000® Equal Weight Total Return Index which is a benchmark only for regulatory purposes. The Russell 1000® Equal Weight Total Return Index methodology equally weights each industry within the index and then equally weights the companies within each industry. The Russell 1000® Equal Weight Total Return Index is re-weighted on a quarterly basis. The Russell 1000® Equal Weight Total Return Index is representative of a broader domestic equity market and range of securities than is found in the Fund’s portfolio. Individuals cannot invest directly in an Index; however, an individual can invest in exchange-traded funds or other investment vehicles that attempt to track the performance of a benchmark index. |
| (3) | The Morningstar Target Risk Index family is designed to meet the needs of investors who would like to maintain a target level of equity exposure. The index family provides global equity market risk levels that are scaled to fit five equity market risk profiles: aggressive, moderately aggressive, moderate, moderately conservative, and conservative. The Morningstar Target Risk Index series consists of five indexes with five levels of global equity exposure set at 95%, 80%, 60%, 40%, and 20%. These target equity risk exposures will remain fixed; adjustments to the sub-asset class allocations will occur annually when Ibbotson provides updated allocations for all the asset allocation indexes that reflect Ibbotson’s latest capital markets, asset allocation assumptions, and asset allocation guidelines. Index returns do not reflect the deduction of expenses, which have been deducted from the Fund’s returns. Index returns assume reinvestment of all distributions and do not reflect the deduction of taxes and fees. Individuals cannot invest directly in an index; however, an individual may invest in exchange-traded funds or other investment vehicles that attempt to track the performance of a benchmark index. |