UNITED STATES
SECURITIES AND EXCHANGE COMMISSION
Washington, D.C. 20549
----------------------------------------------------------------
FORM
CERTIFIED SHAREHOLDER REPORT
OF REGISTERED MANAGEMENT
INVESTMENT COMPANIES
Investment Company Act file number 811-23787
----------------------------------------------------------------
(Exact name of registrant as specified in charter)
----------------------------------------------------------------
300 Brickstone Square, 7th Floor
Andover, Massachusetts 01810
(Address of principal executive offices) (Zip code)
Christopher Faucher
Constitution Capital PM, LP
300 Brickstone Square, 7th Floor
Andover, Massachusetts 01810
(Name and address of agent for service)
----------------------------------------------------------------
registrant’s telephone number, including area code: (855) 551-2276
Date of fiscal year end: March 31
Date of reporting period:
Form N-CSR is to be used by management investment companies to file reports with the Commission not later than 10 days after the transmission to stockholders of any report that is required to be transmitted to stockholders under Rule 30e-1 under the Investment Company Act of 1940 (17 CFR 270.30e-1). The Commission may use the information provided on Form N-CSR in its regulatory, disclosure review, inspection, and policymaking roles.
A registrant is required to disclose the information specified by Form N-CSR, and the Commission will make this information public. A registrant is not required to respond to the collection of information contained in Form N-CSR unless the Form displays a currently valid Office of Management and Budget (“OMB”) control number. Please direct comments concerning the accuracy of the information collection burden estimate and any suggestions for reducing the burden to Secretary, Securities and Exchange Commission, 100 F Street, NE, Washington, DC 20549-1090. The OMB has reviewed this collection of information under the clearance requirements of 44 U.S.C. § 3507.
ITEM 1. REPORTS TO STOCKHOLDERS.
(a) The Report to Shareholders is attached herewith.
|
Constitution Capital Access Fund, LLC |
|
Table of Contents For the Year Ended March 31, 2025 |
|
Manager’s Discussion and Analysis of Fund Performance (Unaudited) |
2 |
|
|
6 |
||
|
7 |
||
|
13 |
||
|
14 |
||
|
15 |
||
|
16 |
||
|
17 |
||
|
20 |
||
|
37 |
||
|
39 |
||
|
40 |
1
|
Constitution Capital Access Fund, LLC |
|
Manager’s Discussion and Analysis of Fund Performance March 31, 2025 (Unaudited) |
Dear Shareholders,
Constitution Capital Partners (an affiliate of Constitution Capital PM, L.P.) is pleased to present the Annual Report for the Constitution Capital Access Fund, LLC (the “Fund”) for the fiscal year ended March 31, 2025. The Fund produced an 8.22%1 (Class I) total return for the fiscal year. The Fund finished the fiscal year with net assets of $710 million and fair market value of investments of $764 million2. The Fund is composed of 80 investments into 339 underlying companies. These investments are managed by 35 unique sponsors with proven value-producing strategies and are tactically weighted across geography and sector.
Management Commentary
The twelve-month period ending March 31, 2025, has unfolded amidst shifts in the political and economic environment following the inauguration of a new administration in January 2025. Despite the uncertainty introduced by new policies including changes in tariffs as well as government downsizing and modernization efforts, the US economy has shown resilience. Even with economic uncertainties around tariffs and federal spending cuts, the private equity (“PE”) market entered 2025 with solid momentum tempered by a cautious outlook. In Q1 2025, the US private equity market saw deal value rise 36% year-over-year to $260 billion compared to $191 billion in Q1 2024. For the LTM period ended Q1 2025, the US PE market saw $958 billion (8% year-over-year increase) in total deal value across 9,014 transactions compared to 2024 which saw $889 billion of total deal value across 8,775 transactions.3
The Fund’s Institutional Share Class (Class I) generated an 8.22% total return for the fiscal year ended March 31, 2025. The Fund’s performance during the trailing twelve-month period ended March 31, 2025, was driven primarily by strong appreciation of Direct Equity Investments, followed by appreciation in Investment Funds. Foreign exchange movements also helped drive an increase in value. The Fund intends to declare dividends each year equal to all or substantially all of its taxable income. As such, in December 2024 the Fund announced a distribution of $0.66 per Class I share to investors composed entirely of long-term capital gains4. The distribution was paid in January 2025. In the trailing twelve months of operations, the Fund Investments generated $53 million in distributions against $25 million of capital calls, producing net cash distributions of $28 million. The Fund also received a combined $47 million in distributions from Direct Equity Investments, primarily related to an international boarding school business, a global entertainment agency, and a Swiss pharmaceutical skincare company. This net cash flow is a testament to the Fund’s focus on mitigating the “J-curve”5 through portfolio construction and vintage diversification.
The Fund completed eighteen new investments in the trailing twelve months totaling approximately $116 million in new commitments. Sixteen Direct Equity Investments accounted for 91% of the new commitments. The Fund also made a $10 million commitment to a healthcare-focused North American, middle-market buyout Investment Fund. The investment activity reflects the Fund’s commitment to its focus on Direct Investments.
Of the eighteen new investments completed during the fiscal year, fifteen were in North America and three were in Europe. The Fund continues to seek opportunities on a global basis with primary exposure in North America. As of March 31, 2025, the top four sector exposures in the Fund are as follows: healthcare (26.2%), consumer (25.5%)6, industrials/business services (16.6%)7, and Information Technology (14.0%). Constitution Capital Partners continues to favor investments in healthcare, industrials/business services, and consumer sectors.
_______________________
1 Excluding US GAAP adjustments required for financial reporting purposes, Class I total return for the fiscal year was 10.34%.
2 FMV of investments excludes short-term investments
3 Sources: Pitchbook: “Q1 2025 US PE Middle Market Report”
4 $0.66 per share (Class I) of annual dividend
5 In private equity, the J-Curve represents the tendency of private equity funds to post negative returns in the initial years and then post increasing returns in later years when the investments mature.
6 Inclusive of Consumer Staples and Consumer Discretionary.
7 Inclusive of Industrials and Materials.
2
|
Constitution Capital Access Fund, LLC |
|
Manager’s Discussion and Analysis of Fund Performance (Continued) March 31, 2025 (Unaudited) |
Outlook and Portfolio Positioning
Against the backdrop of wider market uncertainty, we remain confident in our cycle-tested approach of investing in middle market opportunities with (i) well-established leadership, (ii) organizational depth, (iii) secular tailwinds and durability, (iv) attractive financial profile with regard to growth, profitability, capital intensity and liquidity, (v) prudent levels of debt relative to comparable companies, (vi) entry enterprise valuations at a discount to public comparable companies and precedent transactions, and (vii) clear and actionable value creation plans that minimize downside exposure.
We expect this approach to deliver continued success to the Fund and remain prepared to capitalize on opportunities for outsized growth and returns.
We appreciate the trust and confidence you have demonstrated in Constitution Capital Partners through your investment in the Fund. Thank you for your continued support. If you have any additional questions or comments, we invite you to contact us at info@ccaf.com.
Sincerely,
Constitution Capital Partners
Past performance is no guarantee of future results.
Risk Considerations: Mutual fund investing involves risk, including the possible loss of principal.
An investment in the Fund should be considered illiquid. An investment in the Fund is not suitable for investors who need access to the money they invest. Current and future portfolio holdings are subject to change and risk. Fund holdings and sector allocations are subject to change at any time and are not recommendations to buy or sell any security. Please see the Schedule of Investments in this report for a complete list of Fund holdings.
3
|
Constitution Capital Access Fund, LLC |
|
Manager’s Discussion and Analysis of Fund Performance (Continued) March 31, 2025 (Unaudited) |
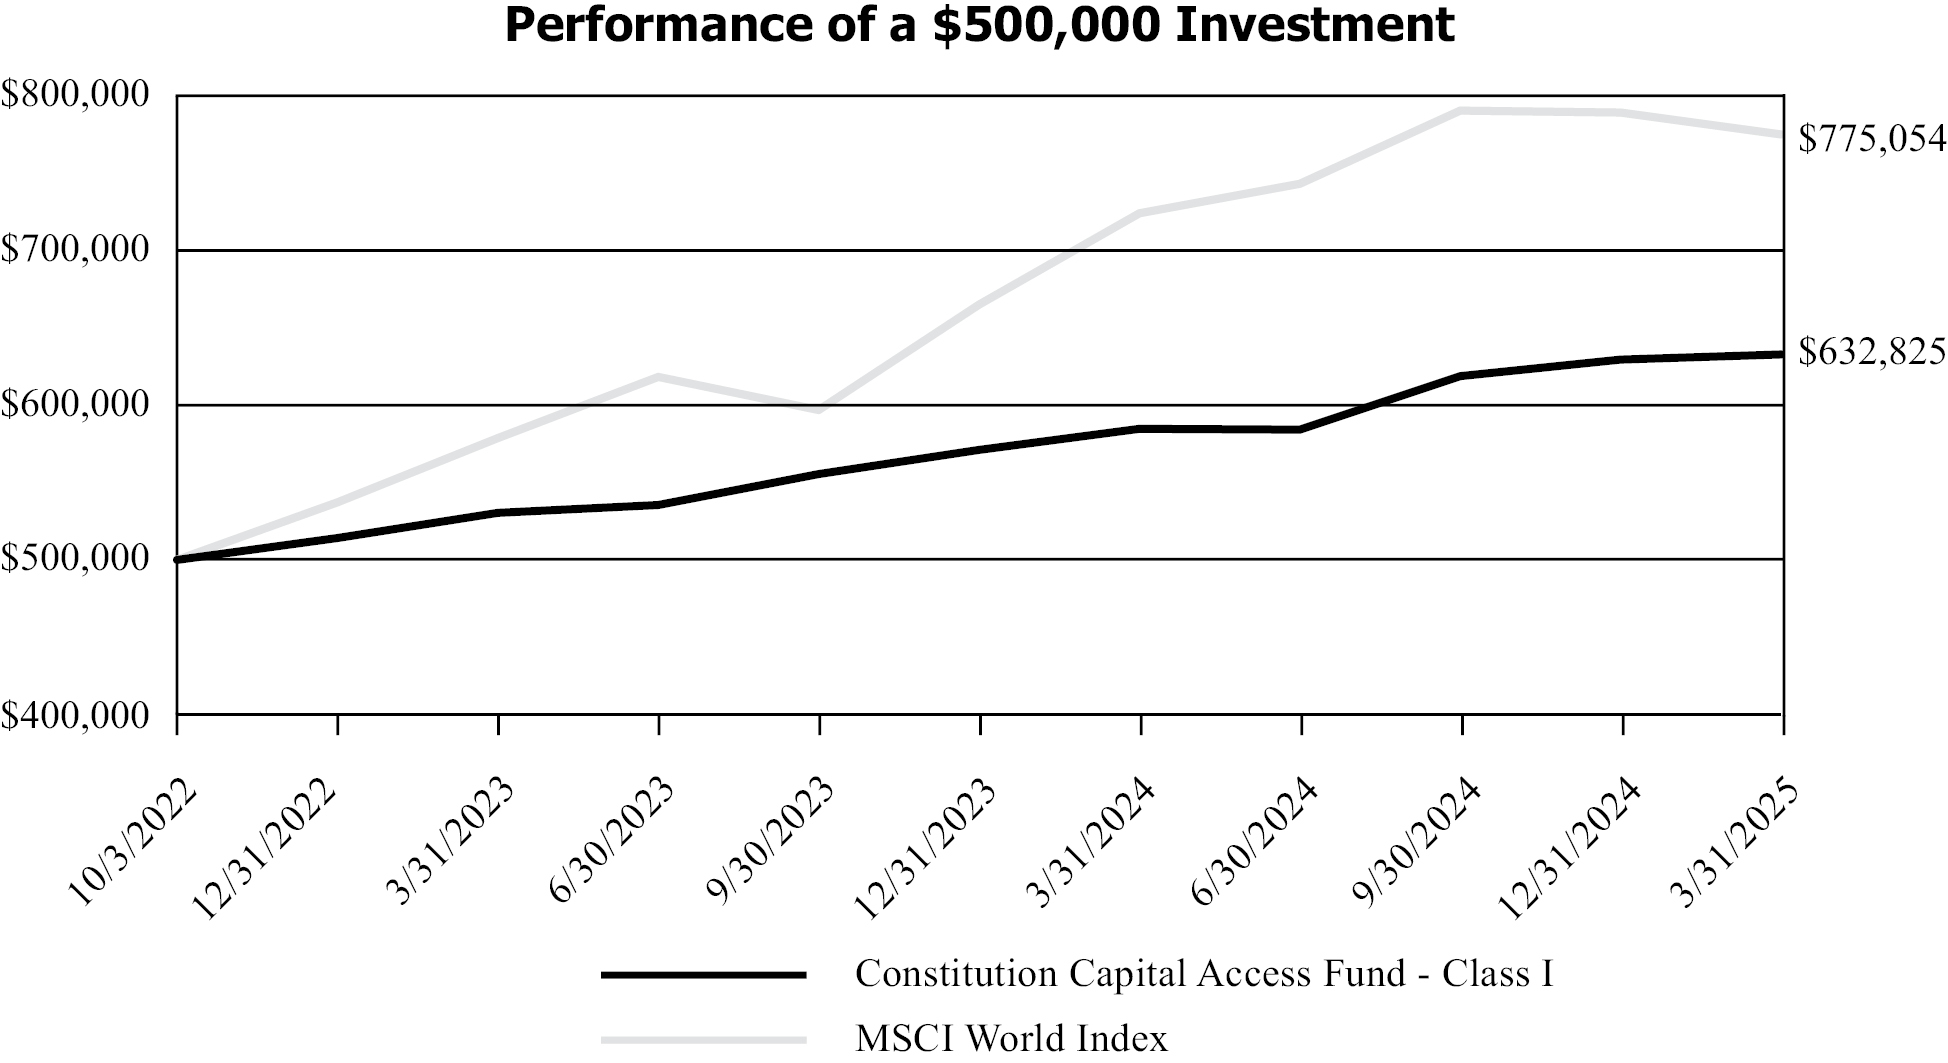
This graph compares a hypothetical $500,000 investment in the Fund’s Class I Shares with a similar investment in the MSCI World Index. This index does not serve as a benchmark for the Fund and is shown for illustrative purposes only. The Fund does not have a designated performance benchmark. Results include the reinvestment of all dividends and capital gains. The index does not reflect expenses, fees, or sales charges, which would lower performance.
The MSCI World Index captures large and mid-cap representation across 23 Developed Markets (DM) countries. With 1,507 constituents, the index covers approximately 85% of the free float-adjusted market capitalization in each country. The index is unmanaged and it is not available for investment.
|
Total Returns as of March 31, 2025 |
1 Year |
Since Inception |
||
|
Class A Shares (Inception Date 11/01/2022) |
8.22% |
9.86% |
||
|
Class D Shares (Inception Date 11/01/2022) |
7.96% |
9.96% |
||
|
Class I Shares (Inception Date 10/01/2022) |
8.22% |
9.92% |
||
|
MSCI World Index (Inception Date 10/01/2022) |
7.04% |
18.36% |
The performance data quoted here represents past performance and past performance is not a guarantee of future results. Performance reflects waivers and reimbursements in effect, without which performance would have been lower. Investment return and principal value will fluctuate so that an investor’s shares, when redeemed, may be worth more or less than their original cost. Current performance may be lower or higher than the performance information quoted. The most recent quarter end performance may be obtained by calling 1-855-551-2276.
4
|
Constitution Capital Access Fund, LLC |
|
Manager’s Discussion and Analysis of Fund Performance (Continued) March 31, 2025 (Unaudited) |
Constitution Capital PM, LP (the “Adviser”) has entered into an expense limitation agreement and reimbursement agreement (the “Expense Limitation Agreement”) with the Fund, whereby, for at least one-year from commencement of operations, the Adviser has agreed to waive fees that it would otherwise be paid, and/or to assume expenses of the Fund (a “Waiver”), if required to ensure the Total Annual Expenses (excluding taxes, interest, brokerage commissions, certain transaction related expenses arising out of investments made by the Fund, extraordinary expenses, the Incentive Fee, and any acquired fund fees and expenses (as determined in accordance with SEC Form N-2), expenses incurred in connection with any merger or reorganization, and extraordinary expenses, such as litigation expenses) do not exceed 2.95%, 2.25% and 2.50% of the average daily net assets of Class A Shares, Class I Shares and Class D Shares, respectively (the “Expense Limit”). Because taxes, leverage interest, brokerage commissions, dividend, and interest expenses on short sales, acquired fund fees and expenses, expenses incurred in connection with any merger or reorganization, and extraordinary expenses are excluded from the Expense Limit, Total Annual Expenses (after fee waivers and expense reimbursements) are expected to exceed 2.95%, 2.25% and 2.50% for the Class A Shares, Class I Shares and Class D Shares, respectively. The Expense Limitation Agreement automatically renews for consecutive one-year terms unless terminated by the Fund or Adviser. Gross expenses were 3.97%, 3.27%, and 3.52%, and net expenses were 2.72%, 2.02%, and 2.27% for the Class A Shares, Class I Shares and Class D Shares, respectively, which were stated in the current prospectus dated July 1, 2024. For the Fund’s current expense ratios, please refer to the Consolidated Financial Highlights section of this report.
Returns reflect the reinvestment of distributions made by the Fund, if any. The graph and the performance table above do not reflect the deduction of taxes that a shareholder would pay on Fund distributions or the redemption of Fund shares.
5
Report of Independent Registered Public Accounting Firm
To the Board of Managers and Shareholders of Constitution Capital Access Fund, LLC
Opinion on the Financial Statements
We have audited the accompanying consolidated statement of assets and liabilities, including the consolidated schedule of investments, of Constitution Capital Access Fund, LLC and its subsidiaries (the “Fund”) as of March 31, 2025, the related consolidated statements of operations and cash flows for the year ended March 31, 2025, the consolidated statement of changes in net assets for each of the two years in the period ended March 31, 2025, including the related notes, and the consolidated financial highlights for each of the periods indicated therein (collectively referred to as the “consolidated financial statements”). In our opinion, the consolidated financial statements present fairly, in all material respects, the financial position of the Fund as of March 31, 2025, the results of its operations and its cash flows for the year then ended, the changes in its net assets for each of the two years in the period ended March 31, 2025 and the financial highlights for each of the periods indicated therein in conformity with accounting principles generally accepted in the United States of America.
Basis for Opinion
These consolidated financial statements are the responsibility of the Fund’s management. Our responsibility is to express an opinion on the Fund’s consolidated financial statements based on our audits. We are a public accounting firm registered with the Public Company Accounting Oversight Board (United States) (PCAOB) and are required to be independent with respect to the Fund in accordance with the U.S. federal securities laws and the applicable rules and regulations of the Securities and Exchange Commission and the PCAOB.
We conducted our audits of these consolidated financial statements in accordance with the standards of the PCAOB. Those standards require that we plan and perform the audit to obtain reasonable assurance about whether the consolidated financial statements are free of material misstatement, whether due to error or fraud.
Our audits included performing procedures to assess the risks of material misstatement of the consolidated financial statements, whether due to error or fraud, and performing procedures that respond to those risks. Such procedures included examining, on a test basis, evidence regarding the amounts and disclosures in the consolidated financial statements. Our audits also included evaluating the accounting principles used and significant estimates made by management, as well as evaluating the overall presentation of the consolidated financial statements. Our procedures included confirmation of securities owned as of March 31, 2025 by correspondence with the custodian, agent banks, broker, and underlying investment fund managers; when replies were not received from the underlying investment fund managers, we performed other auditing procedures. We believe that our audits provide a reasonable basis for our opinion.
/s/ PricewaterhouseCoopers LLP
Boston, Massachusetts
May 29, 2025
We have served as the Fund’s auditor since 2022.
6
|
|
|
|
Acquisition |
|
|
|
||||||||
|
Direct Investments — 59.2%¹,² |
|
|
||||||||||||
|
Direct Credit — 0.3% |
|
|
||||||||||||
|
North America — 0.3% |
|
|
||||||||||||
|
COP Exterminators |
Consumer Staples |
Subordinated debt |
7/31/2023 |
$ |
461,915 |
$ |
461,915 |
|||||||
|
Gula Buyer, Inc.9,10 |
Consumer Discretionary |
Subordinated debt |
10/25/2024 |
|
247,068 |
|
247,068 |
|||||||
|
PracticeTek Midco, LLC9 |
Financial Technology |
Subordinated debt |
8/30/2023 |
|
1,225,089 |
|
1,225,089 |
|||||||
|
Total Direct Credit |
|
1,934,072 |
|
1,934,072 |
||||||||||
|
|
|
|||||||||||||
|
Direct Equity — 58.9% |
|
|
||||||||||||
|
Asia — Pacific — 3.1% |
|
|
||||||||||||
|
SLP Rainbow Co-Invest, L.P.* |
Consumer Staples |
Limited partnership interest |
10/1/2022 |
|
11,131,556 |
|
12,169,261 |
|||||||
|
SLP Redwood Co-Invest, L.P.* |
Communication Services |
Limited partnership interest |
10/1/2022 |
|
8,594,339 |
|
10,004,779 |
|||||||
|
Total Asia — Pacific |
|
19,725,895 |
|
22,174,040 |
||||||||||
|
|
|
|||||||||||||
|
Europe — 12.6% |
|
|
||||||||||||
|
Bach Co-investment |
Consumer Discretionary |
Limited partnership interest |
10/1/2022 |
|
14,406,112 |
|
15,540,659 |
|||||||
|
BW CDMO Co-Invest, |
Health Care |
Limited partnership interest |
11/4/2024 |
|
5,047,538 |
|
5,000,000 |
|||||||
|
CVC Capital Partners Pachelbel (A) SCSp*3,8 |
Education Services |
Limited partnership interest |
7/8/2024 |
|
2,236,596 |
|
2,739,777 |
|||||||
|
EQT VIII Co-Investment (D) SCSp*8 |
Health Care |
Limited partnership interest |
10/1/2022 |
|
14,358,593 |
|
17,740,385 |
|||||||
|
Kirk Beauty Co-Investment Limited Partnership*8 |
Consumer Discretionary |
Limited partnership interest |
10/1/2022 |
|
5,456,837 |
|
2,373,404 |
|||||||
|
LEP CP Co-Invest |
Industrials |
Limited partnership interest |
3/27/2025 |
|
6,628,859 |
|
6,588,008 |
|||||||
|
Mayfair Olympic Holdco Limited*8,9 |
Utilities |
Ordinary Shares |
10/1/2022 |
1,243,556 |
|
7,914,290 |
|
7,408,834 |
||||||
|
Neptune Co-Investment, L.P.*3 |
Energy |
Limited partnership interest |
10/1/2022 |
|
9,815,968 |
|
895,921 |
|||||||
|
SLP Jewel Co-Invest, |
Consumer Discretionary |
Limited partnership interest |
10/1/2022 |
|
5,879,120 |
|
7,161,248 |
|||||||
|
SLP Mistral Co-Invest, |
Financials |
Limited partnership interest |
10/1/2022 |
|
14,176,765 |
|
18,220,927 |
|||||||
|
SLP Zephyr Investors, |
Communication Services |
Limited partnership interest |
10/1/2022 |
|
7,831,030 |
|
5,885,197 |
|||||||
|
Total Europe |
|
93,751,708 |
|
89,554,360 |
||||||||||
See accompanying notes to the Consolidated Financial Statements.
7
|
Constitution Capital Access Fund, LLC |
|
Consolidated Schedule of Investments (Continued) March 31, 2025 |
|
|
|
|
Acquisition |
|
|
|
||||||||
|
Direct Investments (Continued) |
|
|
||||||||||||
|
Direct Equity (Continued) |
|
|
||||||||||||
|
North America — 43.2% |
|
|
||||||||||||
|
ACP Canopy Co-Invest |
Health Care |
Limited liability company interest |
11/1/2022 |
20,082 |
$ |
20,081,967 |
$ |
24,724,687 |
||||||
|
ACP Ukulele Co-Invest LP* |
Health Care |
Common Units |
3/4/2024 |
25,671 |
|
5,085,250 |
|
6,806,671 |
||||||
|
Ares EPIC Co-Invest Delaware Feeder, L.P.*3 |
Energy |
Limited partnership interest |
10/1/2022 |
|
5,922,469 |
|
3,875,103 |
|||||||
|
Ares EPIC Co-Invest II L.P.*3 |
Energy |
Limited partnership interest |
10/1/2022 |
|
9,589,902 |
|
13,917,253 |
|||||||
|
Carlyle Sabre Coinvestment, L.P.* |
Industrials |
Limited partnership interest |
10/1/2022 |
|
8,186,022 |
|
19,485,685 |
|||||||
|
CC AEC Co-Invest L.P.*9 |
Health Care |
Limited partnership interest |
10/1/2022 |
5,324 |
|
5,330,779 |
|
3,445,312 |
||||||
|
Centeotl Co-Invest B, |
Consumer Staples |
Limited partnership interest |
5/15/2023 |
|
5,160,290 |
|
5,574,681 |
|||||||
|
COP Exterminators Investment, LLC *9 |
Consumer Staples |
Limited liability company interest |
7/28/2023 |
8,035,714 |
|
9,000,000 |
|
11,070,320 |
||||||
|
Ergotron Investments, LLC*9 |
Industrials |
Common Units |
10/1/2022 |
50,000 |
|
5,000,000 |
|
7,863,767 |
||||||
|
Gula Co-Invest II, L.P.*3 |
Consumer Discretionary |
Common Units |
10/23/2024 |
5,000 |
|
5,025,000 |
|
4,866,890 |
||||||
|
Hermod Co-Invest, LP*3 |
Consumer Discretionary |
Common Units |
10/15/2024 |
5,000,000 |
|
5,154,248 |
|
6,524,368 |
||||||
|
Hildred Capital Co-Invest-REBA, LP*3 |
Health Care |
Limited partnership interest |
1/15/2025 |
|
9,019,422 |
|
11,016,299 |
|||||||
|
Ishtar Co-Invest-B LP3 |
Consumer Staples |
Limited partnership interest |
11/4/2022 |
|
5,851,409 |
|
46,323,439 |
|||||||
|
LB Vacation Blocker LLC*9 |
Real Estate |
Limited liability company interest |
4/10/2023 |
2,902,688 |
|
5,237,381 |
|
10,452,664 |
||||||
|
LC Ahab Aggregator, LP* |
Consumer Discretionary |
Limited partnership interest |
7/31/2024 |
5,000 |
|
3,104,978 |
|
6,144,469 |
||||||
|
LCG5 Candlelight, L.P.* |
Communication Services |
Limited partnership interest |
2/24/2025 |
1,000,000 |
|
10,322,863 |
|
14,871,103 |
||||||
|
LGP Sage PC Coinvest |
Industrials |
Limited partnership interest |
3/31/2025 |
|
— |
|
2,100,000 |
|||||||
|
MyTown Health Partners Parent, LP*3,9 |
Health Care |
Limited partnership interest |
7/17/2024 |
4,125,000 |
|
4,125,000 |
|
4,675,635 |
||||||
|
NBPT Aggregator, LLC*3,9 |
Health Care |
Preferred Units |
2/28/2025 |
8,000 |
|
8,000,000 |
|
8,000,000 |
||||||
|
Oshun Co-Invest-B LP*3 |
Consumer Staples |
Limited partnership interest |
11/4/2022 |
|
3,208,978 |
|
7,878,879 |
|||||||
|
PT Co-Invest II, L.P.*3 |
Financial Technology |
Limited partnership interest |
8/28/2023 |
|
10,072,394 |
|
13,087,513 |
|||||||
|
RCP Monte Nido Co-Investment Fund, L.P.* |
Health Care |
Limited partnership interest |
4/10/2023 |
|
6,252,098 |
|
5,080,488 |
|||||||
|
RCP MQ Co-Investment Fund, L.P.* |
Health Care |
Limited partnership interest |
12/2/2024 |
|
5,134,616 |
|
6,555,691 |
|||||||
|
SLP Blue Co-Invest, L.P.* |
Information Technology |
Limited partnership interest |
10/1/2022 |
|
8,729,538 |
|
9,480,924 |
|||||||
|
SLP West Holdings Co-Invest II, L.P.5,9 |
Communication Services |
Limited partnership interest |
10/1/2022 |
|
— |
|
440,279 |
|||||||
|
Thorium AppDirect Co-Invest, LLC* |
Information Technology |
Limited liability company interest |
9/30/2024 |
10,000,000 |
|
10,563,082 |
|
20,796,387 |
||||||
|
TPG VII Renown Co-Invest II, L.P.* |
Consumer Discretionary |
Limited partnership interest |
10/1/2022 |
|
5,098,713 |
|
48,597 |
|||||||
See accompanying notes to the Consolidated Financial Statements.
8
|
Constitution Capital Access Fund, LLC |
|
Consolidated Schedule of Investments (Continued) March 31, 2025 |
|
|
|
|
Acquisition |
|
|
|
||||||||
|
Direct Investments (Continued) |
|
|
||||||||||||
|
Direct Equity (Continued) |
|
|
||||||||||||
|
North America (Continued) |
|
|
||||||||||||
|
VCP Roland Co-Invest Aggregator, L.P.* |
Consumer Staples |
Limited partnership interest |
10/21/2024 |
5,000 |
$ |
5,094,389 |
$ |
4,998,615 |
||||||
|
VCP Tech24 Co-Invest Aggregator, L.P.* |
Business Services |
Limited partnership interest |
5/15/2024 |
5,000 |
|
5,285,149 |
|
5,060,527 |
||||||
|
WE Select Fund 1, L.P.*3,9 |
Health Care |
Limited partnership interest |
2/5/2025 |
|
3,828,013 |
|
4,506,272 |
|||||||
|
WPP Fairway Aggregator B, L.P.*9 |
Consumer Staples |
Class A Preferred Units |
10/1/2022 |
13,053 |
|
13,053,292 |
|
16,602,663 |
||||||
|
WPP Fairway Aggregator B, L.P.*9 |
Consumer Staples |
Class B Common Units |
10/1/2022 |
13,053 |
|
87,364 |
|
641,122 |
||||||
|
Total North America |
|
205,604,606 |
|
306,916,303 |
||||||||||
|
Total Direct Equity |
|
319,082,209 |
|
418,644,703 |
||||||||||
|
Total Direct Investments — 59.2% |
|
321,016,281 |
|
420,578,775 |
||||||||||
|
|
|
|||||||||||||
|
Investment Funds — 48.5%¹,² |
|
|
||||||||||||
|
Asia — Pacific — 3.7% |
|
|
||||||||||||
|
BPEA Private Equity Fund VI, L.P.2*3 |
Limited partnership interest |
10/1/2022 |
|
11,532,628 |
|
4,986,392 |
||||||||
|
BPEA Private Equity Fund VII, SCSp3 |
Limited partnership interest |
10/1/2022 |
|
20,753,636 |
|
21,545,200 |
||||||||
|
Total Asia — Pacific |
|
32,286,264 |
|
26,531,592 |
||||||||||
|
|
|
|||||||||||||
|
Europe — 12.8% |
|
|
||||||||||||
|
CVC Capital Partners VI (D) S.L.P.3,8 |
Limited partnership interest |
10/1/2022 |
|
14,015,242 |
|
9,659,669 |
||||||||
|
CVC Capital Partners VII (A) L.P.3,8 |
Limited partnership interest |
10/1/2022 |
|
19,792,873 |
|
20,709,680 |
||||||||
|
EQT IX (No.1) EUR SCSp*3,8 |
Limited partnership interest |
10/1/2022 |
|
12,728,741 |
|
14,851,206 |
||||||||
|
EQT VII (No.1) Limited Partnership*3,8 |
Limited partnership interest |
10/1/2022 |
|
8,088,520 |
|
7,574,089 |
||||||||
|
EQT VIII (No.1) SCSp*3,8 |
Limited partnership interest |
10/1/2022 |
|
21,018,256 |
|
18,963,494 |
||||||||
|
Sixth Cinven Fund (No. 2) Limited Partnership3,8 |
Limited partnership interest |
10/1/2022 |
|
21,833,482 |
|
18,785,173 |
||||||||
|
Total Europe |
|
97,477,114 |
|
90,543,311 |
||||||||||
|
|
|
|||||||||||||
|
North America — 32.0% |
|
|
||||||||||||
|
Ares Corporate Opportunities Fund V, L.P.*3 |
Limited partnership interest |
10/1/2022 |
|
15,616,893 |
|
13,621,085 |
||||||||
|
Ares Corporate Opportunities Fund VI |
Limited partnership interest |
10/1/2022 |
|
19,048,620 |
|
25,650,539 |
||||||||
|
Ares Energy Opportunities Fund B, L.P.3 |
Limited partnership interest |
10/1/2022 |
|
11,083,847 |
|
7,315,836 |
||||||||
|
Avista Healthcare Partners (Offshore) II, L.P.*3 |
Limited partnership interest |
3/31/2025 |
|
11,276,736 |
|
12,273,188 |
||||||||
|
Bansk Fund I-B, L.P.3 |
Limited partnership interest |
9/13/2023 |
|
5,297,247 |
|
7,788,664 |
||||||||
|
Carlyle International Energy Partners II S.C.Sp.3 |
Limited partnership interest |
10/1/2022 |
|
13,056,431 |
|
10,140,228 |
||||||||
|
Carlyle Partners VI, L.P.3,4 |
Limited partnership interest |
10/1/2022 |
|
4,376,854 |
|
2,352,679 |
||||||||
|
Carlyle Partners VII, L.P.3 |
Limited partnership interest |
10/1/2022 |
|
9,552,644 |
|
10,324,414 |
||||||||
See accompanying notes to the Consolidated Financial Statements.
9
|
Constitution Capital Access Fund, LLC |
|
Consolidated Schedule of Investments (Continued) March 31, 2025 |
|
|
|
|
Acquisition |
|
|
|
|||||||||
|
Investment Funds (Continued) |
|
|
|
||||||||||||
|
North America (Continued) |
|
|
|
||||||||||||
|
Catterton Partners VII, L.P.*3 |
Limited partnership interest |
10/1/2022 |
$ |
16,499,676 |
$ |
9,766,688 |
|
||||||||
|
Gridiron Capital (Parallel) Fund V, L.P.*3 |
Limited partnership interest |
11/27/2023 |
|
3,006,491 |
|
3,313,975 |
|
||||||||
|
Insignia Capital Partners, L.P.3,4 |
Limited partnership interest |
10/1/2022 |
|
28,663,240 |
|
9,461,474 |
|
||||||||
|
Kinderhook Capital Fund IV, L.P.* |
Limited partnership interest |
10/1/2022 |
|
1,731,471 |
|
27,236 |
|
||||||||
|
Lightyear Fund III, L.P.3,4* |
Limited partnership interest |
10/1/2022 |
|
2,052,337 |
|
1,913,511 |
|
||||||||
|
Nautic Partners VI, L.P. |
Limited partnership interest |
10/1/2022 |
|
5,257,615 |
|
32,834 |
|
||||||||
|
Revelstoke Capital Partners Fund III, L.P.3 |
Limited partnership interest |
8/22/2023 |
|
4,043,709 |
|
4,150,443 |
|
||||||||
|
Riverstone Global Energy and Power Fund VI, L.P.3 |
Limited partnership interest |
10/1/2022 |
|
5,289,392 |
|
3,363,694 |
|
||||||||
|
Riverstone Non-ECI Partners, L.P.3 |
Limited partnership interest |
10/1/2022 |
|
12,543,035 |
|
7,549,598 |
|
||||||||
|
Silver Lake Partners IV, L.P.3,4 |
Limited partnership interest |
10/1/2022 |
|
13,600,120 |
|
12,326,372 |
|
||||||||
|
Silver Lake Partners V, L.P.3,4 |
Limited partnership interest |
10/1/2022 |
|
18,572,492 |
|
17,664,365 |
|
||||||||
|
SK Capital Partners III, L.P.*3 |
Limited partnership interest |
10/1/2022 |
|
21,194,151 |
|
9,322,521 |
|
||||||||
|
SL SPV-2, L.P. |
Limited partnership interest |
10/1/2022 |
|
5,333,495 |
|
4,817,761 |
|
||||||||
|
SunTx Capital Partners II, L.P.* |
Limited partnership interest |
10/1/2022 |
|
6,048,777 |
|
15,862,305 |
|
||||||||
|
TPG HealthCare Partners, L.P.3 |
Limited partnership interest |
10/1/2022 |
|
5,564,152 |
|
6,162,502 |
|
||||||||
|
TPG Partners VI, L.P.3 |
Limited partnership interest |
10/1/2022 |
|
2,945,004 |
|
1,358,871 |
|
||||||||
|
TPG Partners VIII, L.P.3 |
Limited partnership interest |
10/1/2022 |
|
18,757,087 |
|
19,730,363 |
|
||||||||
|
WestView Capital Partners III, L.P.*3 |
Limited partnership interest |
10/1/2022 |
|
9,555,838 |
|
6,736,725 |
|
||||||||
|
Wind Point Partners VII-B, L.P.*3 |
Limited partnership interest |
10/1/2022 |
|
1,762,976 |
|
438,435 |
|
||||||||
|
Wind Point Partners X-B, L.P.*3 |
Limited partnership interest |
4/5/2024 |
|
2,564,893 |
|
3,384,498 |
|
||||||||
|
Total North America |
|
274,295,223 |
|
226,850,804 |
|
||||||||||
|
Total Investment Funds — 48.5% |
|
404,058,601 |
|
343,925,707 |
|
||||||||||
|
|
|
|
|||||||||||||
|
Short-Term Investments — 5.0% |
|
|
|
||||||||||||
|
North America — 5.0% |
|
|
|
||||||||||||
|
Fidelity Institutional Government Portfolio — Class I, 4.23%6 |
35,600,514 |
|
35,600,514 |
|
35,600,514 |
|
|||||||||
|
Total Short-Term Investments — 5.0% |
|
35,600,514 |
|
35,600,514 |
|
||||||||||
|
|
|
|
|||||||||||||
|
Total Investments — 112.7% |
|
760,675,396 |
|
800,104,996 |
|
||||||||||
|
Net Other Assets (Liabilites) — (12.7%) |
|
(89,928,756 |
) |
||||||||||||
|
Total Net Assets — 100.0% |
$ |
710,176,240 |
|
||||||||||||
See accompanying notes to the Consolidated Financial Statements.
10
|
Constitution Capital Access Fund, LLC |
|
Consolidated Schedule of Investments (Continued) March 31, 2025 |
Legend
SOFR — Secured Overnight Financing Rate
CME Term SOFR 1M — Chicago Mercantile Exchange forward looking measure of SOFR for one month: 4.32%, as of March 31, 2025. Actual reference rates may vary based on the reset date of the security.
* Investment is non-income producing.
1 Direct Investments and Investment Funds are generally issued in private placement transactions and as such are generally restricted as to resale. Each investment may have been acquired on various dates and for different amounts. The acquisition date is shown in the Consolidated Schedule of Investments. Total fair value of restricted investments as of March 31, 2025 was $764,504,482, or 107.7% of net assets. Total cost of restricted investments as of March 31, 2025 was $725,074,882.
2 Direct Investments and Investment Funds do not allow redemptions or withdrawals except at discretion of their general partner, manager, or adviser.
3 Investment has been committed to but has not been fully funded by the Fund. Refer to Note 3 to the Consolidated Financial Statements for total unfunded commitments by investment type.
4 All or a portion of this security is held through a consolidated Subsidiary, CC PMF Splitter Partnership.
5 All or a portion of this security is held through a consolidated Subsidiary, CC PMF Blocker, LLC.
6 The rate is the annualized seven-day yield as of March 31, 2025.
7 Investments are held through CC PMF Holdings, LLC, a consolidated Subsidiary, unless otherwise denoted.
8 Foreign security denominated in U.S. Dollars.
9 The fair value of the investment was determined using significant unobservable inputs.
10 Variable rate security. Rate shown is the rate in effect as of March 31, 2025.
See accompanying notes to the Consolidated Financial Statements.
11
|
Constitution Capital Access Fund, LLC |
|
Consolidated Schedule of Investments (Continued) March 31, 2025 |
|
Summary of Investments (as a percentage of total net assets) |
|||
|
Direct Investments |
59.2 |
% |
|
|
Investment Funds |
48.5 |
% |
|
|
Short-Term Investments |
5.0 |
% |
|
|
Total Investments |
112.7 |
% |
|
|
Net Other Assets (Liabilities) |
(12.7 |
)% |
|
|
Total Net Assets |
100.0 |
% |
|
A summary of outstanding financial instruments as of March 31, 2025 is as follows:
Forward Foreign Currency Exchange Contracts
|
Counterparty |
Settlement |
Currency |
Currency |
Unrealized |
|
Bannockburn Global Forex |
6/30/2025 |
£ 18,268,190 |
$14,601,703 |
$(593,833) |
|
Bannockburn Global Forex |
6/30/2025 |
₣ 9,494,516 |
$8,490,946 |
(206,870) |
|
Bannockburn Global Forex |
6/30/2025 |
€ 75,673,173 |
$72,874,781 |
(3,556,493) |
|
Total Forward Foreign Currency Exchange Contracts |
$(4,357,196) |
|||
Legend
£ British Pound
₣ Swiss Franc
€ Euro
See accompanying notes to the Consolidated Financial Statements.
12
|
Constitution Capital Access Fund, LLC |
|
Consolidated Statement of Assets and Liabilities March 31, 2025 |
| Assets |
| ||
| Investments, at fair value (cost $760,675,396) | $ | 800,104,996 | |
| Cash equivalents held in escrow for subscriptions received in advance |
| 8,722,905 | |
| Foreign currency, at fair value (cost $576,029) |
| 565,929 | |
| Distributions receivable from investments |
| 557,113 | |
| Deferred loan issuance costs |
| 335,030 | |
| Interest receivable |
| 12,054 | |
| Prepaid expenses and other assets |
| 230,607 | |
| Total Assets |
| 810,528,634 | |
|
| |||
| Liabilities |
| ||
| Line of credit payable |
| 58,551,018 | |
| Payable for shares repurchased |
| 20,007,269 | |
| Subscriptions received in advance |
| 8,715,636 | |
| Payable for investments not yet funded |
| 5,870,668 | |
| Unrealized depreciation on forward foreign currency exchange contracts |
| 4,357,196 | |
| Line of credit interest payable |
| 1,163,531 | |
| Current tax payable |
| 459,877 | |
| Audit and tax fees payable |
| 373,445 | |
| Accounting and administration fees payable |
| 166,944 | |
| Investment management fee payable |
| 163,972 | |
| Deferred tax liability |
| 161,219 | |
| Legal fees payable |
| 160,835 | |
| Administrative services payable |
| 115,610 | |
| Due to Adviser |
| 41,913 | |
| Transfer agent fees payable |
| 15,977 | |
| Custody fees payable |
| 15,656 | |
| Distribution and servicing fees payable (Class D) |
| 966 | |
| Other accrued expenses |
| 10,662 | |
| Total Liabilities |
| 100,352,394 | |
|
| |||
| Commitments and contingencies (see Note 3) |
| ||
|
| |||
| Net Assets | $ | 710,176,240 | |
|
| |||
| Composition of Net Assets: |
| ||
| Paid-in capital | $ | 516,760,120 | |
| Total distributable earnings |
| 193,416,120 | |
| Net Assets | $ | 710,176,240 | |
|
| |||
| Net Assets Attributable to: |
| ||
| Class A Shares | $ | 13 | |
| Class D Shares |
| 137,919 | |
| Class I Shares |
| 710,038,308 | |
| $ | 710,176,240 | ||
| Shares of Beneficial Interests (unlimited number of shares authorized) |
| ||
| Class A Shares |
| | |
| Class D Shares |
| | |
| Class I Shares |
| | |
|
| | ||
| Net Asset Value per Share: |
| ||
| Class A Shares1 | $ | | |
| Class D Shares | $ | | |
| Class I Shares | $ | |
1
See accompanying notes to the consolidated financial statements.
13
|
Constitution Capital Access Fund, LLC |
|
Consolidated Statement of Operations For the Year Ended March 31, 2025 |
|
Investment Income |
|
|
||
|
Dividend income (net of withholding tax of $294,525) |
$ |
3,121,290 |
|
|
|
Interest income |
|
278,641 |
|
|
|
Interest income paid in-kind |
|
200,481 |
|
|
|
Total Investment Income |
|
3,600,412 |
|
|
|
|
|
|||
|
Expenses |
|
|
||
|
Investment management fees |
|
11,265,980 |
|
|
|
Incentive fees |
|
5,132,482 |
|
|
|
Line of credit fees and expenses1 |
|
4,413,603 |
|
|
|
Accounting and administration fees |
|
951,354 |
|
|
|
Legal fees |
|
796,992 |
|
|
|
Tax expense |
|
459,878 |
|
|
|
Audit and tax fees |
|
338,695 |
|
|
|
Board fees and expenses |
|
315,051 |
|
|
|
Administrative service fee |
|
231,220 |
|
|
|
Custodian fees |
|
106,072 |
|
|
|
Chief compliance officer fees |
|
79,472 |
|
|
|
Transfer agency fees |
|
80,689 |
|
|
|
Distribution and servicing fees (Class D) |
|
886 |
|
|
|
Other operating expenses |
|
655,569 |
|
|
|
Total expenses before waivers |
|
24,827,943 |
|
|
|
Waiver of Investment Management fees (Note 5) |
|
(8,786,664 |
) |
|
|
Waiver of Incentive fees (Note 5) |
|
(5,132,482 |
) |
|
|
Net expenses |
|
10,908,797 |
|
|
|
Net Investment Loss |
|
(7,308,385 |
) |
|
|
|
|
|||
|
Net Realized Gain (Loss) and Change in Unrealized Appreciation/Depreciation |
|
|
||
|
Net realized gain on distributions from investments (net of withholding tax of $21,939) |
|
55,126,594 |
|
|
|
Net realized loss on investments |
|
(241,546 |
) |
|
|
Net realized loss on foreign currency transactions |
|
(36,278 |
) |
|
|
Net realized loss on forward foreign currency exchange contracts |
|
(24,667 |
) |
|
|
Net change in unrealized appreciation/depreciation on investments |
|
11,404,497 |
|
|
|
Net change in unrealized appreciation/depreciation on foreign currency transactions |
|
4,315 |
|
|
|
Net change in unrealized appreciation/depreciation on forward foreign currency exchange contracts |
|
(4,357,196 |
) |
|
|
Net change in deferred tax liability |
|
267,510 |
|
|
|
Net Realized Gain (Loss) and Change in Unrealized Appreciation/Depreciation |
|
62,143,229 |
|
|
|
|
|
|||
|
Net Increase in Net Assets Resulting from Operations |
$ |
54,834,844 |
|
1 Includes amortization of loan issuance costs, commitment fees, and interest expense.
See accompanying notes to the consolidated financial statements.
14
|
For the |
For the |
|||||||
|
Changes in Net Assets Resulting from Operations |
|
|
|
|
||||
|
Net investment loss |
$ |
(7,308,385 |
) |
$ |
(5,905,084 |
) |
||
|
Net realized gain (loss) on investments, foreign currency transactions, and forward foreign currency exchange contracts |
|
54,824,103 |
|
|
51,210,066 |
|
||
|
Net change in unrealized appreciation/(depreciation) on investments, foreign currency transactions, and forward foreign currency exchange contracts, net of deferred taxes |
|
7,319,126 |
|
|
15,062,782 |
|
||
|
Net Change in Net Assets Resulting from Operations |
|
54,834,844 |
|
|
60,367,764 |
|
||
|
|
|
|
|
|||||
|
Distributions to Shareholders |
|
|
|
|
||||
|
Class A |
|
(1 |
) |
|
(1 |
) |
||
|
Class D |
|
(7,609 |
) |
|
(1,178 |
) |
||
|
Class I |
|
(39,358,555 |
) |
|
(27,717,599 |
) |
||
|
Net Change in Net Assets from Distributions to Shareholders |
|
(39,366,165 |
) |
|
(27,718,778 |
) |
||
|
|
|
|
|
|||||
|
Change in Net Assets Resulting from Capital Transactions (see Note 6) |
|
|
|
|
||||
|
Class A |
|
|
|
|
||||
|
Reinvested distributions |
|
1 |
|
|
1 |
|
||
|
Total Class A Transactions |
|
1 |
|
|
1 |
|
||
|
|
|
|
|
|||||
|
Class D |
|
|
|
|
||||
|
Proceeds from issuance of shares |
|
485,000 |
|
|
225,000 |
|
||
|
Reinvested distributions |
|
7,609 |
|
|
1,178 |
|
||
|
Exchange of shares |
|
(488,092 |
) |
|
(125,000 |
) |
||
|
Total Class D Transactions |
|
4,517 |
|
|
101,178 |
|
||
|
|
|
|
|
|||||
|
Class I |
|
|
|
|
||||
|
Proceeds from issuance of shares |
|
83,395,498 |
|
|
25,639,652 |
|
||
|
Reinvested distributions |
|
36,716,436 |
|
|
27,636,156 |
|
||
|
Exchange of shares |
|
488,092 |
|
|
125,000 |
|
||
|
Shares repurchased |
|
(71,073,583 |
) |
|
(36,713,664 |
) |
||
|
Total Class I Transactions |
|
49,526,443 |
|
|
16,687,144 |
|
||
|
|
|
|
|
|||||
|
Net Change in Net Assets Resulting from Capital Transactions |
|
49,530,961 |
|
|
16,788,323 |
|
||
|
|
|
|
|
|||||
|
Total Net Increase in Net Assets |
|
64,999,640 |
|
|
49,437,309 |
|
||
|
|
|
|
|
|||||
|
Net Assets |
|
|
|
|
||||
|
Beginning of period |
|
645,176,600 |
|
|
595,739,291 |
|
||
|
End of period |
$ |
710,176,240 |
|
$ |
645,176,600 |
|
||
See accompanying notes to the consolidated financial statements.
15
|
Constitution Capital Access Fund, LLC |
|
Consolidated Statement of Cash Flows For the Year Ended March 31, 2025 |
|
Cash Flows From Operating Activities |
|
|
||
|
Net increase in net assets from operations |
$ |
54,834,844 |
|
|
|
Adjustments to reconcile net increase in net assets resulting from operations to net cash used in operating activities: |
|
|
||
|
Purchases of investments, net of payable for investments not yet funded |
|
(112,050,488 |
) |
|
|
Interest income paid in kind added to principal amount of investments |
|
(200,481 |
) |
|
|
Return of capital distributions received from investments |
|
38,107,851 |
|
|
|
Sales of investments |
|
3,695,176 |
|
|
|
Change in short-term investments, net |
|
(21,780,239 |
) |
|
|
Net realized loss on investments |
|
241,546 |
|
|
|
Net change in unrealized appreciation/depreciation on investments |
|
(11,404,497 |
) |
|
|
Net change in unrealized appreciation/depreciation on forward foreign currency exchange contracts |
|
4,357,196 |
|
|
|
Net change in deferred tax liability |
|
(267,510 |
) |
|
|
(Increase)/Decrease in Assets: |
|
|
||
|
Deferred loan issuance costs amortization |
|
134,012 |
|
|
|
Prepaid expenses and other assets |
|
(26,744 |
) |
|
|
Interest receivable |
|
(4,581 |
) |
|
|
Distributions receivable from investments |
|
(557,113 |
) |
|
|
Increase/(Decrease) in Liabilities: |
|
|
||
|
Line of credit interest payable |
|
(81,196 |
) |
|
|
Investment management fee payable |
|
(271,192 |
) |
|
|
Legal fees payable |
|
28,601 |
|
|
|
Audit and tax fees payable |
|
(59,305 |
) |
|
|
Accounting and administration fees payable |
|
11,408 |
|
|
|
Due to Adviser |
|
14,272 |
|
|
|
Custody fees payable |
|
1,101 |
|
|
|
Current tax payable |
|
459,877 |
|
|
|
Transfer agent fees payable |
|
7,176 |
|
|
|
Distribution and servicing fees payable (Class D) |
|
884 |
|
|
|
Administrative services payable |
|
115,610 |
|
|
|
Other accrued expenses |
|
1,492 |
|
|
|
Net Cash Used in Operating Activities |
|
(44,692,300 |
) |
|
|
|
|
|||
|
Cash Flows from Financing Activities |
|
|
||
|
Proceeds from subscriptions of shares, net of change in payable for proceeds from subscriptions received in advance |
|
82,366,134 |
|
|
|
Proceeds from line of credit |
|
67,750,000 |
|
|
|
Payments made on line of credit |
|
(46,500,000 |
) |
|
|
Distributions to shareholders, net of reinvestments of distributions |
|
(2,642,119 |
) |
|
|
Payments for shares repurchased, net of increase in payable for shares repurchased |
|
(51,066,314 |
) |
|
|
Net Cash Provided by Financing Activities |
|
49,907,701 |
|
|
|
|
|
|||
|
Net change in Cash, foreign currency, and cash equivalents |
|
5,215,401 |
|
|
|
Cash, foreign currency, and cash equivalents – Beginning of Period |
|
4,073,433 |
|
|
|
Cash, foreign currency, and cash equivalents – End of Period |
$ |
9,288,834 |
|
|
|
|
|
|||
|
Supplemental disclosure of non-cash activities |
|
|
||
|
Reinvestment of distributions made to Shareholders |
$ |
36,724,045 |
|
|
|
Stock distributions received in-kind from investments |
|
3,936,723 |
|
|
|
Non-cash investment cost transfer |
|
1,064,063 |
|
|
|
Interest income paid in-kind |
|
200,481 |
|
|
|
Exchanges into Class I (41,671 shares) |
|
488,092 |
|
|
|
Exchanges out of Class D (41,748 shares) |
|
(488,092 |
) |
|
|
|
|
|||
|
Supplemental disclosure of cash flow information |
|
|
||
|
Interest payments on line of credit |
$ |
4,045,477 |
|
See accompanying notes to the consolidated financial statements.
16
Per share operating performance.
For a capital share outstanding throughout each period.
|
For the |
For the |
For the Period |
||||||||||
|
Per Share Operating Performance1: |
|
|
|
|
|
|
||||||
|
Net Asset Value per share, beginning of period/year |
$ |
11.16 |
|
$ |
10.61 |
|
$ |
10.09 |
|
|||
|
Activity from investment operations: |
|
|
|
|
|
|
||||||
|
Net investment income/(loss) |
|
(0.12 |
) |
|
(0.11 |
) |
|
0.01 |
|
|||
|
Net realized and unrealized gain/(loss) on investments |
|
1.03 |
|
|
1.18 |
|
|
0.51 |
|
|||
|
Total from investment operations |
|
0.91 |
|
|
1.07 |
|
|
0.52 |
|
|||
|
|
|
|
|
|
|
|||||||
|
Distributions to shareholders |
|
|
|
|
|
|
||||||
|
Net investment income |
|
— |
|
|
(0.10 |
) |
|
— |
|
|||
|
Net realized gains |
|
(0.66 |
) |
|
(0.42 |
) |
|
— |
|
|||
|
Total distributions to shareholders |
|
(0.66 |
) |
|
(0.52 |
) |
|
— |
|
|||
|
|
|
|
|
|
|
|||||||
|
Net Asset Value per share, end of period/year |
$ |
11.418 |
|
$ |
11.168 |
|
$ |
10.618 |
|
|||
|
|
|
|
|
|
|
|||||||
|
Net Assets, end of period/year |
$ |
13 |
|
$ |
12 |
|
$ |
11 |
|
|||
|
|
|
|
|
|
|
|||||||
|
Ratios to average net assets2: |
|
|
|
|
|
|
||||||
|
Net investment income/(loss)3 |
|
(1.07 |
)% |
|
(2.79 |
)% |
|
(1.38 |
)% |
|||
|
|
|
|
|
|
|
|||||||
|
Gross expenses before waivers4 |
|
3.64 |
% |
|
3.90 |
% |
|
3.23 |
% |
|||
|
Waivers of Investment management fees and Incentive fees5 |
|
(2.04 |
)% |
|
(1.82 |
)% |
|
(1.71 |
)% |
|||
|
Net expenses5,6 |
|
1.60 |
% |
|
2.08 |
% |
|
1.52 |
% |
|||
|
|
|
|
|
|
|
|||||||
|
Total Return7 |
|
8.22 |
%8 |
|
10.22 |
%8 |
|
5.19 |
%8 |
|||
|
|
|
|
|
|
|
|||||||
|
Portfolio turnover rate |
|
1 |
% |
|
2 |
% |
|
0 |
%10 |
|||
|
|
|
|
|
|
|
|||||||
|
Senior Securities |
|
|
|
|
|
|
||||||
|
Total borrowings (000s) |
$ |
58,551 |
|
$ |
37,301 |
|
$ |
37,200 |
|
|||
|
Asset coverage per $1,000 unit of senior indebtedness9 |
$ |
13,129 |
|
$ |
18,296 |
|
$ |
17,014 |
|
|||
* Commencement of offering of Class A shares.
1 Per share data is computed using the average shares method.
2 Net investment loss and net expenses have been annualized for any periods less than one year, except for any non-recurring expenses which are not annualized. Expenses do not include expenses from Private Assets in which the Fund invests.
3 Recognition of net investment income by the Fund is affected by the timing of the declaration of distributions by the Private Assets in which the Fund invests. Ratios do not include net investment income/(loss) of the Private Assets in which the Fund invests.
4 If Incentive Fees had been excluded, the expense ratios would have decreased by 0.75%, 0.98% and 0.51% for years ended March 31, 2025 and 2024, and the period from November 1, 2022 through March 31, 2023, respectively.
5 Includes an annualized voluntary waiver of Investment Management fees by the Adviser of 0.13%, 0.84% and 1.20% for the years ended March 31, 2025 and 2024, and the period from November 1, 2022 through March 31, 2023, respectively.
6 If interest expenses had been excluded, the expense ratios would have decreased by 0.60%, 0.72% and 0.62% for the years ended March 31, 2025 and 2024, and the period from November 1, 2022 through March 31, 2023, respectively.
7 Total return based on per unit net asset value reflects the change in net asset value based on the effects of the performance of the Fund during the period and assumes distributions, if any, were reinvested. Total returns shown are not annualized for periods less than a year and exclude the effect of applicable sales charges.
8 Includes adjustments in accordance with US GAAP and accordingly, the returns and per unit net asset value for financial reporting may differ from the returns and per unit net asset value used for shareholder transactions.
9 Calculated by subtracting the Fund's total liabilities (not including borrowings) from the Fund's total assets and dividing this by the total number of senior indebtedness units, where one unit equals $1,000 of senior indebtedness.
10 Not annualized.
See accompanying notes to the Consolidated Financial Statements.
17
|
Constitution Capital Access Fund, LLC |
|
Consolidated Financial Highlights Class D Shares |
Per share operating performance.
For a capital share outstanding throughout each period.
| For the | For the | For the Period | ||||||||||
| Per Share Operating Performance1: |
|
|
|
|
|
| ||||||
| Net Asset Value per share, beginning of period/year | $ | 11.15 |
| $ | 10.61 |
| $ | 10.09 |
| |||
Activity from investment operations: |
|
|
|
|
|
| ||||||
Net investment income/(loss) |
| (0.15 | ) |
| (0.14 | ) |
| 0.01 |
| |||
Net realized and unrealized gain/(loss) on investments |
| 1.03 |
|
| 1.19 |
|
| 0.51 |
| |||
Total from investment operations |
| 0.88 |
|
| 1.05 |
|
| 0.52 |
| |||
|
|
|
|
|
| |||||||
Distributions to shareholders |
|
|
|
|
|
| ||||||
Net investment income |
| — |
|
| (0.09 | ) |
| — |
| |||
Net realized gains |
| (0.66 | ) |
| (0.42 | ) |
| — |
| |||
Total distributions to shareholders |
| (0.66 | ) |
| (0.51 | ) |
| — |
| |||
|
|
|
|
|
| |||||||
Net Asset Value per share, end of period/year | $ | 11.378 |
| $ | 11.158 |
| $ | 10.618 |
| |||
|
|
|
|
|
| |||||||
Net Assets, end of period/year | $ | 137,919 |
| $ | 103,890 |
| $ | 11 |
| |||
|
|
|
|
|
| |||||||
Ratios to average net assets2: |
|
|
|
|
|
| ||||||
Net investment income/(loss)3 |
| (1.33 | )% |
| (3.06 | )% |
| (1.38 | )% | |||
|
|
|
|
|
| |||||||
Gross expenses before waivers4 |
| 3.90 | % |
| 4.17 | % |
| 3.23 | % | |||
Waivers of Investment management fees and Incentive fees5 |
| (2.04 | )% |
| (1.82 | )% |
| (1.71 | )% | |||
Net expenses5,6 |
| 1.86 | % |
| 2.35 | % |
| 1.52 | % | |||
|
|
|
|
|
| |||||||
Total Return7 |
| 7.96 | %8 |
| 10.01 | %8 |
| 5.19 | %8 | |||
|
|
|
|
|
| |||||||
Portfolio turnover rate |
| 1 | % |
| 2 | % |
| 0 | %10 | |||
|
|
|
|
|
| |||||||
Senior Securities |
|
|
|
|
|
| ||||||
Total borrowings (000s) | $ |
| $ |
| $ |
| ||||||
Asset coverage per $1,000 unit of senior indebtedness9 | $ |
| $ |
| $ |
| ||||||
* Commencement of offering of Class D shares.
1
2 Net investment loss and net expenses have been annualized for any periods less than one year, except for any non-recurring expenses which are not annualized. Expenses do not include expenses from Private Assets in which the Fund invests.
3 Recognition of net investment income by the Fund is affected by the timing of the declaration of distributions by the Private Assets in which the Fund invests. Ratios do not include net investment income/(loss) of the Private Assets in which the Fund invests.
4 If Incentive Fees had been excluded, the expense ratios would have decreased by 0.75%, 0.98% and 0.51% for years ended March 31, 2025 and 2024, and the period from November 1, 2022 through March 31, 2023, respectively.
5 Includes an annualized voluntary waiver of Investment Management fees by the Adviser of 0.13%, 0.84% and 1.20% for the years ended March 31, 2025 and 2024, and the period from November 1, 2022 through March 31, 2023, respectively.
6 If interest expenses had been excluded, the expense ratios would have decreased by 0.60%, 0.72% and 0.62% for the years ended March 31, 2025 and 2024, and the period from November 1, 2022 through March 31, 2023, respectively.
7 Total return based on per unit net asset value reflects the change in net asset value based on the effects of the performance of the Fund during the period and assumes distributions, if any, were reinvested. Total returns shown are not annualized for periods less than a year and exclude the effect of applicable sales charges.
8 Includes adjustments in accordance with US GAAP and accordingly, the returns and per unit net asset value for financial reporting may differ from the returns and per unit net asset value used for shareholder transactions.
9
10 Not annualized.
See accompanying notes to the Consolidated Financial Statements.
18
|
Constitution Capital Access Fund, LLC |
|
Consolidated Financial Highlights Class I Shares |
Per share operating performance.
For a capital share outstanding throughout each period.
| For the | For the | For the Period | ||||||||||
| Per Share Operating Performance1: |
|
|
|
|
|
| ||||||
| Net Asset Value per share, beginning of period/year | $ | 11.16 |
| $ | 10.61 |
| $ | 10.00 |
| |||
| Activity from investment operations: |
|
|
|
|
|
| ||||||
| Net investment income/(loss) |
| (0.12 | ) |
| (0.11 | ) |
| (0.02 | ) | |||
| Net realized and unrealized gain/(loss) on investments |
| 1.03 |
|
| 1.18 |
|
| 0.63 |
| |||
| Total from investment operations |
| 0.91 |
|
| 1.07 |
|
| 0.61 |
| |||
|
|
|
|
|
|
| |||||||
| Distributions to shareholders |
|
|
|
|
|
| ||||||
| Net investment income |
| — |
|
| (0.10 | ) |
| — |
| |||
| Net realized gains |
| (0.66 | ) |
| (0.42 | ) |
| — |
| |||
| Total distributions to shareholders |
| (0.66 | ) |
| (0.52 | ) |
| — |
| |||
|
|
|
|
|
|
| |||||||
| Net Asset Value per share, end of period/year | $ | 11.418 |
| $ | 11.168 |
| $ | 10.618 |
| |||
|
|
|
|
|
|
| |||||||
| Net Assets, end of period/year | $ | 710,038,308 |
| $ | 645,072,698 |
| $ | 595,739,269 |
| |||
|
|
|
|
|
|
| |||||||
| Ratios to average net assets2: |
|
|
|
|
|
| ||||||
| Net investment income/(loss)3 |
| (1.07 | )% |
| (2.79 | )% |
| (2.10 | )% | |||
|
|
|
|
|
|
| |||||||
| Gross expenses before waivers4 |
| 3.64 | % |
| 3.90 | % |
| 3.64 | % | |||
| Waivers of Investment management fees and Incentive fees5 |
| (2.04 | )% |
| (1.82 | )% |
| (1.88 | )% | |||
| Net expenses5,6 |
| 1.60 | % |
| 2.08 | % |
| 1.76 | % | |||
|
|
|
|
|
|
| |||||||
| Total Return7 |
| 8.22 | %8 |
| 10.24 | %8 |
| 6.10 | %8 | |||
|
|
|
|
|
|
| |||||||
| Portfolio turnover rate |
| 1 | % |
| 2 | % |
| 0 | %10 | |||
|
|
|
|
|
|
| |||||||
| Senior Securities |
|
|
|
|
|
| ||||||
| Total borrowings (000s) | $ | |
| $ | |
| $ | |
| |||
| Asset coverage per $1,000 unit of senior indebtedness9 | $ | |
| $ | |
| $ | |
| |||
* The Fund commenced operations on October 1, 2022 following reorganization of U/C Seed Partnership Fund, L.P. which was effective as of close of business on September 30, 2022, see Note 1 in the accompanying notes to Consolidated Financial Statements.
1
2 Net investment loss and net expenses have been annualized for any periods less than one year, except for any non-recurring expenses which are not annualized. Expenses do not include expenses from Private Assets in which the Fund invests.
3 Recognition of net investment income by the Fund is affected by the timing of the declaration of distributions by the Private Assets in which the Fund invests. Ratios do not include net investment income/(loss) of the Private Assets in which the Fund invests.
4 If Incentive Fees had been excluded, the expense ratios would have decreased by 0.75%, 0.98% and 0.51% for years ended March 31, 2025 and 2024, and the period from October 1, 2022 through March 31, 2023, respectively.
5 Includes an annualized voluntary waiver of Investment Management fees by the Adviser of 0.13%, 0.84% and 1.28% for the years ended March 31, 2025 and 2024, and the period from October 1, 2022 through March 31, 2023, respectively.
6 If interest expenses had been excluded, the expense ratios would have decreased by 0.60%, 0.72% and 0.62% for the years ended March 31, 2025 and 2024, and the period from October 1, 2022 through March 31, 2023, respectively.
7 Total return based on per unit net asset value reflects the change in net asset value based on the effects of the performance of the Fund during the period and assumes distributions, if any, were reinvested. Total returns shown are not annualized for periods less than a year and exclude the effect of applicable sales charges.
8 Includes adjustments in accordance with US GAAP and accordingly, the returns and per unit net asset value for financial reporting may differ from the returns and per unit net asset value used for shareholder transactions.
9 Calculated by subtracting the Fund’s total liabilities (not including borrowings) from the Fund’s total assets and dividing this by the total number of senior indebtedness units, where one unit equals $1,000 of senior indebtedness.
10 Not annualized.
See accompanying notes to the Consolidated Financial Statements.
19
|
Constitution Capital Access Fund, LLC |
|
Notes to Consolidated Financial Statements March 31, 2025 |
|
Note 1 – Organization |
Constitution Capital Access Fund, LLC (the “Fund”) is a Delaware limited liability company registered under the Investment Company Act of 1940, as amended (the “Investment Company Act”), as a non-diversified closed-end management investment company. The Fund was organized on March 3, 2022 and commenced operations on October 1, 2022 (the “Commencement of Operations”). Constitution Capital PM, LP serves as the investment adviser (the “Adviser”) of the Fund. The Adviser is an investment adviser registered with the Securities and Exchange Commission (the “SEC”) under the Investment Advisers Act of 1940, as amended.
Simultaneous with the Commencement of Operations, the U/C Seed Partnership Fund, L.P. (the “Predecessor Fund”), reorganized and transferred substantially all its portfolio securities into the Fund with a transfer value policy election to use fair market value as opening cost for a non-taxable transaction.
The Fund’s investment objective is to generate long-term capital appreciation. The Fund seeks to achieve its investment objective by investing in a broad portfolio of investments in private assets (collectively, “Private Assets”) that the Adviser believes provide attractive risk-adjusted return potential. The Fund’s investments include (i) direct investments and co-investments in the equity or debt of operating companies (“Direct Equity Investments” or “Direct Credit Investments,” respectively, and together, “Direct Investments”); (ii) primary commitments to new private equity or other closed-end private funds and purchases of existing interests of private equity or other closed-end private funds that are acquired on the secondary market (“Primary Investments” and “Secondary Investments”, respectively, and together, “Investment Funds”), which are managed by third-party managers (“Investment Fund Managers”); (iii) direct or secondary purchases of liquid credit instruments; (iv) other liquid investments (i.e. strategies with a higher liquidity profile than direct investments or investments in funds, including listed private equity) and short-term investments (together, “Short-term Investments”).
The Fund offers three separate classes of shares of beneficial interest (“Shares”) designated as Class A Shares, Class D Shares and Class I Shares. Each class of Shares have differing characteristics, particularly in terms of the sales charges that Shareholders in that class may bear, and the distribution and service fees that each class may be charged. The Fund has received an exemptive order from the SEC with respect to the Fund’s multi-class structure.
The Fund is deemed to be an individual reporting segment, and the investment objective and investment strategies of the Fund, as detailed in its Prospectus, is used by the Adviser to make investment decisions in its capacity as the chief operating decision maker (“CODM”). The Fund’s portfolio composition, total returns, expense ratios and changes in net assets used by the CODM for the day-to-day management of the Fund is consistent with the information presented within these Consolidated Financial Statements. The Fund is party to the agreements as disclosed in Note 5 of the Consolidated Financial Statements and there are no resources allocated to the Fund based on performance measurements.
a. Consolidation of Subsidiaries
The Fund may make investments through wholly owned subsidiaries (each a “Subsidiary” and together, the “Subsidiaries”). Such Subsidiaries will not be registered under the Investment Company Act; however, the Fund will wholly own and control any Subsidiaries. The Fund’s Board of Managers (the “Board”) has oversight responsibility for the investment activities of the Fund, including its investment in any Subsidiary, and the Fund’s role as sole owner of any Subsidiary. To the extent applicable to the investment activities of a Subsidiary, the Subsidiary will follow the same compliance policies and procedures as the Fund. The Fund would “look through” any such Subsidiary to determine compliance with its investment policies. The Fund complies with Section 8 of the Investment Company Act governing investment policies on an aggregate basis with any Subsidiary. The Fund also complies with Section 18 of the Investment Company Act governing capital structure and leverage on an aggregate basis with each Subsidiary so that the Fund treats a Subsidiary’s debt as its own for purposes of Section 18. Further, each Subsidiary complies with the provisions of Section 17 of the Investment Company Act relating to affiliated transactions and custody. The Fund will not create or acquire primary control of any entity which engages in investment activities in securities or other assets, other than entities wholly owned by the Fund.
20
|
Constitution Capital Access Fund, LLC |
|
Notes to Consolidated Financial Statements (Continued) March 31, 2025 |
|
Note 1 – Organization (continued) |
As of March 31, 2025, there are three active Subsidiaries:
|
Subsidiary |
Formation Date |
Domicile |
% of |
# of |
|
CC PMF Holdings, LLC |
March 17, 2022 |
United States |
94.55 |
79 |
|
CC PMF Blocker, LLC |
March 21, 2022 |
United States |
0.05 |
1 |
|
CC PMF Splitter Partnership |
August 5, 2022 |
United States |
5.40 |
5 |
The Consolidated Financial Statements of the Fund include the accounts of the Subsidiaries. All intercompany accounts and transactions have been eliminated.
Note 2 – Significant Accounting Policies
The following is a summary of the significant accounting and reporting policies used by the Fund in preparing its Consolidated Financial Statements.
a. Basis of Accounting
The Fund is an investment company and applies the guidance set forth in Accounting Standards Codification (“ASC”) Topic 946, Financial Services — Investment Companies (“ASC 946”). The Fund’s accounting and reporting policies conform with U.S. generally accepted accounting principles (“U.S. GAAP”).
b. Valuation of Investments
The Fund invests, under normal circumstances, in a broad portfolio of private assets and values them at fair value in accordance with the provisions of ASC Topic 820, Fair Value Measurements and Disclosures (“ASC 820”).
In December 2020, the SEC adopted a new rule providing a framework for fund valuation practices (“Rule 2a-5”). Rule 2a-5 establishes requirements for determining fair value in good faith for purposes of the Investment Company Act. Rule 2a-5 permits fund boards to designate certain parties to perform fair value determinations, subject to board oversight and certain other conditions. Rule 2a-5 also defines when market quotations are “readily available” for purposes of the Investment Company Act and the threshold for determining whether a fund must fair value a security. Pursuant to the requirements of Rule 2a-5, the Board has designated the Adviser as its valuation designee to perform fair value determinations and approved the valuation procedures for the Fund.
Where available, the Fund uses the net asset value (“NAV”) reported by the sponsors (“Sponsors”) of the Direct Investments and Investment Fund Managers as a practical expedient in determining their fair values as of a valuation date for the Fund, in accordance with ASC 820. If the most recent NAV is reported as of a date which does not align with the valuation date for the Fund, the Adviser assesses whether an adjustment to the most recently reported NAV is justified in accordance with the Fund’s valuation procedures. In making this assessment, the Adviser considers, among other things, information provided by the Sponsors and Investment Fund Managers, including quarterly unaudited financial statements and cash flow activity observed during the period between the most recently reported NAV date and the valuation date for the Fund. The Adviser will also review the appropriateness of the adjustment to the most recently reported NAV based on any new information or changes in assumptions regarding the security, reliable public information, actual trade prices or other information that becomes available subsequent to the most recently reported NAV.
If a NAV is not reported by a Sponsor or an Investment Fund Manager to the Fund or an investment does not meet the qualifications of an investment company under ASC 946, the Adviser may make a fair value determination by utilizing information provided by the Sponsor or Investment Fund Manager, including quarterly unaudited financial statements, financial forecasts, and cash flow activity observed during the valuation period. The Adviser may also utilize the cost of the investment, present value or other subjective income and market-based valuation techniques acceptable under ASC 820. These techniques may include references to market multiples, valuations for comparable companies, public market or private transactions, subsequent developments concerning the companies to which the securities relate, results of operations, financial condition, cash flows, and projections of such companies provided to the Adviser and such other factors as the Adviser may deem relevant. Depending on the circumstances, company multiples will not always be comparable due to the size of the related companies or associated transactions being used as comparable data in valuation.
21
|
Constitution Capital Access Fund, LLC |
|
Notes to Consolidated Financial Statements (Continued) March 31, 2025 |
|
Note 2 – Significant Accounting Policies (continued) |
The Adviser has established an internal valuation committee consisting of senior members of the organization to review and approve valuations related to the Direct Investments and Investment Funds as of each valuation date.
For investments that are publicly traded and have market quotations readily available on one or more of the U.S. national securities exchanges, the Nasdaq Stock Market or any foreign stock exchange, valuations will be based on their respective market price and may be further adjusted for potential restrictions on the transfer or sale of such securities.
c. Cash and Cash Held in Escrow
In order to maintain liquidity, the Fund holds cash, including amounts held in foreign currencies and in short-term interest-bearing deposit accounts with UMB Bank, n.a. (the “Custodian”). At times, those amounts may exceed any applicable federally insured limits. The Fund has not experienced any losses in such accounts and does not believe that it is exposed to any significant credit risk on such accounts.
Subscriptions are generally subject to the receipt of cleared funds on or prior to the acceptance date set by the Fund and notified to prospective investors. Cash held in escrow represents funds received from prospective investors prior to the effective date of the subscriptions, which are restricted for use and placed in an interest-bearing escrow account with the Custodian, who also serves as the Fund’s escrow agent. On the effective date of the subscription, the balance in the escrow account with respect to each investor whose investment is accepted will be invested in the Fund on behalf of such investor. Interest, if any, earned on escrowed amounts will be credited to the Fund for the benefit of all Shareholders. As of March 31, 2025, the Fund had $8,722,905 of cash equivalents (defined below) held in escrow related to subscriptions that were received prior to the effective date of the subscriptions and are disclosed on the Consolidated Statement of Assets and Liabilities.
d. Cash Equivalents
Cash equivalents represent short-term investments in high quality money market instruments and money market mutual funds and are recorded at NAV per share which approximates fair value. Money market instruments are high quality, short-term fixed-income obligations, with a low risk of loss and which generally have remaining maturities of one year or less. Such short-term investments may include U.S. Government securities, commercial paper, certificates of deposit and bankers’ acceptances issued by domestic branches of U.S. banks that are members of the Federal Deposit Insurance Corporation. Cash equivalents held by the Fund are disclosed under short-term investments on the Consolidated Schedule of Investments.
e. Forward Foreign Currency Exchange Contracts
The Fund may enter into forward foreign currency exchange contracts for the purchase or sale of a specific foreign currency at a fixed price on a future date to manage foreign exchange rate risk. The Fund’s forward foreign currency exchange contracts are not considered to be hedging instruments under U.S. GAAP and, therefore, the Fund accounts for them at fair value on the Consolidated Statement of Assets and Liabilities at the applicable translation rates, resulting in unrealized gains or losses. Realized gains or losses are recorded at the time the forward foreign currency exchange contract is closed, and the currency is delivered or received, whether upon maturity of the forward foreign currency exchange contract or by the election of a party to terminate the forward foreign currency exchange contract. Risk may arise upon entering into forward foreign currency exchange contracts from the potential inability of the counterparty to meet the terms of their contracts and from unanticipated movements in the value of a foreign currency relative to the U.S. Dollar. Refer to Note 4 on more information regarding the Fund’s use of forward foreign currency exchange contracts.
f. Foreign Currency
Valuations of assets and liabilities denominated in currencies other than the U.S. Dollar are translated into U.S. Dollar equivalents using valuation date exchange rates, while purchases, realized gains and losses, income and expenses are translated at transaction date exchange rates. The Fund does not isolate the effects of changes in foreign currency rates on the valuation of Private Assets. Such fluctuations in exchange rates are included with and form part of the net realized and unrealized gain (loss) from investments and net realized and unrealized gain (loss) from currency transactions on the Consolidated Statement of Operations.
22
|
Constitution Capital Access Fund, LLC |
|
Notes to Consolidated Financial Statements (Continued) March 31, 2025 |
|
Note 2 – Significant Accounting Policies (continued) |
g. Investment Income
The Fund’s primary sources of income are investment income and gains recognized upon distributions from Private Assets and unrealized appreciation in the fair value of its Private Assets. The Fund generally recognizes investment income and realized gains based on the characterization of distributions provided by the Private Assets at the time of distributions.
Realized gains and losses from the sale of Private Assets represent the difference between the original cost of the Private Assets, as adjusted for return of capital distributions (net cost), and the net proceeds received at the time of the sale, disposition or distribution. The Fund recognizes the difference between the net cost and the estimated fair value of Private Assets owned as the net change in unrealized appreciation/depreciation on investments in the Consolidated Statement of Operations.
Interest income, including amortization of premium or discount using the effective interest method and interest on paid-in-kind instruments, is recorded on an accrual basis. Dividend income is recognized on preferred equity securities on an accrual basis, and on common equity securities on the record date (for private companies) or on the ex-dividend date (for publicly traded companies). Other income from Private Assets, which represents operating income from investment partnerships or other flow through entities received by the Fund, is recorded on the date received.
h. Income Taxes
The Fund elects to be treated as, and continues to qualify as, a Regulated Investment Company as defined under Subchapter M of the Internal revenue Code of 1986, as amended (the “Code”), by distributing substantially all of its taxable income and net realized gains (after reduction for any capital loss carryforwards) to Shareholders, and by meeting certain diversification and income requirements with respect to its investments. Therefore, no federal income tax provision has been recorded for the Fund.
The Fund recognizes the tax benefits of certain uncertain tax positions only where the position is “more likely than not” to be sustained assuming examination by tax authorities in accordance with ASC Topic 740, Accounting for Uncertainty in Income Taxes (“ASC 740”). The Adviser has analyzed the Fund’s tax positions and has concluded that the Fund does not have any uncertain tax positions that met the recognition criteria of ASC 740 as of March 31, 2025. The tax years ended September 30, 2023 and September 30, 2024 for the Fund are open and subject to examination by the IRS.
A Subsidiary of the Fund, CC PMF Blocker, LLC (the “Blocker”), is a domestic limited liability company that elects to be treated as a C-corporation for federal and state income tax purposes and is required to account for its estimate of income taxes through the establishment of a deferred tax asset or liability. The Blocker recognizes deferred income taxes for temporary differences in the basis of assets and liabilities for financial and income tax purposes. Deferred tax assets are recognized for deductible temporary differences, tax credit carryforwards or net operating loss carryforwards and deferred tax liabilities are recognized for taxable temporary differences. To the extent the Blocker has a deferred tax asset, the Adviser considers whether a valuation allowance is required. Detailed tax information for the Fund and the Blocker is included in Note 15.
i. Use of Estimates
The preparation of financial statements in conformity with U.S. GAAP requires the Fund to make estimates and assumptions that affect the reported amounts of assets and liabilities and disclosure of contingent assets and liabilities at the date of the Consolidated Financial Statements and the reported amounts of increases and decreases in capital from operations during the reporting period. Actual results may differ from those estimates.
The Fund bears all expenses incurred in the course of its operations, including, but not limited to, the following: all fees and expenses of the Private Assets in which the Fund invests, fees and expenses associated with a credit facility, legal fees, administrator fees, audit and tax preparation fees, custodial fees, transfer agency fees, registration expenses, expenses of the Board and other administrative expenses. Certain of these operating expenses, other than class-specific expenses, are subject to an expense limitation agreement and reimbursement agreement (the “Expense Limitation Agreement”, as further discussed in Note 5). Expenses are recorded on an accrual basis and allocated to Shares based upon ownership percentage.
23
|
Constitution Capital Access Fund, LLC |
|
Notes to Consolidated Financial Statements (Continued) March 31, 2025 |
|
Note 2 – Significant Accounting Policies (continued) |
j. Recent Accounting Pronouncements
In December 2023, the FASB issued Accounting Standard Update No. 2023-09, Income Taxes (ASC 740) Improvements to Income Tax Disclosures (“ASU 2023-09”). The primary purpose of the amendments within ASU 2023-09 is to enhance the transparency and decision usefulness of income tax disclosures primarily related to the rate reconciliation table and income taxes paid information. The amendments in ASU 2023-09 require that public business entities on an annual basis (1) disclose specific categories in the rate reconciliation and (2) provide additional information for reconciling items that meet a quantitative threshold. In addition, the amendments in this ASU 2023-09 require that all entities disclose on an annual basis taxes paid disaggregated by federal, state, foreign, and individual jurisdiction (when income taxes paid is equal to or greater than five percent of total income taxes paid). The amendments in ASU 2023-09 are effective for annual periods of public business entities beginning after December 15, 2024. Early adoption is permitted for annual financial statements that have not yet been issued or made available for issuance. The amendments in ASU 2023-09 should be applied on a prospective basis. Retrospective application is permitted. The Adviser is currently evaluating the impact that the adoption of ASU 2023-09, once effective, will have on the Consolidated Financial Statements.
Note 3 – Fair Value Measurements
ASC 820 defines fair value as the price that would be received to sell an asset or paid to transfer a liability in an orderly transaction between market participants at the measurement date (i.e., the exit price), or in the absence of a principal market, the most advantageous market for the asset, and establishes a fair value hierarchy for inputs used in measuring fair value that maximizes the use of observable inputs and minimizes the use of unobservable inputs by requiring that the most observable inputs be used when available. Observable inputs are those that market participants would use in pricing the asset or liability based on market data obtained from sources independent of the Adviser. Unobservable inputs reflect the Adviser’s assumption about the inputs market participants would use in pricing the asset or liability developed based on the best information available in the circumstances. The fair value hierarchy is categorized into three levels based on the inputs as follows:
Level 1 — Unadjusted quoted prices in active markets for identical assets or liabilities that the reporting entity has the ability to access at the measurement date. The types of financial instruments included in Level 1 are listed unrestricted securities, equities and listed derivatives, if any, listed in active markets.
Level 2 — Inputs other than quoted prices within Level 1 that are observable for the asset or liability, either directly or indirectly in active markets as of the reporting date, and fair value that is determined using models or other valuation methodologies. Financial instruments in this category generally include corporate bonds and loans, less liquid and restricted securities listed in active markets, securities traded in other than active markets, government and agency securities, over-the-counter derivatives where fair value is based on observable inputs, and interests in Private Assets whose fair value is predominantly attributable to investments in Level 1 type securities. A significant adjustment to a Level 2 input could result in the Level 2 measurement becoming a Level 3 measurement.
Level 3 — Inputs that are unobservable for the asset or liability and that include situations where there is little, if any, market activity for the asset or liability. The inputs into the determination of fair value are based upon the best information in the circumstances and may require significant management judgment or estimation. Financial instruments in this category generally include equity and debt positions in private companies, and non-redeemable investments in alternative investment funds, non-investment grade residual interests in securitizations, collateralized loan obligations, and certain over-the-counter derivatives, if any, where the fair value is based on unobservable inputs.
ASC 820 also permits a reporting entity to measure the fair value of an asset that does not have a readily determinable fair value based on the reported NAV per share, or its equivalent, as a practical expedient for its fair value. Accordingly, the Fund may utilize the NAV per share as reported by certain Sponsors and Investment Fund Managers as of a valuation date as a practical expedient for its fair value. If the NAV reported by certain Sponsors and Investment Fund Managers is not as of the same date as the valuation date, the Fund is permitted under ASC 820 to estimate the fair value of those Private Assets by adjusting the most recently reported NAV as a practical expedient for fair value.
24
|
Constitution Capital Access Fund, LLC |
|
Notes to Consolidated Financial Statements (Continued) March 31, 2025 |
|
Note 3 – Fair Value Measurements (continued) |
Due to the inherent uncertainty of estimates, fair value determinations based on estimates may materially differ from the values that would have been used had a ready market for the securities existed.
The inputs or methodology used for valuing securities are not an indication of the risk associated with investing in those securities.
The following table is a summary of information about the levels within the fair value hierarchy at which the Fund’s investments are measured as of March 31, 2025:
|
Level 1 |
Level 2 |
Level 3 |
NAV as a |
Total |
|||||||||||
|
Investments |
|
|
|
|
|
||||||||||
|
Direct Investments |
$ |
— |
$ |
2,373,404 |
$ |
84,122,676 |
$ |
334,082,695 |
$ |
420,578,775 |
|||||
|
Investment Funds |
|
— |
|
— |
|
— |
|
343,925,707 |
|
343,925,707 |
|||||
|
Short-Term Investments |
|
35,600,514 |
|
— |
|
— |
|
— |
|
35,600,514 |
|||||
|
Total Investments |
$ |
35,600,514 |
$ |
2,373,404 |
$ |
84,122,676 |
$ |
678,008,402 |
$ |
800,104,996 |
|||||
|
Liabilities |
|
|
|
|
|
||||||||||
|
Other Financial Instruments(2) |
|
|
|
|
|
||||||||||
|
Forward foreign currency exchange contracts |
$ |
— |
$ |
(4,357,196) |
$ |
— |
$ |
— |
$ |
(4,357,196) |
|||||
|
Total Liabilities |
$ |
— |
$ |
(4,357,196) |
$ |
— |
$ |
— |
$ |
(4,357,196) |
|||||
|
Total Investments, net of Forward Foreign Currency Exchange Contracts |
$ |
35,600,514 |
$ |
(1,983,792) |
$ |
84,122,676 |
$ |
678,008,402 |
$ |
795,747,800 |
|||||
(1) Direct Investments and Investment Funds that are measured at fair value using NAV (or its equivalent) as a practical expedient are not required to be categorized in the fair value hierarchy. The fair values presented in this table are intended to permit reconciliation of the fair value hierarchy to the amounts presented in the Consolidated Schedule of Investments.
(2) Other financial instruments are derivative instruments such as forward foreign currency exchange contracts. Forward foreign currency exchange contracts are valued at unrealized appreciation (depreciation) on the instrument.
The following is a reconciliation of assets in which significant unobservable inputs (Level 3) were used in determining value:
|
Direct |
Investment |
|||
|
Balance as of March 31, 2024 |
$ |
196,324,753 |
$ |
80,112,556 |
|
Transfers into Level 3 |
7,804,843 |
— |
||
|
Transfers out of Level 3 |
(140,445,050) |
(79,800,363) |
||
|
Total gains or losses for the period |
||||
|
Included in earnings (or changes in net assets) |
1,872,668 |
— |
||
|
Purchases |
25,082,214 |
— |
||
|
Return of capital distributions |
(6,516,752) |
(312,193) |
||
|
Balance as of March 31, 2025 |
$ |
84,122,676 |
$ |
— |
|
Change in unrealized gains or losses for the period included in earnings (or changes in partners’ capital) for Level 3 assets held at the end of the reporting period |
$ |
1,824,483 |
$ |
— |
25
|
Constitution Capital Access Fund, LLC |
|
Notes to Consolidated Financial Statements (Continued) March 31, 2025 |
|
Note 3 – Fair Value Measurements (continued) |
Changes in inputs or methodologies used for valuing investments, including timing of reported net asset values of Direct Investments reported by their sponsor, and of Investment Funds reported by the Investment Fund Managers, may result in transfers in or out of levels within the fair value hierarchy. The inputs or methodologies used for valuing investments may not necessarily be an indication of the risk associated with investing in those investments. Such changes during the period resulted in transfers into Level 3 during the year ended March 31, 2025 due to sales of all publicly traded shares held by Direct Investments and all transfers out of Level 3 during the year ended March 31, 2025, as a reported or adjusted NAV as of March 31, 2025 became available to utilize as a practical expedient.
The following table presents additional quantitative information about valuation methodologies and inputs used for investments that are measured at fair value and categorized within Level 3 as of March 31, 2025:
|
Investments |
Asset Class |
Fair |
Valuation |
Unobservable |
Range of |
Weighted |
Impact to |
|
|
Direct Investments |
Direct Equity |
$ |
59,155,284 |
Market Approach |
EBITDA Multiple |
8.8x – 18.0x |
12.4x |
Increase |
|
Direct Investments |
Direct Equity |
$ |
19,588,008 |
Cost |
Recent |
N/A |
N/A |
N/A |
|
Direct Investments |
Direct Equity |
$ |
3,445,312 |
Income Approach |
Weighted average cost of capital |
14.0% |
14.0% |
Decrease |
|
Exit multiple |
13.0x |
13.0x |
Increase |
|||||
|
Direct Investments |
Direct Credit |
$ |
1,934,072 |
Income Approach |
Market Yield |
4.0% – 14.0% |
13.0% |
Increase |
(1) The Adviser considers relevant indications of value that are reasonably and timely available, including known information available before the financial statements are issued, in determining the fair value to be assigned to a particular security, such as the type, cost and recent purchases or sales of the security; contractual or legal restrictions on resale of the security; relevant financial or business developments of the issuer; actively traded related securities; conversion or exchange rights on the security; related corporate actions; significant events occurring after the close of trading in the security; and changes in overall market conditions. Fair value pricing involves subjective judgments and it is possible that the fair value determined for a security may be materially different than the value that could be realized upon the sale of that security.
(2) Weighted average by the relative fair value of the investments in that asset class.
Level 3 Direct Investments valued using an unobservable input are directly affected by a change in that input. Significant increases or decreases in these inputs in isolation would result in significantly higher or lower fair value measurements.
The Fund’s Direct Investments and Investment Funds, along with their corresponding unfunded commitments and other attributes as of March 31, 2025, are summarized in the table below:
|
Investment Category |
Strategy |
Fair Value |
Unfunded |
Redemption |
Notice |
Redemption |
|
Direct Investments |
Investments in an operating company alongside other investors |
$ 420,578,775 |
$ 18,790,118 |
None |
N/A |
Liquidity in the form of distributions |
|
Primary Investments |
Investments in newly launched Investment Funds |
224,101,665 |
50,296,375 |
None |
N/A |
Liquidity in the form of distributions |
26
|
Constitution Capital Access Fund, LLC |
|
Notes to Consolidated Financial Statements (Continued) March 31, 2025 |
|
Note 3 – Fair Value Measurements (continued) |
|
Investment Category |
Strategy |
Fair Value |
Unfunded |
Redemption |
Notice |
Redemption |
|
Secondary Investments |
Investments in existing Investment Funds that are acquired in privately negotiated transactions |
$ 119,113,645 |
$ 22,004,402 |
None |
N/A |
Liquidity in the form of distributions |
* The information summarized in the table above represents general terms. Individual Private Assets may have terms that are more or less restrictive than those terms indicated for the asset class as a whole. In addition, most Private Assets have the flexibility, as provided for in their offering documents, to modify and waive such terms.
** Distributions from Private Assets occur at irregular intervals, and the exact timing of distributions from Private Asset investments cannot be determined.
Note 4 – Derivatives and Hedging
ASC Topic 815, Derivatives and Hedging, requires enhanced disclosures about the Fund’s derivative and hedging activities, including how such activities are accounted for and their effects on the Fund’s financial position, performance and cash flows.
The Fund engaged in forward foreign currency exchange contracts during the year ended March 31, 2025. The $4,357,196 of unrealized depreciation on forward foreign currency exchange contracts on the Consolidated Statement of Assets and Liabilities is subject to forward foreign currency exchange contract risk.
The effects of these derivative instruments on the Fund’s financial position and financial performance as reflected in the Consolidated Financial Statements of the Fund are presented in the tables below.
|
Derivatives not designated as hedging |
Location on Consolidated Statement of Asset |
Value |
|||
|
Forward foreign currency exchange contracts |
Unrealized depreciation on forward foreign currency exchange contracts |
$ |
(4,357,196) |
||
The effects of derivative instruments on the Consolidated Statement of Operations for the year ended March 31, 2025, are as follows:
|
Derivatives not designated as hedging |
Location on Consolidated Statement of |
Value |
|
Forward foreign currency exchange contracts |
Net Realized Gain/(Loss) on Derivatives Recognized in Income |
$ (24,667) |
|
Forward foreign currency exchange contracts |
Net Change in Unrealized Appreciation/Depreciation) on Derivatives Recognized in Income |
$ (4,357,196) |
The notional amount of forward foreign currency exchange contracts is included on the Consolidated Schedule of Investments. The monthly average notional value of forward foreign currency exchange contracts was $23,486,602, and the monthly average contracts held was 1, respectively, as of March 31, 2025.
27
|
Constitution Capital Access Fund, LLC |
|
Notes to Consolidated Financial Statements (Continued) March 31, 2025 |
|
Note 4 – Derivatives and Hedging (continued) |
a. Offsetting of Derivatives Assets and Liabilities
Disclosures about offsetting assets and liabilities require an entity to disclose information about offsetting and related arrangements to enable users of its financial statements to understand the effect of those arrangements on its financial position. For financial reporting purposes, the Fund does not offset derivative assets and liabilities that are subject to master netting agreements or similar arrangements in the Consolidated Statement of Assets and Liabilities, and derivative instruments are therefore presented on a gross basis. Gross amounts of the derivative instruments, amounts related to financial instruments or cash collateral not offset, and net amounts are presented below:
|
Derivative |
Derivative |
Collateral Pledged |
||||||||||||||||||
|
Counterparty |
Forward |
Forward |
Net |
Financial |
Cash |
Net |
||||||||||||||
|
Bannockburn Global Forex, LLC |
$ |
— |
$ |
(4,357,196 |
) |
$ |
(4,357,196 |
) |
$ |
— |
$ |
— |
$ |
— |
||||||
Note 5 – Investment Management Services and Other Agreements
a. Investment Management Fee
The Fund pays the Adviser an investment management fee (the “Investment Management Fee”) in consideration of the advisory and other services provided by the Adviser to the Fund, in accordance with the Investment Management Agreement. The Investment Management Fee is paid to the Adviser out of the Fund’s assets and therefore decreases the net profits or increases the net losses of the Fund and is due and payable in arrears within fifteen business days after the end of each month.
The Fund pays the Adviser a monthly Investment Management Fee equal to 0.125% (1.50% on an annualized basis) of the greater of (i) the Fund’s NAV as of the beginning of the month and (ii) the Fund’s NAV as of the beginning of the month less cash and cash equivalents plus the total of all commitments made by the Fund that have not yet been drawn for investment as of the beginning of the month.
During the period from April 1, 2024 through June 30, 2024, the Adviser agreed to voluntarily waive 50% (or, 0.75%) of the 1.50% annualized Investment Management Fee.
On July 1, 2024, the Adviser entered into an investment management fee waiver agreement with the Fund (the “Management Fee Waiver Agreement”) whereby, until at least June 30, 2025, the Adviser has agreed to waive all or a portion of the Investment Management Fee so that after such waiver, the maximum Investment Management Fee that the Adviser shall be entitled to receive from the Fund shall be equal to 0.25%, on an annualized basis, of the greater of (i) the Fund’s net asset value as of the beginning of the month and (ii) the Fund’s net asset value as of the beginning of the month less cash and cash equivalents plus the total of all commitments made by the Fund that have not yet been drawn for investment as of the beginning of the month.
For the year ended March 31, 2025, the Investment Management Fee totaled $11,265,980. Under the terms of the voluntary waiver and the Management Fee Waiver Agreement, the Adviser voluntarily waived $902,479 and contractually waived $7,884,185 of the Investment Management Fee, for a total amount waived of $8,786,664 during the year ended March 31, 2025.
28
|
Constitution Capital Access Fund, LLC |
|
Notes to Consolidated Financial Statements (Continued) March 31, 2025 |
|
Note 5 – Investment Management Services and Other Agreements (continued) |
b. Incentive Fee
At the end of each calendar quarter (and at certain other times), the Adviser will be entitled to receive an amount (the “Incentive Fee”) equal to 10% of the excess, if any, of (i) the net profits of the Fund for the relevant period over (ii) the then balance, if any, of the Loss Recovery Account (as defined below). For the purposes of the Incentive Fee, the term “net profits” shall mean the amount by which the NAV of the Fund on the last day of the relevant period exceeds the NAV of the Fund as of the commencement of the same period, including any net change in unrealized appreciation or depreciation of investments and realized income and gains or losses and expenses (including offering and organizational expenses).
The Fund will maintain a memorandum account (the “Loss Recovery Account”), which will have an initial balance of zero and will be (i) increased upon the close of each calendar quarter of the Fund by the amount of the net losses of the Fund for the quarter, and (ii) decreased (but not below zero) upon the close of each calendar quarter by the amount of the net profits of the Fund for the quarter. Shareholders will benefit from the Loss Recovery Account in proportion to their holdings of Shares.
During the period from April 1, 2024 through June 30, 2024, the Adviser agreed to voluntarily waive 100% of the Incentive Fee. On July 1, 2024, the Adviser entered into an incentive fee waiver agreement with the Fund (the “Incentive Fee Waiver Agreement”), whereby, until at least June 30, 2025, the Adviser has contractually agreed to waive any and all of the Incentive Fee that would otherwise be payable to it.
For the year ended March 31, 2025, the Fund incurred $5,132,482 in Incentive Fees. Under the terms of the voluntary waiver and Incentive Fee Waiver Agreement, the Adviser voluntarily waived $0 and contractually waived $5,132,482 of the Incentive Fee, for a total amount waived of $5,132,482 during the year ended March 31, 2025.
c. Administrative Services Agreement
The Adviser has entered into an administrative services agreement (the “Administrative Services Agreement”) with the Fund effective October 1, 2024, whereby the Adviser is responsible for performing, overseeing, or arranging for the performance of certain administrative services necessary to support the day-to-day operations of the Fund. Costs incurred by the Adviser to perform such administrative services are reasonably allocated by the Adviser to the Fund on the basis of an allocation methodology that is deemed to be reasonable by the Adviser. The Administrative Services Agreement remains in effect unless so terminated by the Adviser or the Fund.
The Fund accrues for amounts due to the Adviser under the terms of the Administrative Services Agreement monthly and pays the Adviser within fifteen business days after the end of each quarter. For the year ended March 31, 2025, the Fund reimbursed $231,220 to the Adviser under the terms of the Administrative Services Agreement and such amounts are shown on the Consolidated Statement of Operations.
d. Expense Limitation Agreement
The Adviser has entered into an Expense Limitation Agreement with the Fund whereby, until at least June 30, 2025, the Adviser has agreed to waive fees that it would otherwise be paid, and/or to assume expenses of the Fund (a “Waiver”), if required to ensure its total annual expenses (excluding taxes, interest, brokerage commissions, certain transaction related expenses arising out of investments made by the Fund, the Incentive Fee, and any acquired fund fees and expenses as determined in accordance with SEC Form N-2, expenses incurred in connection with any merger or reorganization, and extraordinary expenses, such as litigation expenses) do not exceed 2.95%, 2.25% and 2.50% of the average monthly net assets of Class A Shares, Class I Shares and Class D Shares, respectively (the “Expense Limit”). Because taxes, leverage interest, brokerage commissions, certain transaction related expenses arising out of investments made by the Fund, the Incentive Fee, acquired fund fees and expenses, expenses incurred in connection with any merger or reorganization, and extraordinary expenses are excluded from the Expense Limit, total annual expenses of the Fund (after fee waivers and expense reimbursements) are expected to exceed 2.95%, 2.25% and 2.50% for the Class A Shares, Class I Shares and Class D Shares, respectively. The Expense Limitation Agreement
29
|
Constitution Capital Access Fund, LLC |
|
Notes to Consolidated Financial Statements (Continued) March 31, 2025 |
|
Note 5 – Investment Management Services and Other Agreements (continued) |
automatically renews for consecutive one-year terms unless terminated by the Fund or Adviser. For the year ended March 31, 2025, the total amount of expenses that were reimbursed by the Adviser under the terms of the Expense Limitation Agreement was $0.
For a period not to exceed three years from the date on which a Waiver is made, the Adviser may recoup amounts waived or assumed, provided it is able to effect such recoupment and remain in compliance with the Expense Limit. Any recoupment would be limited to the lesser of (1) the expense limitation in effect at the time of waiver, or (2) the expense limitation in effect at the time of recoupment. For the year ended March 31, 2025, the total amount of waived fees that are subject to recoupment are $0.
e. Distribution Agreement
Foreside Financial Services, LLC serves as the Fund’s distributor (the “Distributor”) pursuant to a distribution agreement. The Distributor distributes the Shares of the Fund on a best-effort basis.
The Fund has adopted a Distribution and Service Plan in compliance with Rule 12b-1 of the Investment Company Act for Class A Shares and Class D Shares (the “Distribution Plan”) which allows the Fund to pay distribution fees for the sale and distribution of its Class A Shares and Class D Shares.
Under the Distribution Plan, the Fund may pay as compensation up to 0.70% on an annualized basis of the Fund’s net asset value attributable to Class A Shares and up to 0.25% on an annualized basis of the Fund’s net asset value attributable to Class D Shares (each, a “Distribution Fee”) to the Fund’s Distributor or other qualified recipients. Payment of the Distribution Fee will be governed by the Distribution Plan for Class A Shares and Class D Shares. The Distribution Fee will be paid out of the Fund’s assets and decreases the net profits or increases the net losses of the Fund solely with respect to Class A Shares and Class D Shares. Class I Shares are not subject to a distribution fee.
For the year ended March 31, 2025, Distribution Fees totaled $886 and are shown on the Consolidated Statement of Operations.
f. Board Fees
In consideration of the services rendered by each independent member of the Board (each, an “Independent Manager”), the Fund has agreed to compensate each Independent Manager with an annual retainer fee of $50,000. In addition, the Fund reimburses the expenses of the Independent Managers in connection with their services. Board fees and expenses incurred for the year ended March 31, 2025 totaled $315,051 and are included in the Consolidated Statement of Operations. Independent Managers do not receive any pension or retirement benefits from the Fund.
g. Administration and Custody Agreements
The Fund’s fund accountant, transfer agent and administrator is UMB Fund Services, Inc. (the “Administrator”). Under the terms of the Administration, Fund Accounting, and Recordkeeping Agreement, the Administrator is responsible for calculating the NAV of the Fund and providing additional administrative services to the Fund.
The Custodian is an affiliate of the Administrator and is responsible for holding the Fund’s assets and providing for their safekeeping under the terms of a Custody Agreement.
The fees incurred by the Fund for administrative and custodian services for the year ended March 31, 2025 totaled $1,057,426, and are reported on the Consolidated Statement of Operations.
h. Compliance Services Agreements
Vigilant Compliance, LLC provides compliance services and a chief compliance officer (“CCO”) to the Fund. The Fund’s allocated fees incurred for CCO services for the year ended March 31, 2025 totaled $79,472, and are reported on the Consolidated Statement of Operations.
30
|
Constitution Capital Access Fund, LLC |
|
Notes to Consolidated Financial Statements (Continued) March 31, 2025 |
Note 6 – Distributions/Allocation of Shareholders Capital
Because the Fund intends to qualify annually as a Regulated Investment Company under the Code, the Fund intends to distribute at least 90% of its annual net taxable income and capital gains to its Shareholders. Nevertheless, there can be no assurance that the Fund will pay distributions to Shareholders at any particular rate. From time to time, the Fund may also pay special interim distributions in the form of cash or Shares at the discretion of the Board. Unless Shareholders elect to receive distributions in the form of cash, the Fund intends to make its ordinary distributions in the form of additional Shares under the dividend reinvestment plan (“DRIP”). Any distributions reinvested under the DRIP will nevertheless remain subject to U.S. federal (and applicable state and local) taxation to Shareholders. Income, expenses, realized and unrealized capital gains and losses of the Fund are allocated on a pro rata basis to each class of shares relative net assets, except for distribution fees which are unique to each class of shares. Refer to Note 15 for further information on distributions made by the Fund.
Note 7 – Share Transactions
Shares will generally be offered for purchase as of the first day of each calendar month, except that Shares may be offered more or less frequently as determined by the Board in its sole discretion.
The Board, from time to time and in its sole discretion, may determine to cause the Fund to offer to repurchase Shares from Shareholders, including the Adviser and its affiliates, pursuant to written tenders by Shareholders. The Adviser anticipates recommending to the Board that, under normal market circumstances, the Fund conduct repurchase offers of no more than 5% of the Fund’s net assets each quarter, on or about each February 28, May 31, August 31, and November 30. The Fund will make repurchase offers, if any, to all holders of Shares. The Fund is entitled to charge an early repurchase fee of 2% with respect to any repurchase of Shares from a Shareholder if the interval between the date of purchase of the Shares and the valuation date with respect to the repurchase of those shares is less than one year.
Class A Shares will be subject to a sales charge of up to 3.50% while Class D and Class I Shares will not be subject to any initial sales charge. The Class A sales charge is assessed outside of the Fund by the Distributor and paid directly by Shareholders. For some investors, the sales charge may be waived or reduced.
Transactions in Shares were as follows:
|
For the |
For the |
|||||||||||||
|
Shares |
Amounts |
Shares |
Amounts |
|||||||||||
|
Class A Shares |
|
|
|
|
|
|
||||||||
|
Reinvestment of distributions |
—* |
|
$ |
1 |
|
—* |
|
$ |
1 |
|
||||
|
Net increase (decrease) |
—* |
|
$ |
1 |
|
—* |
|
$ |
1 |
|
||||
|
Class D Shares |
|
|
|
|
|
|
||||||||
|
Proceeds from shares issued |
43,887 |
|
$ |
485,000 |
|
20,452 |
|
$ |
225,000 |
|
||||
|
Reinvestment of distributions |
672 |
|
|
7,609 |
|
109 |
|
|
1,178 |
|
||||
|
Exchange of shares |
(41,748 |
) |
|
(488,092 |
) |
(11,245 |
) |
|
(125,000 |
) |
||||
|
Net increase (decrease) |
2,811 |
|
$ |
4,517 |
|
9,316 |
|
$ |
101,178 |
|
||||
|
Class I Shares |
|
|
|
|
|
|
||||||||
|
Proceeds from shares issued |
7,341,288 |
|
$ |
83,395,498 |
|
2,348,104 |
|
$ |
25,639,652 |
|
||||
|
Reinvestment of distributions |
3,233,931 |
|
|
36,716,436 |
|
2,555,071 |
|
|
27,636,156 |
|
||||
|
Exchange of shares |
41,671 |
|
|
488,092 |
|
11,243 |
|
|
125,000 |
|
||||
|
Repurchase of shares |
(6,201,281 |
) |
|
(71,073,583 |
) |
(3,254,326 |
) |
|
(36,713,664 |
) |
||||
|
Net increase (decrease) |
4,415,609 |
|
$ |
49,526,443 |
|
1,660,092 |
|
$ |
16,687,144 |
|
||||
* Amount represents less than 0.05 shares.
31
|
Constitution Capital Access Fund, LLC |
|
Notes to Consolidated Financial Statements (Continued) March 31, 2025 |
Note 8 – Affiliated Investments
Under Section 2(a)(3) of the Investment Company Act, a portfolio company is defined as “affiliated” with the Fund if the Fund owns five percent or more of its outstanding voting securities. As of March 31, 2025, the Fund did not hold any affiliated investments.
Note 9 – Related Party Transactions
The Adviser is an affiliate of the Fund. As of March 31, 2025, amounts owed to related parties of the Fund totaled of $41,913 and represented various fund expenses that were paid by the Adviser on behalf of the Fund, such as filing fees and investment related expenses. Amounts due to the Adviser are included on the Consolidated Statement of Assets and Liabilities.
Note 10 – Investment Transactions
Total purchases of Private Assets, excluding payable for investments not yet funded, for the year ended March 31, 2025 amounted to $118,121,637. Total distribution proceeds from sale, redemption, or other disposition of investments, excluding Short-Term Investments, for the year ended March 31, 2025 amounted to $3,695,176.
Note 11 – Indemnification
In the normal course of business, the Fund may enter into contracts that provide general indemnification. The Fund’s maximum exposure under these agreements is dependent on future claims that may be made against the Fund under such agreements, and therefore cannot be established; however, based on the Adviser’s experience, the risk of loss from such claims is considered remote.
Note 12 –
a. Investment Risk
An investment in the Fund involves significant risks that should be carefully considered prior to investing and should only be considered by persons financially able to maintain their investment and who can afford a loss of a substantial part or all of such investment. The Fund invests substantially all of its available capital in Direct Investments and Investment Funds, which are expected to be valued at fair value. Typically, Direct Investments and Investment Funds are illiquid securities that are not traded in public markets and are subject to substantial holding periods, so that the Fund may not be able to resell some of its holdings for extended periods, which may be several years. The Fund may have a concentration of Direct Investments and Investment Funds in a particular industry or sector. Investment performance of the sector may have a significant impact on the performance of the Fund. The Fund’s investments are also subject to the risk associated with investing in private securities. Investments in private securities are illiquid and can be subject to various restrictions on resale, and there is no assurance that the Fund will be able to realize the value of such investments in a timely manner. Except where a market exists for the securities in which the Fund is directly or indirectly invested, the valuations of the Fund’s investments are estimated. Certain factors that may be considered by the Adviser in determining fair value of the Direct Investments and Investment Funds include financial comparisons to a selection of comparable companies that are publicly traded, discounted cash flows, market conditions within the sectors that they do business, and other relevant factors. Such valuations are inherently uncertain and often reflect the most recent information received by the Adviser about the Direct Investments and Fund Investments, which may be on a lagged or estimated basis. As a consequence, those valuations may differ from the valuations that would have been used had a ready market for the securities existed, and the differences could be material. The Fund’s fair value determinations could therefore cause the Fund’s net asset value as of a valuation date to differ materially from what it would have been had such information been fully incorporated and may result in investors who purchased shares receiving more or less shares and investors who tender their shares receiving more or less cash proceeds than they otherwise would have received.
32
|
Constitution Capital Access Fund, LLC |
|
Notes to Consolidated Financial Statements (Continued) March 31, 2025 |
|
Note 12 – Risk Factors (continued) |
b. Liquidity Risk
Investments in Shares provide limited liquidity. It is currently intended that Shareholders will be able to redeem Shares only through quarterly offers by the Fund to purchase a limited number of Shares. Those offers are at the discretion of the Board on the recommendation of the Adviser. Therefore, an investment in the Fund is suitable only for investors who can bear the risks associated with the limited liquidity of Shares and should be viewed as a long-term investment. No guarantee or representation is made that the Fund’s investment objective will be met.
c. Economic Risk
The Fund, either directly or indirectly, may invest in companies that are organized or headquartered or have substantial sales or operations outside of the United States, its territories, and possessions. Such investments may be subject to certain additional risk due to, among other things, potentially unsettled points of applicable governing law, the risks associated with fluctuating currency exchange rates, capital repatriation regulations (as such regulations may be given effect during the term of the Fund or client portfolio), the application of complex U.S. and non-U.S. tax rules to cross-border investments, possible imposition of non-U.S. taxes on investors with respect to the income, and possible non-U.S. tax return filing requirements. The foregoing factors may increase transaction costs and adversely affect the value of the Fund’s Private Assets.
Furthermore, there have been ongoing negotiations which may result in significant changes to trade policies and treaties between the United States and other countries, and may involve tariffs being enforced by the United States on goods imported from other countries. The outcome of these negotiations, while currently uncertain, may have a negative impact on global economic conditions and may impact trade between other countries and the United States. These factors could restrict access to customers or suppliers which may result in a negative impact to the business, financial condition, and results of operations of an underlying fund or portfolio company, which in turn, would negatively impact the Fund.
Additional risks of non-U.S. investments include but are not limited to: (a) economic dislocations in the host country; (b) less publicly available information; (c) less well-developed regulatory institutions; and (d) greater difficulty of enforcing legal rights in a non-U.S. jurisdiction. Moreover, non-U.S. investments and companies may not be subject to uniform accounting, auditing and financial reporting standards, practices and requirements comparable to those that apply to U.S. investments and companies. In addition, laws and regulations of foreign countries may impose restrictions that would not exist in the United States and may require financing and structuring alternatives that differ significantly from those customarily used in the United States. No assurance can be given that a change in political or economic climate, or particular legal or regulatory risks, including changes in regulations regarding foreign ownership of assets or repatriation of funds or changes in taxation might not adversely affect an investment by the Fund.
d. Financial Institution Risk
The impairment or failure of one or more banks with whom the Fund transacts may inhibit the Fund’s or an underlying fund or portfolio company’s ability to access depository accounts. In such cases, the Fund may be forced to delay or forgo investments, resulting in lower Fund performance. In the event of such a failure of a banking institution where the Fund or an underlying fund or portfolio company holds depository accounts, access to such accounts could be restricted and U.S. Federal Deposit Insurance Corporation (“FDIC”) protection may not be available for balances in excess of amounts insured by the FDIC. In such instances, the Fund or an underlying fund or portfolio company may not recover such excess, uninsured amounts.
The failure of certain financial institutions, namely banks, may increase the possibility of a sustained deterioration of financial market liquidity, or illiquidity at clearing, cash management and/or custodial financial institutions. The failure of a bank (or banks) with which the Fund and/or the Fund’s underlying investments have a commercial relationship could adversely affect, among other things, the Fund and/or the Fund’s underlying investments’ ability to pursue key strategic initiatives, including by affecting the Fund’s or an underlying fund’s or portfolio company’s ability to borrow from financial institutions on favorable terms.
33
|
Constitution Capital Access Fund, LLC |
|
Notes to Consolidated Financial Statements (Continued) March 31, 2025 |
|
Note 12 – Risk Factors (continued) |
Additionally, if the sponsor of an underlying fund, or a portfolio company, has a commercial relationship with a bank that has failed or is otherwise distressed, the underlying fund and/or its portfolio companies may experience issues receiving financial support from a sponsor to support its operations or consummate transactions, to the detriment of their business, financial condition and/or results of operations.
e. Derivatives and Hedging Risk
The Fund may seek to hedge against interest rate and currency exchange rate fluctuations and credit risk by using structured financial instruments such as futures, options, swaps and forward contracts, subject to the requirements of the Investment Company Act. Use of structured financial instruments for hedging purposes may present significant risks, including the risk of loss of the amounts invested. Defaults by the other party to a hedging transaction can result in losses in the hedging transaction. Hedging activities also involve the risk of an imperfect correlation between the hedging instrument and the asset being hedged, which could result in losses both on the hedging transaction and on the instrument being hedged. Use of hedging activities may not prevent significant losses and could increase losses. Further, hedging transactions may reduce cash available to pay distributions to Shareholders.
f. Currency Risk
The Fund’s portfolio will include direct and indirect investments in a number of different currencies. Any returns on, and the value of such investments may, therefore, be materially affected by exchange rate fluctuations, local exchange control, limited liquidity of the relevant foreign exchange markets, the convertibility of the currencies in question and/or other factors. A decline in the value of the currencies in which the Private Assets are denominated against the U.S. Dollar may result in a decrease the Fund’s net asset value. The Adviser may or may not elect to hedge the value of investments made by the Fund against currency fluctuations, and even if the Adviser deems hedging appropriate, it may not be possible or practicable to hedge currency risk exposure. Accordingly, the performance of the Fund could be adversely affected by such currency fluctuations.
Note 13 – Control Ownership
The beneficial ownership, either directly or indirectly, of more than twenty-five percent (25%) of the voting securities creates a presumption of control of the Fund, under Section 2(a)(9) of the Investment Company Act. As of March 31, 2025, L8 Investment Holdings, LP holds 84.03% of the outstanding Shares of the Fund. Shareholders owning voting securities in excess of 25% may determine the outcome of any matter affecting and voted on by Shareholders of the Fund. A significant redemption by this shareholder could affect the Fund’s liquidity and the future viability of the Fund.
Note 14 –
On October 1, 2022, the Fund secured a committed multicurrency revolving line of credit (the “Facility”) with Barclays Bank PLC. The Fund anticipates that this Facility will be used primarily for working capital requirements and for financing investments and funding associated costs and expenses. Borrowings in U.S. Dollars under this Facility will be charged a rate of interest per annum that is the aggregate of the applicable margin of 2.85% and 3-month Term secured overnight financing rate (“SOFR”), or Daily Simple Risk-Free Reference Rate (“RFR”) for loans denominated in Great British Pounds or in Swiss Francs, or Euro Interbank Offered Rate (“EURIBOR”) for loans denominated in Euros.
A summary of the key terms of the Facility as of March 31, 2025 are as follows:
| Maximum Principal Amount Available | $ | | |
| Maturity Date |
| October 1, 2027 | |
| Commitment fee on undrawn principal amount |
| 0.75% per annum | |
| Annual upfront fee |
| 0.20% per annum |
34
|
Constitution Capital Access Fund, LLC |
|
Notes to Consolidated Financial Statements (Continued) March 31, 2025 |
|
Note 14 – Line of Credit (continued) |
In addition, the Fund pays a minimum usage fee of 2.10% which is applied to the minimum usage amount less any utilization.
For the year ended March 31, 2025, loan issuance costs and upfront fees of $335,030 are disclosed as an asset amortized over the life of the facility on the Consolidated Statement of Assets and Liabilities and expensed monthly on the Consolidated Statement of Operations as Line of Credit Fees and Expenses.
The average interest rate, average daily loan balance, maximum outstanding and amount recorded as interest expense for the 365 days the Fund had outstanding borrowings were 8.01%, $33,836,634, $61,551,018, and $2,690,468, respectively. As of March 31, 2025 the Fund had $58,551,018 of outstanding borrowings.
Note 15 – Tax Information
The Fund’s tax year end is September 30. The Fund has temporary differences primarily due to timing of the amortization of organizational and offering costs and differences between book and tax treatment of partnership investments.
As of September 30, 2024, the Fund had a permanent book to tax difference of $14,962,665 resulting primarily from book to tax cost differences related to underlying partnership investments. This permanent book to tax difference has been reclassified to paid-in capital and has no effect on the net assets or net asset value per share of the Fund.
For the tax year ended September 30, 2024, the Fund’s tax components of distributable earnings/(deficit) on a tax basis are as follows:
|
Undistributed ordinary income |
$ |
— |
|
|
|
Undistributed long-term gains |
|
22,336,455 |
|
|
|
Accumulated earnings |
|
22,336,455 |
|
|
|
|
|
|||
|
Late year loss carryforward |
|
(1,480,115 |
) |
|
|
Other book/tax differences |
|
(7,805,759 |
) |
|
|
Unrealized appreciation/(depreciation) |
|
204,295,765 |
|
|
|
Total accumulated earnings/(deficits) |
$ |
217,346,346 |
|
The difference between book basis and tax basis accumulated ordinary income/(loss) and other book/tax differences are primarily attributable to timing differences in recognizing certain gains and losses in security transactions.
The tax character of distributions paid during the Fund’s tax years ending September 30, 2025 and September 30, 2024 were as follows:
|
Tax Year |
Tax Year |
|||
|
Ordinary income |
$ |
— |
$ |
5,511,614 |
|
Net long term capital gains |
39,366,165 |
22,207,164 |
||
|
Total distributions paid |
$ |
39,366,165 |
$ |
27,718,778 |
35
|
Constitution Capital Access Fund, LLC |
|
Notes to Consolidated Financial Statements (Continued) March 31, 2025 |
|
Note 15 – Tax Information (continued) |
As of March 31, 2025, the federal tax cost of investments and unrealized appreciation (depreciation) are as follows:
|
Tax cost of investments |
$ |
603,727,812 |
|
|
|
|
|
|||
|
Gross unrealized appreciation |
$ |
297,774,713 |
|
|
|
Gross unrealized depreciation |
|
(106,786,035 |
) |
|
|
Net unrealized appreciation on investments |
$ |
190,888,678 |
|
The Blocker is a domestic limited liability company that has elected to be treated as a C-corporation for federal and state income tax purposes and is required to account for its estimate of income taxes. The estimated provision for income taxes attributable to the Blocker for the year ended March 31, 2025 consists of the following:
|
Current: |
|
|
||
|
Federal |
$ |
352,680 |
|
|
|
State |
|
107,198 |
|
|
|
Total |
|
459,878 |
|
|
|
|
|
|||
|
Deferred: |
|
|
||
|
Federal |
$ |
(210,793 |
) |
|
|
State |
|
(56,717 |
) |
|
|
Total |
$ |
(267,510 |
) |
|
|
|
|
|||
|
Estimated provision for income taxes |
$ |
192,368 |
|
As of March 31, 2025, the deferred tax liability is attributable to the temporary differences between the treatment of net unrealized gains on Private Assets on a book and tax basis.
Total income tax expense/(benefit) (current and deferred) differs from the amount computed by applying the federal statutory income tax rate of 21% to net investment income and realized and unrealized gain/(loss) on investments before taxes as follows:
|
Income taxes at statutory rate |
$ |
148,323 |
|
|
State income taxes |
|
33,478 |
|
|
Book to tax period adjustments |
|
10,567 |
|
|
Estimated provision for income taxes |
$ |
192,368 |
Note 16 – Subsequent Events
Management has evaluated the impact of all subsequent events on the Fund. Subscriptions into the Fund for April 1, 2025 and May 1, 2025 equaled $0, $0 and $10,410,112 for Class A Shares, Class D Shares, and Class I Shares, and $0, $200,000, and $8,925,700 for Class A Shares, Class D Shares, and Class I Shares, respectively.
The Fund commenced a tender offer as follows:
|
Commencement Date |
|
April 4, 2025 |
|
|
Expiration Date |
|
May 1, 2025 |
|
|
Valuation Date |
|
May 30, 2025 |
|
|
Requested estimated value of tenders based on March 31, 2025 NAV per share |
$ |
20,103,542 |
There have been no other subsequent events that occurred during such period that would require disclosure or would be required to be recognized in the financial statements.
36
|
INDEPENDENT MANAGERS |
||||
|
NAME, ADDRESS |
POSITION(S) |
TERM OF |
PRINCIPAL |
NUMBER OF |
|
Richard Kracum |
Independent Manager; Nominating Committee Chairperson |
Since |
Retired (2020 – Present); Co-Founder, Wind Point Partners (Private equity firm) (1985 – 2020). Current Directorships: Nelson Global Products; Taylor-Wharton International; B & W Communications, LLC; ANDE Corporation; Carleton College |
1 |
|
J. Michael Fields |
Independent Manager |
Since |
Chief Operating Officer, The Strategic Group Current Directorships: Redwood Private Real Estate Debt Fund; Equi Multi-Strategy Fund |
1 |
|
Kevin T. McMenimen |
Independent Manager |
Since |
Chief Financial Officer, American Seafoods (November 2017 – Present) |
1 |
|
Kristen M. Leopold |
Independent Manager; Audit Committee Chairperson |
Since |
Chief Financial Officer; WFL Real Estate Services, LLC (Through April 2022) Current Directorships: Macquarie Asset Management/Central Park Group Funds (10 portfolios) Blackstone Alternative Investment Fund (1 portfolio); SEG Partners Long/Short Equity Fund; Blackstone Private Real Estate Credit and Income Fund |
1 |
_______________________
* Each Manager serves an indefinite term, until his or her successor is elected.
** Includes any company with a class of securities registered pursuant to Section 12 of the Exchange Act of 1934, as amended (the “Exchange Act”) or subject to the requirements of Section 15(d) of the Exchange Act or any company registered under the Investment Company Act.
*** The Fund Complex consists of the Fund.
37
|
Constitution Capital Access Fund, LLC |
|
Fund Management (Continued) March 31, 2025 (Unaudited) |
|
INTERESTED MANAGERS AND OFFICERS |
||||
|
NAME, ADDRESS |
POSITION(S) |
TERM OF |
PRINCIPAL |
NUMBER OF |
|
Daniel M. Cahill |
Chairman, President and Interested Manager1 |
Interested Manager Since Inception, Chairman and President Since June 2024. |
Chief Executive Officer/ Co-Founder, Constitution Capital Partners, LLC (2024 – present); Managing Partner/Co-Founder, Constitution Capital Partners, LLC (2008 – 2024) |
1 |
|
Rob Hatch |
Interested Manager1 |
Since June 2024 |
Managing Partner/Co-Founder, Constitution Capital Partners, LLC (2024 – present); Partner/Co-Founder, Constitution Capital Partners, LLC (2008 – 2024) |
1 |
|
Vicente Ramos |
Interested Manager1 |
Since June 2024 |
Managing Partner/Co-Founder, Constitution Capital Partners, LLC (2024 – present); Partner/Co-Founder, Constitution Capital Partners, LLC (2008 – 2024) |
1 |
|
YooMee Kim |
Treasurer |
Since Inception |
Director of Finance, Constitution Capital Partners, LLC (since 2024). Controller, Constitution Capital Partners, LLC (2020 – 2024). Assistant Controller, Capital Crossing Servicing Company (2015 – 2020) |
1 |
|
Chris Faucher |
Secretary |
Since June 2024 |
Principal, Constitution Capital Partners, LLC (since 2023); Vice President, Constitution Capital Partners, LLC (2019 – 2023) |
1 |
|
Fred Teufel |
Chief Compliance Officer |
Since Inception |
Director, Vigilant Compliance Services |
1 |
_______________________
* Each Manager serves an indefinite term, until his or her successor is elected.
** Includes any company with a class of securities registered pursuant to Section 12 of the Exchange Act or subject to the requirements of Section 15(d) of the Exchange Act or any company registered under the Investment Company Act.
*** The Fund Complex consists of the Fund.
(1) Messrs. Cahill, Hatch and Ramos are deemed an “interested person” of the Fund due to each of their positions as a Managing Partner of the Adviser.
38
Proxy Voting
The Fund is required to file Form N-PX, with its complete proxy voting record for the twelve months ended June 30, no later than August 31. The Fund’s Form N-PX filing is available: (i) without charge, upon request, by calling 1-855-551-2276 or (ii) by visiting the SEC’s website at www.sec.gov.
Availability of Quarterly Portfolio Schedules
The Fund files its complete schedule of portfolio holdings with the SEC for the first and third quarters of each fiscal year as an exhibit to its reports on Form N-PORT. The Fund’s Forms N-PORT are available on the SEC’s website at www.sec.gov.
39
|
FACTS |
WHAT DOES THE FUND DO WITH YOUR PERSONAL INFORMATION? |
|
Why? |
Financial companies choose how they share your personal information. Federal law gives consumers the right to limit some but not all sharing. Federal law also requires us to tell you how we collect, share, and protect your personal information. Please read this notice carefully to understand what we do. |
|
What? |
The types of personal information we collect and share depend on the product or service you have with us. This information can include: • Social Security number • Account balances • Account transactions • Transaction history • Wire transfer instructions • Checking account information When you are no longer our customer, we continue to share your information as described in this notice. |
|
How? |
All financial companies need to share customers’ personal information to run their everyday business. In the section below, we list the reasons financial companies can share their customers’ personal information; the reasons funds choose to share; and whether you can limit this sharing. |
|
Reasons we can share your personal information |
Does the |
Can you limit |
|
For our everyday business purposes – such as to process your transactions, maintain your account(s), respond to court orders and legal investigations, or report to credit bureaus |
Yes |
No |
|
For our marketing purposes – to offer our products and services to you |
No |
We don’t share |
|
For joint marketing with other financial companies |
No |
We don’t share |
|
For our affiliates’ everyday business purposes – information about your transactions and experiences |
Yes |
No |
|
For our affiliates’ everyday business purposes – information about your creditworthiness |
No |
We don’t share |
|
For our affiliates to market to you |
No |
We don’t share |
|
For nonaffiliates to market to you |
No |
We don’t share |
|
Questions? |
Call 1-877-779-1999 |
40
|
Constitution Capital Access Fund, LLC |
|
Privacy Policy (Continued) March 31, 2025 (Unaudited) |
|
What we do |
|
|
How does the Fund protect my personal information? |
To protect your personal information from unauthorized access and use, we use security measures that comply with federal law. These measures include computer safeguards and secured files and buildings. |
|
How does the Fund collect my personal information? |
We collect your personal information, for example, when you • Open an account • Provide account information • Give us your contact information • Make a wire transfer • Tell us where to send the money We also collect your information from others, such as credit bureaus, affiliates, or other companies. |
|
Why can’t I limit all sharing? |
Federal law gives you the right to limit only • Sharing for affiliates’ everyday business purposes – information about your creditworthiness • Affiliates from using your information to market to you • Sharing for nonaffiliates to market to you State laws and individual companies may give you additional rights to limit sharing. |
|
Definitions |
|
|
Affiliates |
Companies related by common ownership or control. They can be financial and nonfinancial companies. Our affiliates include companies such as Constitution Capital PM, LP, Constitution Capital Partners, LLC, Constitution Capital Equity Partners, LLC and Constitution Capital Credit Partners, LLC. |
|
Nonaffiliates |
Companies not related by common ownership or control. They can be financial and nonfinancial companies. The Fund doesn’t share with non-affiliates so they can market to you. |
|
Joint marketing |
A formal agreement between nonaffiliated financial companies that together market financial products or services to you. The Fund doesn’t jointly market. |
41
Investment Adviser
Constitution Capital PM, LP
300 Brickstone Square, 7th Floor
Andover, MA 01810
Custodian
UMB Bank, n.a.
928 Grand Boulevard, 5th Floor
Kansas City, Missouri 64106
Administrator, Transfer Agent, and Accountant
UMB Fund Services, Inc.
235 W. Galena Street
Milwaukee, WI 53212-3949
Distributor
Foreside Financial Services, LLC
3 Canal Plaza, Suite 100
Portland, Maine 04101
Independent Registered Public Accounting Firm
PricewaterhouseCoopers LLP
101 Seaport Boulevard, Suite 500
Boston, MA 02210
(b) Not applicable.
ITEM 2. CODE OF ETHICS.
(a) The registrant, as of the end of the period covered by this report, has adopted a code of ethics that applies to the registrant’s principal executive officer, principal financial officer, principal accounting officer or controller, or persons performing similar functions, regardless of whether these individuals are employed by the registrant or a third party.
(b) The registrant’s code of ethics are written standards that are reasonably designed to deter wrongdoing and to promote: (1) Honest and ethical conduct, including the ethical handling of actual or apparent conflicts of interest between personal and professional relationships; (2) Full, fair, accurate, timely, and understandable disclosure in reports and documents that a registrant files with, or submits to, the Commission and in other public communications made by the registrant; (3) Compliance with applicable governmental laws, rules, and regulations; (4) The prompt internal reporting of violations of the code to an appropriate person or persons identified in the code; and (5) Accountability for adherence to the code.
(c) There have been no amendments, during the period covered by this report, to a provision of the code of ethics that applies to the registrant’s principal executive officer, principal financial officer, principal accounting officer or controller, or persons performing similar functions, regardless of whether these individuals are employed by the registrant or a third party, and that relates to any element of the code of ethics description.
(d) The registrant has not granted any waivers, during the period covered by this report, including an implicit waiver, from a provision of the code of ethics that applies to the registrant’s principal executive officer, principal financial officer, principal accounting officer or controller, or persons performing similar functions, regardless of whether these individuals are employed by the registrant or a third party, that relates to one or more of the items set forth in paragraph (b) of this item’s instructions.
(e) Not applicable
(f) The registrant’s code of ethics is attached as Exhibit (a)(1) to this Form N-CSR.
ITEM 3. AUDIT COMMITTEE FINANCIAL EXPERT.
As of the end of the period covered by the report, the registrant’s board of managers has determined that Ms. Kristen Leopold, Mr. Kevin McMenimen, and Mr. J. Michael Fields are qualified to serve as the audit committee financial experts serving on its audit committee and that they are “independent,” as defined by Item 3 of Form N-CSR.
ITEM 4. PRINCIPAL ACCOUNTANT FEES AND SERVICES.
(a) The aggregate fees billed for the fiscal year ended March 31, 2025 and the fiscal year ended March 31, 2024 for professional services rendered by the principal accountant for the audit of the registrant’s annual financial statements or services that are normally provided by the accountant in connection with statutory and regulatory filings or engagements for that fiscal year or fiscal period, as applicable, are $237,195 and $225,000, respectively.
Audit-Related Fees
(b) The aggregate fees billed for the fiscal year ended March 31, 2025 and the fiscal year ended March 31, 2024 for assurance and related services by the principal accountant that are reasonably related to the performance of the audit of the registrant’s financial statements and are not reported under paragraph (a) of this Item are $0 and $0, respectively.
Tax Fees
(c) The aggregate fees billed for the fiscal year ended March 31, 2025 and the fiscal year ended March 31, 2024 for professional services rendered by the principal accountant for tax compliance, tax advice, and tax planning are $127,500 and $188,500, respectively.
All Other Fees
(d) The aggregate fees billed for the fiscal year ended March 31, 2025 and the fiscal year ended March 31, 2024 for products and services provided by the principal accountant, other than the services reported in paragraphs (a) through (c) of this Item are $0 and $0, respectively.
(e)(1) The Registrant’s Audit Committee must pre-approve the audit and non-audit services of the Auditors prior to the Auditor’s engagement.
(e)(2) The percentage of services described in each of paragraphs (b) through (d) of this Item that were approved by the audit committee pursuant to paragraph (c)(7)(i)(C) of Rule 2-01 of Regulation S-X are as follows:
(b) 0%
(c) 100%
(d) 0%
(f) The percentage of hours expended on the principal accountant’s engagement to audit the registrant’s financial statements for the most recent fiscal year that were attributed to work performed by persons other than the principal accountant’s full-time, permanent employees was less than fifty percent.
(g) The aggregate non-audit fees billed by the registrant’s accountant for services rendered to the registrant, and rendered to the registrant’s investment adviser (not including any sub-adviser whose role is primarily portfolio management and is subcontracted with or overseen by another investment adviser), and any entity controlling, controlled by, or under common control with the adviser that provides ongoing services to the registrant for the fiscal year ended March 31, 2025 and the fiscal year ended March 31, 2024 of the registrant was $0 and $0, respectively.
(h) The registrant’s audit committee of the board of managers has considered whether the provision of non-audit services that were rendered to the registrant’s investment adviser (not including any sub-adviser whose role is primarily portfolio management and is subcontracted with or overseen by another investment adviser), and any entity controlling, controlled by, or under common control with the investment adviser that provides ongoing services to the registrant that were not pre-approved pursuant to paragraph (c)(7)(ii) of Rule 2-01 of Regulation S-X is compatible with maintaining the principal accountant’s independence.
(i) Not applicable.
(j) Not applicable.
ITEM 5. AUDIT COMMITTEE OF LISTED REGISTRANTS.
Not applicable.
ITEM 6. SCHEDULE OF INVESTMENTS.
(a) Schedule of Investments in securities of unaffiliated issuers as of the close of the reporting period is included as part of the report to shareholders filed under Item 1(a) of this form.
(b) Not applicable.
ITEM 7. FINANCIAL STATEMENTS AND FINANCIAL HIGHLIGHTS FOR OPEN-END MANAGEMENT INVESTMENT COMPANIES.
Not applicable.
ITEM 8. CHANGES IN AND DISAGREEMENTS WITH ACCOUNTANTS FOR OPEN-END MANAGEMENT INVESTMENT COMPANIES.
Not applicable.
ITEM 9. PROXY DISCLOSURES FOR OPEN-END MANAGEMENT INVESTMENT COMPANIES.
Not applicable.
ITEM 10. REMUNERATION PAID TO DIRECTORS, OFFICERS, AND OTHERS OF OPEN-END MANAGEMENT INVESTMENT COMPANIES.
Not applicable.
ITEM 11. STATEMENT REGARDING BASIS FOR APPROVAL OF INVESTMENT ADVISORY CONTRACT.
Not applicable.
ITEM 12. DISCLOSURE OF PROXY VOTING POLICIES AND PROCEDURES FOR CLOSED-END MANAGEMENT INVESTMENT COMPANIES.
Constitution Capital Access Fund, LLC
Proxy Voting Procedures
Purpose:
Shareholders of the Fund expect the Fund to vote proxies received from issuers whose voting securities are held by the Fund. The Fund exercises its voting responsibilities as a fiduciary, with the goal of maximizing the value of the Fund’s and its shareholders’ investments.
Pursuant to the investment advisory agreement between the Fund and the investment adviser providing advisory services to the Fund, the Fund has delegated the authority to vote proxies received by the Fund regarding securities contained in its portfolio to the Adviser.
Policies and Procedures:
The Fund invests primarily in general or limited partnerships, funds, corporations, trusts or other investment vehicles (collectively, “Investment Funds”). While it is unlikely that the Fund will receive notices or proxies from Investment Funds (or in connection with any other portfolio securities), to the extent that the Fund does receive such notices or proxies and the Fund has voting interests in such Investment Funds, the responsibility for decisions regarding proxy voting for securities held by the Fund lies with the Adviser.
The Adviser will vote such proxies in accordance with the Adviser’s proxy policies and procedures. Constitution Capital PM, LP (“Constitution Capital” or the “Adviser”) acts as the adviser to the Constitution Capital Access Fund, LLC (the “Fund”). Rule 206(4)-6 under the Advisers Act requires a registered investment adviser with voting authority over client proxies to adopt proxy voting policies and procedures, including procedures to address material conflicts of interest, and to disclose such procedures and its specific voting history to clients. Accordingly, the Fund incorporates herein and makes a part hereof the Adviser’s proxy voting policies and procedures. These Policies are to be implemented by the Adviser for the Fund. To the extent that these Policies do not cover potential voting issues with respect to proxies received by the Fund, the Adviser shall act on behalf of the Fund to promote the Fund’s investment objectives, subject to the provisions of these Policies.
The Adviser shall periodically inform its employees (i) that they are under an obligation to be aware of the potential for conflicts of interest on the part of the Adviser with respect to voting proxies on behalf of the Fund, both as a result of the employee’s personal relationships and due to circumstances that may arise during the conduct of the Adviser’s business, and (ii) that employees should bring conflicts of interest of which they become aware to the attention of the management of the Adviser.
The Adviser shall be responsible for coordinating the delivery of proxies by the Fund’s custodian to the Adviser or to an agent of the Adviser selected by the Adviser to vote proxies with respect to which the Adviser has such discretion (a “Proxy Voting Service”).
Form N-PX
Rule 30b1-4 under the 1940 Act requires the Fund to file its complete proxy voting record on an annual basis on Form N-PX for the period July 1 of each year to June 30 of the following year. Reports on Form N-PX must be filed no later than August 31 of each year.
Administrator/CCO Responsibility: Form N-PX shall initially be prepared by the Fund’s administrator. The Fund’s administrator shall file the Form N-PX in a timely manner and the Fund’s counsel shall review each such report. The CCO shall review all filings to determine that they were filed in a timely manner.
Adopted: August 2022
Revised: August 15, 2023
ITEM 13. PORTFOLIO MANAGERS OF CLOSED-END MANAGEMENT INVESTMENT COMPANIES.
(a)(1) Identification of Portfolio Manager(s) or Management Team Members and Description of Role of Portfolio Manager(s) or Management Team Members.
The following is biographical information about the members of Constitution Capital PM, LP (the “Investment Adviser”) who are primarily responsible for the day-to-day portfolio management of Constitution Capital Access Fund, LLC as of March 31, 2025:
Daniel M. Cahill | Chief Executive Officer
Prior to co-founding Constitution Capital, Mr. Cahill was Head of Standard Life Investments Private Equity USA. Previously, he was a founding member of Wilton Asset Management, a private equity fund of funds business at State Street Global Advisors. Mr. Cahill started his private equity career at GE Capital’s Corporate Finance Group where he became Vice President and was responsible for originating, structuring and negotiating leveraged buyouts, recapitalizations and growth equity transactions. Mr. Cahill earned his BS in Business Administration from Oswego University, received his MBA from Binghamton University and is a graduate of GE’s Financial Management Program.
Robert M. Hatch | Managing Partner
Mr. Hatch was one of the founding partners of Constitution Capital. Prior to joining Constitution Capital, Mr. Hatch was an Investment Director at Standard Life Investments Private Equity USA. Previously, Mr. Hatch worked at Argo Global Capital, a private equity firm with $475 million under management. Mr. Hatch began his career in the investment banking group of State Street Corporation. Mr. Hatch earned his MBA from The Tuck School of Business at Dartmouth and his undergraduate degree from Harvard University in Applied Mathematics and Statistics, cum laude. Mr. Hatch is a CFA charterholder.
Vicente Miguel T. Ramos | Managing Partner
Mr. Ramos was one of the founding partners of Constitution Capital. Prior to joining Constitution Capital, he was an Investment Director at Standard Life Investments Private Equity USA. Previously, Mr. Ramos worked at Lehman Brothers. Mr. Ramos began his career in the investment banking group at State Street Corporation where he focused on private placements and M&A transactions. Mr. Ramos earned his MBA from The Tuck School of Business at Dartmouth and his undergraduate degree from Dartmouth College where he completed a double major in Economics and Engineering Sciences. Mr. Ramos is a CFA charterholder.
Alexander R. Tatum | Partner
Mr. Tatum was one of the founding members of Constitution Capital. Prior to joining Constitution Capital, Mr. Tatum was an Investment Manager at Standard Life Investments Private Equity USA. Previously, he was a financial analyst with Goldman Sachs. Mr. Tatum began his career with SunTrust Robinson Humphrey as a financial analyst in their investment banking division. Mr. Tatum earned his MBA from The Tuck School of Business at Dartmouth and his undergraduate degree from Bowdoin College where he completed a major in Economics.
Daniel H. Clare | Partner and Head of Credit
Mr. Clare heads the Constitution Capital Credit Partners team. From 2010 to 2016, he was a Managing Director at Ascribe Capital, formerly known as American Securities Opportunities Fund. Previously, he was a Senior Managing Director at Diamond Castle Partners, which he joined alongside other investment professionals from DLJ Merchant Banking Partners. He held prior roles as a management consultant at Bain & Company and in the investment banking division at Goldman Sachs. Mr. Clare earned his MBA from Harvard Business School and his undergraduate degree from Haverford College.
Christopher S. Faucher | Principal
Mr. Faucher is responsible for screening, evaluating, negotiating and monitoring private equity and credit investments. Prior to joining Constitution Capital in November 2015, Mr. Faucher was a Management Consultant at RSM US (formerly McGladrey). Mr. Faucher earned his undergraduate degree from Elon University with a major in Finance and graduated cum laude. Mr. Faucher is a CFA charterholder.
(a)(2) Other Accounts Managed by Portfolio Manager(s) or Management Team Member and Potential Conflicts of Interest
The following table lists the number and types of accounts, other than the Fund, managed by the Fund’s Portfolio Management Team and assets under management in those accounts, as of March 31, 2025.
|
Name of Portfolio |
Number of Other Accounts |
Number of Accounts and |
||||||||||
|
Name |
Registered |
Other pooled |
Other |
Registered |
Other pooled |
Other |
||||||
|
Daniel M. Cahill |
0 |
1 account, |
1 account, |
0 |
18 accounts, |
0 |
||||||
|
Robert M. Hatch |
0 |
1 account, |
1 account, |
0 |
18 accounts, |
0 |
||||||
|
Vicente M. Ramos |
0 |
1 account, |
1 account, |
0 |
18 accounts, |
0 |
||||||
|
Alexander R. Tatum |
0 |
1 account, |
1 account, |
0 |
14 accounts, |
0 |
||||||
|
Daniel H. Clare |
0 |
0 |
0 |
0 |
4 accounts, |
0 |
||||||
|
Christopher S. Faucher |
0 |
0 |
0 |
0 |
0 |
0 |
||||||
Table above represents regulatory assets under management.
Conflicts of Interest
Members of the Portfolio Management Team are involved in the management of other accounts, including proprietary accounts, separate accounts, and other pooled investment vehicles. Members of the Portfolio Management Team may manage separate accounts or other pooled investment vehicles that may have materially higher or different fee arrangements than the Fund and may also be subject to performance-based fees. The side-by-side management of these separate accounts and pooled investment vehicles may raise potential conflicts of interest relating to cross trading and the allocation of investment opportunities.
The Adviser has a fiduciary responsibility to manage all client accounts in a fair and equitable manner. The Adviser seeks to provide best execution of all securities transactions and to allocate investments to client accounts in a fair and reasonable manner. To this end, the Adviser has developed policies and procedures designed to mitigate and manage the potential conflicts of interest that may arise from side-by-side management.
(a)(3) Compensation Structure of Portfolio Manager as of March 31, 2025.
The Adviser is an affiliate of Constitution Capital Partners, LLC. The Adviser has designed its compensation structure to encourage employee retention and alignment of interest with investors. Team members are compensated based on a base salary and an annual performance-based discretionary bonus. All professionals are paid a competitive base salary and discretionary bonus based on performing their investment duties, individual execution, and overall performance of the firm. In addition, eligible employees receive a meaningful amount of carried interest from certain clients of the Adviser’s affiliates, further providing alignment of interests.
(a)(4) Disclosure of Securities Ownership
Portfolio Management Team’s ownership of securities in the Fund
|
Name of Portfolio Management Team Member: |
Dollar Range of Shares Beneficially Owned by Portfolio |
|
|
Daniel M. Cahill |
None |
|
|
Robert M. Hatch |
None |
|
|
Vicente M. Ramos |
$500,001 – $1,000,000 |
|
|
Alexander R. Tatum |
$50,001 – $100,000 |
|
|
Daniel H. Clare |
None |
|
|
Christopher S. Faucher |
$10,001 – $50,000 |
ITEM 14. PURCHASES OF EQUITY SECURITIES BY CLOSED-END MANAGEMENT INVESTMENT COMPANY AND AFFILIATED PURCHASERS.
Not applicable.
ITEM 15. SUBMISSION OF MATTERS TO A VOTE OF SECURITY HOLDERS.
There have been no material changes to the procedures by which the shareholders may recommend nominees to the registrant’s board of managers, where those changes were implemented after the registrant last provided disclosure in response to the requirements of Item 407(c)(2)(iv) of Regulation S-K (17 CFR 229.407), or this Item.
ITEM 16. CONTROLS AND PROCEDURES.
(a) The registrant’s principal executive and principal financial officers, or persons performing similar functions, have concluded that the registrant’s disclosure controls and procedures (as defined in Rule 30a-3(c) under the Investment Company Act of 1940, as amended (the “1940 Act”) (17 CFR 270.30a-3(c))) are effective, as of a date within 90 days of the filing date of the report that includes the disclosure required by this paragraph, based on their evaluation of these controls and procedures required by Rule 30a-3(b) under the 1940 Act (17 CFR 270.30a-3(b)) and Rules 13a-15(b) or 15d-15(b) under the Securities Exchange Act of 1934, as amended (17 CFR 240.13a-15(b) or 240.15d-15(b)).
(b) There were no changes in the registrant’s internal control over financial reporting (as defined in Rule 30a-3(d) under the 1940 Act (17 CFR 270.30a-3(d)) that occurred during the period covered by this report that has materially affected, or is reasonably likely to materially affect, the registrant’s internal control over financial reporting.
ITEM 17. DISCLOSURE OF SECURITIES LENDING ACTIVITIES FOR CLOSED-END MANAGEMENT INVESTMENT COMPANIES.
Not applicable.
ITEM 18. RECOVERY OF ERRONEOUSLY AWARDED COMPENSATION.
(a) Not applicable.
(b) Not applicable.
ITEM 19. EXHIBITS.
|
(a)(1) |
||
|
(a)(2) |
Not applicable. |
|
|
(a)(3) |
||
|
(a)(4) |
There were no written solicitations. |
|
|
(a)(5) |
There is no change to the registrant’s independent public accountant |
|
|
(b) |
SIGNATURES
Pursuant to the requirements of the Securities Exchange Act of 1934 and the Investment Company Act of 1940, the registrant has duly caused this report to be signed on its behalf by the undersigned, thereunto duly authorized.
|
(registrant) |
Constitution Capital Access Fund, LLC |
|
|
By (Signature and Title)* |
/s/ Daniel M. Cahill |
|
|
Daniel M. Cahill, President |
||
|
(Principal Executive Officer) |
||
|
Date: |
June 6, 2025 |
Pursuant to the requirements of the Securities Exchange Act of 1934 and the Investment Company Act of 1940, this report has been signed below by the following persons on behalf of the registrant and in the capacities and on the dates indicated.
|
By (Signature and Title)* |
/s/ Daniel M. Cahill |
|
|
Daniel M. Cahill, President |
||
|
(Principal Executive Officer) |
||
|
Date: |
June 6, 2025 |
|
|
By (Signature and Title)* |
/s/ YooMee Kim |
|
|
YooMee Kim, Treasurer |
||
|
(Principal Financial Officer) |
||
|
Date: |
June 6, 2025 |
____________
* Print the name and title of each signing officer under his or her signature.