Exhibit 99.1
CEMENTOS PACASMAYO S.A.A. ANNOUNCES CONSOLIDATED RESULTS
FOR SECOND QUARTER 2025
Lima, Peru, July 21, 2025 – Cementos Pacasmayo S.A.A. and subsidiaries (NYSE: CPAC; BVL: CPACASC1) (“the Company” or “Pacasmayo”) a leading cement company serving the Peruvian construction industry, announced today its consolidated results for the second quarter (“2Q25”) and the first six months of the year (“6M25”). These results have been prepared in accordance with International Financial Reporting Standards (“IFRS”) and are stated in Soles (S/).
2Q25 FINANCIAL AND OPERATIONAL HIGHLIGHTS:
(All comparisons are to 2Q24, unless otherwise stated)
| ● | Sales volume of cement, concrete and precast increased by 7.1%, mainly due to an increase in bagged cement demand as well as higher sales for infrastructure related projects. |
| ● | Revenues increased by 5.9%, in line with the increased sales volumes mentioned above. |
| ● | Consolidated EBITDA increased 9.0%, reaching S/130.2 million, mainly due to the above-mentioned revenue increase, as well as operational efficiencies. |
| ● | Consolidated EBITDA margin was 26.9%, a 0.8 percentage point increase. |
| ● | Net income was S/ 47.8 million, a 29.9% increase, mainly due to increased operating income, as well as a favorable foreign exchange difference and lower interest payments due to debt amortization. |
6M25 FINANCIAL AND OPERATIONAL HIGHLIGHTS:
(All comparisons are to 6M24, unless otherwise stated)
| ● | Sales volume of cement, concrete and precast increased by 5.5%, mainly due to increased demand of both bagged cement and infrastructure projects. |
| ● | Revenues increased by 5.3%, in line with the increased sales volume. |
| ● | Consolidated EBITDA increased 5.0%, reaching S/264.9 million, mainly due to increased demand, as well as lower costs and operational efficiencies. |
| ● | Consolidated EBITDA margin was 26.9%, in line with the same period of last year. |
| ● | Net income increased by 16.5%, reaching S/ 100.5 million mainly due to higher operating income, as well as the favorable foreign exchange difference and the lower interest payments due to debt amortization as mentioned above |
 |
| 2 |
We invite you to review our historical results by clicking on the underlined titles:
| Financial and Operating Results | ||||||||||||||||||||||||
| 2Q25 | 2Q24 | %Var. | 6M25 | 6M24 | %Var. | |||||||||||||||||||
| Cement, concrete and precast shipments (MT) | 688.2 | 642.8 | 7.1 | % | 1,401.9 | 1,328.5 | 5.5 | % | ||||||||||||||||
| In millions of S/ | ||||||||||||||||||||||||
| Sales of goods | 484.1 | 457.1 | 5.9 | % | 983.3 | 933.6 | 5.3 | % | ||||||||||||||||
| Gross profit | 179.7 | 161.6 | 11.2 | % | 363.1 | 335.5 | 8.2 | % | ||||||||||||||||
| Operating profit | 90.7 | 80.4 | 12.8 | % | 186.4 | 175.4 | 6.3 | % | ||||||||||||||||
| Net income | 47.8 | 36.8 | 29.9 | % | 100.5 | 86.3 | 16.5 | % | ||||||||||||||||
| Consolidated EBITDA | 130.2 | 119.5 | 9.0 | % | 264.9 | 252.3 | 5.0 | % | ||||||||||||||||
| Gross Margin | 37.1 | % | 35.4 | % | 1.7 | pp. | 36.9 | % | 35.9 | % | 1.0 | pp. | ||||||||||||
| Operating Margin | 18.7 | % | 17.6 | % | 1.1 | pp. | 19.0 | % | 18.8 | % | 0.2 | pp. | ||||||||||||
| Net income Margin | 9.9 | % | 8.1 | % | 1.8 | pp. | 10.2 | % | 9.2 | % | 1.0 | pp. | ||||||||||||
| Consolidated EBITDA Margin | 26.9 | % | 26.1 | % | 0.8 | pp. | 26.9 | % | 27.0 | % | -0.1 | pp. | ||||||||||||
| |
| 3 |
MANAGEMENT COMMENTS
During this quarter, we continued to see a solid recovery in cement sales volume, which grew by 7.1%, driven primarily by increased demand for bagged cement and concrete used in infrastructure-related projects. Gross profit rose by 11.2%, reflecting our ongoing efforts to improve cost efficiencies and strengthen profitability. Although operating expenses were higher—mainly due to the one-time first-year bonus included in our recent three-year collective bargaining agreement—we achieved consolidated EBITDA of S/ 130.2 million, representing a 9.0% increase year-over-year.
Despite three decades of sustained economic growth, Peru still faces a significant infrastructure and housing gap. As a leading provider of building solutions, we are deeply aware of our role in addressing this challenge. By delivering high-quality products and services, and staying very close to our clients to attend to their particular needs, we are not only supporting infrastructure development but also contributing to national progress and social well-being. Resilient infrastructure is particularly critical in a context of increasing climate vulnerability, as it provides protection against extreme weather events and enhances the long-term sustainability of communities and cities.
One of the most effective platforms for showcasing the great benefits of concrete and building solutions, while contributing to national development is the “Obras por Impuestos” (Works for Taxes) program. This innovative Peruvian mechanism allows private companies to finance public infrastructure projects in advance of their income tax payments, in exchange for certificates that offset those obligations. As one of the leading contributors to this program, we ensure that critical infrastructure is delivered with quality, durability, and efficiency. The concrete roads we’ve built through this mechanism have already withstood extreme rainfall events such as El Niño and Cyclone Yaku—demonstrating the benefits of concrete, especially in areas with heavy rain, as well as the importance of resilient construction.
In addition, we are using AI-based tools to identify public infrastructure projects within our area of influence. This prospective work, supported by technology, has significantly streamlined and enhanced our project pipeline, enabling our teams to focus on delivering tailored, high-impact building solutions, rather than spending time doing it manually. This shift has supported the continued growth of our concrete and building solutions business.
Finally, as none of these results would be possible without the commitment of our talented team, we would like to briefly highlight that for the seventh consecutive year, we were recognized as the top-ranked cement company in the MERCO Talent index, and we ranked 19th across all industries. We view talent as our greatest competitive advantage, and this recognition reinforces our commitment to attracting and developing the best professionals in the market.
To sum up, this quarter continued to reflect a positive trend in demand, and we are confident this momentum will carry through the remainder of the year. We remain steadfast in our commitment to sustainable development by delivering resilient, high-quality infrastructure that improves connectivity, strengthens climate resilience, and creates lasting value for the people of Northern Peru.
| |
| 4 |
ECONOMIC OVERVIEW 2Q25:
During the second quarter of 2025, the Peruvian economy continued on its recovery path, with GDP growth close to 3.0% year-over-year, driven mainly by construction, agribusiness, and non-traditional exports, according to the Peruvian Central Bank. The outlook for the remainder of the year remains optimistic. Peru’s Central Reserve Bank projects GDP growth of approximately 3.1% for all of 2025, depending on global economic stability.
Agribusiness showed sustained recovery after weather-related disruptions the previous year. Crops such as avocados, blueberries and grapes in the North of Peru achieved good yields. This is particularly relevant considering that agribusiness represents almost a third of formal employment in the North. The level of employment has a direct effect on self-construction demand.
This year, public investment will grow for the second consecutive year and will reach a record level. This will be mainly due to two factors. Firstly, the progress of the projects in charge of the National Infrastructure Authority – previously under the Authority for Reconstruction with Changes –, developed through the “Government to Government” scheme, where a foreign State advises the Peruvian State in the execution of works. These projects include flood prevention works, such as the construction of dams and riverbank defenses mostly located in La Libertad and Lambayeque, as well as new storm drainage systems in Piura and Tumbes.
Secondly, the launch of new public investment projects is expected under the traditional state contracting scheme, as well as through Public Private Partnerships. According to Apoyo Consultoria, the northern zone concentrates the largest number of projects with a value greater than S/ 50 million, whose execution would take place mainly in 2025 and 2026.
Overall, the second quarter reflected an economy that, despite external and internal challenges, continues to consolidate its recovery in a steady and resilient manner.
PERUVIAN CEMENT INDUSTRY OVERVIEW:
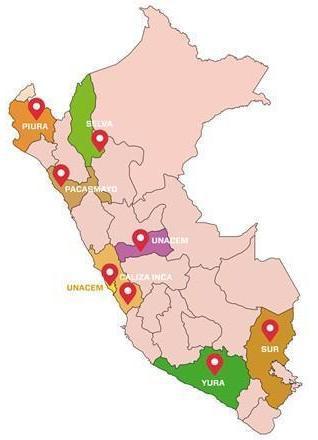
The demand for cement in Peru is covered mainly by Pacasmayo, UNACEM and Cementos Yura, and to a lesser extent by Caliza Inca, Holcim, imports and other small producers. Pacasmayo mainly covers the demand in the northern region of the country, while UNACEM covers the central region and Cementos Yura the southern region region.
The northern region of Peru, according to the Instituto Nacional de Estadística e Informática (INEI) and Apoyo Consultoría, represents approximately 32.9% of the country’s population and 20.0% of national Gross Domestic Product (“GDP”). Despite the country’s sustained growth over the last 10 years, Peru continues to have a significant housing deficit, estimated at 1.7 million households throughout the country as per the Ministry of Housing, Construction and Sanitation (80% qualitative and 20% quantitative deficit).
In Peru, the majority of cement is sold to a highly fragmented consumer base of individuals that tend to gradually buy bags of cement to build or to improve their homes, a segment the industry refers to as “self-construction”.
| |
| 5 |
Northern Region (thousands of metric tons)
| Plant | 2021 | 2022 | 2023 | 2024 | May-25 LTM | % part | ||||||||||||||||||
| Pacasmayo Group | 3,626 | 3,437 | 2,951 | 2,835 | 2,898 | 22.9 | % | |||||||||||||||||
| Imports | 40 | 2 | - | - | - | 0.0 | % | |||||||||||||||||
| Total | 3,666 | 3,439 | 2,951 | 2,835 | 2,898 | 22.9 | % | |||||||||||||||||
Central Region (thousands of metric tons)
| Plant | 2021 | 2022 | 2023 | 2024 | May-25 LTM | % part | ||||||||||||||||||
| UNACEM | 5,838 | 6,297 | 5,617 | 5,462 | 5,418 | 42.7 | % | |||||||||||||||||
| Caliza Inca | 492 | 515 | 585 | 751 | 790 | 6.2 | % | |||||||||||||||||
| Imports | 691 | 202 | 145 | 206 | 301 | 2.4 | % | |||||||||||||||||
| Total | 7,021 | 7,014 | 6,347 | 6,419 | 6,509 | 51.3 | % | |||||||||||||||||
Southern Region (thousands of metric tons)
| Plant | 2021 | 2022 | 2023 | 2024 | May-25 LTM | % part | ||||||||||||||||||
| Grupo Yura | 2,904 | 3,047 | 2,581 | 2,535 | 2,532 | 20.0 | % | |||||||||||||||||
| Imports | 150 | 67 | 65 | 68 | 95 | 0.7 | % | |||||||||||||||||
| Total | 3,054 | 3,114 | 2,646 | 2,603 | 2,627 | 20.7 | % | |||||||||||||||||
| Others | 877 | 427 | 423 | 562 | 648 | 5.1 | % | |||||||||||||||||
| Total, All Region | 14,618 | 13,994 | 12,367 | 12,419 | 12,682 | 100.0 | % | |||||||||||||||||
| * | Import figures are sourced from Aduanet. They represent quantities of imported cement, not shipped cement. |
Source: INEI, Aduanet
| |
| 6 |
OUR STRATEGIC PROGRESS
 |
For the second consecutive year, Cementos Pacasmayo is ranked among the Top 20 in the Merco Talento general ranking. This recognition reaffirms our commitment to the development, well-being, and retention of our people. |

We applied to the Call for Papers of the FICEM 2024 Technical Congress and thanks to this we were able to share with our industry peers strategic projects such as Quality Management 4.0, Talent Management, Pacas Pro and Occupational Safety in the construction of Kiln 4. |
 |
 |
 Climate
Action Climate
Action
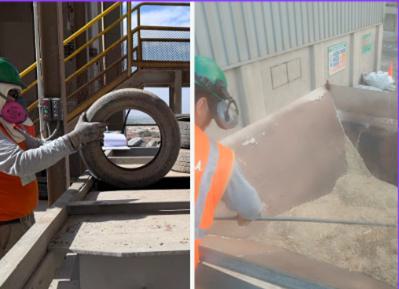
We are currently working on using sugarcane bagasse and end-of-life tires as alternative fuels in our cement production. This initiative aims to reduce fossil fuel consumption and greenhouse gas emissions, while promoting circularity and responsible waste management across our operations. |
For the second consecutive year, Semana Económica has recognized our CEO, Humberto Nadal, as one of the top 5 most profitable CEOs in Peru in 2025. |
 |
| |
| 7 |
OPERATING RESULTS:
Production:
Cement Production Volume
(thousands of metric tons)
| Production | ||||||||||||||||||||||||
| 2Q25 | 2Q24 | %Var. | 6M25 | 6M24 | %Var. | |||||||||||||||||||
| Pacasmayo Plant | 412.1 | 392.4 | 5.0 | % | 842.0 | 786.7 | 7.0 | % | ||||||||||||||||
| Rioja Plant | 77.2 | 74.0 | 4.3 | % | 153.5 | 149.8 | 2.5 | % | ||||||||||||||||
| Piura Plant | 198.9 | 186.2 | 6.8 | % | 408.6 | 379.6 | 7.6 | % | ||||||||||||||||
| Total | 688.2 | 652.6 | 5.5 | % | 1,404.1 | 1,316.1 | 6.7 | % | ||||||||||||||||
Cement production volume at the Pacasmayo plant increased 5.0% in 2Q25 compared to 2Q24 and 7.0% in 6M25 compared to 6M24, mainly to satisfy the increased demand.
In 2Q25, cement production volume at the Rioja plant increased by 4.3% and 2.5% in 6M25, compared to 2Q24 and 6M24 respectively, mainly due to increased demand.
Cement production volume at the Piura Plant increased 6.8% in 2Q25 and 7.6% in 6M25 compared to 2Q24 and 6M24 respectively, mainly due to increased demand.
Total cement production volume increased 5.5% in 2Q25 compared to 2Q24 and 6.7% in 6M25 compared to 6M24, in line with the increased cement demand experienced during this period.
Clinker Production Volume
(thousands of metric tons)
| Production | ||||||||||||||||||||||||
| 2Q25 | 2Q24 | % Var. | 6M25 | 6M24 | % Var. | |||||||||||||||||||
| Pacasmayo Plant | 214.7 | 344.5 | -37.7 | % | 506.8 | 630.1 | -19.6 | % | ||||||||||||||||
| Rioja Plant | 57.8 | 56.7 | 1.9 | % | 114.3 | 114.2 | 0.1 | % | ||||||||||||||||
| Piura Plant | 266.8 | 80.2 | 232.7 | % | 431.7 | 250.2 | 72.5 | % | ||||||||||||||||
| Total | 539.3 | 481.4 | 12.0 | % | 1,052.8 | 994.5 | 5.9 | % | ||||||||||||||||
Clinker production volume at the Pacasmayo plant during 2Q25 decreased 37.7% compared to 2Q24 and 19.6% in 6M25 compared to 6M24, mainly due to scheduled maintenance work performed on our kilns this quarter.
Clinker production volume at the Rioja plant increased 1.9% in 2Q25 compared to 2Q24 and 0.1% in 6M25 compared to 6M24, to satisfy the cement demand this quarter.
Clinker production volume at the Piura plant in 2Q25 increased 232.7% and 72.5% in 6M25 compared to 2Q24 and 6M24 respectively, mainly due to our annual production plan, by which we produce clinker at optimal capacity during certain periods during the year, in order to maximize efficiencies.
Total clinker production volume increased 12.0% in 2Q25 and 5.9% in 6M25, compared to 2Q24 and 6M24 respectively, in line with the increased cement production and demand, as well as some additional production at the Piura plant this quarter as part of the annual plan.
| |
| 8 |
INSTALLED CAPACITY:
Installed Clinker and Cement Capacity
Full year installed cement capacity at the Pacasmayo, Piura and Rioja plants remained stable at 2.9 million MT, 1.6 million MT and 440,000 MT, respectively.
Full year installed clinker capacity at the Pacasmayo, Piura and Rioja plants remained stable at 1.8 million MT, 990,000 MT and 289,080 MT, respectively.
UTILIZATION RATE1:
Pacasmayo Plant Utilization Rate
| Utilization Rate | ||||||||||||||||||||||||
| 2Q25 | 2Q24 | %Var. | 6M25 | 6M24 | %Var. | |||||||||||||||||||
| Cement | 56.8 | % | 54.1 | % | 2.7 | pp. | 58.1 | % | 54.3 | % | 3.8 | pp. | ||||||||||||
| Clinker | 48.9 | % | 76.6 | % | -27.7 | pp. | 57.7 | % | 70.0 | % | -12.3 | pp. | ||||||||||||
Cement production utilization rate at the Pacasmayo plant increased 2.7 and 3.8 percentage points in 2Q25 and in 6M25 respectively, when compared to 2Q24 and 6M24, mainly due to increased production to satisfy demand as mentioned above.
Clinker production utilization rate in 2Q25 decreased 27.7 percentage points compared to 2Q24 and 12.3 percentage points in 6M25 compared to 6M24, mainly due to scheduled maintenance work performed on our kilns this quarter.
Rioja Plant Utilization Rate
| Utilization Rate | ||||||||||||||||||||||||
| 2Q25 | 2Q24 | %Var. | 6M25 | 6M24 | %Var. | |||||||||||||||||||
| Cement | 70.1 | % | 67.3 | % | 2.8 | pp. | 69.8 | % | 68.1 | % | 1.7 | pp. | ||||||||||||
| Clinker | 79.9 | % | 78.2 | % | 1.7 | pp. | 79.0 | % | 78.7 | % | 0.3 | pp. | ||||||||||||
The cement production utilization rate at the Rioja plant was 70.1% in 2Q25 and 69.8% in 6M25; 2.8 and 1.7 percentage points higher than 2Q24 and 6M24 respectively, in line with increased cement demand.
The clinker production utilization rate at the Rioja plant was 79.9% in 2Q25 and 79.0% in 6M25, 1.7 and 0.3 percentage points higher than 2Q24 and 6M24 respectively, mainly due to increased cement demand this quarter.
| 1 | The utilization rates are calculated by dividing production in a given period over installed capacity. The utilization rate implies annualized production, which is calculated by multiplying real production for each quarter by four. |
| |
| 9 |
Piura Plant Utilization Rate
’
| Utilization Rate | ||||||||||||||||||||||||
| 2Q25 | 2Q24 | %Var. | 6M25 | 6M24 | %Var. | |||||||||||||||||||
| Cement | 49.7 | % | 46.6 | % | 3.1 | pp. | 51.1 | % | 47.5 | % | 3.6 | pp. | ||||||||||||
| Clinker | 100.0 | % | 32.4 | % | 67.6 | pp. | 87.2 | % | 50.5 | % | 36.7 | pp. | ||||||||||||
The cement production utilization rate at the Piura plant was 49.7% in 2Q25 and 51.1% in 6M25, a 3.1 and 3.6 percentage point increase when compared to 2Q24 and 6M24 respectively, in line with the increased cement demand.
The clinker production utilization rate at the Piura plant was 100.0% in 2Q25 and 87.2% in 6M25, a 67.6 and 36.7 percentage point increase when compared to 2Q24 and 6M24 respectively, mainly due to our annual production plan, as mentioned above.
Consolidated Utilization Rate
| Utilization Rate | ||||||||||||||||||||||||
| 2Q25 | 2Q24 | %Var. | 6M25 | 6M24 | %Var. | |||||||||||||||||||
| Cement | 55.7 | % | 52.8 | % | 2.9 | pp. | 56.8 | % | 53.3 | % | 3.5 | pp. | ||||||||||||
| Clinker | 71.1 | % | 62.5 | % | 8.6 | pp. | 69.4 | % | 64.6 | % | 4.8 | pp. | ||||||||||||
The consolidated cement production utilization rate was 55.7% in 2Q25 and 56.8% in 6M25, 2.9 and 3.5 percentage points higher than 2Q24 and 6M24 respectively, mainly due to the increased demand.
The consolidated clinker production utilization rate was 71.1% in 2Q25 and 69.4% in 6M25, 8.6 and 4.8 percentage points higher than in 2Q24 and 6M24, mainly to satisfy the increased cement demand, as well as some production for inventory purposes as per our annual production plan.
FINANCIAL RESULTS:
Income Statement:
The following table shows a summary of the Consolidated Financial Results:
Consolidated Financial Results
(in millions of Soles S/)
| Income Statement | ||||||||||||||||||||||||
| 2Q25 | 2Q24 | %Var. | 6M25 | 6M24 | %Var. | |||||||||||||||||||
| Sales of goods | 484.1 | 457.1 | 5.9 | % | 983.3 | 933.6 | 5.3 | % | ||||||||||||||||
| Gross Profit | 179.7 | 161.6 | 11.2 | % | 363.1 | 335.5 | 8.2 | % | ||||||||||||||||
| Total operating expenses, net | -89.0 | -81.2 | 9.6 | % | -176.7 | -160.1 | 10.4 | % | ||||||||||||||||
| Operating Profit | 90.7 | 80.4 | 12.8 | % | 186.4 | 175.4 | 6.3 | % | ||||||||||||||||
| Total other expenses, net | -21.1 | -25.3 | -16.6 | % | -42.8 | -49.7 | -13.9 | % | ||||||||||||||||
| Profit before income tax | 69.6 | 55.1 | 26.3 | % | 143.6 | 125.7 | 14.2 | % | ||||||||||||||||
| Income tax expense | -21.8 | -18.3 | 19.1 | % | -43.1 | -39.4 | 9.4 | % | ||||||||||||||||
| Profit for the period | 47.8 | 36.8 | 29.9 | % | 100.5 | 86.3 | 16.5 | % | ||||||||||||||||
| |
| 10 |
Revenues increased 5.9% and 5.3% in 2Q25 and 6M25, compared to 2Q24 and 6M24 respectively, mainly due to increased sales of concrete, pavement and mortar, as well as of bagged cement. Gross profit increased by 11.2% in 2Q25 and 8.2% in 6M25, compared to 2Q24 and 6M24 respectively, mainly due to lower costs of cement additives, as well as the operational efficiencies derived from our maintenance and production plan. Profit for the period increased by 29.9% in 2Q25 when compared to 2Q24 and 16.5% in 6M25 when compared to 6M24, primarily due to higher operating income as well as a favorable foreign exchange difference resulting from the appreciation of the sol and lower interest payments due to debt amortization.
SALES OF GOODS
The following table shows the Sales of Goods and their respective margins by business segment:
Sales: cement, concrete and precast
(in millions of Soles S/)
| Cement, concrete and precasts | ||||||||||||||||||||||||
| 2Q25 | 2Q24 | %Var. | 6M25 | 6M24 | %Var. | |||||||||||||||||||
| Sales of goods | 469.1 | 439.5 | 6.7 | % | 955.4 | 896.2 | 6.6 | % | ||||||||||||||||
| Cost of Sales | -286.6 | -277.5 | 3.3 | % | -587.4 | -561.1 | 4.7 | % | ||||||||||||||||
| Gross Profit | 182.5 | 162.0 | 12.7 | % | 368.0 | 335.1 | 9.8 | % | ||||||||||||||||
| Gross Margin | 38.9 | % | 36.9 | % | 2.0 | pp. | 38.5 | % | 37.4 | % | 1.1 | pp. | ||||||||||||
Sales of cement, concrete and precast increased 6.7% in 2Q25 and 6.6% in 6M25, when compared to 2Q24 and 6M24 respectively, mainly due increased sales of bagged cement and concrete and pavement. Gross margin increased 2.0 percentage points during 2Q25 and 1.1 percentage points during 6M25, when compared to 2Q24 and 6M24 respectively, mainly due to operational efficiencies in cement production.
Sales: cement
(in millions of Soles S/)
Sales of cement represented 83.7% of cement, concrete and precast sales during 2Q25.
| Cement | ||||||||||||||||||||||||
| 2Q25 | 2Q24 | %Var. | 6M25 | 6M24 | %Var. | |||||||||||||||||||
| Sales of goods | 392.8 | 369.6 | 6.3 | % | 795.0 | 756.8 | 5.0 | % | ||||||||||||||||
| Cost of Sales | -209.3 | -208.8 | 0.2 | % | -424.6 | -426.0 | -0.3 | % | ||||||||||||||||
| Gross Profit | 183.5 | 160.8 | 14.1 | % | 370.4 | 330.8 | 12.0 | % | ||||||||||||||||
| Gross Margin | 46.7 | % | 43.5 | % | 3.2 | pp. | 46.6 | % | 43.7 | % | 2.9 | pp. | ||||||||||||
Sales of cement increased 6.3% in 2Q25 compared to 2Q24 and 5.0% in 6M25 compared to 6M24, mainly due to increased demand for cement bags from the self-construction segment. Gross margin increased 3.2 percentage points in 2Q25 and 2.9 percentage points during 6M25, when compared to 2Q24 and 6M24 respectively mainly due to lower raw material costs and our annual production plan, which aims to produce at optimal capacity during certain periods to maximize efficiency.
| |
| 11 |
Sales: concrete, pavement and mortar
(in millions of Soles S/)
Sales of concrete, pavement and mortar represented 14.6% of cement, concrete, and precast sales during 2Q25.
| Concrete, pavement and mortar | ||||||||||||||||||||||||
| 2Q25 | 2Q24 | %Var. | 6M25 | 6M24 | %Var. | |||||||||||||||||||
| Sales of goods | 68.6 | 62.5 | 9.8 | % | 146.4 | 126.1 | 16.1 | % | ||||||||||||||||
| Cost of Sales | -69.9 | -61.7 | 13.3 | % | -149.2 | -122.4 | 21.9 | % | ||||||||||||||||
| Gross Profit | -1.3 | 0.8 | N/R | -2.8 | 3.7 | N/R | ||||||||||||||||||
| Gross Margin | -1.9 | % | 1.3 | % | -3.2 | pp. | -1.9 | % | 2.9 | % | -4.8 | pp. | ||||||||||||
Sales of concrete, pavement and mortar increased 9.8% during 2Q25 and 16.1% in 6M25 compared to 2Q24 and 6M24 respectively, mainly due to increased sales volume of concrete and pavement for infrastructure projects. Gross margin decreased 3.2 percentage points in 2Q25 compared to 2Q24 and 4.8 percentage points in 6M25 compared to 6M24. This decrease was mainly due to the execution of the Piura airport project. There is a difference in exchange rate between the rate projected in the contract versus the real exchange rate, as well as increased costs related to the execution of the Piura airport project, as it extended over our planned execution period. However, this extension did not imply a breach of contract, as the agreed-upon deadline with the client was not exceeded. We remain confident that developing building solutions is the right path for our company, even if it entails some short-term learning curve additional costs.
Sales: precast
(in millions of Soles S/)
Sales of precast represented 1.6% of cement, concrete, and precast sales during 2Q25.
| Precast | ||||||||||||||||||||||||
| 2Q25 | 2Q24 | %Var. | 6M25 | 6M24 | %Var. | |||||||||||||||||||
| Sales of goods | 7.7 | 7.4 | 4.1 | % | 14.0 | 13.3 | 5.3 | % | ||||||||||||||||
| Cost of Sales | -7.4 | -7.0 | 5.7 | % | -13.6 | -12.7 | 7.1 | % | ||||||||||||||||
| Gross Profit | 0.3 | 0.4 | -25.0 | % | 0.4 | 0.6 | -33.3 | % | ||||||||||||||||
| Gross Margin | 3.9 | % | 5.4 | % | -1.5 | pp. | 2.9 | % | 4.5 | % | -1.6 | pp. | ||||||||||||
During 2Q25, precast sales increased 4.1% compared to 2Q24 and 5.3% in 6M25 compared to 6M24, mainly due to demand from the public sector. However, gross margin in 2Q25 and 6M25 was lower by 1.5 and 1.6 percentage points, respectively, compared to 2Q24 and 6M24.
Sales: Construction Supplies2
(in millions of Soles S/)
| Construction Supplies | ||||||||||||||||||||||||
| 2Q25 | 2Q24 | %Var. | 6M25 | 6M24 | %Var. | |||||||||||||||||||
| Sales of goods | 12.3 | 14.3 | -14.0 | % | 22.3 | 28.0 | -20.4 | % | ||||||||||||||||
| Cost of Sales | -12.2 | -14.0 | -12.9 | % | -21.9 | -27.0 | -18.9 | % | ||||||||||||||||
| Gross Profit | 0.1 | 0.3 | -66.7 | % | 0.4 | 1.0 | -60.0 | % | ||||||||||||||||
| Gross Margin | 0.8 | % | 2.1 | % | -1.3 | pp. | 1.8 | % | 3.6 | % | -1.8 | pp. | ||||||||||||
| 2 | Construction supplies include the following products: steel rebar, wires, nails, corrugated iron, electric conductors, plastic tubes and accessories, among others. |
| |
| 12 |
During 2Q25, construction supply sales decreased 14.0% compared to 2Q24 and 20.4% in 6M25 compared to 6M24, mainly due to the lower sales volume of steel bars, as well as a lower price. Gross margin decreased 1.3 percentage points in 2Q25 when compared to 2Q24 and 1.8 percentage points in 6M25 when compared to 6M24.
OPERATING EXPENSES:
Administrative Expenses
(in millions of Soles S/)
| Administrative Expenses | ||||||||||||||||||||||||
| 2Q25 | 2Q24 | %Var. | 6M25 | 6M24 | %Var. | |||||||||||||||||||
| Personnel expenses | 40.3 | 31.3 | 28.8 | % | 80.8 | 61.1 | 32.2 | % | ||||||||||||||||
| Third-party services | 20.0 | 19.0 | 5.3 | % | 40.0 | 35.0 | 14.3 | % | ||||||||||||||||
| Board of Directors | 1.3 | 1.6 | -18.8 | % | 2.8 | 3.1 | -9.7 | % | ||||||||||||||||
| Depreciation and amortization | 4.2 | 3.1 | 35.5 | % | 8.0 | 8.2 | -2.4 | % | ||||||||||||||||
| Other | 4.5 | 6.8 | -33.8 | % | 8.7 | 11.6 | -25.0 | % | ||||||||||||||||
| Total | 70.3 | 61.8 | 13.8 | % | 140.3 | 119.0 | 17.9 | % | ||||||||||||||||
Administrative expenses increased 13.8% in 2Q25 and 17.9% in 6M25 compared to 2Q24 and 6M24 respectively, mainly due to increased personnel expenses resulting from the collective bargaining negotiations with our labor unions, which is negotiated every three years and has a closing bonus during the first year.
Selling Expenses
(in millions of Soles S/)
| Selling and distribution expenses | ||||||||||||||||||||||||
| 2Q25 | 2Q24 | %Var. | 6M25 | 6M24 | %Var. | |||||||||||||||||||
| Personnel expenses | 11.7 | 10.9 | 7.3 | % | 23.4 | 22.3 | 4.9 | % | ||||||||||||||||
| Advertising and promotion | 4.2 | 2.0 | N/R | 9.3 | 4.2 | N/R | ||||||||||||||||||
| Third party services | 2.4 | 2.3 | 4.3 | % | 4.0 | 4.1 | -2.4 | % | ||||||||||||||||
| Other | 4.1 | 2.3 | 78.3 | % | 8.4 | 6.0 | 40.0 | % | ||||||||||||||||
| Total | 22.4 | 17.5 | 28.0 | % | 45.1 | 36.6 | 23.2 | % | ||||||||||||||||
Selling expenses increased 28.0% and 23.2% in 2Q25 and 6M25, compared to 2Q24 and 6M24 respectively, mainly due to increased advertising and promotion expenses, as well as the previously mentioned union bonus.
| |
| 13 |
EBITDA RECONCILIATION:
Consolidated EBITDA
(in millions of Soles S/)
| Consolidated EBITDA | ||||||||||||||||||||||||
| 2Q25 | 2Q24 | %Var. | 6M25 | 6M24 | %Var. | |||||||||||||||||||
| Net Income | 47.8 | 36.8 | 29.9 | % | 100.5 | 86.3 | 16.5 | % | ||||||||||||||||
| + Income tax expense | 21.8 | 18.3 | 19.1 | % | 43.1 | 39.4 | 9.4 | % | ||||||||||||||||
| - Finance income | -0.6 | -1.3 | -53.8 | % | -1.2 | -2.6 | -53.8 | % | ||||||||||||||||
| + Financial expenses | 22.7 | 25.2 | -9.9 | % | 45.8 | 50.9 | -10.0 | % | ||||||||||||||||
| +/- Net loss from exchange rate | -1.1 | 1.5 | -173.3 | % | -1.9 | 1.5 | -226.7 | % | ||||||||||||||||
| + Depreciation and amortization | 39.6 | 39.0 | 1.5 | % | 78.6 | 76.8 | 2.3 | % | ||||||||||||||||
| Consolidated EBITDA | 130.2 | 119.5 | 9.0 | % | 264.9 | 252.3 | 5.0 | % | ||||||||||||||||
Consolidated EBITDA increased 9.0% in 2Q25 and 5.0% in 6M25, when compared to 2Q24 and 6M24 respectively, mainly due to increased cement demand, lower raw material costs and operational efficiencies.
Cash and Debt Position:
Consolidated Cash (in millions of Soles S/)
As of June 30, 2025, the cash balance was S/80.6 million (US$ 22.8 million). This balance includes certificates of deposit in the amount of S/ 31.5 million (US$ 8.9 million), distributed as follows:
Certificate Deposits in Soles
| Bank | Amount (S/) | Interest Rate | Initial Date | Maturity Date | ||||||
| SCOTIABANK | S/ 10.0 | 4.33 | % | June 3, 2025 | July 3, 2025 | |||||
| SCOTIABANK | S/ 5.0 | 4.30 | % | June 6, 2025 | July 3, 2025 | |||||
| SCOTIABANK | S/ 4.5 | 4.25 | % | June 13, 2025 | July 3, 2025 | |||||
| Banco de Crédito del Perú | S/ 2.0 | 4.25 | % | June 30, 2025 | July 24, 2025 | |||||
| Banco de Crédito del Perú | S/ 4.0 | 4.06 | % | June 30, 2025 | July 3, 2025 | |||||
| Banco de Crédito del Perú | S/ 6.0 | 4.06 | % | June 30, 2025 | July 3, 2025 | |||||
| S/ 31.5 | ||||||||||
The remaining balance of S/ 49.1 million (US$ 13.9 million) is held mainly in the Company’s bank accounts, of which US$ 5.7 million are denominated in US dollars and the balance in Soles.
| |
| 14 |
DEBT POSITION:
Consolidated Debt
(in millions of Soles S/)
Below are the contractual obligations with payment deadlines related to the Company’s debt, including interest.
| Cronograma de Deuda | ||||||||||||||||||||
| Less than 1 year | 1-3 Years | 3-5 Years | More than 5 Years | Total | ||||||||||||||||
| Indebtedness | 495.6 | 312.7 | 338.2 | 310.0 | 1,456.5 | |||||||||||||||
| Future interest payments | 75.9 | 106.7 | 60.4 | 38.2 | 281.2 | |||||||||||||||
| Total | 571.5 | 419.4 | 398.6 | 348.2 | 1,737.7 | |||||||||||||||
As of June 30, 2025, the Company’s total outstanding debt, as shown in the financial statements, reached S/ 1,451.7 million (US$ 409.0 million). This debt is mainly composed of two local bonds issued in January 2019 and the club deal obtained in 2022.
As of June 30, 2025, Net Debt/EBITDA ratio was 2.6 times.
Capex
(in millions of Soles S/)
As of June 30, 2025 the Company invested S/ 62.7 million (US$ 17.7 million), allocated to the following projects:
| Projects | 6M25 | |||
| Pacasmayo Plant Projects | 11.8 | |||
| Concrete and aggregates equipment | 25.9 | |||
| Rioja Plant Projects | 1.9 | |||
| Piura Plant Projects | 22.6 | |||
| Other | 0.5 | |||
| Total | 62.7 | |||
| |
| 15 |
ABOUT CEMENTOS PACASMAYO S.A.A.
Cementos Pacasmayo S.A.A. is a cement company, located in the Northern region of Peru. In February 2012, the Company’s shares were listed on The New York Stock Exchange - Euronext under the ticker symbol “CPAC”. With more than 67 years of operating history, the Company produces, distributes and sells cement and cement-related materials, such ready-mix concrete and precast materials. Pacasmayo’s products are primarily used in construction, which has been one of the fastest-growing segments of the Peruvian economy in recent years. The Company also produces and sells quicklime for use in mining operations.
For more information, please visit: http://www.cementospacasmayo.com.pe/
Note: The Company presented some figures converted from Soles to U.S. Dollars for comparison purposes. The exchange rate used to convert Soles to U.S. dollars was S/ 3.534 per US$ 1.00, which was the average exchange rate, reported as of June 30, 2025 by the Superintendencia de Banca, Seguros y AFP’s (SBS). The information presented in U.S. dollars is for the convenience of the reader only. Certain figures included in this report have been subject to rounding adjustments. Accordingly, figures shown as totals in certain tables may not be arithmetic aggregations of the figures presented in previous quarters.
This press release may contain forward-looking statements. These statements are statements that are not historical facts, and are based on management’s current view and estimates of future economic circumstances, industry conditions, Company performance and financial results. Also, certain reclassifications have been made to make figures comparable for the periods. The words “anticipates”, “believes”, “estimates”, “expects”, “plans” and similar expressions, as they relate to the Company, are intended to identify forward-looking statements. Statements regarding the declaration or payment of dividends, the implementation of principal operating and financing strategies and capital expenditure plans, the direction of future operations and the factors or trends affecting financial condition, liquidity or results of operations are examples of forward-looking statements. Such statements reflect the current views of management and are subject to a number of risks and uncertainties. There is no guarantee that the expected events, trends or results will actually occur. The statements are based on many assumptions and factors, including general economic and market conditions, industry conditions, and operating factors. Any changes in such assumptions or factors could cause actual results to differ materially from current expectations.
| |
| 16 |
CONSOLIDATED STATEMENTS OF FINANCIAL POSITION
As of June 30, 2025 (unaudited) and December 31,2024 (audited)
| As of Jun-25 | As of Dec-24 | |||||||
| S/ (000) | S/ (000) | |||||||
| Cash and cash equivalents | 80,638 | 72,723 | ||||||
| Trade and other receivables,net | 158,763 | 131,168 | ||||||
| Income tax prepayments | 22,123 | 7,736 | ||||||
| Inventories | 749,316 | 773,997 | ||||||
| Prepayments | 54,538 | 6,872 | ||||||
| Total current assets | 1,065,378 | 992,496 | ||||||
| Trade and other receivables, net | 43,151 | 43,224 | ||||||
| Financial instruments designated at fair value through OCI | 547 | 239 | ||||||
| Property, plant and equipment, net | 2,008,761 | 2,031,139 | ||||||
| Intangible assets, net | 60,800 | 63,596 | ||||||
| Goodwill | 4,459 | 4,459 | ||||||
| Deferred income tax assets | 28,553 | 21,816 | ||||||
| Right-of-use asset, net | 16,713 | 9,023 | ||||||
| Other assets | 51 | 51 | ||||||
| Total non-current assets | 2,163,035 | 2,173,547 | ||||||
| Total assets | 3,228,413 | 3,166,043 | ||||||
| Trade and other payables | 276,443 | 242,051 | ||||||
| Financial obligations | 494,346 | 458,346 | ||||||
| Lease liabilities | 4,663 | 2,958 | ||||||
| Income tax payable | 2,439 | 17,937 | ||||||
| Provisions | 17,837 | 44,263 | ||||||
| Total current liabilities | 795,728 | 765,555 | ||||||
| Financial obligations | 957,322 | 1,034,845 | ||||||
| Lease liabilities | 11,837 | 6,462 | ||||||
| Provisions | 28,894 | 28,146 | ||||||
| Deferred income tax liabilities | 121,183 | 117,937 | ||||||
| Total non-current liabilities | 1,119,236 | 1,187,390 | ||||||
| Total liabilities | 1,914,964 | 1,952,945 | ||||||
| Capital stock | 423,868 | 423,868 | ||||||
| Investment shares | 40,279 | 40,279 | ||||||
| Invest shares held in Treasury | (121,258 | ) | (121,258 | ) | ||||
| Additional paid-in capital | 432,779 | 432,779 | ||||||
| Legal reserve | 168,636 | 168,636 | ||||||
| Other accumulated comprehensive results (loss) | (16,695 | ) | (16,551 | ) | ||||
| Retained earnings | 385,840 | 285,345 | ||||||
| Total Equity | 1,313,449 | 1,213,098 | ||||||
| Total liability and equity | 3,228,413 | 3,166,043 | ||||||
| |
| 17 |
CONSOLIDATED STATEMENTS OF PROFIT AND LOSS
For the three and six -month periods ended June 30, 2025 and 2024 (both unaudited)
| 2Q25 | 2Q24 | 6M25 | 6M24 | |||||||||||||
| S/ (000) | S/ (000) | S/ (000) | S/ (000) | |||||||||||||
| Sales of goods | 484,104 | 457,096 | 983,272 | 933,645 | ||||||||||||
| Cost of sales | (304,418 | ) | (295,529 | ) | (620,228 | ) | (598,225 | ) | ||||||||
| Gross profit | 179,686 | 161,567 | 363,044 | 335,420 | ||||||||||||
| Operating income (expenses) | ||||||||||||||||
| Administrative expenses | (70,352 | ) | (61,851 | ) | (140,339 | ) | (119,038 | ) | ||||||||
| Selling and distribution expenses | (22,413 | ) | (17,573 | ) | (45,125 | ) | (36,649 | ) | ||||||||
| Other operating (expenses) income, net | 3.805 | (1,734 | ) | 8,783 | (4,364 | ) | ||||||||||
| Total operating expenses , net | (88,960 | ) | (81,158 | ) | (176,681 | ) | (160,051 | ) | ||||||||
| Operating profit | 90,726 | 80,409 | 186,363 | 175,369 | ||||||||||||
| Other income (expenses) | ||||||||||||||||
| Finance income | 524 | 1,248 | 1,168 | 2,575 | ||||||||||||
| Financial costs | (22,688 | ) | (25,159 | ) | (45,819 | ) | (50,875 | ) | ||||||||
| Loss from exchange difference, net | 1,072 | (1,363 | ) | 1,863 | (1,385 | ) | ||||||||||
| Total other expenses, net | (21,092 | ) | (25,274 | ) | (42,788 | ) | (49,685 | ) | ||||||||
| Profit before income tax | 69,634 | 55,135 | 143,575 | 125,684 | ||||||||||||
| Income tax expense | (21,812 | ) | (18,317 | ) | (43,080 | ) | (39,428 | ) | ||||||||
| Profit for the period | 47,822 | 36,818 | 100,495 | 86,256 | ||||||||||||
| Earnings per share | ||||||||||||||||
| Basic and diluted earnings per year attributable to equity holders of common shares and investment in shares of Cementos Pacasmayo S.A.A. (S/ per share) | 0.11 | 0.09 | 0.23 | 0.20 | ||||||||||||
| |
| 18 |
CONSOLIDATED STATEMENTS OF CHANGES IN EQUITY
For the six-month periods ended June 30, 2025, 2024 (unaudited)
| Attributable to equity holders of the parent | ||||||||||||||||||||||||||||||||
| Capital S/(000) | Investment Shares S/(000) | Investments Shares hold in Treasury S/(000) | Additional paid-in capital S/(000) | Legal reserve S/(000) | Unrealized gain(loss) in financial instruments designated at fair value S/ (000) | Retained earnings S/ (000) | Total S/ (000) | |||||||||||||||||||||||||
| Balance as of January 1, 2024 | 423,868 | 40,279 | (121,258 | ) | 432,779 | 168,636 | (16,290 | ) | 261,994 | 1,190,008 | ||||||||||||||||||||||
| Profit for the year | - | - | - | - | - | - | 86,256 | 86,256 | ||||||||||||||||||||||||
| Other comprehensive loss | - | - | - | - | - | (67 | ) | - | (67 | ) | ||||||||||||||||||||||
| Total comprehensive income | - | - | - | - | - | (67 | ) | 86,256 | 86,189 | |||||||||||||||||||||||
| Balance as of June 30, 2024 | 423,868 | 40,279 | (121,258 | ) | 432,779 | 168,636 | (16,357 | ) | 348,250 | 1,276,197 | ||||||||||||||||||||||
| Balance as of January 1, 2025 | 423,868 | 40,279 | (121,258 | ) | 432,779 | 168,636 | (16,551 | ) | 285,345 | 1,213,098 | ||||||||||||||||||||||
| Profit for the year | - | - | - | - | - | - | 100,495 | 100,495 | ||||||||||||||||||||||||
| Other comprehensive loss | - | - | - | - | - | (144 | ) | - | (144 | ) | ||||||||||||||||||||||
| Total comprehensive income | - | - | - | - | - | (144 | ) | 100,495 | 100,351 | |||||||||||||||||||||||
| Balance as of June 30, 2025 | 423,868 | 40,279 | (121,258 | ) | 432,779 | 168,636 | (16,695 | ) | 385,840 | 1,313,449 | ||||||||||||||||||||||
| |
| 19 |