The Fund’s investment objective is capital appreciation in elevated and rising inflationary environments.
This table describes the fees and expenses that you may pay if you buy, hold, and sell shares of the Fund. You may pay other fees, such as brokerage commissions and other fees to financial intermediaries, which are not reflected in the tables and examples below.
|
Annual Fund Operating Expenses (Expenses that you pay each year as a percentage of the value of your investment) |
|
Management Fees |
0.70% |
Distribution and/or Service (12b-1) Fees1 |
0.00% |
Other Expenses2 |
0.00% |
Total Annual Fund Operating Expenses3 |
0.70% |
| 1 | Pursuant to a Distribution Plan, the Fund may bear a Rule 12b-1 fee not to exceed 0.25% per year of the Fund’s average daily net assets. However, no such fee is currently paid by the Fund, and the Board of Trustees has not currently approved the commencement of any payments under the Distribution Plan. |
| 2 | Other Expenses are based on estimated expenses for the current fiscal year. |
| 3 | The Fund is the successor to the Ionic Inflation Protection ETF (the “Predecessor Fund”), pursuant to a reorganization that occurred on April 11, 2025 (“Closing Date”) in which the Fund adopted the financial statements and performance history of the Predecessor Fund. The Total Annual Fund Operating Expenses of the Fund’s shares reflect the Fund’s estimated expenses for the current fiscal year. |
This Example is intended to help you compare the cost of investing in the Fund with the cost of investing in other funds. The Example assumes that you invest $10,000 in the Fund for the time periods indicated and then redeem all of your shares at the end of those periods. The Example also assumes that your investment has a 5% return each year and that the Fund’s operating expenses remain the same. Although your actual costs may be higher or lower, based on these assumptions, whether you redeem or hold your shares, your costs would be:
|
1 Year |
3 Years | |
|
|
$72 |
$224 |
The Fund pays transaction costs, such as commissions, when it buys and sells securities (or ‘‘turns over’’ its portfolio). A higher portfolio turnover rate may indicate higher transaction costs and may result in higher taxes when Fund shares are held in a taxable account. These costs, which are not reflected in annual Fund operating expenses or in the Example, affect the Fund’s performance. The Fund’s portfolio turnover rate for the fiscal year ended April 30, 2025 (which is the portfolio turnover rate of the Predecessor Fund through April 11, 2025) was 114% of the average value of the Fund’s portfolio, exclusive of the impact of in-kind trades.
Under normal circumstances, the Fund invests at least 80% of its net assets, plus the amount of any borrowings for investment purposes, in investments that provide protection against U.S. inflation.
Inflation refers to a general rise in prices throughout the U.S. economy, which the Fund will measure using the non-seasonally adjusted U.S. City Average All Items Consumer Price Index for All Urban Consumers (the “CPI-U”) published monthly by the Bureau of Labor Statistics of the U.S. Department of Labor. The Fund seeks to provide investors with protection against the negative impact of inflation by generating positive returns when inflation is elevated and/or rising. For purposes of the 80% policy stated above, the Fund considers the following investments to provide protection against U.S. inflation:
| ■ | inflation swaps; |
| ■ | options on U.S. interest rate swaps (“swaptions”); |
| ■ | U.S. Treasury Inflation-Protected Securities (“TIPS”); and |
| ■ | exchange-traded funds (“ETFs”) that themselves have policies to invest at least 80% of their assets in inflation-protected investments. |
Investment
Process
Ionic Capital Management LLC, the Fund’s investment sub-advisor (the “Sub-Advisor”), utilizes
a proprietary process to construct the Fund’s investment portfolio. In seeking to achieve its investment objective, the Fund invests
in: (i) inflation swaps designed to increase in value when realized inflation or inflation expectations exceed the fixed-rate referenced
in such inflation swaps; (ii) TIPS directly with varied maturities on a rolling basis and indirectly through ETFs; and (iii) swaptions
designed to increase in value when inflationary environments lead to increases in nominal interest rates or interest rate expectations.
In addition, under certain market conditions, the Sub-Advisor may choose to use interest rate swaps to hedge the Fund’s swaption
exposure. The Fund may also invest in U.S. Treasury bills, notes, and bonds of varying maturities. Additionally, the Fund may invest in
other ETFs that primarily invest in such U.S. Treasury securities. The Fund may sell an investment if the Sub-Advisor determines the investment
is no longer in alignment with the Fund’s principal investment strategies, in response to changing market conditions or in response
to Fund cash flows.
Inflation
Swaps
Swaps are contracts where one party “swaps” one type of cash flow for a different type of cash flow. Inflation
swaps are derivative instruments that trade over-the-counter, which means they trade in a broker-dealer network, as opposed to on a centralized
exchange. The Fund will primarily enter into inflation swaps that reference the CPI-U. For these inflation swaps, one party agrees to
pay to the other party the percentage increase in CPI-U during the term of the swap, while the other party agrees to pay back a fixed
rate. This means the inflation swaps held by the Fund will typically increase in value if inflation increases. Likewise, inflation swaps
held by the Fund will typically decrease in value if inflation decreases. The Sub-Advisor will primarily focus on 5-year, zero-coupon
inflation swaps tied to the level of CPI-U that are designed to increase in value when realized inflation or inflation expectations exceed
the fixed-rate referenced in those swaps.
Interest
Rate Swaps and Swaptions
Interest rate swaps are essentially the same as inflation swaps, except that the parties pay
each other based on interest rate changes. The Fund will generally enter into interest rate swaps that exchange fixed-rate payments for
floating-rate payments, with interest paid at fixed intervals (e.g., quarterly) or only on the expiration date. Further, the Fund will
generally enter into interest rate swaps only when the Sub-Advisor seeks to hedge the Fund’s swaption exposure.
A swaption is an option on a swap agreement that gives the buyer the right, but not the obligation, to enter into a swap on a future date in exchange for paying a market-based “premium.” The Fund expects to focus on so-called “payer swaptions,” which give the owner (the Fund) the right to pay fixed-rate payments and, in exchange, receive floating rate payments.
Like inflation swaps, interest rate swaps and swaptions are derivative instruments that trade over-the-counter. The Fund’s interest rate swaps and swaptions will be tied to the level of U.S. interest rates. This means that swaptions held by the Fund will typically increase in value if interest rates rise, and decrease in value if interest rates fall. The Fund will generally purchase swaptions with an expiration of one to three years, although the Fund may purchase swaptions with shorter or longer expirations.
U.S.
Treasury Inflation-Protected Securities (“TIPS”)
TIPS are marketable securities issued by the U.S. Treasury whose
principal is adjusted based on changes in the CPI-U. With inflation (an increase in the CPI-U), the principal increases, and with deflation
(a decrease in the CPI-U), the principal decreases. The relationship between TIPS and inflation affects both the principal amount paid
when a TIPS instrument matures and the amount of interest that a TIPS instrument pays semi-annually. When a TIPS instrument matures, the
principal paid is the greater of the CPI-U adjusted principal or the original principal. TIPS pay interest at a fixed rate. However, because
the fixed rate is applied to the CPI-U adjusted principal, interest payments can vary in amount from one period to the next. If the rate
of inflation increases, the interest payment increases. If the rate of inflation decreases, the interest payment decreases. The Fund may
purchase TIPS of any maturity.
The Fund may invest cash balances in a government money market fund advised by the Manager, with respect to which the Manager receives a management fee. The Fund’s holdings may be frequently adjusted, which could result in high portfolio turnover.
The Fund is non-diversified, which means that it is not limited to a percentage of assets that it may invest in any one issuer.
The bar chart and table below provide an indication of risk by showing changes in the Fund’s performance over time. The bar chart shows how the Fund’s performance has varied from year to year. The table shows how the Fund’s average annual total returns compare to a broad-based securities market index, the Bloomberg US Aggregate Bond Index. The Fund acquired the Ionic Inflation Protection ETF (“Predecessor Fund”) in a reorganization that closed on April 11, 2025. In connection with that reorganization, the Fund has adopted the performance history and financial statements of the Predecessor Fund.
You may obtain updated performance information on the Fund’s website at www.americanbeaconfunds.com. Past performance (before and after taxes) is not necessarily an indication of how the Fund will perform in the future.
|
Calendar year total returns for Shares. Year Ended 12/31 | |
|
|
Highest
Quarterly Return: Lowest
Quarterly Return: |
|
The calendar year-to-date total return as of June 30, 2025 was 1.52%. |
|
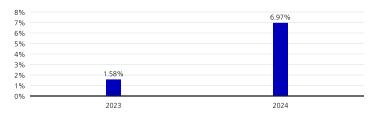
3.38% 2nd Quarter 2023
01/01/23 through 12/31/24
-1.84% 4th Quarter 2023
01/01/23 through 12/31/24
|
|
Inception Date |
1 Year |
Since Inception |
|
Shares |
06/28/2022 |
|
|
|
Returns Before Taxes |
|
6.97% |
3.78% |
|
Returns After Taxes on Distributions |
|
4.66% |
1.64% |
|
Returns After Taxes on Distributions and Sales of Fund Shares |
|
4.11% |
1.97% |
|
|
1 Year |
Since Inception (06/28/2022) |
|
Index (Reflects no deduction for fees, expenses or taxes) | ||
|
Bloomberg US Aggregate Bond Index |
1.25% |
1.85% |
After-tax returns are calculated using the historical highest individual federal marginal income tax rates and do not reflect the impact of state and local income taxes. Actual after-tax returns depend on an investor’s tax situation and may differ from those shown. The return after taxes on distributions and sale of Fund shares may exceed the return before taxes due to an assumed tax benefit from any losses on a sale of Fund shares at the end of the measurement period. If you are a tax-exempt entity or hold your Fund shares through a tax-deferred arrangement, such as an individual retirement account (“IRA”) or a 401(k) plan, the after-tax returns do not apply to your situation.