Performance Management - Women in Leadership U.S. Equity Portfolio
Oct. 31, 2024
The
bar chart and table below provide some indication of the risks of investing in the Portfolio. The bar chart shows how the performance
of the Portfolio’s Advisor Shares has varied from year to year. The table shows how the average annual total returns for one year,
five years and since inception of the Portfolio’s Advisor Shares compare to those of selected market indices.
Effective
September 2, 2025, the Portfolio underwent a change to its investment objective and principal investment strategy (the “Repositioning”).
In connection with the Repositioning, the Portfolio will be repositioned to invest in undervalued equity securities, such as common stocks
and preferred stocks, of U.S. SMID cap companies. Accordingly, the performance of the Portfolio shown prior to September 2,
2025 reflects the Portfolio’s prior principal investment strategy and objective; the Portfolio’s performance would have differed
if the Portfolio’s current principal investment strategy and objective had been in place.
The
Portfolio’s past performance, before and after taxes, does not necessarily indicate how it will perform in the future. Performance
reflects expense reimbursements and/or fee waivers in effect. If such expense reimbursements or fee waivers were not in place, the Portfolio’s
performance would be reduced. Updated performance information is available by visiting www.glenmedeim.com or by calling 1-800-442-8299.
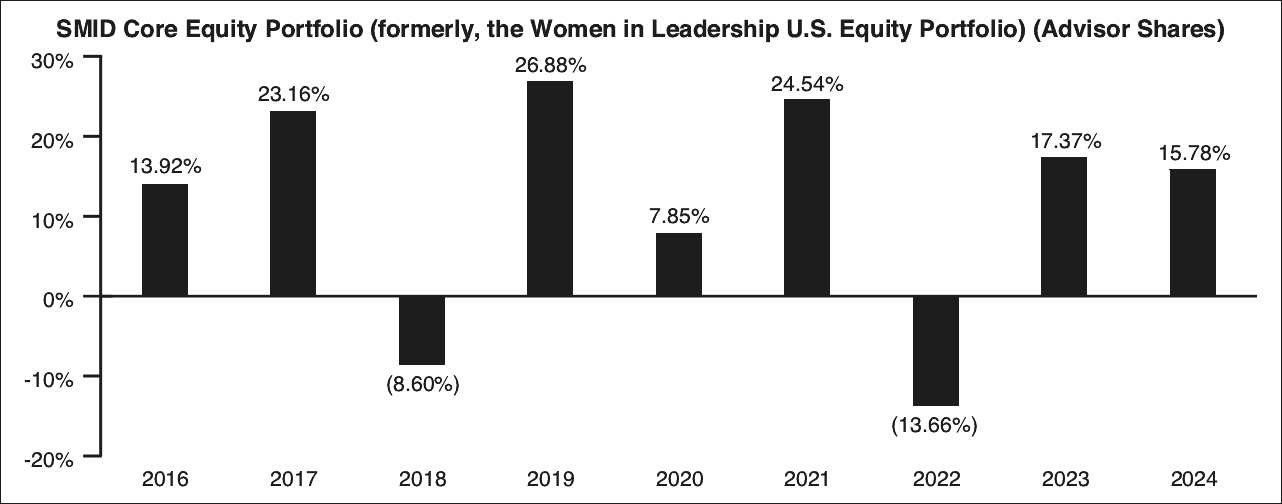
During the periods shown in the bar chart, the highest quarterly return was 20.58% (for the quarter ended June 30, 2020) and the lowest quarterly return was -27.56% (for the quarter ended March 31, 2020).
After-tax
returns for the Portfolio are calculated using the historical highest individual Federal marginal income tax rates, and do not reflect
the impact of state and local taxes. Actual after-tax returns depend on the investor’s tax situation and may differ from those shown.
After-tax returns are not relevant to investors who hold their Portfolio shares through tax-deferred arrangements such as 401(k) plans
or individual retirement accounts (“IRAs”).
Past 1 Year | Past 5 Years | Since Inception (December 22, 2015) | |||||||||
Return Before Taxes – Advisor Shares | 15.78% | 9.52% | 10.98% | ||||||||
Return After Taxes on Distributions | 12.47% | 7.43% | 9.56% | ||||||||
Return After Taxes on Distributions and Sale of Fund Shares | 11.82% | 7.33% | 8.84% | ||||||||
Russell 3000® Index1 (reflects no deduction for fees, expenses or taxes) | 23.81% | 13.86% | 13.97% | ||||||||
Russell 1000® Index1 (reflects no deduction for fees, expenses or taxes) | 24.51% | 14.28% | 14.28% | ||||||||
Russell 2500® Index2 (reflects no deduction for fees, expenses or taxes) | 11.99% | 8.77% | 10.25% | ||||||||
Morningstar Large Value Average2 | 14.28% | 9.20% | 10.01% | ||||||||
1 | Effective September 2, 2025, due to the Repositioning, the Portfolio’s primary broad-based index changed from the Russell 1000 Index to the Russell 3000 Index. |
2 | Effective September 2, 2025, due to the Repositioning, the Portfolio’s performance measurement index changed from the Morningstar Large Cap Value Average to the Russell 2500 Index. The Russell 2500 Index is provided so that investors may compare the performance of the Portfolio with an index composed of securities similar to those held by the Portfolio. |
The
bar chart and table below provide some indication of the risks of investing in the Portfolio. The bar chart shows how the performance
of the Portfolio has varied from year to year. The table shows how average annual total returns for one year, five years and since inception
compare to those of selected market indices. The Portfolio’s past performance, before and after taxes, does not necessarily indicate
how it will perform in the future. Performance reflects expense reimbursements and/or fee waivers in effect. If such expense reimbursements
or fee waivers were not in place, the Portfolio’s performance would be reduced. Updated performance information is available by
visiting www.glenmedeim.com or by calling 1-800-442-8299.
Effective
September 2, 2025, the Portfolio underwent a change to its investment objective and principal investment strategy (the “Repositioning”).
In connection with the Repositioning, the Portfolio will be repositioned to invest in undervalued equity securities, such as common stocks
and preferred stocks, of U.S. SMID cap companies.
As
of the date of this Prospectus, the Portfolio had not yet offered Institutional Shares to investors. Accordingly, the performance of
the Portfolio shown prior to September 2, 2025 reflects the Advisor Shares’ prior principal investment strategy and
objective. The Portfolio’s performance would have differed if the Portfolio’s current principal investment strategy and objective
had been in place. Institutional Shares and Advisor Shares of the Portfolio should have returns that are substantially the same because
they represent investments in the same portfolio of securities and differ only to the extent that they have different expenses.
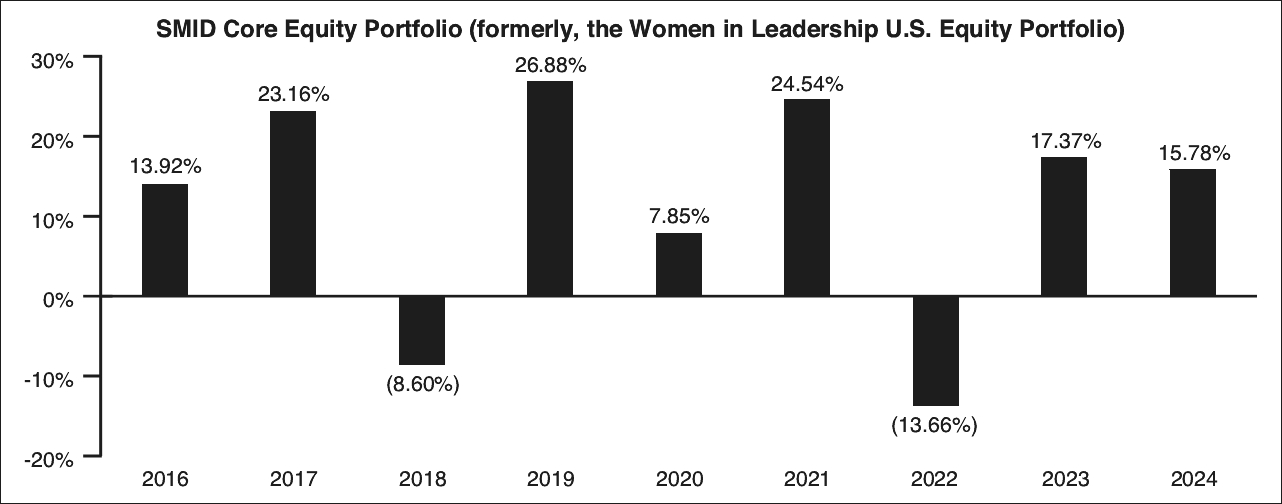
During the periods shown in the bar chart, the highest quarterly return was 20.58% (for the quarter ended June 30, 2020) and the lowest quarterly return was -27.56% (for the quarter ended March 31, 2020
After-tax
returns for the Portfolio are calculated using the historical highest individual Federal marginal income tax rates, and do not reflect
the impact of state and local taxes. Actual after-tax returns depend on the investor’s tax situation and may differ from those shown.
After-tax returns are not relevant to investors who hold their Portfolio shares through tax-deferred arrangements such as 401(k) plans
or individual retirement accounts (“IRAs”).
Past 1 Year | Past 5 Years | Since Inception (December 22, 2015) | |||||||||
Return Before Taxes – Institutional Shares | 15.78% | 9.52% | 10.98% | ||||||||
Return After Taxes on Distributions | 12.47% | 7.43% | 9.56% | ||||||||
Return After Taxes on Distributions and Sale of Fund Shares | 11.82% | 7.33% | 8.84% | ||||||||
Russell 3000® Index1 (reflects no deduction for fees, expenses or taxes) | 23.81% | 13.86% | 13.97% | ||||||||
Russell 1000® Index1 (reflects no deduction for fees, expenses or taxes) | 24.51% | 14.28% | 14.28% | ||||||||
Russell 2500® Index2 (reflects no deduction for fees, expenses or taxes) | 11.99% | 8.77% | 10.25% | ||||||||
Morningstar Large Value Average2 | 14.28% | 9.20% | 10.01% | ||||||||
1 | Effective September 2, 2025, due to the Repositioning, the Portfolio’s primary broad-based index changed from the Russell 1000 Index to the Russell 3000 Index. |
2 | Effective September 2, 2025, due to the Repositioning, the Portfolio’s performance measurement index changed from the Morningstar Large Cap Value Average to the Russell 2500 Index. The Russell 2500 Index is provided so that investors may compare the performance of the Portfolio with an index composed of securities similar to those held by the Portfolio. |