On April 12, 2024, the Fund acquired all of the assets and liabilities of the Sphere 500 Climate Fund, a series of Manager Directed Portfolios (the “Predecessor Fund”), in a tax-free reorganization (the “Reorganization”). In connection with the Reorganization, shares of the Predecessor Fund were exchanged for shares of the Fund. The Predecessor Fund had an investment objective and strategies that were, in all material respects, the same as those of the Fund, and was managed in a manner that, in all material respects, complied with the investment guidelines and restrictions of the Fund. The Predecessor Fund commenced operations on October 4, 2021. The Fund’s performance for periods prior to April 12, 2024, is that of the Predecessor Fund. The Fund is a continuation of the Predecessor Fund, and therefore, the performance information includes the performance of the Predecessor Fund. Prior to the Reorganization, the Fund was a “shell” fund with no assets and had not yet commenced operations.
The bar chart and performance table below illustrate the risk of investing in the Fund by showing the performance of the Fund’s shares from year to year and by showing the Fund’s average annual total returns compared with those of a broad-based market index and the Index. The performance of the Fund and of the Predecessor Fund was calculated net of the Fund’s and Predecessor Fund’s respective fees and expenses. The Fund’s performance has not been restated to reflect any differences in expenses paid by the Predecessor Fund and those paid by the Fund. The Predecessor Fund’s performance is included because the Fund believes that the performance information presented is relevant for consideration by prospective Fund investors. Although the actual performance of the Predecessor Fund is not the performance of the Fund, the Fund has adopted the performance of the Predecessor Fund as its performance. Such performance is not necessarily indicative of the Fund’s future performance.
Institutional Class shares had not commenced operations as of December 31, 2024. Accordingly, the information provided represents returns of Class R6 shares (which was previously an undesignated share class of the Fund). Institutional Class shares would have substantially similar annual returns because the shares are invested in the same portfolio of securities and the annual returns would differ only to the extent that the classes do not have the same expenses. The Fund had a different fee structure prior to September 16, 2025.
The Fund’s past performance, both before and after taxes, does not necessarily indicate how the Fund will perform in the future. Updated performance information is also available on the Fund’s website at www.oursphere.org/fund.
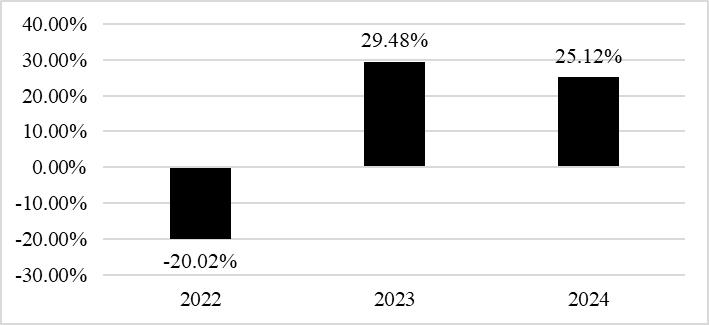
During the period of time shown in the bar chart for Class R6 shares, the highest return for a calendar quarter was 12.92% for the quarter ended December 31, 2023, and the lowest return for a calendar quarter was -15.97% for the quarter ended June 30, 2022.
| 1 Year | Since Inception (October 4, 2021) | |
| Sphere 500 Climate Fund – Class R6 | ||
| Return Before Taxes | 25.12% | 11.28% |
| Return After Taxes on Distributions | 24.78% | 10.99% |
| Return After Taxes on Distributions and Sale of Fund Shares | 15.07% | 8.76% |
| S&P 500® Index(1) (reflects no deduction for fees, expenses or taxes) |
25.02% | 11.85% |
| Sphere 500 Fossil-Free Index™(2) (reflects no deduction for fees, expenses or taxes) |
26.26% | 11.38% |
| (1) | The S&P 500 Index is a market-capitalization-weighted index of the 500 largest U.S. publicly traded companies. The S&P 500 Index is a float-weighted index, meaning company market capitalizations are adjusted by the number of shares available for public trading. Investors cannot invest directly in an index or benchmark. Index returns are gross of any fees, brokerage commission or other expenses of investing. |
| (2) | For additional information regarding this index, see the discussion under the sub-heading “The Index” in the Summary Section of this Prospectus. Investors cannot invest directly in an index or benchmark. Index returns are gross of any fees, brokerage commission or other expenses of investing. |
After-tax returns are calculated using the historical highest individual federal marginal income tax rates and do not reflect the impact of state and local taxes. Actual after-tax returns depend on an investor’s tax situation and may differ from those shown, and after-tax returns shown are not relevant to investors who are exempt from taxation or hold their Predecessor Fund shares through tax-deferred or other tax-advantaged arrangements, such as 401(k) plans or individual retirement accounts (“IRAs”). In certain cases, the figure representing “Return After Taxes on Distributions and Sale of Fund Shares” may be higher than the other return figures for the same period. A higher after-tax return results when a capital loss occurs upon redemption and provides an assumed tax deduction that benefits the investor.