The Fund is the successor of the FPA Queens Road Small Cap Value Fund, formerly a series of Bragg Capital Trust (the "Predecessor Fund"). The Fund acquired all of the assets and liabilities of the Predecessor Fund following the reorganization of the Predecessor Fund on July 28, 2023. As a result of the acquisition, the Fund is the accounting successor of the Predecessor Fund. Performance results shown in the bar chart and the performance table below for periods prior to July 28, 2023, reflect the performance of the Predecessor Fund.
The bar chart and Average Annual Total Returns table below provide an indication of the risks of investing in the Fund by showing changes in the Fund's performance from year to year and by showing how the Fund's average annual returns for the 1, 5 and 10 calendar year periods compare with those of the Russell 3000 Index, a broad-based market index, and the Russell 2000 Value Index, an additional index that provides a measure of the U.S. small cap value equity market. The past performance information shown below is for Investor Class shares of the Fund. Although Investor Class shares would have similar annual returns to the Fund's other share classes (i.e., Advisor Class and Institutional Class shares) because all of the classes are invested in the same portfolio of securities, the returns for each class of shares will vary because of the different expenses paid by each class of shares, as described in the table labeled "Fees and Expenses of the Fund" above. The chart and table reflect the reinvestment of dividends and distributions. In addition, the Fund's past performance (before and after taxes) is not necessarily an indication of how the Fund will perform in the future.
To obtain updated monthly performance information, please visit the Fund's website at https://fpa.com/funds or call (800) 982-4372.
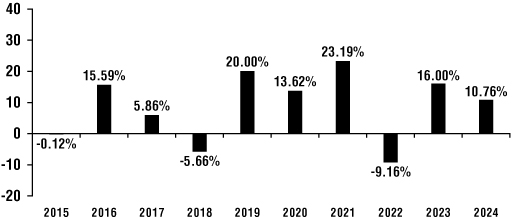
The year-to-date return as of June 30, 2025, was 5.87%.
Investor Class
Highest Calendar Quarter Return at NAV 24.75% (Quarter ended 12/31/2020)
Lowest Calendar Quarter Return at NAV (21.84)% (Quarter ended 03/31/2020)
|
Average Annual Total Returns (for the periods ended December 31, 2024) |
One Year |
Five Years |
Ten Years |
Since Inception |
|||||||||||||||
|
Investor Class — Return Before Taxes |
10.76 |
% |
10.31 |
% |
8.50 |
% |
— |
||||||||||||
|
Investor Class — Return After Taxes on Distributions1 |
9.52 |
% |
9.72 |
% |
7.66 |
% |
|||||||||||||
|
Investor Class — Return After Taxes on Distributions and Sale of Fund Shares1 |
7.23 |
% |
8.14 |
% |
6.71 |
% |
|||||||||||||
|
Advisor Class2—Return Before Taxes |
10.77 |
% |
11.44 |
% |
|||||||||||||||
|
Institutional Class2—Return Before Taxes |
10.94 |
% |
11.57 |
% |
|||||||||||||||
|
Russell 3000 Index |
23.81 |
% |
13.86 |
% |
12.55 |
% |
— |
||||||||||||
|
Russell 2000 Value Index |
8.05 |
% |
7.29 |
% |
7.14 |
% |
— |
||||||||||||
1 After-tax returns are shown only for Investor Class shares; after-tax returns for other share classes will vary. After-tax returns are calculated using the highest historical individual federal marginal income tax rate and do not reflect the impact of state and local taxes. Actual after-tax returns depend on a shareholder's tax situation and may differ from those shown. The after-tax returns are not relevant if you hold your Fund shares in tax- deferred arrangements, such as 401(k) plans or individual retirement accounts ("IRA").
2 Advisor Class and Institutional Class shares commenced operations on December 1, 2020.
The Fund is the successor of the FPA Queens Road Value Fund, formerly a series of Bragg Capital Trust (the "Predecessor Fund"). The Fund acquired the assets and liabilities of the Predecessor Fund following the reorganization of the Predecessor Fund on July 28, 2023. As a result of the acquisition, the Fund is the accounting successor of the Predecessor Fund. Performance results shown in the bar chart and the performance table below for periods prior to July 28, 2023 reflect the performance of the Predecessor Fund.
The bar chart and Average Annual Total Returns table below provide an indication of the risks of investing in the Fund by showing changes in the Fund's performance from year to year and by showing how the Fund's average annual returns for the 1, 5 and 10 calendar year periods compare with those of the S&P 500 Index, a broad-based market index, and the S&P 500 Value Index, an additional index that provides a measure of the U.S. large cap value equity market. The chart and table reflect the reinvestment of dividends and distributions. In addition, the Fund's past performance (before and after taxes) is not necessarily an indication of how the Fund will perform in the future.
To obtain updated monthly performance information, please visit the Fund's website at https://fpa.com/funds or call (800) 982-4372.
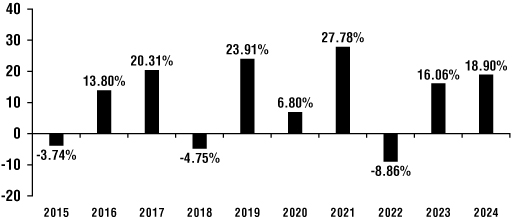
The year-to-date return as of June 30, 2025, was 5.66%.
Highest Calendar Quarter Return at NAV 15.04% (Quarter ended 12/31/2022)
Lowest Calendar Quarter Return at NAV (20.97)% (Quarter ended 03/31/2020)
|
Average Annual Total Returns (for the periods ended December 31, 2024) |
One Year |
Five Years |
Ten Years |
||||||||||||
|
Return Before Taxes |
18.90 |
% |
11.41 |
% |
10.32 |
% |
|||||||||
|
Return After Taxes on Distributions1 |
17.91 |
% |
9.81 |
% |
8.96 |
% |
|||||||||
|
Return After Taxes on Distributions and Sale of Fund Shares1 |
11.90 |
% |
8.80 |
% |
8.13 |
% |
|||||||||
|
S&P 500 Index |
25.02 |
% |
14.53 |
% |
13.10 |
% |
|||||||||
|
S&P 500 Value Index |
12.29 |
% |
10.49 |
% |
10.01 |
% |
|||||||||
1 After-tax returns are calculated using the highest historical individual federal marginal income tax rate and do not reflect the impact of state and local taxes. Actual after-tax returns depend on a shareholder's tax situation and may differ from those shown. The after-tax returns are not relevant if you hold your Fund shares in tax- deferred arrangements, such as 401(k) plans or individual retirement accounts ("IRA").