
Exhibit 99.(c)(1)
Bright Scholar Education Holdings Limited Private and Confidential The information contained herein is of a confidential nature and is intended for the exclusive use of the persons or firm to whom it is furnished by us. Reproduction, publication, or dissemination of portions hereof may not be made without prior approval of Kroll, LLC. Fairness Analysis Presented to the Special Committee of Independent Directors Prepared by: Duff & Phelps Opinions Practice of Kroll October 13, 2025
Duff & Phelps Disclaimer 2 • The following pages contain materials that are being provided by Kroll, LLC (“ Duff & Phelps ”), operating through its Duff & Phelps Opinions Practice, to the special committee (the “ Special Committee ”) of the board of directors (the “ Board of Directors ”) (solely in their capacity as members of the Special Committee) of Bright Scholar Education Holdings Limited (the “ Company ”) in the context of a meeting of the Special Committee held to consider the Proposed Transaction (as defined herein) . • The accompanying materials are, and any Opinion (as defined herein) will be, compiled and presented on a confidential basis, solely for the use and benefit of the Special Committee in connection with its evaluation of the Proposed Transaction and may not be, in whole or in part, distributed to any other party, publicly disclosed, or relied upon for any other purpose without the prior written consent of Duff & Phelps or as otherwise provided in the engagement letter among Duff & Phelps, the Company, and the Special Committee dated June 20 , 2025 . • Because these materials were prepared for use in the context of an oral presentation to the Special Committee, whose members are familiar with the business and affairs of the Company, neither Duff & Phelps nor any of its respective legal or financial advisors or accountants, take any responsibility for the accuracy or completeness of any of the accompanying materials if used by persons other than the Special Committee . • These materials are not intended to represent an Opinion and shall not be treated, construed, used or relied upon in any way as an Opinion . These materials are intended to serve as discussion materials for the Special Committee and as a summary of the basis upon which Duff & Phelps may render an Opinion, and are incomplete without reference to, and should be viewed solely in conjunction with, the discussion between Duff & Phelps and the Special Committee . • The accompanying material does not, and any Opinion provided by Duff & Phelps would not : (i) address the merits of the underlying business decision to enter into the Proposed Transaction versus any alternative strategy or transaction ; (ii) constitute a recommendation as to how the Special Committee, the Board of Directors or any other person (including security holders of the Company) should vote or act with respect to any matters relating to the Proposed Transaction, or whether to proceed with the Proposed Transaction or any related transaction ; or (iii) create any fiduciary duty on the part of Duff & Phelps to any party . • The information utilized in preparing this presentation was obtained from the Company and from public sources under the assumption that they are complete and accurate as of the date of provision . Duff & Phelps did not independently verify such information . Any estimates and forecasts contained herein have been prepared by or are based on discussions with the senior management of the Company and involve numerous and significant subjective determinations, which may or may not prove to be correct . No representation or warranty, expressed or implied, is made as to the accuracy or completeness of such information and nothing contained herein is, or shall be relied upon as, a representation or warranty, whether as to the past or the future . • No selected company or selected transaction used in our analysis is directly comparable to the Company or the Proposed Transaction .
Table of Contents 1. Introduction and Transaction Overview 2. Valuation Analysis – Overseas Schools Business 3. Valuation Analysis – Study Counselling & Others Business 3

1. Introduction and Transaction Overview

Introduction and Transaction Overview 5 The Engagement • Duff & Phelps was engaged by the Company to serve as an independent financial advisor to the Special Committee (solely in its capacity as such) . • Specifically, Duff & Phelps has been asked to provide an opinion (the “ Opinion ”) as to the fairness, from a financial point of view, to (i) the holders of Class A ordinary shares and Class B ordinary shares, par value US $ 0 . 00001 per share, of the Company (each, a “ Share ” or, collectively, “ Shares ”), other than the Excluded Shares, the Dissenting Shares and Shares represented by ADSs (each as defined below), and (ii) the holders of American depositary shares of the Company, each of which represents four Class A ordinary shares of the Company (each, an “ ADS ” and collectively, “ ADSs ”), other than ADSs representing the Excluded Shares, of the Merger Consideration (as defined below) to be received by such holders in the Proposed Transaction (as defined below) (without giving effect to any impact of the Proposed Transaction on any particular holder of Shares or ADSs other than in its capacity as a holder of Shares or ADSs) . The Proposed Transaction • It is Duff & Phelps’ understanding that the Company, Excellence Education Investment Limited, a British Virgin Islands business company organized and existing under the laws of the British Virgin Islands (“ Parent ”), and Bright Education Mergersub Limited, an exempted company incorporated with limited liability under the laws of the Cayman Islands and a wholly owned subsidiary of Parent (“ Merger Sub ”), propose to enter into an Agreement and Plan of Merger (the “ Merger Agreement ”), the latest draft of which Duff & Phelps has reviewed is dated October 11 , 2025 . Pursuant to the Merger Agreement, among other things, Merger Sub will merge with and into the Company and cease to exist, with the Company being the surviving company and becoming a wholly owned subsidiary of Parent as a result of the merger . In connection with such merger, among other things, (i) each Share issued and outstanding immediately prior to the Effective Time (other than the Excluded Shares, the Dissenting Shares and Shares represented by ADSs) shall be cancelled in exchange for the right to receive US $ 0 . 575 in cash per Share without interest (the “ Per Share Merger Consideration ”) and (ii) each ADS issued and outstanding immediately prior to the Effective Time (other than ADSs representing the Excluded Shares), together with the underlying Class A ordinary shares represented by such ADS, shall be cancelled in exchange for the right to receive US $ 2 . 30 in cash per ADS without interest (the “ Per ADS Merger Consideration ”, and together with the Per Share Merger Consideration, the “ Merger Consideration ”) (collectively, the “ Proposed Transaction ”) . • The terms and conditions of the Proposed Transaction are more fully set forth in the Merger Agreement.
Introduction and Transaction Overview 6 The Proposed Transaction (continued) • For purposes of the Opinion, (i) “ Excluded Shares ” shall mean, collectively, Shares (including Shares represented by ADSs) (a) beneficially owned (as determined pursuant to Rule 13 d - 3 under the Exchange Act) by the Buyer Group and any of their respective Affiliates (including Shares held by Sure Brilliant and Ultimate Wise, which will be contributed or transferred to Merger Sub prior to the Closing pursuant to the Rollover Agreement and the Ultimate Wise SPA, as applicable), (b) held by the Company or any of its Subsidiaries, or held in the Company’s treasury, if any, and (c) held by the Depositary, the Company or the Company’s Representatives, and reserved for issuance, settlement and allocation upon exercise or vesting of Company Options ; and (ii) “ Dissenting Shares ”, “ Effective Time ”, “ Exchange Act ”, “ Buyer Group ”, “ Affiliates ”, “ Sure Brilliant ”, “ Ultimate Wise ”, “ Closing ”, “ Rollover Agreement ”, “ Ultimate Wise SPA ”, “ Subsidiaries ”, “ Depositary ”, “ Representatives ”, and “ Company Options ” shall have the meanings set forth in the Merger Agreement .
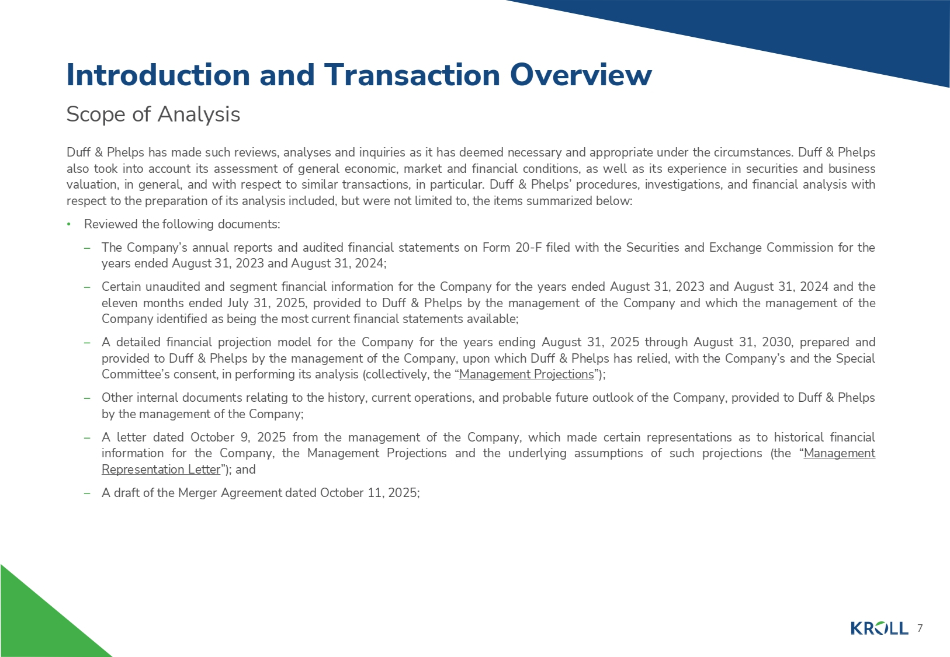
Scope of Analysis Duff & Phelps has made such reviews, analyses and inquiries as it has deemed necessary and appropriate under the circumstances . Duff & Phelps also took into account its assessment of general economic, market and financial conditions, as well as its experience in securities and business valuation, in general, and with respect to similar transactions, in particular . Duff & Phelps’ procedures, investigations, and financial analysis with respect to the preparation of its analysis included, but were not limited to, the items summarized below : • Reviewed the following documents : – The Company’s annual reports and audited financial statements on Form 20 - F filed with the Securities and Exchange Commission for the years ended August 31 , 2023 and August 31 , 2024 ; – Certain unaudited and segment financial information for the Company for the years ended August 31 , 2023 and August 31 , 2024 and the eleven months ended July 31 , 2025 , provided to Duff & Phelps by the management of the Company and which the management of the Company identified as being the most current financial statements available ; – A detailed financial projection model for the Company for the years ending August 31 , 2025 through August 31 , 2030 , prepared and provided to Duff & Phelps by the management of the Company, upon which Duff & Phelps has relied, with the Company’s and the Special Committee’s consent, in performing its analysis (collectively, the “ Management Projections ”) ; – Other internal documents relating to the history, current operations, and probable future outlook of the Company, provided to Duff & Phelps by the management of the Company ; – A letter dated October 9 , 2025 from the management of the Company, which made certain representations as to historical financial information for the Company, the Management Projections and the underlying assumptions of such projections (the “ Management Representation Letter ”) ; and – A draft of the Merger Agreement dated October 11, 2025; 7 Introduction and Transaction Overview
Scope of Analysis (continued) 8 Introduction and Transaction Overview • Discussed the information referred to on the previous page and the background and other elements of the Proposed Transaction with the management of the Company ; • Discussed with the management of the Company its plans and intentions with respect to the management and operation of the Company’s business; • Reviewed the historical trading price and trading volume of the ADSs and the publicly traded securities of certain other companies that Duff & Phelps deemed relevant ; • Performed certain valuation and comparative analyses using generally accepted valuation and analytical techniques, including a discounted cash flow analysis, an analysis of selected public companies that Duff & Phelps deemed relevant, and an analysis of selected transactions that Duff & Phelps deemed relevant ; and • Conducted such other analyses and considered such other factors as Duff & Phelps deemed appropriate.
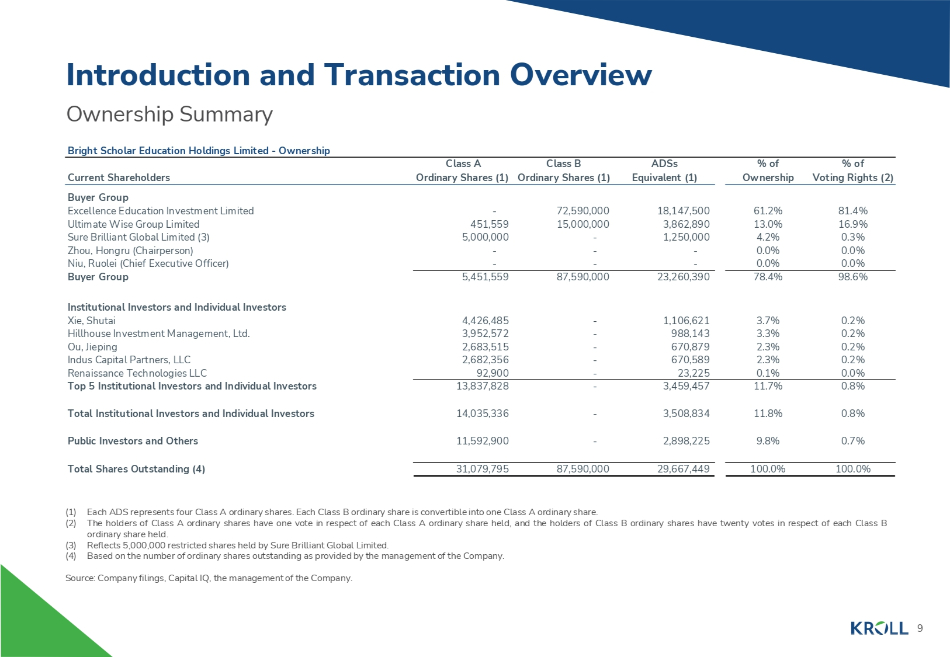
Class A Ordinary Shares (1) 9 Class B Ordinary Shares (1) ADSs % of % of Equivalent (1) Ownership Voting Rights (2) Ownership Summary Bright Scholar Education Holdings Limited - Ownership Current Shareholders 81.4% 61.2% 18,147,500 72,590,000 - Buyer Group Excellence Education Investment Limited 16.9% 13.0% 3,862,890 15,000,000 451,559 Ultimate Wise Group Limited 0.3% 4.2% 1,250,000 - 5,000,000 Sure Brilliant Global Limited (3) 0.0% 0.0% - - - Zhou, Hongru (Chairperson) 0.0% 0.0% - - - Niu, Ruolei (Chief Executive Officer) 98.6% 78.4% 23,260,390 87,590,000 5,451,559 Buyer Group 0.2% 3.7% 1,106,621 - 4,426,485 Institutional Investors and Individual Investors Xie, Shutai 0.2% 3.3% 988,143 - 3,952,572 Hillhouse Investment Management, Ltd. 0.2% 2.3% 670,879 - 2,683,515 Ou, Jieping 0.2% 2.3% 670,589 - 2,682,356 Indus Capital Partners, LLC 0.0% 0.1% 23,225 - 92,900 Renaissance Technologies LLC 0.8% 11.7% 3,459,457 - 13,837,828 Top 5 Institutional Investors and Individual Investors 0.8% 11.8% 3,508,834 - 14,035,336 Total Institutional Investors and Individual Investors 0.7% 9.8% 2,898,225 - 11,592,900 Public Investors and Others 100.0% 100.0% 29,667,449 87,590,000 31,079,795 Total Shares Outstanding (4) Introduction and Transaction Overview (1) Each ADS represents four Class A ordinary shares. Each Class B ordinary share is convertible into one Class A ordinary share. (2) The holders of Class A ordinary shares have one vote in respect of each Class A ordinary share held, and the holders of Class B ordinary shares have twenty votes in respect of each Class B ordinary share held. (3) Reflects 5,000,000 restricted shares held by Sure Brilliant Global Limited. (4) Based on the number of ordinary shares outstanding as provided by the management of the Company. Source: Company filings, Capital IQ, the management of the Company.
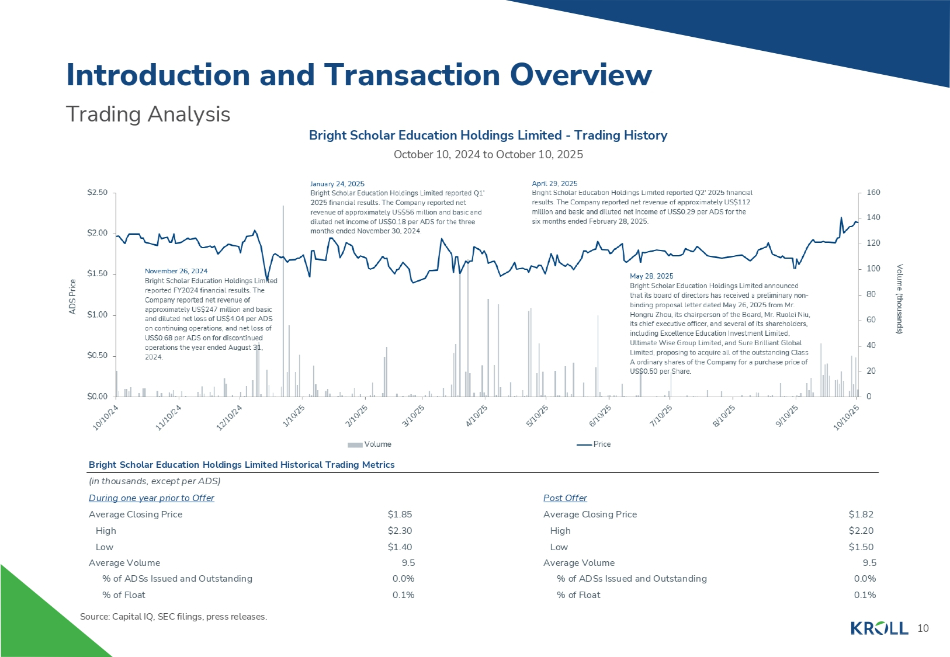
Bright Scholar Education Holdings Limited Historical Trading Metrics Post Offer (in thousands, except per ADS) During one year prior to Offer $1.82 Average Closing Price $1.85 Average Closing Price $2.20 High $2.30 High $1.50 Low $1.40 Low 9.5 Average Volume 9.5 Average Volume 0.0% % of ADSs Issued and Outstanding 0.0% % of ADSs Issued and Outstanding 0.1% % of Float 0.1% % of Float Introduction and Transaction Overview Trading Analysis 10 Bright Scholar Education Holdings Limited - Trading History October 10, 2024 to October 10, 2025 Source: Capital IQ, SEC filings, press releases.
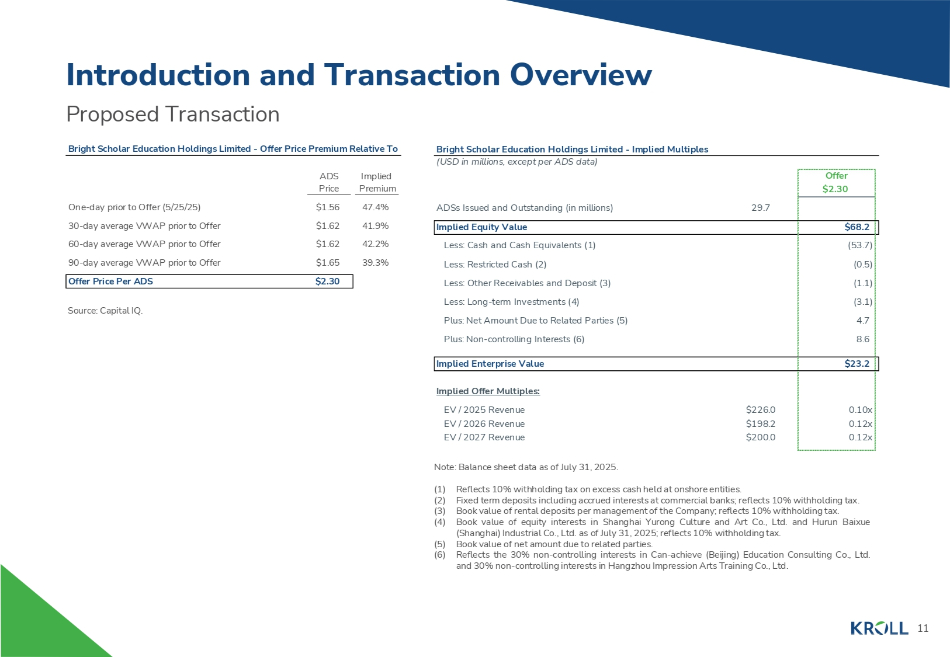
Bright Scholar Education Holdings Limited - Implied Multiples (USD in millions, except per ADS data) Offer $2.30 ADSs Issued and Outstanding (in millions) 29.7 $68.2 Implied Equity Value (53.7) Less: Cash and Cash Equivalents (1) (0.5) Less: Restricted Cash (2) (1.1) Less: Other Receivables and Deposit (3) (3.1) Less: Long - term Investments (4) 4.7 Plus: Net Amount Due to Related Parties (5) 8.6 Plus: Non - controlling Interests (6) $23.2 Implied Enterprise Value Implied Offer Multiples: 0.10x 0.12x 0.12x EV / 2025 Revenue $226.0 EV / 2026 Revenue $198.2 EV / 2027 Revenue $200.0 Bright Scholar Education Holdings Limited - Offer Price Premium Relative To ADS Implied Price Premium 11 47.4% $1.56 One - day prior to Offer (5/25/25) 41.9% $1.62 30 - day average VWAP prior to Offer 42.2% $1.62 60 - day average VWAP prior to Offer 39.3% $1.65 90 - day average VWAP prior to Offer $2.30 Offer Price Per ADS Source: Capital IQ. Proposed Transaction Introduction and Transaction Overview Note: Balance sheet data as of July 31, 2025. (1) Reflects 10% withholding tax on excess cash held at onshore entities. (2) Fixed term deposits including accrued interests at commercial banks; reflects 10% withholding tax. (3) Book value of rental deposits per management of the Company; reflects 10% withholding tax. (4) Book value of equity interests in Shanghai Yurong Culture and Art Co., Ltd. and Hurun Baixue (Shanghai) Industrial Co., Ltd. as of July 31, 2025; reflects 10% withholding tax. (5) Book value of net amount due to related parties. (6) Reflects the 30% non - controlling interests in Can - achieve (Beijing) Education Consulting Co., Ltd. and 30% non - controlling interests in Hangzhou Impression Arts Training Co., Ltd.
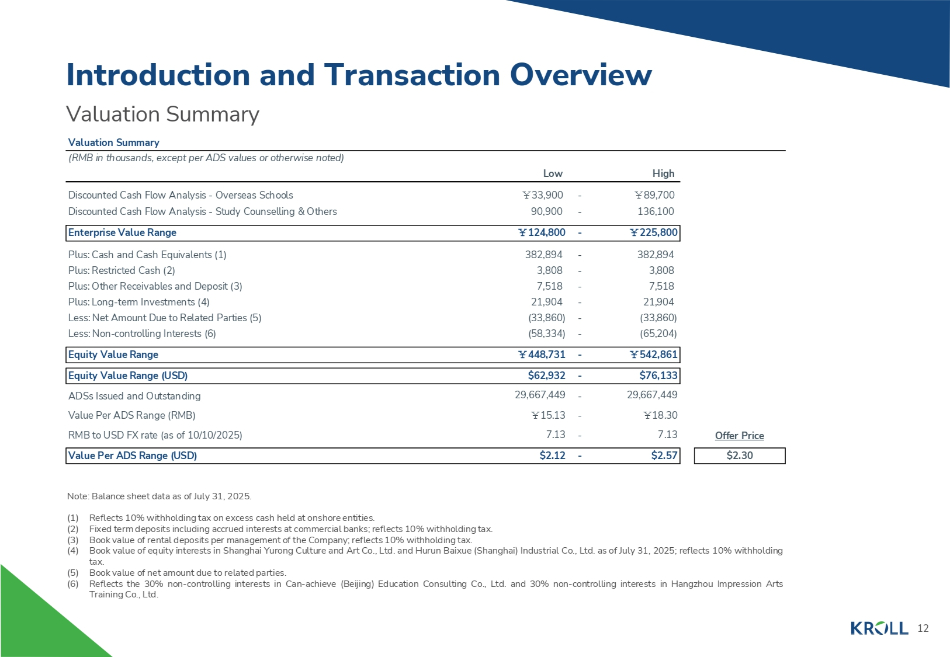
Valuation Summary Valuation Summary 12 High Low (RMB in thousands, except per ADS values or otherwise noted) - ̞ 89,700 ̞ 33,900 Discounted Cash Flow Analysis - Overseas Schools - 136,100 90,900 Discounted Cash Flow Analysis - Study Counselling & Others - ̞ 225,800 ̞ 124,800 Enterprise Value Range - 382,894 382,894 Plus: Cash and Cash Equivalents (1) - 3,808 3,808 Plus: Restricted Cash (2) - 7,518 7,518 Plus: Other Receivables and Deposit (3) - 21,904 21,904 Plus: Long - term Investments (4) - (33,860) (33,860) Less: Net Amount Due to Related Parties (5) - (65,204) (58,334) Less: Non - controlling Interests (6) - ̞ 542,861 ̞ 448,731 Equity Value Range - $76,133 $62,932 Equity Value Range (USD) - 29,667,449 29,667,449 ADSs Issued and Outstanding - ̞ 18.30 ̞ 15.13 Value Per ADS Range (RMB) Offer Price - 7.13 7.13 RMB to USD FX rate (as of 10/10/2025) $2.30 - $2.57 $2.12 Value Per ADS Range (USD) Introduction and Transaction Overview Note: Balance sheet data as of July 31, 2025. (1) Reflects 10% withholding tax on excess cash held at onshore entities. (2) Fixed term deposits including accrued interests at commercial banks; reflects 10% withholding tax. (3) Book value of rental deposits per management of the Company; reflects 10% withholding tax. (4) Book value of equity interests in Shanghai Yurong Culture and Art Co., Ltd. and Hurun Baixue (Shanghai) Industrial Co., Ltd. as of July 31, 2025; reflects 10% withholding tax. (5) Book value of net amount due to related parties. (6) Reflects the 30% non - controlling interests in Can - achieve (Beijing) Education Consulting Co., Ltd. and 30% non - controlling interests in Hangzhou Impression Arts Training Co., Ltd.
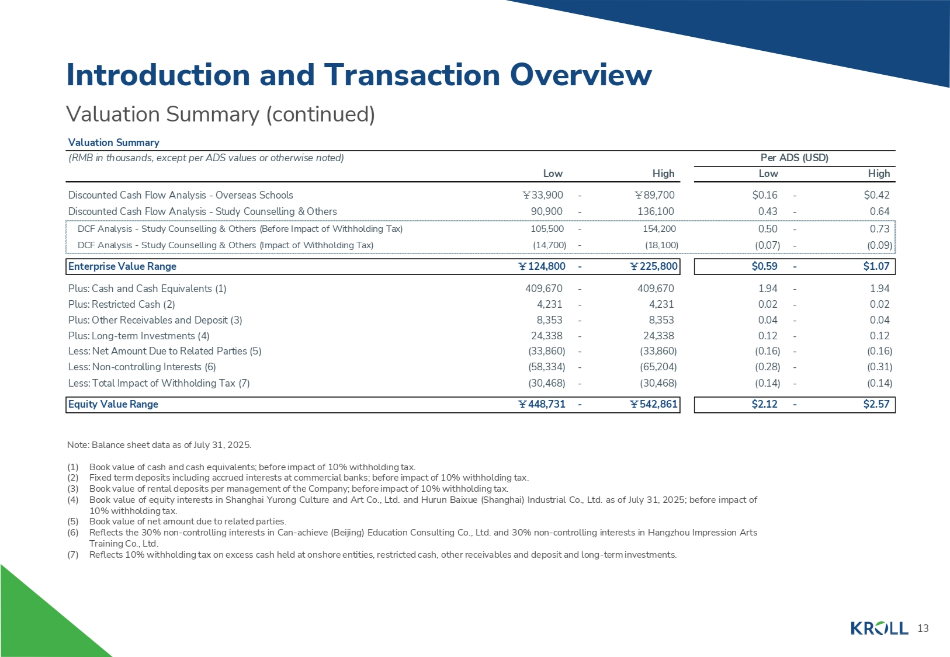
Valuation Summary (continued) Valuation Summary Introduction and Transaction Overview (RMB in thousands, except per ADS values or otherwise noted) Per ADS (USD) Low High Low High $0.42 - $0.16 ̞ 89,700 - ̞ 33,900 Discounted Cash Flow Analysis - Overseas Schools 0.64 - 0.43 136,100 - 90,900 Discounted Cash Flow Analysis - Study Counselling & Others 0.73 - 0.50 154,200 - 105,500 DCF Analysis - Study Counselling & Others (Before Impact of Withholding Tax) (0.09) - (0.07) (18,100) - (14,700) DCF Analysis - Study Counselling & Others (Impact of Withholding Tax) $1.07 - $0.59 ̞ 225,800 - ̞ 124,800 Enterprise Value Range 1.94 - 1.94 409,670 - 409,670 Plus: Cash and Cash Equivalents (1) 0.02 - 0.02 4,231 - 4,231 Plus: Restricted Cash (2) 0.04 - 0.04 8,353 - 8,353 Plus: Other Receivables and Deposit (3) 0.12 - 0.12 24,338 - 24,338 Plus: Long - term Investments (4) (0.16) - (0.16) (33,860) - (33,860) Less: Net Amount Due to Related Parties (5) (0.31) - (0.28) (65,204) - (58,334) Less: Non - controlling Interests (6) (0.14) - (0.14) (30,468) - (30,468) Less: Total Impact of Withholding Tax (7) $2.57 - $2.12 ̞ 542,861 - ̞ 448,731 Equity Value Range Note: Balance sheet data as of July 31, 2025. (1) Book value of cash and cash equivalents; before impact of 10% withholding tax. (2) Fixed term deposits including accrued interests at commercial banks; before impact of 10% withholding tax. (3) Book value of rental deposits per management of the Company; before impact of 10% withholding tax. (4) Book value of equity interests in Shanghai Yurong Culture and Art Co., Ltd. and Hurun Baixue (Shanghai) Industrial Co., Ltd. as of July 31, 2025; before impact of 10% withholding tax. (5) Book value of net amount due to related parties. (6) Reflects the 30% non - controlling interests in Can - achieve (Beijing) Education Consulting Co., Ltd. and 30% non - controlling interests in Hangzhou Impression Arts Training Co., Ltd. (7) Reflects 10% withholding tax on excess cash held at onshore entities, restricted cash, other receivables and deposit and long - term investments. 13
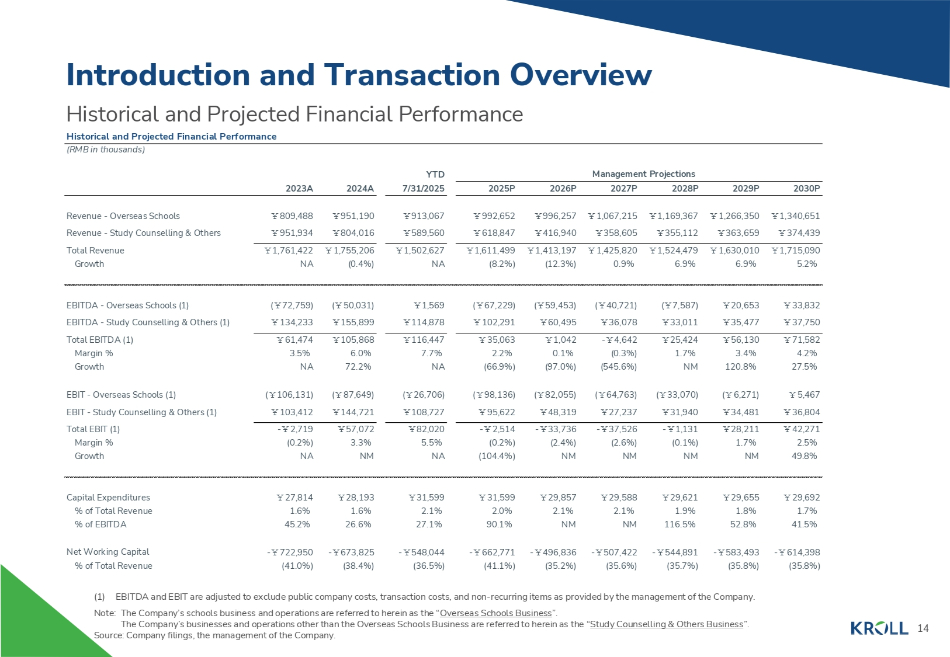
Management Projections YTD 2030P 2029P 2027P 2028P 2026P 2025P 7/31/2025 2023A 2024A ̞ 1,340,651 ̞ 1,266,350 ̞ 1,169,367 ̞ 1,067,215 ̞ 996,257 ̞ 992,652 ̞ 913,067 ̞ 951,190 ̞ 809,488 Revenue - Overseas Schools ̞ 374,439 ̞ 363,659 ̞ 355,112 ̞ 358,605 ̞ 416,940 ̞ 618,847 ̞ 589,560 ̞ 804,016 ̞ 951,934 Revenue - Study Counselling & Others ̞ 1,715,090 ̞ 1,630,010 ̞ 1,524,479 ̞ 1,425,820 ̞ 1,413,197 ̞ 1,611,499 ̞ 1,502,627 ̞ 1,755,206 ̞ 1,761,422 Total Revenue 5.2% 6.9% 6.9% 0.9% (12.3%) (8.2%) NA (0.4%) NA Growth ̞ 33,832 ̞ 20,653 ( ̞ 7,587) ( ̞ 40,721) ( ̞ 59,453) ( ̞ 67,229) ̞ 1,569 ( ̞ 50,031) ( ̞ 72,759) EBITDA - Overseas Schools (1) ̞ 37,750 ̞ 35,477 ̞ 33,011 ̞ 36,078 ̞ 60,495 ̞ 102,291 ̞ 114,878 ̞ 155,899 ̞ 134,233 EBITDA - Study Counselling & Others (1) ̞ 71,582 ̞ 56,130 ̞ 25,424 - ̞ 4,642 ̞ 1,042 ̞ 35,063 ̞ 116,447 ̞ 105,868 ̞ 61,474 Total EBITDA (1) 4.2% 3.4% 1.7% (0.3%) 0.1% 2.2% 7.7% 6.0% 3.5% Margin % 27.5% 120.8% NM (545.6%) (97.0%) (66.9%) NA 72.2% NA Growth ̞ 5,467 ( ̞ 6,271) ( ̞ 33,070) ( ̞ 64,763) ( ̞ 82,055) ( ̞ 98,136) ( ̞ 26,706) ( ̞ 87,649) ( ̞ 106,131) EBIT - Overseas Schools (1) ̞ 36,804 ̞ 34,481 ̞ 31,940 ̞ 27,237 ̞ 48,319 ̞ 95,622 ̞ 108,727 ̞ 144,721 ̞ 103,412 EBIT - Study Counselling & Others (1) ̞ 42,271 ̞ 28,211 - ̞ 1,131 - ̞ 37,526 - ̞ 33,736 - ̞ 2,514 ̞ 82,020 ̞ 57,072 - ̞ 2,719 Total EBIT (1) 2.5% 1.7% (0.1%) (2.6%) (2.4%) (0.2%) 5.5% 3.3% (0.2%) Margin % 49.8% NM NM NM NM (104.4%) NA NM NA Growth ̞ 29,692 ̞ 29,655 ̞ 29,621 ̞ 29,588 ̞ 29,857 ̞ 31,599 ̞ 31,599 ̞ 28,193 ̞ 27,814 Capital Expenditures 1.7% 1.8% 1.9% 2.1% 2.1% 2.0% 2.1% 1.6% 1.6% % of Total Revenue 41.5% 52.8% 116.5% NM NM 90.1% 27.1% 26.6% 45.2% % of EBITDA - ̞ 614,398 - ̞ 583,493 - ̞ 544,891 - ̞ 507,422 - ̞ 496,836 - ̞ 662,771 - ̞ 548,044 - ̞ 673,825 - ̞ 722,950 Net Working Capital (35.8%) (35.8%) (35.7%) (35.6%) (35.2%) (41.1%) (36.5%) (38.4%) (41.0%) % of Total Revenue Historical and Projected Financial Performance Historical and Projected Financial Performance (RMB in thousands) 14 Introduction and Transaction Overview (1) EBITDA and EBIT are adjusted to exclude public company costs, transaction costs, and non - recurring items as provided by the management of the Company. Note: The Company’s schools business and operations are referred to herein as the “ Overseas Schools Business ”. The Company’s businesses and operations other than the Overseas Schools Business are referred to herein as the “ Study Counselling & Others Business ”. Source: Company filings, the management of the Company.

2. Valuation Analysis – Overseas Schools Business
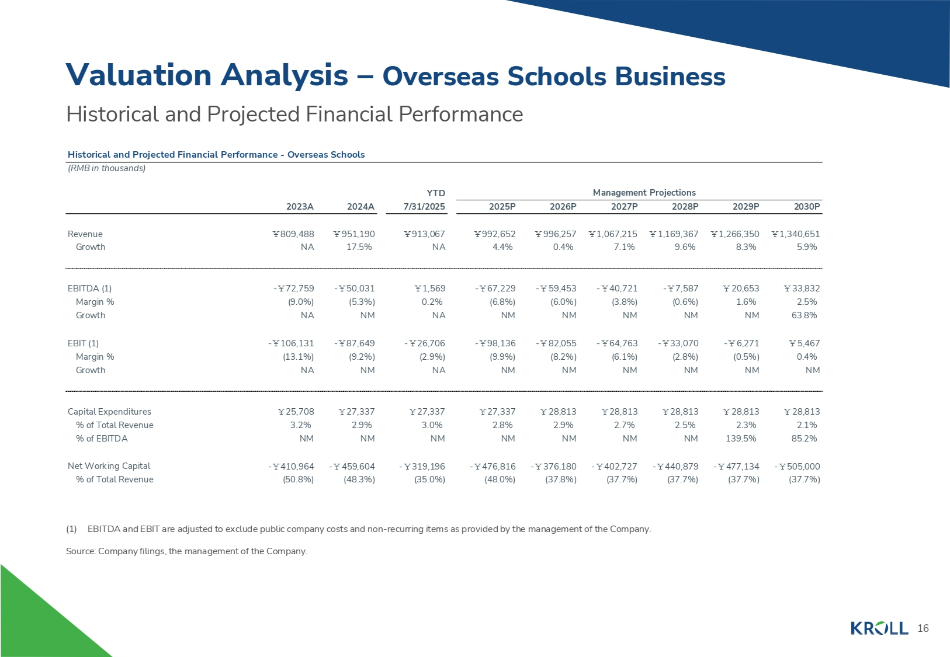
YTD Management Projections 7/31/2025 2025P 2026P 2027P 2028P 2029P 2030P 2023A 2024A ̞ 1,340,651 ̞ 1,266,350 ̞ 1,169,367 ̞ 1,067,215 ̞ 996,257 ̞ 992,652 ̞ 913,067 ̞ 951,190 ̞ 809,488 Revenue 5.9% 8.3% 9.6% 7.1% 0.4% 4.4% NA 17.5% NA Growth ̞ 33,832 2.5% ̞ 20,653 1.6% - ̞ 7,587 (0.6%) - ̞ 40,721 (3.8%) - ̞ 59,453 (6.0%) - ̞ 67,229 (6.8%) ̞ 1,569 0.2% - ̞ 50,031 (5.3%) - ̞ 72,759 (9.0%) EBITDA (1) Margin % 63.8% NM NM NM NM NM NA NM NA Growth ̞ 5,467 - ̞ 6,271 - ̞ 33,070 - ̞ 64,763 - ̞ 82,055 - ̞ 98,136 - ̞ 26,706 - ̞ 87,649 - ̞ 106,131 EBIT (1) 0.4% (0.5%) (2.8%) (6.1%) (8.2%) (9.9%) (2.9%) (9.2%) (13.1%) Margin % NM NM NM NM NM NM NA NM NA Growth ̞ 28,813 2.1% ̞ 28,813 2.3% ̞ 28,813 2.5% ̞ 28,813 2.7% ̞ 28,813 2.9% ̞ 27,337 2.8% ̞ 27,337 3.0% ̞ 27,337 2.9% ̞ 25,708 3.2% Capital Expenditures % of Total Revenue 85.2% 139.5% NM NM NM NM NM NM NM % of EBITDA - ̞ 505,000 - ̞ 477,134 - ̞ 440,879 - ̞ 402,727 - ̞ 376,180 - ̞ 476,816 - ̞ 319,196 - ̞ 459,604 - ̞ 410,964 Net Working Capital (37.7%) (37.7%) (37.7%) (37.7%) (37.8%) (48.0%) (35.0%) (48.3%) (50.8%) % of Total Revenue Historical and Projected Financial Performance Historical and Projected Financial Performance - Overseas Schools (RMB in thousands) Valuation Analysis – Overseas Schools Business 16 (1) EBITDA and EBIT are adjusted to exclude public company costs and non - recurring items as provided by the management of the Company. Source: Company filings, the management of the Company.
Discounted Cash Flow Analysis Methodology and Key Assumptions Discounted Cash Flow Methodology • Duff & Phelps performed a discounted cash flow analysis of the projected unlevered free cash flows. • Unlevered free cash flow is defined as cash generated by the business that is available to either reinvest or to distribute to security holders. • Projected free cash flows are discounted to the present using a discount rate which reflects their relative risk. • The discount rate is equivalent to the rate of return that security holders could expect to realize on alternative investment opportunities with similar risk profiles . Discounted Cash Flow Key Assumptions • Duff & Phelps utilized and relied upon the Management Projections for the fiscal years ending August 31 , 2025 through 2030 (excluding public company expenses, as provided by the management of the Company), discussions with the management of the Company, and a review of the Company’s historical performance and other factors to develop the discounted cash flow (“ DCF ”) analysis . • The following is a summary of the Management Projections for the Overseas Schools Business utilized in the discounted cash flow analysis: – Revenue increases at a compound annual growth rate (“ CAGR ”) of 6.2% from 2025 to 2030. – EBITDA is projected to be negative from 2025 to 2028 and to turn positive in 2029, with EBTIDA margin projected to reach 2.5% by 2030. – Capital expenditures averages 2.5% of total revenue from 2025 to 2030. – Net working capital averages - 39.4% of total revenue from 2025 to 2030. • Beyond the projection period, Duff & Phelps estimated the “terminal value” using a perpetuity formula. • Duff & Phelps discounted the resulting free cash flows and terminal value using a weighted average cost of capital range of 14.0% to 16.0%. 17 Valuation Analysis – Overseas Schools Business
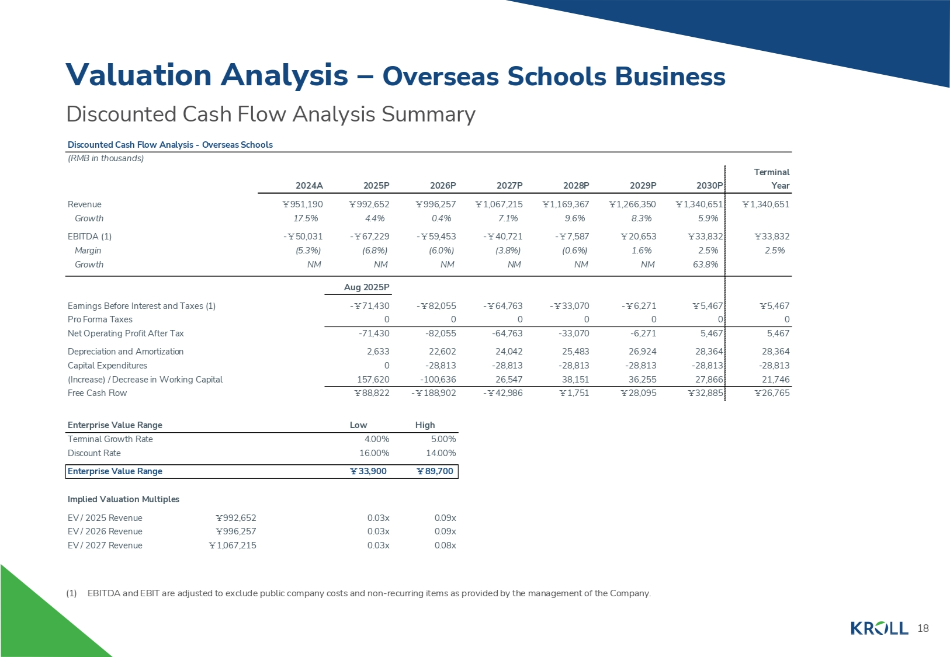
Terminal Year 2030P 2029P 2028P 2027P 2026P 2025P 2024A ̞ 1,340,651 ̞ 1,340,651 ̞ 1,266,350 ̞ 1,169,367 ̞ 1,067,215 ̞ 996,257 ̞ 992,652 ̞ 951,190 5.9% 8.3% 9.6% 7.1% 0.4% 4.4% 17.5% ̞ 33,832 ̞ 33,832 ̞ 20,653 - ̞ 7,587 - ̞ 40,721 - ̞ 59,453 - ̞ 67,229 - ̞ 50,031 2.5% 2.5% 1.6% (0.6%) (3.8%) (6.0%) (6.8%) (5.3%) 63.8% NM NM NM NM NM NM Aug 2025P ̞ 5,467 ̞ 5,467 - ̞ 6,271 - ̞ 33,070 - ̞ 64,763 - ̞ 82,055 - ̞ 71,430 0 0 0 0 0 0 0 5,467 5,467 - 6,271 - 33,070 - 64,763 - 82,055 - 71,430 28,364 28,364 26,924 25,483 24,042 22,602 2,633 - 28,813 - 28,813 - 28,813 - 28,813 - 28,813 - 28,813 0 21,746 27,866 36,255 38,151 26,547 - 100,636 157,620 ̞ 26,765 ̞ 32,885 ̞ 28,095 ̞ 1,751 - ̞ 42,986 - ̞ 188,902 ̞ 88,822 Revenue Growth EBITDA (1) Margin Growth Earnings Before Interest and Taxes (1) Pro Forma Taxes Net Operating Profit After Tax Depreciation and Amortization Capital Expenditures (Increase) / Decrease in Working Capital Free Cash Flow High Low Enterprise Value Range 5.00% 4.00% Terminal Growth Rate 14.00% 16.00% Discount Rate ̞ 89,700 ̞ 33,900 Enterprise Value Range Implied Valuation Multiples 0.09x 0.03x ̞ 992,652 EV / 2025 Revenue 0.09x 0.03x ̞ 996,257 EV / 2026 Revenue 0.08x 0.03x ̞ 1,067,215 EV / 2027 Revenue Discounted Cash Flow Analysis Summary Discounted Cash Flow Analysis - Overseas Schools (RMB in thousands) Valuation Analysis – Overseas Schools Business 18 (1) EBITDA and EBIT are adjusted to exclude public company costs and non - recurring items as provided by the management of the Company.
Selected Public Companies / M&A Transactions Analysis Methodology Selected Public Companies Analysis • Duff & Phelps selected seventeen publicly traded companies that were deemed relevant to its analysis. • Duff & Phelps analyzed the financial performance of each of the publicly traded companies. Duff & Phelps then analyzed the selected public companies’ trading multiples, including enterprise value to revenue and enterprise value to EBITDA. Selected M&A Transactions Analysis • Duff & Phelps also reviewed certain merger and acquisition transactions involving target companies that were deemed relevant to its analysis and computed the implied valuation multiples for such transactions. Due to the limited comparability of the financial metrics of the selected public companies and the targets in the selected M&A transactions relative to those of the Overseas Schools Business, rather than applying a range of selected multiples from a review of the public companies and M&A transactions, Duff & Phelps reviewed various valuation multiples for the Overseas Schools Business implied by the valuation range determined from the DCF analysis in the context of the Overseas Schools Business’s relative size, forecasted growth in revenue and profits, profit margins, capital spending, and other characteristics that we deemed relevant . None of the companies utilized for comparative purposes in the following analysis are directly comparable to the Company, and none of the transactions utilized for comparative purposes in the following analysis are directly comparable to the Proposed Transaction . Duff & Phelps does not have access to non - public information of any of the companies used for comparative purposes . Accordingly, a complete valuation analysis of the Company and the Proposed Transaction cannot rely solely upon a quantitative review of the selected companies and selected transactions and involves complex considerations and judgments concerning differences in financial and operating characteristics of such companies and targets, as well as other factors that could affect their value relative to that of the Company . Therefore, the Selected Public Companies / Selected M&A Transactions Analysis is subject to certain limitations . 19 Valuation Analysis – Overseas Schools Business

EBITDA MARGIN 2 - YR EBITDA GROWTH REVENUE GROWTH COMPANY INFORMATION 2026 2025 AVG 2027 2026 2025 2024 2027 2026 2025 2024 Company Name 51.2% 52.9% 50.5% 3.6% 3.8% 16.8% 14.2% 6.6% 7.2% 10.3% 17.1% China Education Companies China Education Group Holdings Limited NA NA 58.8 NA NA NA 4.8 NA NA NA 11.6 China Kepei Education Group Limited NA NA 33.9 NA NA NA 19.0 NA NA NA 6.7 China Maple Leaf Educational Systems Limited 58.4 61.5 51.2 1.1 1.0 27.6 - 3.1 3.8 6.4 2.2 4.4 China YuHua Education Corporation Limited NA NA - 2.8 NA NA NA NM NA NA NA 100.1 Four Seasons Education (Cayman) Inc. NA NA - 109.3 NA NA NA NM NA NA NA - 35.5 Lixiang Education Holding Co., Ltd. NA NA 31.9 NA NA NA 26.0 NA NA NA 25.3 Virscend Education Company Limited NA NA 35.3 NA NA NA - 66.0 NA NA NA - 43.3 Wisdom Education International Holdings Company Limited NA NA 34.5 NA NA NA - 5.9 NA NA NA 4.2 XJ International Holdings Co., Ltd. 54.8% 57.2% 20.4% 2.3% 2.4% 22.2% - 1.6% 5.2% 6.8% 6.2% 10.1% Mean 54.8% 57.2% 34.5% 2.3% 2.4% 22.2% 4.8% 5.2% 6.8% 6.2% 6.7% Median Global Education Companies 9.4% 9.4% 10.6% 3.6% 4.4% 5.6% 14.0% 3.9% 4.4% 16.7% 11.5% AcadeMedia AB (publ) 30.9 31.5 27.2 NA 5.3 25.9 7.7 NA 7.4 12.4 0.2 Ataa Educational Company 15.5 14.7 12.6 12.1 12.4 13.6 39.0 8.3 6.8 8.3 11.1 Bright Horizons Family Solutions Inc. NA NA 6.7 NA NA NA - 18.2 NA 3.8 0.2 1.4 Kyoshin Co., Ltd. 8.9 8.7 6.4 7.7 7.8 56.5 - 0.9 5.7 5.2 10.3 8.2 Meiko Network Japan Co., Ltd. 35.4 35.9 31.7 12.3 10.5 8.7 67.7 12.1 12.0 5.6 36.7 National Company for Learning and Education 27.9 26.6 24.8 8.9 44.2 16.0 7.5 13.7 37.1 2.7 19.2 Taaleem Holdings PJSC 14.0 13.3 13.2 7.1 11.9 3.3 18.8 6.7 6.6 8.4 6.7 Waseda Academy Co., Ltd. 20.3% 20.0% 16.7% 8.6% 13.8% 18.5% 17.0% 8.4% 10.4% 8.1% 11.9% Mean 15.5% 14.7% 12.9% 8.3% 10.5% 13.6% 10.8% 7.5% 6.7% 8.3% 9.6% Median 28.0% 28.3% 18.7% 7.0% 11.2% 19.3% 8.3% 7.6% 9.7% 7.7% 10.9% Aggregate Mean 27.9% 26.6% 27.2% 7.4% 7.8% 16.0% 7.7% 6.6% 6.7% 8.3% 8.2% Aggregate Median - 6.0% - 6.8% - 7.1% NM NM NM NM 7.1% 0.4% 4.4% 17.5% Bright Scholar Education Holdings Limited - Overseas Schools EBITDA = Earnings Before Interest, Taxes, Depreciation and Amortization 20 Selected Public Companies Analysis – Financial Metrics Selected Public Companies Analysis As of October 10, 2025 Valuation Analysis – Overseas Schools Business Note: The Company’s EBITDA is adjusted to exclude public company costs and non - recurring items as provided by Company management. Source: Capital IQ, Bloomberg, SEC Filings, Annual and Interim Reports.
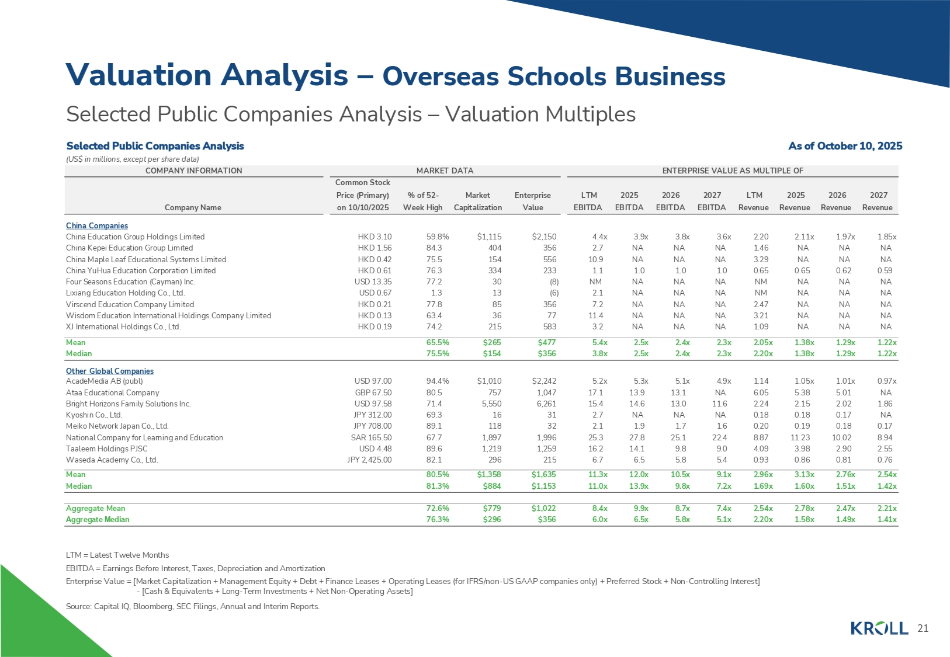
As of October 10, 2025 COMPANY INFORMATION MARKET DATA ENTERPRISE VALUE AS MULTIPLE OF Common Stock Price (Primary) % of 52 - Market Enterprise Company Name on 10/10/2025 Week High Capitalization Value LTM 2025 2026 2027 LTM 2025 2026 2027 EBITDA EBITDA EBITDA EBITDA Revenue Revenue Revenue Revenue China Companies 1.85x 1.97x 2.11x 2.20 3.6x 3.8x 3.9x 4.4x $2,150 $1,115 59.8% HKD 3.10 China Education Group Holdings Limited NA NA NA 1.46 NA NA NA 2.7 356 404 84.3 HKD 1.56 China Kepei Education Group Limited NA NA NA 3.29 NA NA NA 10.9 556 154 75.5 HKD 0.42 China Maple Leaf Educational Systems Limited 0.59 0.62 0.65 0.65 1.0 1.0 1.0 1.1 233 334 76.3 HKD 0.61 China YuHua Education Corporation Limited NA NA NA NM NA NA NA NM (8) 30 77.2 USD 13.35 Four Seasons Education (Cayman) Inc. NA NA NA NM NA NA NA 2.1 (6) 13 1.3 USD 0.67 Lixiang Education Holding Co., Ltd. NA NA NA 2.47 NA NA NA 7.2 356 85 77.8 HKD 0.21 Virscend Education Company Limited NA NA NA 3.21 NA NA NA 11.4 77 36 63.4 HKD 0.13 Wisdom Education International Holdings Company Limited NA NA NA 1.09 NA NA NA 3.2 583 215 74.2 HKD 0.19 XJ International Holdings Co., Ltd. 1.22x 1.29x 1.38x 2.05x 2.3x 2.4x 2.5x 5.4x $477 $265 65.5% Mean 1.22x 1.29x 1.38x 2.20x 2.3x 2.4x 2.5x 3.8x $356 $154 75.5% Median 0.97x 1.01x 1.05x 1.14 4.9x 5.1x 5.3x 5.2x $2,242 $1,010 94.4% USD 97.00 Other Global Companies AcadeMedia AB (publ) NA 5.01 5.38 6.05 NA 13.1 13.9 17.1 1,047 757 80.5 GBP 67.50 Ataa Educational Company 1.86 2.02 2.15 2.24 11.6 13.0 14.6 15.4 6,261 5,550 71.4 USD 97.58 Bright Horizons Family Solutions Inc. NA 0.17 0.18 0.18 NA NA NA 2.7 31 16 69.3 JPY 312.00 Kyoshin Co., Ltd. 0.17 0.18 0.19 0.20 1.6 1.7 1.9 2.1 32 118 89.1 JPY 708.00 Meiko Network Japan Co., Ltd. 8.94 10.02 11.23 8.87 22.4 25.1 27.8 25.3 1,996 1,897 67.7 SAR 165.50 National Company for Learning and Education 2.55 2.90 3.98 4.09 9.0 9.8 14.1 16.2 1,259 1,219 89.6 USD 4.48 Taaleem Holdings PJSC 0.76 0.81 0.86 0.93 5.4 5.8 6.5 6.7 215 296 82.1 JPY 2,425.00 Waseda Academy Co., Ltd. 2.54x 2.76x 3.13x 2.96x 9.1x 10.5x 12.0x 11.3x $1,635 $1,358 80.5% Mean 1.42x 1.51x 1.60x 1.69x 7.2x 9.8x 13.9x 11.0x $1,153 $884 81.3% Median 2.21x 2.47x 2.78x 2.54x 7.4x 8.7x 9.9x 8.4x $1,022 $779 72.6% Aggregate Mean 1.41x 1.49x 1.58x 2.20x 5.1x 5.8x 6.5x 6.0x $356 $296 76.3% Aggregate Median Selected Public Companies Analysis – Valuation Multiples Selected Public Companies Analysis (US$ in millions, except per share data) 21 Valuation Analysis – Overseas Schools Business LTM = Latest Twelve Months EBITDA = Earnings Before Interest, Taxes, Depreciation and Amortization Enterprise Value = [Market Capitalization + Management Equity + Debt + Finance Leases + Operating Leases (for IFRS/non - US GAAP companies only) + Preferred Stock + Non - Controlling Interest] - [Cash & Equivalents + Long - Term Investments + Net Non - Operating Assets] Source: Capital IQ, Bloomberg, SEC Filings, Annual and Interim Reports.
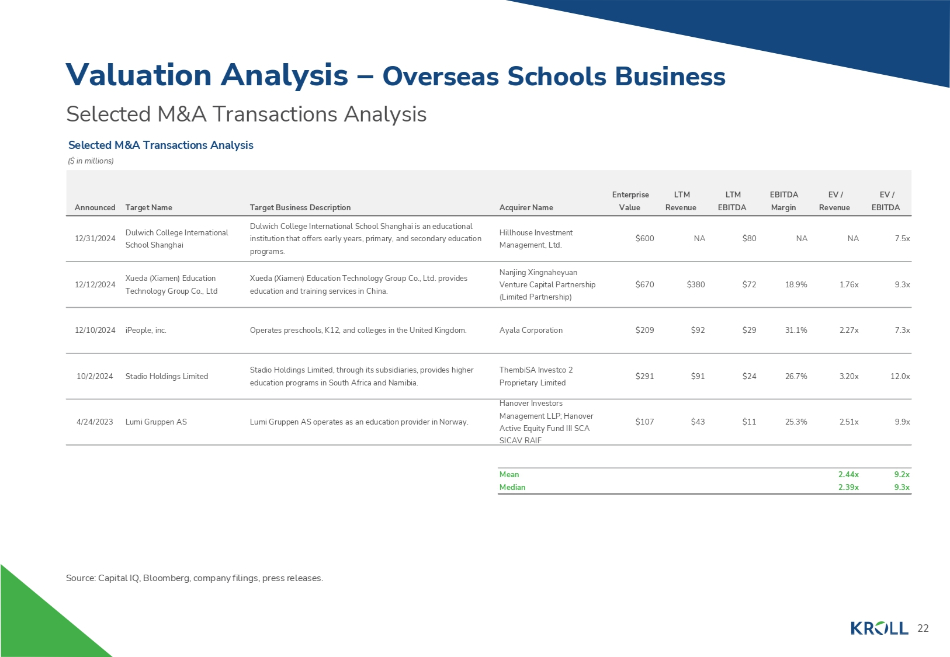
Selected M&A Transactions Analysis Selected M&A Transactions Analysis ($ in millions) Valuation Analysis – Overseas Schools Business Source: Capital IQ, Bloomberg, company filings, press releases. EV / EV / EBITDA LTM LTM Enterprise EBITDA Revenue Margin EBITDA Revenue Value Acquirer Name Target Business Description Target Name Announced 12/31/2024 Dulwich College International School Shanghai Dulwich College International School Shanghai is an educational institution that offers early years, primary, and secondary education programs. Hillhouse Investment Management, Ltd. $600 NA $80 NA NA 7.5x 12/12/2024 Xueda (Xiamen) Education Technology Group Co., Ltd Xueda (Xiamen) Education Technology Group Co., Ltd. provides education and training services in China. Nanjing Xingnaheyuan Venture Capital Partnership (Limited Partnership) $670 $380 $72 18.9% 1.76x 9.3x 12/10/2024 iPeople, inc. Operates preschools, K12, and colleges in the United Kingdom. Ayala Corporation $209 $92 $29 31.1% 2.27x 7.3x 10/2/2024 Stadio Holdings Limited Stadio Holdings Limited, through its subsidiaries, provides higher education programs in South Africa and Namibia. ThembiSA Investco 2 Proprietary Limited $291 $91 $24 26.7% 3.20x 12.0x 4/24/2023 Lumi Gruppen AS Lumi Gruppen AS operates as an education provider in Norway. Hanover Investors Management LLP; Hanover Active Equity Fund III SCA SICAV RAIF $107 $43 $11 25.3% 2.51x 9.9x Mean Median 2.44x 2.39x 9.2x 9.3x 22
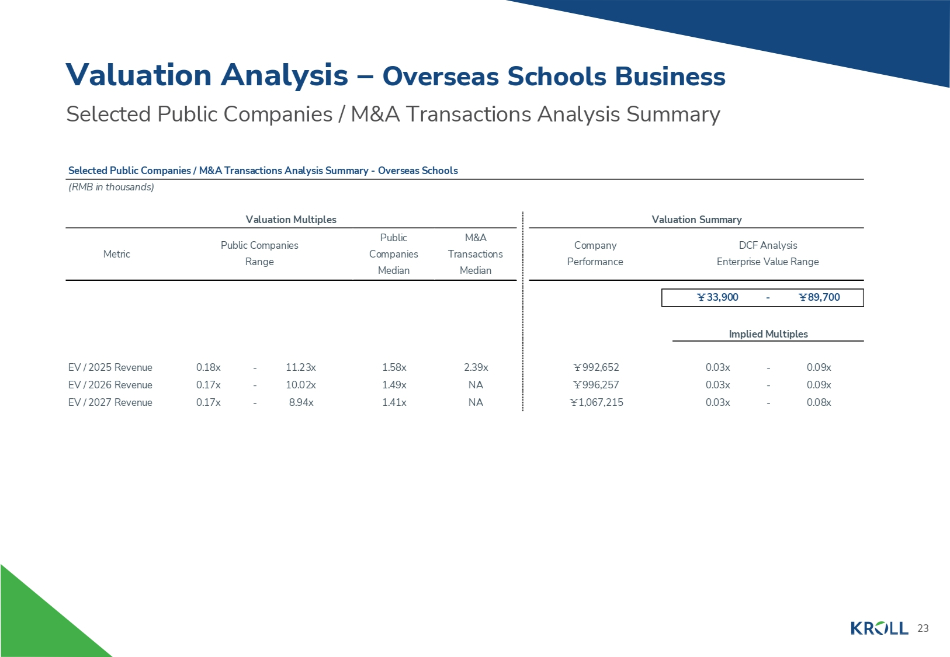
Selected Public Companies / M&A Transactions Analysis Summary - Overseas Schools (RMB in thousands) Valuation Multiples Valuation Summary Metric Public Companies Range Public Companies Median M&A Transactions Median Company Performance DCF Analysis Enterprise Value Range ̞ 33,900 - ̞ 89,700 Implied Multiples 2.39x 1.58x - 11.23x 0.18x EV / 2025 Revenue NA 1.49x - 10.02x 0.17x EV / 2026 Revenue NA 1.41x - 8.94x 0.17x EV / 2027 Revenue - 0.09x 0.03x ̞ 992,652 - 0.09x 0.03x ̞ 996,257 - 0.08x 0.03x ̞ 1,067,215 Valuation Analysis – Overseas Schools Business Selected Public Companies / M&A Transactions Analysis Summary 23

3. Valuation Analysis – Study Counselling & Others Business
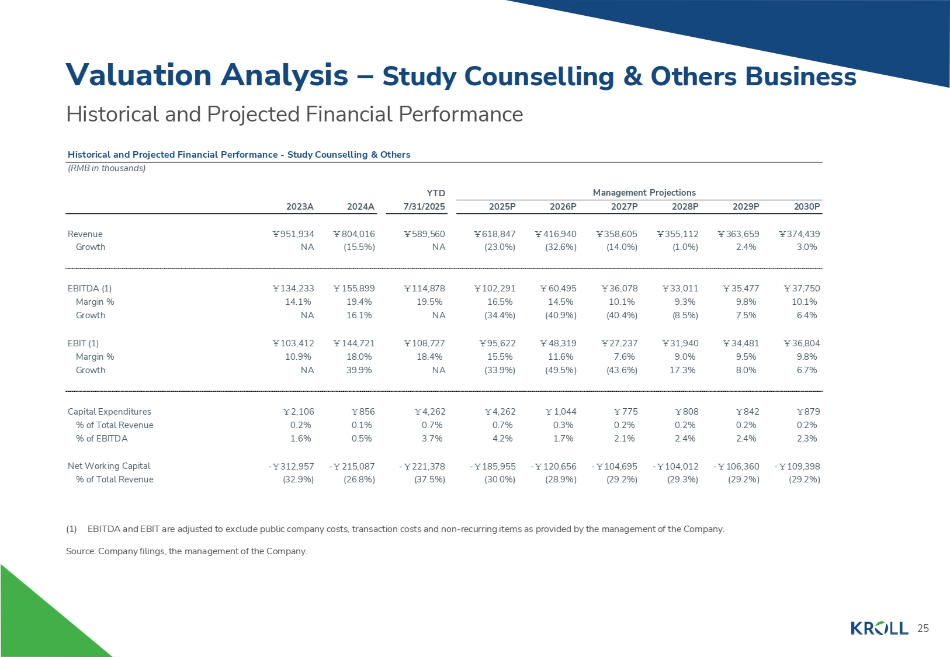
YTD Management Projections 7/31/2025 2025P 2026P 2027P 2028P 2029P 2030P 2023A 2024A ̞ 374,439 ̞ 363,659 ̞ 355,112 ̞ 358,605 ̞ 416,940 ̞ 618,847 ̞ 589,560 ̞ 804,016 ̞ 951,934 Revenue 3.0% 2.4% (1.0%) (14.0%) (32.6%) (23.0%) NA (15.5%) NA Growth ̞ 37,750 10.1% ̞ 35,477 9.8% ̞ 33,011 9.3% ̞ 36,078 10.1% ̞ 60,495 14.5% ̞ 102,291 16.5% ̞ 114,878 19.5% ̞ 155,899 19.4% ̞ 134,233 14.1% EBITDA (1) Margin % 6.4% 7.5% (8.5%) (40.4%) (40.9%) (34.4%) NA 16.1% NA Growth ̞ 36,804 ̞ 34,481 ̞ 31,940 ̞ 27,237 ̞ 48,319 ̞ 95,622 ̞ 108,727 ̞ 144,721 ̞ 103,412 EBIT (1) 9.8% 9.5% 9.0% 7.6% 11.6% 15.5% 18.4% 18.0% 10.9% Margin % 6.7% 8.0% 17.3% (43.6%) (49.5%) (33.9%) NA 39.9% NA Growth ̞ 879 0.2% ̞ 842 0.2% ̞ 808 0.2% ̞ 775 0.2% ̞ 1,044 0.3% ̞ 4,262 0.7% ̞ 4,262 0.7% ̞ 856 0.1% ̞ 2,106 0.2% Capital Expenditures % of Total Revenue 2.3% 2.4% 2.4% 2.1% 1.7% 4.2% 3.7% 0.5% 1.6% % of EBITDA - ̞ 109,398 - ̞ 106,360 - ̞ 104,012 - ̞ 104,695 - ̞ 120,656 - ̞ 185,955 - ̞ 221,378 - ̞ 215,087 - ̞ 312,957 Net Working Capital (29.2%) (29.2%) (29.3%) (29.2%) (28.9%) (30.0%) (37.5%) (26.8%) (32.9%) % of Total Revenue Historical and Projected Financial Performance Historical and Projected Financial Performance - Study Counselling & Others (RMB in thousands) Valuation Analysis – Study Counselling & Others Business 25 (1) EBITDA and EBIT are adjusted to exclude public company costs, transaction costs and non - recurring items as provided by the management of the Company. Source: Company filings, the management of the Company.
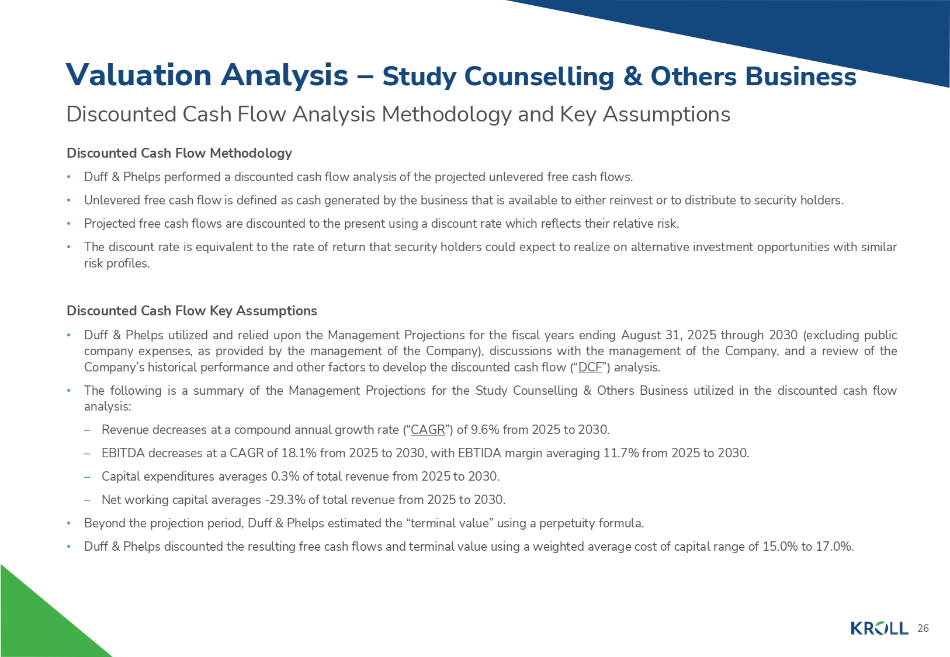
Discounted Cash Flow Analysis Methodology and Key Assumptions Discounted Cash Flow Methodology • Duff & Phelps performed a discounted cash flow analysis of the projected unlevered free cash flows. • Unlevered free cash flow is defined as cash generated by the business that is available to either reinvest or to distribute to security holders. • Projected free cash flows are discounted to the present using a discount rate which reflects their relative risk. • The discount rate is equivalent to the rate of return that security holders could expect to realize on alternative investment opportunities with similar risk profiles . Discounted Cash Flow Key Assumptions • Duff & Phelps utilized and relied upon the Management Projections for the fiscal years ending August 31 , 2025 through 2030 (excluding public company expenses, as provided by the management of the Company), discussions with the management of the Company, and a review of the Company’s historical performance and other factors to develop the discounted cash flow (“ DCF ”) analysis . • The following is a summary of the Management Projections for the Study Counselling & Others Business utilized in the discounted cash flow analysis : – Revenue decreases at a compound annual growth rate (“ CAGR ”) of 9.6% from 2025 to 2030. – EBITDA decreases at a CAGR of 18.1% from 2025 to 2030, with EBTIDA margin averaging 11.7% from 2025 to 2030. – Capital expenditures averages 0.3% of total revenue from 2025 to 2030. – Net working capital averages - 29.3% of total revenue from 2025 to 2030. • Beyond the projection period, Duff & Phelps estimated the “terminal value” using a perpetuity formula. • Duff & Phelps discounted the resulting free cash flows and terminal value using a weighted average cost of capital range of 15.0% to 17.0%. 26 Valuation Analysis – Study Counselling & Others Business
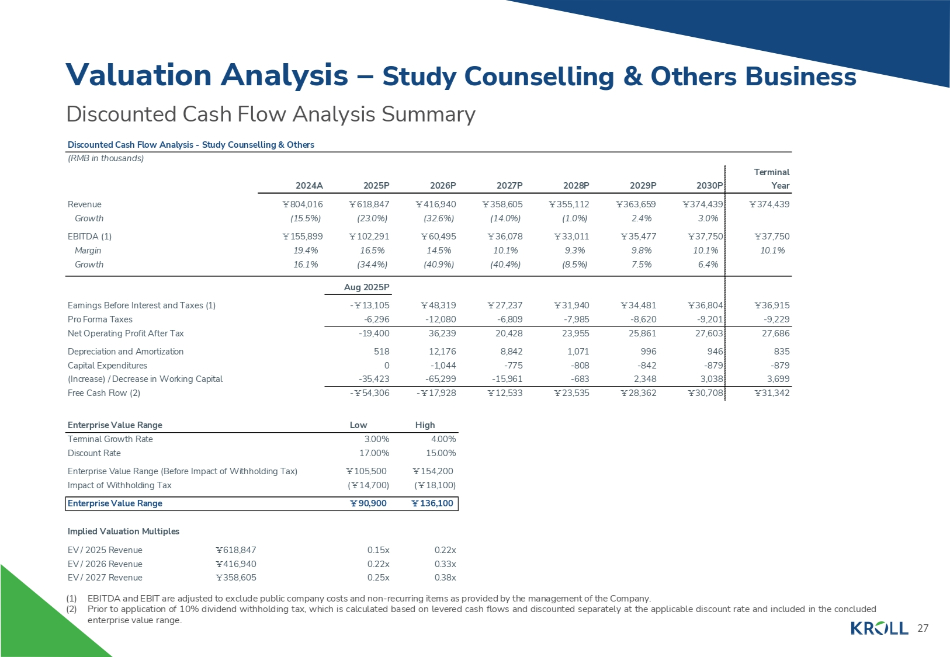
Terminal Year 2030P 2029P 2028P 2027P 2026P 2025P 2024A ̞ 374,439 ̞ 374,439 ̞ 363,659 ̞ 355,112 ̞ 358,605 ̞ 416,940 ̞ 618,847 Revenue ̞ 804,016 3.0% 2.4% (1.0%) (14.0%) (32.6%) (23.0%) Growth (15.5%) ̞ 37,750 ̞ 37,750 ̞ 35,477 ̞ 33,011 ̞ 36,078 ̞ 60,495 ̞ 102,291 EBITDA (1) ̞ 155,899 10.1% 10.1% 9.8% 9.3% 10.1% 14.5% 16.5% Margin 19.4% 6.4% 7.5% (8.5%) (40.4%) (40.9%) (34.4%) Growth 16.1% Aug 2025P ̞ 36,915 ̞ 36,804 ̞ 34,481 ̞ 31,940 ̞ 27,237 ̞ 48,319 - ̞ 13,105 Earnings Before Interest and Taxes (1) - 9,229 - 9,201 - 8,620 - 7,985 - 6,809 - 12,080 - 6,296 Pro Forma Taxes 27,686 27,603 25,861 23,955 20,428 36,239 - 19,400 Net Operating Profit After Tax 835 946 996 1,071 8,842 12,176 518 Depreciation and Amortization - 879 - 879 - 842 - 808 - 775 - 1,044 0 Capital Expenditures 3,699 3,038 2,348 - 683 - 15,961 - 65,299 - 35,423 (Increase) / Decrease in Working Capital ̞ 31,342 ̞ 30,708 ̞ 28,362 ̞ 23,535 ̞ 12,533 - ̞ 17,928 - ̞ 54,306 Free Cash Flow (2) High Low Enterprise Value Range 4.00% 3.00% Terminal Growth Rate 15.00% 17.00% Discount Rate ̞ 154,200 ( ̞ 18,100) ̞ 105,500 ( ̞ 14,700) Enterprise Value Range (Before Impact of Withholding Tax) Impact of Withholding Tax ̞ 136,100 ̞ 90,900 Enterprise Value Range Implied Valuation Multiples 0.22x 0.33x 0.38x 0.15x 0.22x 0.25x EV / 2025 Revenue ̞ 618,847 EV / 2026 Revenue ̞ 416,940 EV / 2027 Revenue ̞ 358,605 Discounted Cash Flow Analysis Summary Discounted Cash Flow Analysis - Study Counselling & Others (RMB in thousands) Valuation Analysis – Study Counselling & Others Business 27 (1) EBITDA and EBIT are adjusted to exclude public company costs and non - recurring items as provided by the management of the Company. (2) Prior to application of 10% dividend withholding tax, which is calculated based on levered cash flows and discounted separately at the applicable discount rate and included in the concluded enterprise value range.
Selected Public Companies / M&A Transactions Analysis Methodology Selected Public Companies Analysis • Duff & Phelps selected six publicly traded companies that were deemed relevant to its analysis. • Duff & Phelps analyzed the financial performance of each of the publicly traded companies. Duff & Phelps then analyzed the selected public companies’ trading multiples, , including enterprise value to revenue and enterprise value to EBITDA. Selected M&A Transactions Analysis • Duff & Phelps also reviewed certain merger and acquisition transactions involving target companies that were deemed relevant to its analysis and computed the implied valuation multiples for such transactions. Due to the limited comparability of the financial metrics of the selected public companies and the targets in the selected M&A transactions relative to those of the Study Counselling & Others Business, rather than applying a range of selected multiples from a review of the public companies and M&A transactions, Duff & Phelps reviewed various valuation multiples for the Study Counselling & Others Business implied by the valuation range determined from the DCF analysis in the context of the Study Counselling & Others Business’s relative size, forecasted growth in revenue and profits, profit margins, capital spending, and other characteristics that we deemed relevant . None of the companies utilized for comparative purposes in the following analysis are directly comparable to the Company, and none of the transactions utilized for comparative purposes in the following analysis are directly comparable to the Proposed Transaction . Duff & Phelps does not have access to non - public information of any of the companies used for comparative purposes . Accordingly, a complete valuation analysis of the Company and the Proposed Transaction cannot rely solely upon a quantitative review of the selected companies and selected transactions and involves complex considerations and judgments concerning differences in financial and operating characteristics of such companies and targets, as well as other factors that could affect their value relative to that of the Company . Therefore, the Selected Public Companies / Selected M&A Transactions Analysis is subject to certain limitations . 28 Valuation Analysis – Study Counselling & Others Business
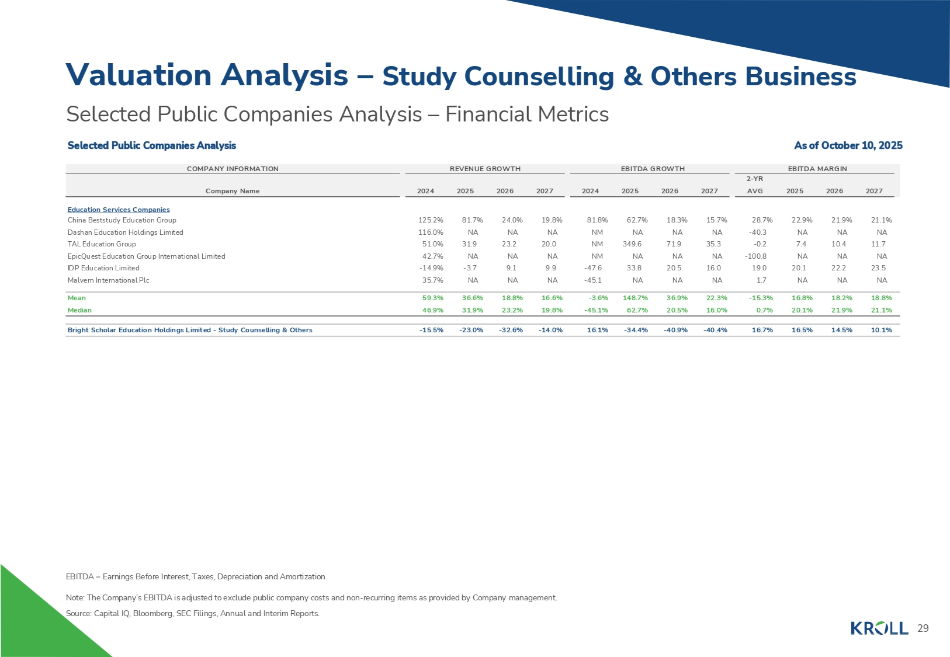
EBITDA 2 - YR ROWTH EBITDA G ROWTH REVENUE G COMPANY INFORMATION 2026 2025 AVG 2027 2026 2025 2024 2027 2026 2025 2024 Company Name 21.9% 22.9% 28.7% 15.7% 18.3% 62.7% 81.8% 19.8% 24.0% 81.7% 125.2% Education Services Companies China Beststudy Education Group NA NA - 40.3 NA NA NA NM NA NA NA 116.0% Dashan Education Holdings Limited 10.4 7.4 - 0.2 35.3 71.9 349.6 NM 20.0 23.2 31.9 51.0% TAL Education Group NA NA - 100.8 NA NA NA NM NA NA NA 42.7% EpicQuest Education Group International Limited 22.2 20.1 19.0 16.0 20.5 33.8 - 47.6 9.9 9.1 - 3.7 - 14.9% IDP Education Limited NA NA 1.7 NA NA NA - 45.1 NA NA NA 35.7% Malvern International Plc 18.2% 16.8% - 15.3% 22.3% 36.9% 148.7% - 3.6% 16.6% 18.8% 36.6% 59.3% Mean 21.9% 20.1% 0.7% 16.0% 20.5% 62.7% - 45.1% 19.8% 23.2% 31.9% 46.9% Median 14.5% 16.5% 16.7% - 40.4% - 40.9% - 34.4% 16.1% - 14.0% - 32.6% - 23.0% - 15.5% Bright Scholar Education Holdings Limited - Study Counselling & Others 29 Selected Public Companies Analysis – Financial Metrics Selected Public Companies Analysis As of October 10, 2025 Valuation Analysis – Study Counselling & Others Business EBITDA = Earnings Before Interest, Taxes, Depreciation and Amortization Note: The Company’s EBITDA is adjusted to exclude public company costs and non - recurring items as provided by Company management. Source: Capital IQ, Bloomberg, SEC Filings, Annual and Interim Reports.
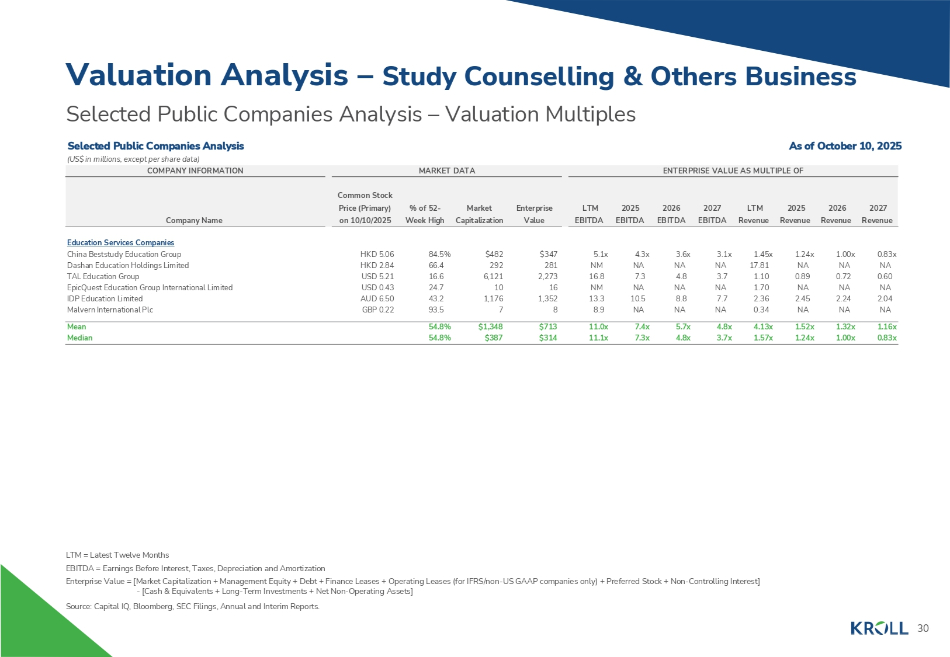
Selected Public Companies Analysis – Valuation Multiples Selected Public Companies Analysis As of October 10, 2025 (US$ in millions, except per share data) COMPANY INFORMATION MARKET DATA ENTERPRISE VALUE AS MULTIPLE OF Common Stock Price (Primary) % of 52 - Market Enterprise Company Name on 10/10/2025 Week High Capitalization Value LTM 2025 2026 2027 LTM 2025 2026 2027 EBITDA EBITDA EBITDA EBITDA Revenue Revenue Revenue Revenue 0.83x 1.00x 1.24x 1.45x 3.1x 3.6x 4.3x 5.1x $347 $482 84.5% HKD 5.06 Education Services Companies China Beststudy Education Group NA NA NA 17.81 NA NA NA NM 281 292 66.4 HKD 2.84 Dashan Education Holdings Limited 0.60 0.72 0.89 1.10 3.7 4.8 7.3 16.8 2,273 6,121 16.6 USD 5.21 TAL Education Group NA NA NA 1.70 NA NA NA NM 16 10 24.7 USD 0.43 EpicQuest Education Group International Limited 2.04 2.24 2.45 2.36 7.7 8.8 10.5 13.3 1,352 1,176 43.2 AUD 6.50 IDP Education Limited NA NA NA 0.34 NA NA NA 8.9 8 7 93.5 GBP 0.22 Malvern International Plc 1.16x 1.32x 1.52x 4.13x 4.8x 5.7x 7.4x 11.0x $713 $1,348 54.8% Mean 0.83x 1.00x 1.24x 1.57x 3.7x 4.8x 7.3x 11.1x $314 $387 54.8% Median Valuation Analysis – Study Counselling & Others Business 30 LTM = Latest Twelve Months EBITDA = Earnings Before Interest, Taxes, Depreciation and Amortization Enterprise Value = [Market Capitalization + Management Equity + Debt + Finance Leases + Operating Leases (for IFRS/non - US GAAP companies only) + Preferred Stock + Non - Controlling Interest] - [Cash & Equivalents + Long - Term Investments + Net Non - Operating Assets] Source: Capital IQ, Bloomberg, SEC Filings, Annual and Interim Reports.
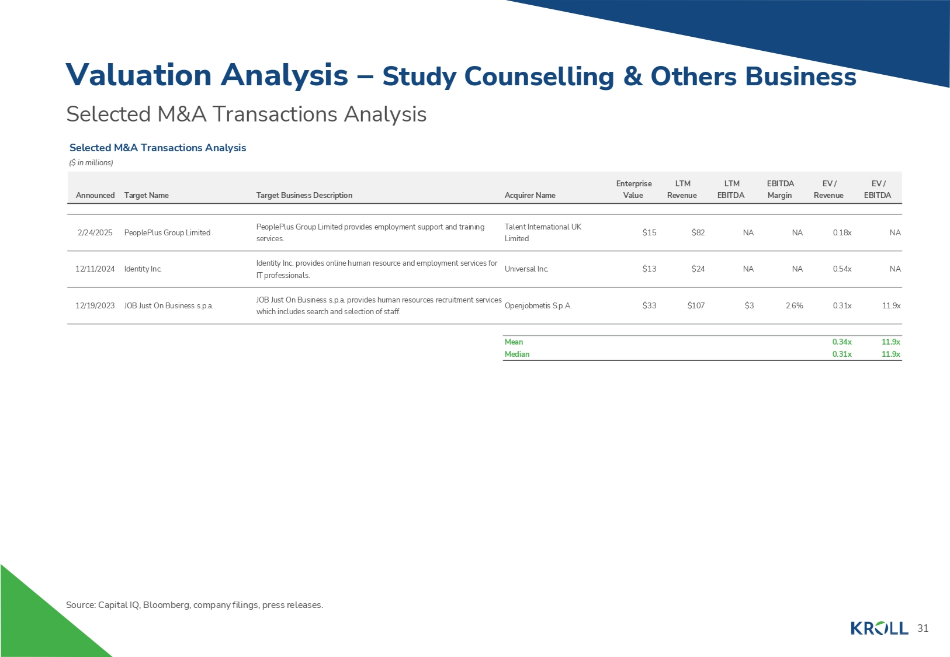
Selected M&A Transactions Analysis Selected M&A Transactions Analysis ($ in millions) Valuation Analysis – Study Counselling & Others Business Source: Capital IQ, Bloomberg, company filings, press releases. EV / EV / EBITDA LTM LTM Enterprise EBITDA Revenue Margin EBITDA Revenue Value Acquirer Name Target Business Description Announced Target Name 2/24/2025 PeoplePlus Group Limited PeoplePlus Group Limited provides employment support and training services. Talent International UK Limited 12/11/2024 Identity Inc. Identity Inc. provides online human resource and employment services for Universal Inc. IT professionals. 12/19/2023 JOB Just On Business s.p.a. JOB Just On Business s.p.a. provides human resources recruitment services Openjobmetis S.p.A. which includes search and selection of staff. Mean Median NA 0.18x NA NA $82 $15 NA 0.54x NA NA $24 $13 11.9x 0.31x 2.6% $3 $107 $33 11.9x 11.9x 0.34x 0.31x 31
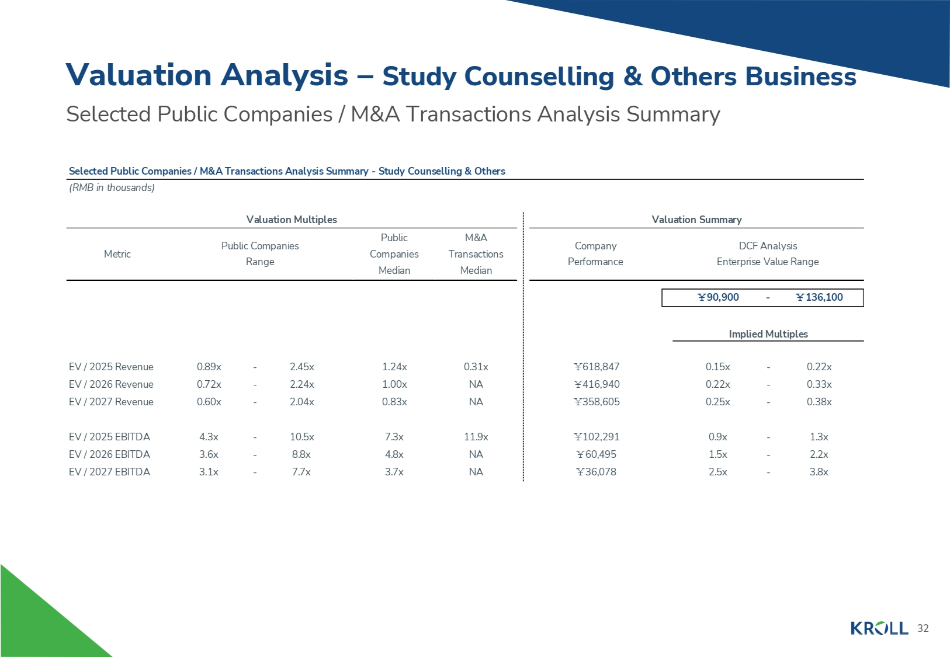
Selected Public Companies / M&A Transactions Analysis Summary - Study Counselling & Others (RMB in thousands) Valuation Multiples Valuation Summary Metric Public Companies Range Public Companies Median M&A Transactions Median Company Performance DCF Analysis Enterprise Value Range ̞ 90,900 - ̞ 136,100 Implied Multiples 0.31x NA NA 1.24x 1.00x 0.83x - 2.45x - 2.24x - 2.04x 0.89x 0.72x 0.60x EV / 2025 Revenue EV / 2026 Revenue EV / 2027 Revenue 11.9x 7.3x - 10.5x 4.3x EV / 2025 EBITDA NA 4.8x - 8.8x 3.6x EV / 2026 EBITDA NA 3.7x - 7.7x 3.1x EV / 2027 EBITDA - 0.22x - 0.33x - 0.38x 0.15x 0.22x 0.25x ̞ 618,847 ̞ 416,940 ̞ 358,605 - 1.3x 0.9x ̞ 102,291 - 2.2x 1.5x ̞ 60,495 - 3.8x 2.5x ̞ 36,078 Valuation Analysis – Study Counselling & Others Business Selected Public Companies / M&A Transactions Analysis Summary 32

About Kroll As the leading independent provider of financial and risk advisory solutions, Kroll leverages our unique insights, data and technology to help clients stay ahead of complex demands. Kroll’s team of more than 6,500 professionals worldwide continues the firm’s nearly 100 - year history of trusted expertise spanning risk, governance, transactions and valuation. Our advanced solutions and intelligence provide clients the foresight they need to create an enduring competitive advantage. At Kroll, our values define who we are and how we partner with clients and communities. Learn more at www.kroll.com . M&A advisory, capital raising and secondary market advisory services in the United States are provided by Kroll Securities, LLC (member FINRA/SIPC) . M&A advisory, capital raising and secondary market advisory services in the United Kingdom are provided by Kroll Securities Ltd . , which is authorized and regulated by the Financial Conduct Authority (FCA) . Valuation Advisory Services in India are provided by Kroll Advisory Private Limited (formerly, Duff & Phelps India Private Limited), under a category 1 merchant banker license issued by the Securities and Exchange Board of India . © 2025 Kroll, LLC. All rights reserved.