Exhibit 4.3

Management’s Discussion & Analysis

OVERVIEW

Boyd Group Services Inc. (“BGSI”), through its operating company, The Boyd Group Inc. and its subsidiaries (“Boyd” or the “Company”), is one of the largest operators of non-franchised collision repair centers in North America in terms of number of locations and sales. The Company currently operates locations in Canada under the trade name Boyd Autobody & Glass and Assured Automotive, as well as in the U.S. under the trade name Gerber Collision & Glass. The Company is also a major retail auto glass operator in the U.S., under the trade names Gerber Collision & Glass, Glass America, Auto Glass Service, Auto Glass Authority and Autoglassonly.com. In addition, the Company operates a third party administrator, Gerber National Claims Services (“GNCS”), that offers glass, emergency roadside and first notice of loss services.The Company also operates a Mobile Auto Solutions (“MAS”) service that offers scanning and calibration services. The following is a geographic breakdown of locations by trade name and location as at March 18, 2025.


LOGO


   984 locations                    
             
LOGO   46
locations
   LOGO       856 locations        

LOGO


Alberta


British Columbia


Manitoba


Saskatchewan


LOGO


Ontario

  16


13


13


4


82

locations


82


Florida ( +4 )*


Michigan ( +1 )*


Illinois


California ( +4 )*


Texas ( +8 )*


Georgia ( +4 )*


New York


Washington ( +1 )*


Wisconsin ( +1 )*


North Carolina ( +1 )*


Indiana ( +1 )*


Ohio


Oklahoma ( +1 )*


Louisiana ( +4 )*


Arizona ( +1 )*


Colorado


South Carolina


80


77


66


52


42


42


41


39


38


37


35


34


28


27


26


22


19


Missouri ( +4 )*


Alabama ( +5 )*


Tennessee ( +3 )*


Maryland ( +1 )*


Minnesota ( +3 )*


Pennsylvania ( +3 )*


Kansas


Oregon


Nevada


Hawaii ( +1 )*


Iowa ( +2 )*


Kentucky


Utah ( +1 )*


Arkansas


Nebraska ( +3 )*


Idaho


Virginia ( +1 )*


17 


15


15


14


14


14


11


11


8


6


6


6


6


3


3


1


1


LOGO


LOGO


LOGO


LOGO


LOGO


The above numbers include 33 intake locations, net of

one closed location


The above numbers include one intake location and two fleet locations co-located

with collision repair centers, net of four closed location


*

Locations added in 2024 and up to March 18, 2025

Boyd provides collision repair services to insurance companies and individual vehicle owners, with a high percentage of the Company’s revenue being derived from insurance-paid collision repair services.

BGSI’s shares trade on the Toronto Stock Exchange under the symbol TSX: BYD.TO.

The following review of BGSI’s operating and financial results for the year ended December 31, 2024, including material transactions and events of BGSI up to and including March 18, 2025, as well as management’s expectations for the year ahead, should be read in conjunction with the annual audited consolidated financial statements of BGSI for the year ended December 31, 2024, included on pages 49 to 91 of the annual report, and as filed on SEDAR+ at www.sedarplus.com.


1

SIGNIFICANT EVENTS

On March 15, 2024, the BGSI Board of Directors declared a cash dividend for the first quarter of 2024 of C$0.15 per common share. The dividend was paid on April 26, 2024 to common shareholders of record at the close of business on March 31, 2024.

On March 26, 2024, BGSI extended its existing revolving credit facilities in the aggregate amount of $550 million for a four- year term, with an accordion feature which can increase the credit facilities to a maximum of $850 million (the “Facilities”). The Facilities will mature in March 2028. The existing $125 million Term Loan A maturing in March 2027 remains unchanged.

On June 17, 2024, the BGSI Board of Directors declared a cash dividend for the second quarter of 2024 of C$0.15 per common share. The dividend was paid on July 29, 2024 to common shareholders of record at the close of business on June 30, 2024.

On August 8, 2024, BGSI announced the appointment of Brian Kaner as President & Chief Operating Officer, effective immediately. Concurrent with this change, Tim O’Day remains Chief Executive Officer (“CEO”), however relinquishes the “President” title, which he has held since 2017.

On September 17, 2024, the BGSI Board of Directors declared a cash dividend for the third quarter of 2024 of C$0.15 per common share. The dividend was paid on October 29, 2024 to common shareholders of record at the close of business on September 30, 2024.

On October 11, 2024, BGSI announced the temporary closure of 47 locations in the states of Florida, Georgia, North Carolina and South Carolina due to Hurricane Helene, followed by the temporary closure of 52 locations in the state of Florida as a result of Hurricane Milton.

On December 2, 2024, the BGSI announced that effective May 14, 2025, Chief Executive Officer Timothy O’Day will step down from his current role, to be succeeded by Brian Kaner, current President and Chief Operating Officer of Boyd. These changes are planned to be effective as of the date of the Annual General Meeting of Boyd, which is scheduled to occur on May 14, 2025.

On December 17, 2024, the BGSI Board of Directors declared a cash dividend for the fourth quarter of 2024 of C$0.153 per common share. The dividend was paid on January 29, 2025 to common shareholders of record at the close of business on December 31, 2024.

On February 26, 2025, BGSI announced the launch of its latest five-year goal designed to drive growth and enhance profitability through 2029.

On March 17, 2025, the BGSI Board of Directors declared a cash dividend for the first quarter of 2025 of C$0.153 per common share. The dividend will be paid on April 28, 2025 to common shareholders of record at the close of business on March 31, 2025.


2


The Company completed and opened the following number of collision repair acquisitions and start up locations during the periods listed:


Location

   Number of locations
added through
acquisition
     Number of start ups      Total  

January 1, 2024 to December 31, 2024

     37        12        49  

January 1, 2025 to March 18, 2025

     3        6        9  


Total

     40        18        58  


During the year ended December 31, 2024, the Company opened seven start-up glass locations, acquired one glass location and four calibration businesses. From January 1, 2025 up to the reporting date of March 18, 2025, the Company acquired two glass location.

OUTLOOK

Boyd is pleased to have announced a new five-year goal, which includes growing revenue to $5 billion in 2029, doubling Adjusted EBITDA1 dollars from 2024-2029, returning to an Adjusted EBITDA margin of 14%, expanding market share and retaining a leadership position in all markets served, and achieving top-tier profitability in the North American collision industry (“Double Down”). Boyd is accelerating its focus on operational excellence and profitability with “Project 360”, a company-wide transformational cost initiative launched in partnership with a leading global consulting firm during the fourth quarter of 2024 that will support the Double Down goal. Project 360 is expected to result in $100 million in annual recurring cost savings over the plan period with upfront investment and transition costs incurred to achieve these benefits estimated to be in the $20-$23 million range over the coming quarters.

In the near term, the market dynamics that impacted results throughout 2024, including a decline in claims volumes due to insurance premium inflation and overall economic uncertainty, have continued into early 2025, with repairable claims experiencing a greater year-over-year decline during the first two months of 2025 than was experienced in the fourth quarter of 2024 in spite of the return of more normal winter weather conditions. Despite this fact, thus far in the first quarter of 2025, same-store sales has improved compared to the fourth quarter, but is not yet positive; continuing to demonstrate market share gains. As in prior years, the first quarter is burdened by higher payroll taxes that occur early in the year, while the fourth quarter of 2024 benefited from expense accrual reductions, as certain expense estimates were firmed up at amounts that were lower than previously estimated and accrued. These factors, along with the challenging claims environment are resulting in Adjusted EBITDA dollars, thus far in the first quarter, trending slightly below levels achieved in the first quarter of the prior year. While it is still too early to determine if claims volumes have bottomed, Boyd remains confident in the industry’s long- term outlook and believes the transformational cost saving initiatives initiated will drive improved margins in the coming quarters.

Boyd remains committed to improving gross margin, through initiatives such as the internalization of scanning and calibration services. The need for scanning and calibration services continue to grow and Boyd’s ability to internalize these services continues to scale. The Company anticipates achieving 80% internalization of scanning and calibration services within the next 2-3 years.

Growth through acquisition as well as through start-up sites continues. Although start-up sites have a longer development cycle and ramp-up period, these locations offer a number of advantages and as a result the Company plans to continue increasing the proportion of growth using this approach. Over the longer-term, the proportion of acquisition to start-up sites is expected to be approximately even. The pipeline for start-up sites currently includes scheduled openings of seven locations in Q1 2025, and an additional 21 locations through the balance of the year.

 
1 

As defined in the non-GAAP financial measures and ratios section of the MD&A


3


While the Company has been successfully executing on Boyd’s long-term growth goal of doubling the size of the business on a constant currency basis from 2021 to 2025 against 2019 sales, over the past year and into 2025, the market has experienced unanticipated economic and industry conditions. The Company has focused on increasing value to customers and shareholders, and has consistently performed above industry, with a focus on emerging from these conditions in a strong position. In spite of the initiatives in place, current market conditions may cause a slight delay in Boyd achieving its long- term growth goal of doubling the size of the business on a constant currency basis from 2021 to 2025 against 2019 sales.

In the long-term, management remains confident in its business model and its ability to increase market share by expanding its presence in North America through strategic acquisitions alongside organic growth from Boyd’s existing operations. Accretive growth will remain the Company’s long-term focus whether it is through organic growth, new store development, or acquisitions. The North American collision repair industry remains highly fragmented and offers attractive opportunities for industry leaders to build value through focused consolidation and economies of scale. As a growth company, Boyd’s objective continues to be to maintain a conservative dividend policy that will provide the financial flexibility necessary to support growth initiatives while gradually increasing dividends over time. The Company remains confident in its management team, systems and experience. This, along with a strong financial position and financing options, positions Boyd well for success into the future.

BUSINESS ENVIRONMENT & STRATEGY

The collision repair industry in North America is estimated by Boyd to represent over $50 billion in annual revenue. The industry is highly fragmented, consisting of many small independent family owned businesses operating in local markets. It is estimated that car dealerships have approximately 15% of the total market. It is believed that multi-unit collision repair operators with greater than $20 million in annual revenues (including multi-unit car dealerships), now have approximately 39% of the total market.

Customer relationship dynamics in the Company’s principal markets differ from region to region. In the United States, Ontario, and Alberta, where private insurers operate, a greater emphasis is placed on establishing and maintaining Direct Repair Programs (“DRP’s”) and other referral arrangements with insurance companies. DRP’s are established between insurance companies and collision repair shops to better manage automobile repair claims and increase levels of customer satisfaction. Insurance companies select collision repair operators to participate in their programs based on integrity, convenience and physical appearance of the facility, quality of work, customer service, cost of repair, cycle time and other key performance metrics. Major insurers use performance-based criteria for selecting collision repair partners. Local and regional DRP’s, and national and self-managed DRP relationships, represent an opportunity for Boyd to increase its business. Insurers have also moved to consolidate DRP repair volumes with a fewer number of repair shops. There is some preference among some insurance carriers to do business with multi-location collision repairers in order to reduce the number and complexity of contacts necessary to manage their networks of collision repair providers and to achieve a higher level of consistent performance. Boyd continues to develop and strengthen its DRP relationships with insurance carriers in both Canada and the United States and believes it is well positioned to take advantage of these trends.

As described further under “Business Risks and Uncertainties”, operating results are expected to be subject to fluctuations or trends due to a variety of factors including availability of qualified employees, availability of parts, pricing by insurance companies, general operating effectiveness, automobile technologies, general and regional economic downturns, unemployment rates and weather conditions. A downturn in the economic climate has the potential to affect results negatively. Boyd has worked to mitigate this risk by continuing to focus on meeting insurance companies’ performance requirements, and in doing so, grow market share.


4


Boyd expects to generate growth sufficient to double the size of the business on a constant currency revenue basis from 2021 to 2025, based on 2019 revenues, implying a compound annual growth rate of 15 percent, although current market conditions may cause a slight delay in Boyd achieving this long-term growth goal. Boyd will continue to pursue accretive growth through a combination of organic growth (same-store sales2 growth) as well as adding new locations to the network in the United States and Canada.

BUSINESS STRATEGY


LOGO

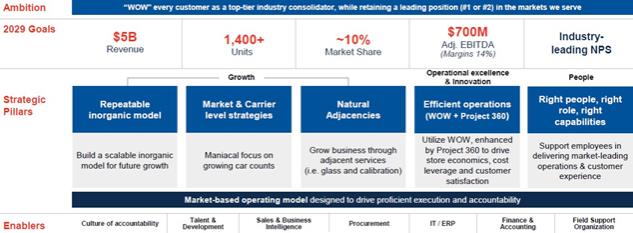
Boyd is pleased to have announced a new five-year goal, which includes growing revenue to $5 billion in 2029, doubling Adjusted EBITDA dollars from 2024-2029, returning to an Adjusted EBITDA margin of 14%, expanding market share and retaining a leadership position in all markets served, and achieving top-tier profitability in the North American collision industry (“Double Down”). Double Down is supported by “Project 360”, a company-wide transformational cost initiative launched in partnership with a leading global consulting firm during the fourth quarter of 2024. Project 360 is expected to result in $100 million in annual recurring cost savings over the plan period with upfront investment and transition costs incurred to achieve these benefits estimated to be in the $20-$23 million range over the coming quarters.

 
2 

As defined in the non-GAAP financial measures and ratios section of the MD&A


5


LOGO

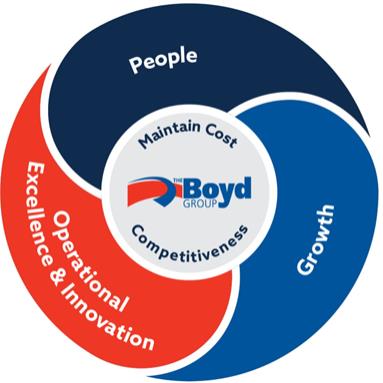
People

Having the right people in the right roles with the right capabilities enables Boyd to be a market leading operator delivering exceptional customer experiences. The workforce drives the success of Boyd’s business, and the Company strives to create an environment where employees can reach their full potential and build long-term careers. Boyd’s ambition is to be a top employer in the collision, calibration and glass sector by attracting, developing, and retaining the strongest talent in the industry enabled by a culture of accountability. Boyd is committed to addressing labor market challenges by focusing on retention and recruitment, investing in the Technician Development Program and focusing on opportunities for productivity improvements.

Growth

Boyd’s $5 billion revenue target will be achieved by continuing the Company’s proven growth strategy, namely the combination of same-store sales growth and new location growth with a focus on securing a number-one or number-two market position in all markets served. The Company expects to generate 3% to 5% in average annual growth from same-store sales growth and an additional 5% to 7% in average annual growth through the addition of new locations. Beyond same-store sales growth and single shop expansion, Boyd will continue to be a strategic buyer of larger multi-location businesses, and if successful, this would be incremental to the revenue growth goals.

Increasing same-store sales3 has a positive impact on financial performance. Boyd continues to pursue and execute on strategies to help grow same-store sales3, including a focus on growing car count volume through existing locations and increasing scanning and calibration services.

Boyd’s inorganic model for growth includes new start-up locations as well as single-location and multi-location acquisitions. The Company believes that start-up facilities offer a number of advantages and as a result plans to continue increasing the proportion of growth using this approach. This approach allows Boyd to design and develop a facility that has a preferred footprint and flow. Being able to accommodate Boyd’s future needs in terms of glass and calibration services is another benefit. These facilities are also attractive from a customer and employee perspective. When a start-up facility is put into the market, consideration is given to new growth markets as well as expansion of large markets into areas that do not have body shops.


6


Operational Excellence & Innovation

Operational excellence has been a key component of Boyd’s past success and has contributed to the Company being viewed as an industry leading service provider. Delivering on our customers’ expectations related to cost of repair, time to repair, quality and customer service are critical to being successful and being rewarded with same-store sales3 growth. The Company’s commitment to operational excellence is embodied in its mission and goal, which is condensed into a top of mind cheer for its employees which is ‘Wow every customer, be the best’. In 2015, Boyd rolled out and implemented its Wow Operating Way process improvement initiative which is now in place at all of its locations, except newly acquired locations, where it will be implemented as part of acquisition integration. In 2022, Boyd expanded its Wow Operating Way practices to corporate business processes. The Wow Operating Way is a series of systems, processes and measurements that drive excellence in customer satisfaction, repair cycle times and operational metrics. Boyd also conducts extensive customer satisfaction polling at all operating locations to assist in keeping customer satisfaction at the forefront of its mandate. Boyd will also continue to invest in its infrastructure, process improvement initiatives and IT systems to contribute to high quality service to its customers and improved operational performance.

Boyd is committed to growing the business through adjacent services, such as the internalization of scanning and calibration services, which represented 5% of total revenues in 2024. In 2024, 40% of Boyd’s scanning and calibration services were completed utilizing internal resources, with a near term ambition to grow this to 80%. In order to support this growth, the workforce providing scanning and calibration services has grown by over 100% from January 1, 2024 to December 31, 2024.

Initiatives such as the internalization of scanning and calibration services, progress in Boyd’s repair first strategy and focus on the use of cost effective alternative parts, deliver strong value by lowering repair costs for the Company’s customers and providing incremental gross margin to Boyd.

Maintain Cost Competitiveness

Boyd continues to manage its operating expenses as a percentage of sales. Over the last few years, Boyd has made incremental expense investments that are important for the long-term success of the business, including investing in key support functions. While expense management is critical, so is making the right expense investments. The Company is committed to returning to an Adjusted EBITDA margin of 14%, supported by Project 360, a company-wide transformational cost initiative launched in partnership with a leading global consulting firm during the fourth quarter of 2024. Project 360 is expected to result in $100 million in annual recurring cost savings over the plan period with upfront investment and transition costs incurred to achieve these benefits estimated to be in the $20-$23 million range over the coming quarters.

CAUTION CONCERNING FORWARD-LOOKING STATEMENTS

Statements made in this annual report, other than those concerning historical financial information, may be forward-looking and therefore subject to various risks and uncertainties. Some forward-looking statements may be identified by words like “may”, “will”, “anticipate”, “estimate”, “expect”, “intend”, or “continue” or the negative thereof or similar variations. Readers are cautioned not to place undue reliance on such statements, as actual results may differ materially from those expressed or implied in such statements.

 
3 

As defined in the non-GAAP financial measures and ratios section of the MD&A


7


The following table outlines forward-looking information included in this MD&A:


Forward-looking Information    Key Assumptions    Most Relevant Risk Factors

Boyd plans to grow revenue to $5 billion in 2029, double Adjusted EBITDA dollars from 2024-2029, return to an Adjusted EBITDA margin of 14%, expand market share and retain a leadership position in all markets served, and achieve top-tier profitability in the North American collision industry


Opportunities continue to be available and are at acceptable and accretive prices


Financing options continue to be available at reasonable rates and on acceptable terms and conditions


New and existing customer relationships are expected to provide acceptable levels of revenue opportunities


Anticipated operating results would be accretive to overall Company results


Initiatives to increase production capacity are successful


Project 360 is successful


Technology is leveraged to optimize mix decisions


Material spend is optimized


Store operating model is optimized to drive leverage as volume scales


Acquisition market conditions change and repair shop owner demographic trends change


Credit and refinancing conditions prevent or restrict the ability of the Company to continue growth strategies


Changes in market conditions and operating environment Significant decline in the number of insurance claims Integration of new stores is not accomplished as planned


Increased competition which prevents achievement of acquisition and revenue goals


Initiatives to increase production capacity take longer than expected or are not successful


Insurance premium inflation and overall economic uncertainty continue to impact claims volumes


Anticipated cost savings take longer than expected or are not fully realized


Project 360 is expected to require upfront investment and transition costs in the

$20-$23 million range over the coming quarters.


The actual cost for these expenditures agrees with the original estimate


The project is completed according to the estimated timeline


No other new requirements are identified or required during the period


All identified costs are required during the period


BGSI may identify additional expenditure needs that were not originally anticipated


BGSI may identify expenditure needs that were originally anticipated; however, are no longer required or required on a different timeline


Project 360 is expected to result in $100 million in annual recurring cost savings over the plan period . Reduced operating expenses and improved operating expense leverage is expected to be realized gradually beginning in the second quarter of 2025.


The project is completed according to the estimated timeline


Cost savings initiatives have been appropriately identified


Adequate time and resources are dedicated to achieving cost savings objectives


Cost savings realized differ from amounts originally anticipated


Timeframe for cost savings differs from original timeline


BGSI is not able to achieve the level of cost savings anticipated


8


Forward-looking Information    Key Assumptions    Most Relevant Risk Factors

The Company anticipates achieving 80% internalization of scanning and calibration services within the next 2-3 years


Staffing to service scanning and calibration continues to be available


Necessary equipment is readily available


Vehicles requiring scanning and calibration services increase according to industry and company projections


Demand for services grows more rapidly than anticipated during the timeframe


Necessary equipment is not available in the required timeframe


Vehicles requiring scanning and calibration services increase at a pace that differs from industry and company projections


Vehicle population in certain geographies does not support the investment required to internalize scanning and calibration services


Current market conditions may cause a slight delay in Boyd achieving its long-term growth goal of doubling the size of the business on a constant currency basis from 2021 to 2025 against 2019 sales


Opportunities continue to be available and are at acceptable and accretive prices


Financing options continue to be available at reasonable rates and on acceptable terms and conditions


New and existing customer relationships are expected to provide acceptable levels of revenue opportunities


Anticipated operating results would be accretive to overall Company results


Growth is defined as revenue on a constant currency basis


Initiatives to increase production capacity are successful


Acquisition market conditions change and repair shop owner demographic trends change


Credit and refinancing conditions prevent or restrict the ability of the Company to continue growth strategies


Changes in market conditions and operating environment


Significant decline in the number of insurance claims


Integration of new stores is not accomplished as planned


Increased competition which prevents achievement of acquisition and revenue goals


Initiatives to increase production capacity take longer than expected or are not successful


Insurance premium inflation and overall economic uncertainty continue to impact claims volumes


Boyd remains confident in its business model to increase market share by expanding its presence in North America through strategic and accretive acquisitions alongside organic growth from Boyd’s existing operations


Re-emergence of stability in economic conditions and employment rates


New and existing customer relationships are expected to provide acceptable levels of revenue opportunities


The Company’s customer and supplier relationships provide it with competitive advantages to increase sales over time


Market share growth will more than offset systemic changes in the industry and environment


Anticipated operating results would be accretive to overall Company results


Economic conditions deteriorate


Loss of one or more key customers or loss of significant volume from any customer


Decline in the number of insurance claims


Inability of the Company to pass cost increases to customers over time


Increased competition which may prevent achievement of revenue goals


Changes in market conditions and operating environment


Changes in weather conditions


Inability to maintain, replace or grow technician capacity could impact organic growth


9


Forward-looking Information    Key Assumptions    Most Relevant Risk Factors

Stated objective to gradually increase dividends over time


Growing profitability of the Company and its subsidiaries


The continued and increasing ability of the Company to generate cash available for dividends


Balance sheet strength and flexibility is maintained and the dividend level is manageable taking into consideration bank covenants, growth requirements and maintaining a dividend level that is supportable over time


BGSI is dependent upon the operating results of the Company


Economic conditions deteriorate


Changes in weather conditions


Decline in the number of insurance claims


Loss of one or more key customers or loss of significant volume from any customer


Changes in government regulation


During 2025, the Company plans to make cash capital expenditures, excluding those related to acquisition and development of new locations, within the range of 1.6% and 1.8% of sales. In addition to these capital expenditures, the Company plans to invest in network technology upgrades to further strengthen our technology and security infrastructure and prepare for advanced technology needs in the future. The investment expected in 2025 is in the range of $10M to $12M, with an investment in 2026 in the range of $2 million to $4 million.


The actual cost for these capital expenditures agrees with the original estimate


The purchase, delivery and installation of the capital items is consistent with the estimated timeline


No other new capital requirements are identified or required during the period


All identified capital requirements are required during the period


Actual expenditures could be above or below 1.6% to 1.8% of sales


The timing of the expenditures could occur on a different timeline


BGSI may identify additional capital expenditure needs that were not originally anticipated


BGSI may identify capital expenditure needs that were originally anticipated; however, are no longer required or required on a different timeline

We caution that the foregoing table contains what BGSI believes are the material forward-looking statements and is not exhaustive. Therefore when relying on forward-looking statements, investors and others should refer to the “Risk Factors” section of BGSI’s Annual Information Form, the “Business Risks and Uncertainties” and other sections of our Management’s Discussion and Analysis and our other periodic filings with Canadian securities regulatory authorities. All forward-looking statements presented herein should be considered in conjunction with such filings.


10


SELECTED ANNUAL INFORMATION

The following table summarizes selected financial information for BGSI over the prior three years:


For the years ended December 31,

(thousands of U.S. dollars, except per unit/share amounts)

   2024      2023      2022  

Sales

   $ 3,070,342      $ 2,945,988      $ 2,432,318  

Net earnings

   $ 24,544      $ 86,656      $ 40,962  

Adjusted net earnings (2)

   $ 30,902      $ 89,683      $ 42,366  

Basic and diluted earnings per share

   $ 1.14      $ 4.04      $ 1.91  

Adjusted net earnings per share (2)

   $ 1.44      $ 4.18      $ 1.97  

Cash dividends per share declared:


Share dividends (1)

   $ 0.44      $ 0.44      $ 0.45  


December 31,                     

(thousands of U.S. dollars)

   2024      2023      2022  

Total assets

   $ 2,464,189      $ 2,382,416      $  2,102,832  


Total long-term financial liabilities

   $ 1,198,258      $  1,082,067      $ 931,941  


(1)

Dividends and distributions continue to be declared and paid in Canadian dollars. In 2024, the annual dividend declared totaled C$0.603 (2023 - C$0.591, 2022 - C$0.579)

(2)

As defined in the non-GAAP financial measures and ratios section of the MD&A

Acquisitions and new single location growth had the largest impact on growing sales from 2023 to 2024, this coupled with same-store sales growth resulted in sales growth from 2022 to 2023. Sales in 2024 compared to 2023 and 2022 were negatively impacted by a decrease in same-store sales. This is consistent with market trends where this year industry sources report a year-over-year decrease in repairable claims of 9% for all losses and 7.9% excluding comprehensive claims. In 2023, same-store sales benefited from high levels of demand for services that created leverage in the absorption of fixed costs. In 2022, sales were negatively impacted by supply chain disruption and a highly competitive labor market which translated into significant wage pressure and labor margin compression.

The decline in net earnings and adjusted net earnings4 in 2024 compared to 2023 and 2022 were primarily driven by a decrease in same-store sales which resulted in decreased leverage in the absorption of fixed costs. Net earnings was further decreased by $3.2 million (net of tax) in transformational cost initiatives carried out by the Company during the fourth quarter of 2024. Expenses related to the transformational cost initiatives, expected to continue into 2025, are non-recurring and relate to the execution of Project 360 expected to assist in achieving BGSI’s five-year goal, these expenses have been removed from the calculation of Adjusted Net Earnings.

The change in total assets and total long-term financial liabilities was significantly impacted by acquisitions and new location growth. In addition to these changes, fluctuations in total assets from 2022 to 2024 have primarily related to increases in property, plant and equipment, right of use assets and goodwill as a result of new location growth. During this timeframe, long-term financial liabilities were also impacted by financing of acquisitions and new location growth.

Since the end of 2007 through the end of 2024, BGSI increased dividends to shareholders. As of March 18, 2025 the dividend rate is C$0.153 per quarter or C$0.612 on an annualized basis.

 
4 

As defined in the non-GAAP financial measures and ratios section of the MD&A


11


BOYD GROUP SERVICES INC.

The consolidated financial statements of BGSI and its subsidiaries have been prepared in accordance with IFRS® Accounting Standards, as issued by the International Accounting Standards Board (“IFRS Accounting Standards”) and contain the consolidated financial position, results of operations and cash flows of BGSI, the Company and the Company’s subsidiary companies for the year ended December 31, 2024.

NON-GAAP FINANCIAL MEASURES AND RATIOS

EBITDA AND ADJUSTED EBITDA

Earnings before interest, taxes, depreciation and amortization (“EBITDA”) is not a calculation defined in IFRS Accounting Standards. EBITDA should not be considered an alternative to net earnings in measuring the performance of BGSI, nor should it be used as an exclusive measure of cash flow. BGSI reports EBITDA and Adjusted EBITDA because they are key measures that management uses to evaluate performance of the business and to reward its employees. EBITDA is also a concept utilized in measuring compliance with debt covenants. EBITDA and Adjusted EBITDA are measures commonly reported and widely used by investors and lending institutions as an indicator of a company’s operating performance and ability to incur and service debt, and as a valuation metric. While EBITDA is used to assist in evaluating the operating performance and debt servicing ability of BGSI, investors are cautioned that EBITDA and Adjusted EBITDA as reported by BGSI may not be comparable in all instances to EBITDA as reported by other companies.

CPA Canada’s Canadian Performance Reporting Board defined Standardized EBITDA to foster comparability of the measure between entities. Standardized EBITDA represents an indication of an entity’s capacity to generate income from operations before taking into account management’s financing decisions and costs of consuming tangible and intangible capital assets, which vary according to their vintage, technological age and management’s estimate of their useful life. Accordingly, Standardized EBITDA comprises sales less operating expenses before finance costs, capital asset amortization and impairment charges, and income taxes. Adjusted EBITDA is calculated to exclude items of an unusual nature that do not reflect normal or ongoing operations of BGSI and which should not be considered in a valuation metric or should not be included in an assessment of the ability to service or incur debt. Included as an adjustment to EBITDA are acquisition and transformational cost initiatives expenses and fair value adjustments to contingent consideration. These adjustments which do not relate to the current operating performance of the business units but are typically costs incurred to expand operations as well as execute a transformation plan, expected to assist in achieving BGSI’s five-year goal. From time to time BGSI may make other adjustments to its Adjusted EBITDA for items that are not expected to recur.


12


The following is a reconciliation of BGSI’s net earnings to Standardized EBITDA and Adjusted EBITDA:

ADJUSTED EBITDA


     Three Months Ended
December 31,
    

Year Ended

December 31,

 
(thousands of U.S. dollars)    2024      2023      2024      2023  

Net earnings

   $ 2,442      $ 19,066      $ 24,544      $ 86,656  

Add:


Finance costs

     17,382        14,052        68,913        51,718  

Income tax (recovery) expense

     (792 )       8,008        7,116        32,865  

Depreciation of property, plant and equipment

     20,907        16,224        75,498        56,863  

Depreciation of right of use assets

     31,425        28,663        123,512        109,806  

Amortization of intangible assets

     6,814        6,896        26,309        26,182  


Standardized EBITDA

   $ 78,178      $ 92,909      $ 325,892      $ 364,090  


Add:


Fair value adjustments

     (144 )       (189 )       (952 )       (189 ) 

Acquisition and transformational cost initiatives

   $ 5,374        1,487      $ 9,879      $ 4,346  


Adjusted EBITDA

   $ 83,408      $ 94,207      $ 334,819      $ 368,247  


ADJUSTED NET EARNINGS

In addition to Standardized EBITDA and Adjusted EBITDA, BGSI believes that certain users of financial statements are interested in understanding net earnings excluding certain fair value adjustments and other items of an unusual or infrequent nature that do not reflect normal or ongoing operations of the Company. This can assist these users in comparing current results to historical results that did not include such items. The following is a reconciliation of BGSI’s net earnings to adjusted net earnings:


(thousands of U.S. dollars, except share and per share amounts)   

Three Months Ended

December 31,


Year Ended

December 31,

 
     2024      2023      2024      2023  

Net earnings

   $ 2,442      $ 19,066      $ 24,544      $ 86,656  

Add:


Fair value adjustments (non-taxable)

     (144 )       (189 )       (952 )       (189 ) 

Acquisition and transformational cost initiatives (net of tax)

   $ 3,977      $ 1,100      $ 7,310      $ 3,216  


Adjusted net earnings

   $ 6,275      $ 19,977      $ 30,902      $ 89,683  


Weighted average number of shares

     21,472,670        21,472,194        21,472,436        21,472,194  


Adjusted net earnings per share

   $ 0.29      $ 0.93      $ 1.44      $ 4.18  


13


SAME-STORE SALES

Same-store sales is a measure of sales that includes only those locations in operation for the full comparative period. Same- store sales is presented excluding the impact of foreign exchange on the current period. Same-store sales is calculated by applying the prior period exchange rate to the current year sales. The following is a reconciliation of BGSI’s sales to same- store sales:


(thousands of U.S. dollars)    Three months ended
December 31,
    

Year ended

December 31,

 
     2024      2023      2024      2023  

Sales

   $ 752,339      $ 740,014      $ 3,070,342      $ 2,945,988  

Less:


Sales from locations not in the comparative period

     (36,316 )       (3,057 )       (273,019 )       (85,845 ) 

Sales from under-performing facilities closed during the period

     —         (534 )       (17 )       (7,717 ) 

Foreign exchange

     1,509        —         3,436        —   


Same-store sales (excluding foreign exchange)

   $ 717,532      $ 736,422      $ 2,800,742      $ 2,852,425  


Dividends

BGSI declared dividends of C$0.150 per share in each of the first, second and third quarters of 2024 and C$0.153 per share in the fourth quarter of 2024 (2023 - C$0.147 and C$0.150 respectively).

Dividends to shareholders of BGSI were declared and paid as follows:


(thousands of U.S. dollars)

Record date


Payment date

   Dividend amount  

March 31, 2024

   April 26, 2024    $ 2,379  

June 30, 2024

   July 29, 2024      2,350  

September 30, 2024

   October 29, 2024      2,377  

December 31, 2024

   January 29, 2025      2,308  


      $ 9,414  


(thousands of U.S. dollars)

Record date


Payment date

   Dividend amount  

March 31, 2023

   April 26, 2023    $ 2,306  

June 30, 2023

   July 27, 2023      2,376  

September 30, 2023

   October 27, 2023      2,333  

December 31, 2023

   January 29, 2024      2,397  


      $ 9,412  


14


RESULTS OF OPERATIONS


Results of Operations

(thousands of U.S. dollars, except per share amounts)

                                    
     Three months ended December 31,     Year ended December 31,  
     2024     % change     2023     2024     % change     2023  

Sales - Total

     752,339       1.7       740,014       3,070,342       4.2       2,945,988  

Same-store sales - Total (1) (excluding foreign exchange)

     717,532       (2.6 )      736,422       2,800,742       (1.8 )      2,852,425  

Gross margin %

     45.8       0.7       45.5       45.5       —        45.5  

Operating expense %

     34.8       6.4       32.7       34.6       4.8       33.0  

Adjusted EBITDA (1)

     83,408       (11.5 )      94,207       334,819       (9.1 )      368,247  

Acquisition and transformational cost initiatives

     5,374       261.4       1,487       9,879       127.3       4,346  

Depreciation and amortization

     59,146       14.2       51,783       225,319       16.8       192,851  

Fair value adjustments

     (144 )      N/A       (189 )      (952 )      N/A       (189 ) 

Finance costs

     17,382       23.7       14,052       68,913       33.2       51,718  

Income tax (recovery) expense

     (792 )      (109.9 )      8,008       7,116       (78.3 )      32,865  

Adjusted net earnings (1)

     6,275       (68.6 )      19,977       30,902       (65.5 )      89,683  

Adjusted net earnings per share (1)

     0.29       (68.8 )      0.93       1.44       (65.6 )      4.18  

Net earnings

     2,442       (87.2 )      19,066       24,544       (71.7 )      86,656  

Basic and diluted earnings per share

     0.11       (87.2 )      0.89       1.14       (71.7 )      4.04  


(1) 

As defined in the non- GAAP financial measures and ratios section of the MD&A.


15


Sales

Sales totaled $3.1 billion for the year ended December 31, 2024 an increase of $124.4 million or 4.2% when compared to the same period of 2023. The increase in sales was the result of the following:


  •  

$187.2 million of incremental sales were generated from 155 new locations that were not in operation for the full comparative period.


  •  

Same-store sales5 excluding foreign exchange decreased $51.7 million or 1.8% and decreased a further $3.4 million due to the translation of same-store sales5 at a lower Canadian dollar exchange rate. This is consistent with market trends where this year industry sources report a year-over-year decrease in repairable claims of 9% for all losses and 7.9% excluding comprehensive claims. The year ended December 31, 2024 recognized two additional selling and productions day when compared to the prior year, which increased selling and production capacity by approximately 0.8%. The internalization of scanning and calibration services, progress in Boyd’s repair first strategy and focus on the use of cost effective alternative parts, continued to deliver strong value by lowering repair costs for the Company’s customers, and consequently reduced sales that otherwise could have been achieved despite being beneficial from a gross margin perspective.


  •  

Sales were affected by the closure of under-performing facilities which decreased sales by $7.7 million.

Same-store sales are calculated by including sales for locations and businesses that have been in operation for the full comparative period.

Gross Profit

Gross Profit was $1.4 billion or 45.5% of sales for the year ended December 31, 2024 compared to $1.3 billion or 45.5% of sales for the same period in 2023. While margin rate remained flat year over year, gross profit increased $56.4 million as a result of location growth when compared to the prior period. The internalization of scanning and calibration contributed to the increase in gross margin, along with improved performance based pricing; however, these gains were offset by labor rate margins which remained below historical levels.

Operating Expenses

Operating Expenses for the year ended December 31, 2024 increased $89.9 million to $1,061.7 million from $971.8 million for the same period of 2023. The increase in operating expenses was primarily the result of location growth and inflationary increases. Closed locations lowered operating expenses by $4.5 million.

Operating expenses as a percentage of sales were 34.6% for the year ended December 31, 2024 compared to 33.0% for the same period in 2023. Operating expenses as a percentage of sales was negatively impacted by the decline in same-store sales and new locations, which contributed sales but with a higher operating expense ratio of 36.9%. Although operating expenses as a percentage of sales was positively impacted by reductions in staffing made to better align with current levels of demand as well as reduced incentive compensation and recruiting costs, these impacts were more than offset by fixed costs on existing and new locations.

Acquisition and Transformational Cost Initiatives

Acquisition and Transformational Cost Initiatives for the year ended December 31, 2024 were $9.9 million compared to $4.3 million recorded for the same period of 2023. Acquisition costs relate to various acquisitions, including acquisitions from prior periods, as well as other completed or potential acquisitions. Expenses related to the transformational cost initiative of $4.4 million, expected to continue in 2025, are non-recurring and relate to the execution of a transformation plan expected to assist in achieving BGSI’s five-year goal. No similar transformation costs were incurred in 2023.

 
5 

As defined in the non-GAAP financial measures and ratios section of the MD&A


16


Adjusted EBITDA6

Earnings before interest, income taxes, depreciation and amortization, adjusted for contingent consideration, as well as acquisition and transformational cost initiatives (“Adjusted EBITDA6”) for the year ended December 31, 2024 totaled $334.8 million or 10.9% of sales compared to Adjusted EBITDA6 of $368.2 million or 12.5% of sales in the same period of the prior year. The $33.4 million decrease was primarily the result of declines in repairable claims volumes for services, which resulted in same-store sales declines and a higher ratio of operating expenses as a percentage of sales. Although operating expenses as a percentage of sales was positively impacted by reductions in staffing made to better align with current levels of demand as well as reduced incentive compensation and recruiting costs, these impacts were more than offset by fixed costs on existing and new locations.

Depreciation and Amortization

Depreciation related to property, plant and equipment totaled $75.5 million or 2.5% of sales for the year ended December 31, 2024, an increase of $18.6 million when compared to the $56.9 million or 1.9% of sales recorded in the same period of the prior year. The increase in depreciation expense was primarily due to growth in locations, the investments in network technology upgrades, as well as growth related to the calibration business. Investments in the calibration business pertain primarily to vehicles and calibration technology equipment. Depreciation expense as a percentage of sales has been impacted by same-store sales declines.

Depreciation related to right of use assets totaled $123.5 million, or 4.0% of sales for the year ended December 31, 2024, as compared to $109.8 million or 3.7% of sales for the same period of the prior year. The increase in depreciation expense was primarily due to location growth and lease renewals. Depreciation expense as a percentage of sales has been impacted by same-store sales declines.

Amortization of intangible assets for the year ended December 31, 2024 totaled $26.3 million or 0.9% of sales, an increase of $0.1 million when compared to the $26.2 million or 0.9% of sales expensed for the same period in the prior year.

Finance Costs

Finance Costs of $68.9 million or 2.2% of sales for the year ended December 31, 2024 increased from $51.7 million or 1.8% of sales for the same period of the prior year. The increase in finance costs was primarily due to increased lease liabilities, as a result of lease renewals and location growth, as well as higher variable interest rates and increased utilization on the revolving credit facility.

Income Taxes

Current and Deferred Income Tax Expense of $7.1 million for the year ended December 31, 2024 compared to an expense of $32.9 million for the same period of the prior year. Income tax expense was impacted by the recording of state-related adjustments related to the completion and filing of the prior year U.S. tax returns, which decreased income tax expense by approximately $1.5 million for the year ended December 31, 2024 (December 31, 2023 - increased income tax expense by $1.2 million). In 2024, the recovery of state taxes was due to the recognition of a deferred tax asset related to depreciation differences in states that do not conform with federal bonus depreciation. Permanent differences did not have a significant impact on the tax computed on accounting income.

 
6 

As defined in the non-GAAP financial measures and ratios section of the MD&A


17


Net Earnings and Earnings Per Share

Net Earnings for the year ended December 31, 2024 was $24.5 million or 0.8% of sales compared to $86.7 million or 2.9% of sales in the same period of the prior year. The net earnings amount in 2024 was impacted by acquisition and transformational cost initiatives of $7.3 million (net of tax). After adjusting for fair value and other unusual items, Adjusted net earnings7 in 2024 was $30.9 million, or 1.0% of sales. This compares to Adjusted net earnings7 of $89.7 million or 3.0% of sales in 2023. Net earnings and Adjusted net earnings for the period was negatively impacted by the decrease in Adjusted EBITDA, as well as increased depreciation expense and increased finance cost. Depreciation and finance costs increased due to investments in growth and the investment in network technology upgrades.

Basic and Diluted Earnings Per Share was $1.14 per share for the year ended December 31, 2024 compared to $4.04 for the same period of 2023. Adjusted net earnings per share8 was $1.44 compared to $4.18 for the same period of 2023.


Summary of Quarterly Results

(in thousands of U.S. dollars,

except per share amounts)

   2024 Q4      2024 Q3      2024 Q2      2024 Q1      2023 Q4      2023 Q3      2023 Q2      2023 Q1  

Sales

   $ 752,339      $ 752,293      $ 779,163      $ 786,547      $ 740,014      $ 737,798      $ 753,235      $ 714,941  

Adjusted EBITDA (1)

   $ 83,408      $ 80,128      $ 89,576      $ 81,707      $ 94,207      $ 93,972      $ 95,374      $ 84,694  

Net earnings

   $ 2,442      $ 2,895      $ 10,826      $ 8,381      $ 19,066      $ 20,498      $ 26,269      $ 20,823  

Basic and diluted earnings per share

   $ 0.11      $ 0.13      $ 0.50      $ 0.39      $ 0.89      $ 0.95      $ 1.22      $ 0.97  

Adjusted net earnings (1)

   $ 6,275      $ 3,247      $ 11,937      $ 9,444      $ 19,977      $ 21,483      $ 26,988      $ 21,234  

Adjusted net earnings per share (1)

   $ 0.29      $ 0.15      $ 0.56      $ 0.44      $ 0.93      $ 1.00      $ 1.26      $ 0.99  


(1) 

As defined in the non-GAAP financial measures and ratios section of the MD&A.

LIQUIDITY AND CAPITAL RESOURCES

Cash flow from operations, together with cash on hand and undrawn credit on existing facilities are expected to be sufficient to meet operating requirements, capital expenditures and dividends. At December 31, 2024, BGSI had cash, net of outstanding deposits and cheques, held on deposit in bank accounts totaling $20.0 million (December 31, 2023 - $22.5 million). The decrease in the cash balance as at December 31, 2024 is the result of decreased cash flows from operations. The net working capital ratio (current assets divided by current liabilities) was 0.62:1 at December 31, 2024 (December 31, 2023 – 0.63:1).

At December 31, 2024, BGSI had total debt outstanding, net of cash, of $1,231.6 million compared to $1,225.1 million at September 30, 2024, $1,208.7 million at June 30, 2024, $1,163.8 million at March 31, 2024 and $1,114.5 million at December 31, 2023. Debt, net of cash, before lease liabilities increased when compared to the prior year primarily as a result of location growth. The Company’s strategy has been to not hold real estate except where it is necessary for growth opportunities. Certain start-up locations necessitate short term holding of real estate until the build is complete and operations have begun. During the year 2024, the Company completed sale leaseback transactions for proceeds of $64.9 million. The sale leaseback transactions allowed the Company to replenish capital that can be redeployed to further grow the business.

 
7 

As defined in the non-GAAP financial measures and ratios section of the MD&A

8 

As defined in the non-GAAP financial measures and ratios section of the MD&A


18


Total debt, net of cash

(thousands of U.S. dollars)

   December 31,
2024
     September 30,
2024
     June 30,
2024
     March 31,
2024
     December 31,
2023
 

Revolving credit facility & swing line (net of financing costs)

   $ 369,333      $ 389,774      $ 353,724      $ 300,171      $ 264,046  

Term Loan A (net of financing costs)

     124,882        124,860        124,847        124,831        124,812  

Seller notes (1)

     13,068        15,458        17,939        29,870        32,847  


Total debt before lease liabilities

   $ 507,283      $ 530,092      $ 496,510      $ 454,872      $ 421,705  

Cash

     19,997        43,847        15,530        16,380        22,511  


Total debt, net of cash before lease liabilities

   $ 487,286      $ 486,245      $ 480,980      $ 438,492      $ 399,194  

Lease liabilities

     744,295        738,895        727,703        725,337        715,277  


Total debt, net of cash

   $ 1,231,581      $ 1,225,140      $ 1,208,683      $ 1,163,829      $ 1,114,471  


(1) 

Seller notes are loans granted to the Company by the sellers of businesses related to the acquisition of those businesses.

The following table summarizes the undiscounted contractual obligations at December 31, 2024 and required payments over the next five years:


Contractual Obligations

(thousands of U.S. dollars)

   Total      Within 1
year
     1 to 2
years
     2 to 3
years
     3 to 4
years
     4 to 5
years
     After 5
years
 

Bank indebtedness

   $ —       $ —       $ —       $ —       $ —       $ —       $ —   

Accounts payable and accrued liabilities

     306,942        306,942        —         —         —         —         —   

Long-term debt

     507,283        8,994        372,823        125,417        49        —         —   

Lease liability

     948,906        157,105        143,935        128,045        107,052        83,934        328,835  

Purchase Obligations (1)

     —         unknown        unknown        unknown        unknown        unknown        unknown  


   $ 1,763,131      $ 473,041      $ 516,758      $ 253,462      $ 107,101      $ 83,934      $ 328,835  


(1) 

Subject to fulfilling certain conditions such as meeting contractual purchase obligations and no change in control the repayment would be nil

Operating Activities

Cash flow generated from operations before considering working capital changes, was $319.2 million for the year ended December 31, 2024 compared to $338.5 million in 2023.

For the year ended December 31, 2024, changes in working capital items used net cash of $5.9 million compared with providing net cash of $19.1 million in the same period of 2023. Changes in accounts receivable, inventory, prepaid expenses, income taxes, accounts payable and accrued liabilities are significantly influenced by timing of collections and expenditures.


19


Financing Activities

Cash used in financing activities totaled $106.9 million for the year ended December 31, 2024 compared to cash used in financing activities of $105.9 million for the same period of the prior year. During 2024, cash was provided by draws of the revolving credit facility in the amount of $366.0 million offset by cash used to repay draws as well as long-term debt associated with seller notes in the amount of $283.8 million and to fund interest costs on long-term debt of $29.1 million. Cash used by financing activities included $109.2 million in repayments of property, vehicle and equipment lease liabilities and cash used to fund interest costs on these lease liabilities of $40.5 million. Cash was also used to pay dividends of $9.4 million. The Company extended the revolving credit facility, resulting in the payment of $0.8 million of financing costs. During 2023, cash was provided by draws of the revolving credit facility in the amount of $260.5 million offset by cash used to repay draws as well as long-term debt associated with seller notes in the amount of $205.8 million and to fund interest costs on long-term debt of $19.8 million. Cash used by financing activities included $99.3 million used to repay property, vehicle and equipment lease liabilities and cash used to fund interest costs on these lease liabilities of $32.1 million. Cash was also used to pay dividends of $9.4 million.

Debt Financing

On March 26, 2024, the Company entered into a fourth amended and restated credit agreement to extend the revolving credit facilities in the aggregate amount of $550 million with an accordion feature which can increase the facilities to a maximum of $850 million (the “Facilities”). The Facilities are accompanied by a fixed-rate Term Loan A maturing in March 2027, in the amount of $125 million at an interest rate of 3.455%. The Facilities are with a syndicate of Canadian and U.S. banks and are secured by the shares and assets of the Company as well as guarantees by BGSI and subsidiaries, while the Term Loan A is with one of the syndicated banks. The interest rate for draws on the Facilities are based on a pricing grid of BGSI’s ratio of total funded debt to EBITDA as determined under the credit agreement. The Company can draw on the Facilities in either the U.S. or in Canada, in either U.S. or Canadian dollars. The Company can make draws in tranches as required. Tranches bear interest only and are not repayable until the maturity date but can be voluntarily repaid at any time. The Company has the ability to choose the base interest rate between Prime, Canadian Overnight Repo Rate Average (“CORRA”), U.S. Prime or Secured Overnight Financing Rate (“SOFR”) at the Company’s election. The credit agreement provides for CORRA as the Canadian benchmark replacement rate on Canadian dollar term advances when the publication of Canadian Dollar Offered Rate (“CDOR”) ceased in June 2024. The total syndicated Facilities include a swing line up to a maximum of $10.0 million for the Canadian borrower and $30.0 million for the U.S. borrower. As at December 31, 2024, the Company has drawn $370.0 million U.S. ((December 31, 2023 - $264.5 million) and the Canadian borrower had drawn $nil (December 31, 2023 - $nil) on the Facilities and $125.0 million (December 31, 2023 - $125.0 million) on the Term Loan A.

The Company is subject to certain financial covenants which must be maintained to avoid acceleration of the termination of the credit agreement. The financial covenants require BGSI to maintain a senior funded debt to EBITDA ratio of no greater than 3.50 and an interest coverage ratio of not less than 2.75. For four quarters following a material acquisition, the senior funded debt to EBITDA ratio may be increased to less than 4.00. For purposes of covenant calculations, property lease payments are deducted from EBITDA, and EBITDA is further adjusted to reflect pro-forma annualized acquisition results.

The Company supplements its debt financing by negotiating with sellers in certain acquisitions to provide financing to the Company in the form of term notes. The notes payable to sellers are typically at favorable interest rates and for terms of one to 15 years. This source of financing is another means of supporting BGSI’s growth, at a relatively low cost. During the year ended December 31, 2024, BGSI entered into 14 new seller notes for an aggregate amount of $3.5 million. During the year ended December 31, 2024, BGSI repaid seller notes in the amount of $23.3 million.

Shareholders’ Capital

During the first quarter of 2021, the Company instituted a stock option plan for senior management, which was approved by shareholders on May 12, 2021. The Company’s stock option plan allows for the granting of options up to an amount of 250,000 Common shares under this plan. Each tranche of the options vests equally over two, three, four and five year periods. The term of an option shall be determined and approved by the People, Culture and Compensation Committee; provided that the term shall be no longer than ten years from the grant date.


20


            Year ended December 31,         
     2024      2023  
     Number      Weighted
average exercise
price (C$)
     Number      Weighted
average exercise
price (C$)
 

Balance at the beginning of year

     54,559      $ 198.78        31,113      $ 186.41  

Granted during the year

     18,269        282.26        28,821        211.13  

Forfeited during the year

     (4,535 )       219.71        (5,375 )       193.39  

Expired during the year

     —         —         —         —   

Exercised during the year

     (531 )       204.83        —         —   


Balance at the end of year

     67,762      $ 219.84        54,559      $ 198.78  


Exercisable at the end of the year

     8,351      $ 195.58        2,690      $ 219.21  


Investing Activities

Cash used in investing activities totaled $207.7 million for the year ended December 31, 2024. This compares to $244.4 million used in the prior period. The investing activity in both periods related primarily to new location growth that occurred during these periods. During the year ended December 31, 2024, the Company completed sale leaseback transactions for proceeds of $64.9 million. The remainder of the investing activity in both periods related primarily to new location growth as well as the development of businesses which consisted primarily of property, plant and equipment additions.

Acquisitions and Development of Businesses

The Company completed and opened the following number of collision repair acquisitions and start up locations during the periods listed:


Location

   Number of locations
added through
acquisition
     Number of start ups      Total  

January 1, 2024 to December 31, 2024

     37        12        49  

January 1, 2025 to March 18, 2025

     3        6        9  


Total

     40        18        58  


During the year ended December 31, 2024, the Company opened seven start-up glass locations, acquired one glass location and four calibration businesses. From January 1, 2025 up to the reporting date of March 18, 2025, the Company acquired two glass location.

The Company completed the acquisition or start-up of 116 collision repair locations from the beginning of 2023 until the fourth quarter reporting date of March 19, 2024. Details of these acquisitions can be found in the 2023 Annual Report.

During 2024 the Company invested in the growth of its scanning and calibration services. Expenditures in this area on vehicles and scanning and calibration technology equipment is expected to continue into the future as the Company grows its internalization of this work from 40% to 80% in the near term.


21


Start-ups

Start-up collision repair facilities include brownfield locations, which are existing buildings converted to Boyd’s use. In some cases this would include opening in a building that was previously a collision repair facility. The Company will also develop greenfield locations which consist of Boyd’s prototype building from the ground up. In both cases, Boyd ensures the location is favorable and zoned appropriately to be able to operate upon completion of development. Depending on a variety of factors including zoning, permitting, supply chain and availability of trades, the development of a start-up facility can take between 10 and 24 months, with greenfields generally taking longer than brownfields.

The Company believes that start-up facilities offer a number of advantages and as a result plans to continue increasing the proportion of growth using this approach. This approach provides another option to grow in markets that are new and growing and also allows Boyd to design and develop a facility that has a preferred footprint and flow. Being able to accommodate Boyd’s future needs in terms of glass and calibration services is another benefit. These facilities are also attractive from a customer and employee perspective. Having the capability to grow through start-ups at a higher pace gives the Company optionality to invest in a way that continues to provide accretive returns when multi-shop or single location acquisition opportunities are not ideal.

Start-up facilities, whether brownfield or greenfield, have a longer ramp-up period when compared to the Company’s historical single shop acquisitions. It generally takes longer for sales to build up to steady state levels in start up locations. Whereas with single store acquisitions, it takes on average between 12-24 months to add the necessary employees and DRP relationships to drive sales to projected levels, for start-ups it can take between 24-36 months from the time of store opening. During these ramp up periods, leveraging of fixed costs is limited, which impacts the operating expense ratio and supplementing production staff wages may be required, which impacts gross margin. For start-up locations, pre-opening costs such as utilities, core staff, property taxes and shop supplies are incurred without sales revenue to offset these costs. This pattern of extended ramp up would typically result in losses for the months leading up to the opening and continue at decreasing levels as the revenue increases. Performance of newly developed locations will vary, but the long-term value creation of developing start-up sites are very attractive. Based on Boyd’s history, newly developed locations would reach maturity by the end of their third year.

In 2024, the Company commenced operations in 12 new start-up collision repair facilities. The total combined investment in leaseholds and equipment for start-up facilities was approximately $23.0 million, including incremental investments in the build out of certain start-up locations. The Company commenced operations in 28 new start-up collision repair facilities in 2023 with a combined investment of approximately $45.3 million. The Company anticipates it will use similar start-up strategies as part of its continued growth in the future.

Capital Expenditures

Although most of Boyd’s repair facilities are leased, funds are required to ensure facilities are properly repaired and maintained to ensure the Company’s physical appearance communicates Boyd’s standard of professional service and quality. The Company’s need to maintain its facilities and upgrade or replace equipment to meet increased complexity of newer vehicles, signage, computers, software and vehicles forms part of the annual cash requirements of the business. The Company manages these expenditures by annually reviewing and determining its capital budget needs and then authorizing major expenditures throughout the year based upon individual business cases. Excluding expenditures related to network technology upgrades and acquisition and development, the Company spent approximately $62.3 million, or 2.0% of sales on capital expenditures during 2024, compared to $57.9 million or 2.0% of sales during 2023. In 2024, capital expenditures as a percentage of sales were impacted by same-store sales declines.

During 2025, the Company plans to make cash capital expenditures, excluding those related to acquisition and development of new locations, within the range of 1.6% and 1.8% of sales. In addition to these capital expenditures, the Company plans to invest in network technology upgrades to further strengthen our technology and security infrastructure and prepare for advanced technology needs in the future. During 2024, the Company spent approximately $18.1 million on network technology upgrades. The investment expected in 2025 is in the range of $10 million to $12 million, with an investment in 2026 in the range of $2 million to $4 million. These investments align with Boyd’s ESG sustainability roadmap to responsibly address data privacy and cyber security.


22


FOURTH QUARTER

Sales for the three months ended December 31, 2024 totaled $752.3 million, an increase of $12.3 million or 1.7% compared to the same period in 2023. Sales growth of $33.3 million was attributable to incremental sales generated from 86 new locations. The closure of under-performing facilities accounted for a decrease in sales of $0.5 million. Overall same-store sales excluding foreign exchange decreased $18.9 million, or 2.6% in the fourth quarter of 2024 when compared to the fourth quarter of 2023 and decreased a further $1.5 million due to the translation of same-store sales5 at a lower Canadian dollar exchange rate. The fourth quarter of 2024 recognized one more selling and production day when compared to the same period of the prior year. Industry sources report a fourth quarter year-over-year decrease in repairable claims of 6% for all losses and 7.9% excluding comprehensive claims. The internalization of scanning and calibration services, progress in Boyd’s repair first strategy and focus on the use of cost effective alternative parts, continued to deliver strong value by lowering repair costs for the Company’s customers, and consequently reduced sales that otherwise could have been achieved despite being beneficial from a gross margin perspective.

Gross Profit was $344.9 million, or 45.8% of sales in the fourth quarter of 2024 compared to $336.5 million or 45.5% in the same period in 2023. Gross profit increased $8.4 million primarily as a result of location growth when compared to the prior period. The gross margin percentage for the three months ended December 31, 2024 benefited from internalization of scanning and calibration and improved performance based pricing, partially offset by lower paint margins.

Operating expenses as a percentage of sales were 34.8% for the fourth quarter of 2024 compared to 32.7% for the same period in 2023. Operating expenses as a percentage of sales was significantly impacted by the decline in same-store sales and location growth. Although operating expenses as a percentage of sales was positively impacted by reductions in staffing made to better align with current levels of demand as well as reduced incentive compensation and recruiting costs, these impacts were more than offset by fixed costs on existing and new locations. New locations contributed sales but with a higher operating expense ratio of 37.5% during the fourth quarter of 2024.

Adjusted EBITDA9 for the fourth quarter of 2024 totaled $83.4 million or 11.1% of sales compared to Adjusted EBITDA8 of $94.2 million or 12.7% of sales in the same period of the prior year. The $10.8 million decrease was primarily the result of lower same-store sales levels and a high ratio of operating expenses as a percentage of sales for both existing and new stores.

Current and Deferred Income Tax (Recovery) for the fourth quarter of $(0.8) million in 2024 compared to an income tax expense of $8.0 million in 2023. Income tax expense was impacted by the recording of state-related adjustments related to the completion and filing of the prior year U.S. tax returns, which decreased income tax expense by approximately $1.5 million for the fourth quarter of 2024 (December 31, 2023 - increased income tax expense by $1.2 million). In 2024, the recovery of state taxes was due to the recognition of a deferred tax asset related to depreciation differences in states that do not conform with federal bonus depreciation. Permanent differences did not have a significant impact on the tax computed on accounting income.

Net Earnings for the fourth quarter was $2.4 million, or 0.3% of sales, or $0.11 per fully diluted share compared to net earnings of $19.1 million, or 2.6% of sales, or $0.89 per fully diluted share for the same period in the prior year. The net earnings amount in the fourth quarter of 2024 was impacted by acquisition and transformational cost initiatives of $4.0 million (net of tax). After adjusting for fair value and other unusual items, Adjusted net earnings8 for the fourth quarter of 2024 was $6.3 million, or 0.8% of sales. This compares to Adjusted net earnings8 of $20.0 million or 2.7% of sales in the fourth quarter of 2023. Net earnings and Adjusted net earnings8 for the period was negatively impacted by the decrease in Adjusted EBITDA, as well as increased depreciation expense and increased finance costs. Depreciation and finance costs experienced increases primarily driven by investments in growth and the investment in network technology upgrades during a period of lower sales and Adjusted EBITDA.

 
9 

As defined in the non-GAAP financial measures and ratios section of the MD&A


23


LEGAL PROCEEDINGS

Neither BGSI, nor any of its subsidiaries are involved in any legal proceedings which are material in any respect.

RELATED PARTY TRANSACTIONS

In certain circumstances the Company has entered into property lease arrangements where an employee of the Company is the landlord. In these instances, the Company assumes these property lease arrangements initially in connection with an acquisition. The property leases for these locations do not contain any significant non-standard terms and conditions that would not normally exist in an arm’s length relationship, and BGSI has determined that the terms and conditions of the leases are representative of fair market rent values.

The following are the lease payment amounts for facilities under lease with related parties (in thousands of U.S. dollars):


Landlord

   Affiliated Person(s)      Location      Lease
Expires
     December 31,
2024
     December 31,
2023
 

Gerber Building No. 1 Ptnrp

     Timothy O’Day        South Elgin, IL        2029        105        103  

FINANCIAL INSTRUMENTS

In order to limit the variability of earnings due to the foreign exchange translation exposure on the income and expenses of the Canadian operations, the Company may at times enter into foreign exchange contracts. These contracts are marked to market monthly with unrealized gains and losses included in earnings. The Company did not have any such contracts in place during 2024 or 2023.

Transactional foreign currency risk exists in limited circumstances where U.S. denominated cash is received in Canada. The Company monitors U.S. denominated cash flows to be received in Canada and evaluates whether to use forward foreign exchange contracts. No such foreign exchange contracts were used during 2024 or 2023.


24


CRITICAL ACCOUNTING ESTIMATES AND JUDGMENTS

Estimates and judgments are continually evaluated and are based on historical experience and other factors, including expectations of future events that are believed to be reasonable under the circumstances.

Critical accounting estimates

BGSI makes estimates, including the assumptions applied therein, concerning the future. The resulting accounting estimates will, by definition, seldom equal the related actual results. The estimates and assumptions that have a significant risk of causing a material adjustment to the carrying amounts of assets and liabilities within the next financial year are addressed below.

Impairment of Goodwill and Intangible Assets

When testing goodwill and intangibles for impairment, BGSI uses a five year forward looking discounted cash flow of the cash generating unit (“CGU”) or group of CGUs to which the asset relate. An estimate of the recoverable amount is then calculated as the higher of an asset’s fair value less costs to sell and value in use (being the present value of the expected future cash flows of the relevant asset or CGU). An impairment loss is recognized for the amount by which the asset’s carrying amount exceeds its recoverable amount. The methods used to value intangible assets and goodwill require critical estimates to be made regarding the future cash flows and useful lives of the intangible assets. Goodwill and intangible asset impairments, when recognized, are recorded as a separate charge to earnings, and could materially impact the operating results of the Company for any particular accounting period.

Impairment of Other Long-lived Assets

BGSI assesses the recoverability of its long-lived assets, other than goodwill and intangibles, after considering the potential impairment indicated by such factors as business and market trends, the Company’s ability to transfer the assets, future prospects, current market value and other economic factors. In performing its review of recoverability, management estimates the future cash flows expected to result from the use of the assets and their potential disposition. If the discounted sum of the expected future cash flows is less than the carrying value of the assets generating those cash flows, an impairment loss would be recognized based on the excess of the carrying amounts of the assets over their estimated recoverable value. The underlying estimates for cash flows include estimates for future sales, gross margin rates and operating expenses. Changes which may impact these estimates include, but are not limited to, business risks and uncertainties and economic conditions. To the extent that management’s estimates are not realized, future assessments could result in impairment charges that may have a material impact on the Company’s consolidated financial statements.

Business Combinations

Fair value of assets acquired and liabilities assumed in a business combination is estimated based on information available at the date of acquisition and involves considerable judgment in determining the fair values assigned to property, plant and equipment and intangible assets acquired and liabilities assumed on acquisition. The determination of these fair values involves analysis including the use of discounted cash flows, estimated future margins, future growth rates, market rents and capitalization rates. There is estimation in this analysis and actual results could differ from estimates.

Fair Value of Financial Instruments

BGSI has applied discounted cash flow methods to establish the fair value of certain financial assets and financial liabilities recorded on the Consolidated Statement of Financial Position, as well as disclosed in the notes to the consolidated financial statements. BGSI also establishes mark-to-market valuations for derivative instruments, which are assumed to represent the current fair value of these instruments. These valuations rely on assumptions regarding interest and exchange rates as well as other economic indicators, which at the time of establishing the fair value for disclosure, have a high degree of uncertainty. Unrealized gains or losses on these derivative financial instruments may not be realized as markets change.


25


Income Taxes

BGSI is subject to income tax in several jurisdictions and estimates are used to determine the provision for income taxes. During the ordinary course of business, there are transactions and calculations for which the ultimate tax determination is uncertain. As a result, the Company recognizes tax liabilities based on estimates of whether additional taxes and interest will be due. Uncertain tax liabilities may be recognized when, despite the Company’s belief that its tax return positions are supportable, the Company believes that certain positions are likely to be challenged and may not be fully sustained upon review by tax authorities. The Company believes that its accruals for tax liabilities are adequate for all open audit years based on its assessment of many factors including past experience and interpretations of tax law. To the extent that the final tax outcome of these matters is different than the amounts recorded, such differences will impact income tax expense in the period in which such determination is made.

Critical judgments in applying the entity’s accounting policies

Deferred Tax Assets

The assessment of the probability of future taxable income in which deferred tax assets can be utilized is based on BGSI’s latest forecasts which are adjusted for significant non-taxable income and expenses and specific limits to the use of any unused tax loss or credit. The tax rules in the numerous jurisdictions in which BGSI operates are also carefully taken into consideration. If a positive forecast of taxable income indicates the probable use of a deferred tax asset, that deferred tax asset is recognized in full. The recognition of deferred tax assets that are subject to certain legal or economic limits or uncertainties is assessed individually by management based on the specific facts and circumstances. The judgments inherent in these assessments are subject to uncertainty and if changed could materially affect the BGSI’s assessment of its ability to realize the benefit of these tax assets.

CHANGES IN ACCOUNTING POLICIES

Adoption of new and amended IFRS Accounting Standards

The IASB amendments to IAS 1 - Presentation of Financial Statements (Classification of liabilities as Current or Non- Current and Non-current Liabilities with Covenants), IFRS 16 - Leases (Lease Liability in a Sale and Leaseback) and IAS 7 - Statement of Cash Flows and IFRS 7 - Financial Instruments: Disclosures – Supplier Finance Arrangements are effective for the annual periods beginning on or after January 1, 2024. The Company assessed the impact of the amendments to the above standards and they did not have a material impact on the Company’s financial statements.

The May 2023 IASB amendment to IAS 12 – Income Taxes requires entities to disclose information relating to income taxes arising from implementation of Pillar Two Model Rules published by the Organization for Economic Co-Operation and Development. The amendments are effective for annual reporting periods beginning on or after January 1, 2023. For the year ended December 31, 2024, the Company has assessed the impact of Pillar Two and continues to monitor legislative developments in relevant jurisdictions. Based on the Company’s assessment and the enacted or substantively enacted tax rates in the jurisdictions in which it operates, the Company does not expect a material exposure to Pillar Two top-up taxes. The Company has also assessed the applicability of the OECD’s transitional safe harbor rules and, where applicable, expects to rely on these provisions to reduce compliance complexity. The Company will continue to evaluate potential future impacts as jurisdictions finalize their Pillar Two legislation and implementation guidance.

Future Accounting Policies

The following accounting standards under IFRS Accounting Standards have been issued or amended that are not mandatory for the current period and have not been applied to the consolidated financial statements.

IFRS 18 - Presentation and Disclosure in Financial Statements

The new standard replaces IAS 1 - Presentation of Financial Statements while carrying forward many of the requirements in IAS 1. IFRS 18 sets out the requirements for the presentation and disclosure of information in general purpose financial statements to help ensure they provide relevant information that faithfully represents an entity’s assets, liabilities, equity, income and expenses. It introduces requirements to classify income and expenses into categories and defined subtotals in the statement of earnings, provide disclosures on management-defined performance measures (“MPMs”), along with enhanced guidance on aggregation and disaggregation of information. BGSI is required to apply IFRS 18 for annual reporting periods on or after January 1, 2027 with early adoption permitted. BGSI is currently assessing the impact of this standard on its financial statements.


26


Amendments to IFRS 9 and IFRS 7 - Classification and Measurement of Financial Instruments The amendments deal with the recognition and derecognition of financial liability at settlement date and when settled through an electronic cash transfer system, further guidance regarding the classification of financial assets, and additional disclosure requirements for financial instruments with contingent features and equity instruments classified at FVTOCI. These amendments are effective for the annual reporting periods beginning on or after January 1, 2026 with early adoption permitted. BGSI is currently assessing the impact of the these amendments on its financial statements.

CERTIFICATION OF DISCLOSURE CONTROLS

Management’s responsibility for financial information contained in this Annual Report is described on page 48. In addition, BGSI’s Audit Committee of the Board of Directors has reviewed this Annual Report, and the Board of Directors has reviewed and approved this Annual Report prior to its release. BGSI is committed to providing timely, accurate and balanced disclosure of all material information about BGSI and to providing fair and equal access to such information. As of December 31, 2024, BGSI’s management evaluated the effectiveness of the design and operation of its disclosure controls and procedures, as defined under the rules adopted by the Canadian securities regulatory authorities. Disclosure controls are procedures designed to ensure that information required to be disclosed in reports filed with securities regulatory authorities is recorded, processed, summarized and reported on a timely basis, and is accumulated and communicated to BGSI’s management, including the CEO and the CFO, as appropriate, to allow timely decisions regarding required disclosure.

BGSI’s management, including the CEO and the CFO, does not expect that BGSI’s disclosure controls will prevent or detect all misstatements due to error or fraud. Because of the inherent limitations in all control systems, an evaluation of controls can provide only reasonable, not absolute assurance, that all control issues and instances of fraud or error, if any, within BGSI have been detected. BGSI is continually evolving and enhancing its systems of controls and procedures. Based on the evaluation of disclosure controls, the CEO and the CFO have concluded that, subject to the inherent limitations noted above, BGSI’s disclosure controls are effective in ensuring that material information relating to BGSI is made known to management on a timely basis, and is fairly presented in all material respects in this Annual Report.

CERTIFICATION ON INTERNAL CONTROL OVER FINANCIAL REPORTING

Management is responsible for the design and effectiveness of internal control over financial reporting in order to provide reasonable assurance regarding the reliability of financial reporting and the preparation of financial statements for external purposes in accordance with Canadian generally accepted accounting principles which incorporates International Financial Reporting Standards for publicly accountable enterprises. BGSI’s management, including the CEO and the CFO, does not expect that BGSI’s internal control over financial reporting will prevent or detect all misstatements due to error or fraud. Because of the inherent limitations in all control systems, an evaluation of controls can provide only reasonable, not absolute assurance, that all control issues and instances of fraud or error, if any, within BGSI have been detected. BGSI is continually evolving and enhancing its systems of internal controls over financial reporting. The CEO and CFO of BGSI have evaluated the design and effectiveness of BGSI’s internal control over financial reporting as at the end of the period covered by the annual filings and have concluded that, subject to the inherent limitations noted above, the controls are sufficient to provide reasonable assurance.


27


BUSINESS RISKS AND UNCERTAINTIES

The following information is a summary of certain risk factors relating to the business of BGSI and its subsidiaries, and is qualified in its entirety by reference to, and must be read in conjunction with, the detailed information appearing elsewhere in this Annual Report and the documents incorporated by reference herein.

BGSI and its subsidiaries are subject to certain risks inherent in the operation of the business. BGSI and its subsidiaries manage risk and risk exposures through a combination of management oversight, insurance, systems of internal controls and disclosures and sound operating policies and practices.

The Board of Directors has the responsibility to identify the principal risks of BGSI’s business and ensure that appropriate systems are in place to manage these risks. The Audit Committee has the responsibility to discuss with management BGSI’s major financial risk exposures and the steps management has taken to monitor and control such exposures, including BGSI’s risk assessment and risk management policies. In order to support these responsibilities, management has a risk and sustainability management committee which meets on an ongoing basis to evaluate and assess BGSI’s risks.

The process being followed by the risk and sustainability management committee is a systematic one which includes identifying risks; analyzing the likelihood and consequence of risks; and then evaluating risks as to risk tolerance and control effectiveness. This approach stratifies risks into four risk categories as follows:


Extreme Risks:


Immediate/ongoing action is required – involvement of senior management is required. Avoidance of the item may be necessary if risk reduction techniques are insufficient to address the risk.

High Risks:


Risk item is significant and management responsibility should be specified and appropriate action taken.

Moderate Risks:


Managed by specific monitoring or response procedures. Additional risk mitigation techniques could be considered if benefits exceed the cost.

Low Risks:


Management by routine procedures. No further action is required at this time.

Risks can be reduced by limiting the likelihood or the consequence of a particular risk. This can be achieved by adjusting the Company’s activities, implementing additional control/monitoring processes, or insuring/hedging against certain outcomes. Residual risk remains after mitigation and control techniques are applied to an identified risk. Awareness of the residual risk that BGSI ultimately accepts is a key benefit of the risk management process.

The following describes the risks that are most material to BGSI’s business; however, this is not a complete list of the potential risks BGSI faces. There may be other risks that BGSI is not aware of, or risks that are not material today that could become material in the future.

Decline in Number of Insurance Claims

The automobile collision repair industry is dependent on the number of accidents which occur and, for the most part, become repairable insurance claims. The automobile collision repair industry could experience a decrease in repairable claims, higher total loss rates as well as a deferral in repairs and an increase in non-filed claims. This could be driven by several factors including significant insurance premium inflation and overall economic uncertainty. There can be no assurance that a continued decline in insurance claims will not occur, which could reduce Boyd’s revenues and result in a material adverse effect on the Company’s business.

The volume of accidents and related insurance claims can also be significantly impacted by technological disruption and changes in technology such as ride sharing, collision avoidance systems, driverless vehicles and other safety improvements made to vehicles. Other changes which have and can continue to affect insurance claim volumes include, but are not limited to, weather, general economic conditions, unemployment rates, changing demographics, vehicle miles driven, new vehicle production, insurance policy deductibles and auto insurance premiums. In addition, repairable claims volumes have been and can continue to be impacted by an increased number of non-repairable claims or total loss. There can be no assurance that a continued decline in insurance claims will not occur, which could reduce Boyd’s revenues and result in a material adverse effect on the Company’s business.


28


Employee Relations and Staffing

Boyd currently employs approximately 13,449 people, of which 1,558 are in Canada and 11,891 are in the U.S. The current workforce is not unionized, except for approximately 62 employees located in the U.S. who are subject to collective bargaining agreements. The collision repair industry typically experiences competition for talent, and, in particular, a limited pool of qualified technicians and estimators. This can result in a shortage of qualified employees as well as wage pressure, which could adversely impact the volume and pace at which collision repair shops can fix damaged vehicles and the Company’s financial results.

Attracting, training, developing and retaining employees at all levels of the organization are required to effectively manage Boyd’s operations. The Company has rolled out various training, retention and recruitment initiatives to mitigate this risk. Failure to attract, train, develop and retain employees at all levels of the organization could lead to a lack of production capacity, knowledge, skills and experience required to effectively manage the business and could have a material adverse effect on the Company’s business, financial condition and future performance.

Acquisition and New Location Risk

The Company plans to continue to increase revenues and earnings through the acquisition and start-up of additional collision repair facilities and other businesses. The Company follows a detailed process of due diligence and approvals to limit the possibility of acquiring or building out a non-performing location or business. There can be no assurance that the Company will be able to find suitable acquisition targets at acceptable pricing levels, or that the Company will be able to find and build out locations without incurring cost overruns, or that the new locations will achieve sales and profitability levels to justify the Company’s investment.

Boyd views the United States and Canada as having significant potential for further expansion of its business. There can be no assurance that any market for the Company’s services and products will develop either at the local, regional or national level. Economic instability, laws and regulations, increasing acquisition valuations and the presence of competition in all or certain jurisdictions may limit the Company’s ability to successfully expand operations.

The Company has grown rapidly through multi-location acquisitions as well as single location growth opportunities and new location development. Rapid growth can put a strain on managerial, operational, financial, human and other resources. Risks related to rapid growth include administrative and operational challenges such as the management of an expanded number of locations, the assimilation of financial reporting systems, technology and other systems of acquired companies, increased pressure on senior management and increased demand on systems and internal controls. The ability of the Company to manage its operations and expansion effectively depends on the continued development and implementation of plans, systems and controls that meet its operational, financial and management needs. If Boyd is unable to continue to develop and implement these plans, systems or controls or otherwise manage its operations and growth effectively, the Company will be unable to maintain or increase margins or achieve sustained profitability, and the business could be harmed.

A key element of the Company’s strategy is to successfully integrate and manage new locations in order to sustain and enhance profitability. There can be no assurance that the Company will be able to profitably integrate and manage additional locations. Successful integration and management can depend upon a number of factors, including the ability to establish, maintain and grow DRP relationships, the ability to attract, retain and motivate certain key management and staff, establishing, retaining and leveraging client and supplier relationships and implementing standardized procedures and best practices. In the event that new location growth cannot be successfully integrated into Boyd’s operations or performs below expectations, the business could be materially and adversely affected.

To the extent that the prior owners of businesses acquired by BGSI failed to comply with or otherwise violated applicable laws, the Company, as the successor owner, may be financially responsible for these violations and any associated undisclosed liability. The Company seeks, through systematic investigation and due diligence, and through indemnification by former owners, to minimize the risk of material undisclosed liabilities associated with acquisitions. The discovery of any material liabilities, including but not limited to tax, legal and environmental liabilities, could have a material adverse effect on the Company’s business, financial condition and future prospects.


29


Operational Performance

In order to compete in the marketplace, the Company must consistently meet the operational performance metrics expected by its insurance company clients and its customers. Failing to deliver on metrics such as cycle time, quality of repair, customer satisfaction and cost of repair can, over time, result in reductions to pricing, repair volumes, or both. The Company has implemented processes as well as measuring and monitoring systems to assist it in delivering on these key metrics. However, there can be no assurance that the Company will be able to continue to deliver on these metrics or that the metrics themselves will not change in the future.

The Company’s principal source of funds is cash generated from operations. Fluctuations in required capital expenditures, the need to maintain productive capacity, required funding to meet growth targets, and debt repayments expected to be funded by cash flows generated from operations may potentially impact the amount of cash available for dividends to be declared and paid by the Company or its subsidiaries in the future.

Brand Management and Reputation

The Company’s success is impacted by its ability to protect, maintain and enhance the value of its brands and reputation. Brand value and reputation can be damaged by isolated incidents, particularly if the incident receives considerable publicity or if it draws litigation. Incidents may occur as a result of events beyond the Company’s control or may be isolated to actions that occur in one particular location. Demand for the Company’s services could diminish significantly if an incident or other matter damages its brand or erodes the confidence of its insurance company clients or directly with the vehicle owners themselves. Social media has increased the ability for individuals to adversely affect the brand and reputation of the Company. There can be no assurance that past or future incidents will not negatively affect the Company’s brand or reputation.

Market Environment Change

The collision repair industry is subject to continual change in terms of regulations, repair processes and equipment, technology and changes in the strategic direction of clients, suppliers and competitors. The Company endeavors to stay abreast of developments and preferences in the industry and make strategic decisions to manage these changes and potential disruptions to the traditional business model. In certain situations, the Company is involved in leading change by anticipating or developing new methods to address changing market needs. The Company however, may not be able to correctly anticipate the need for change, may not effectively implement changes, or may be required to increase spending on capital equipment to maintain or improve its relative position with competitors. There can be no assurance that market environment changes will not occur that could negatively affect the financial performance of the Company.

Reliance on Technology

As is the case with most businesses in today’s environment, there is a risk associated with Boyd’s reliance on computerized operational and reporting systems. Boyd makes reasonable efforts to ensure that back-up systems and redundancies are in place and functioning appropriately. Boyd has disaster recovery programs to protect against significant system failures. Although a computer system failure would not be expected to critically damage the Company in the long term, there can be no assurance that a computer system crash or like event would not have a material impact on its financial results.

Reliance on technology in order to gain or maintain competitive advantage is becoming more significant and therefore the Company is faced with determining the appropriate level of investment in new technology in order to be competitive. There can be no assurance that the Company will correctly identify or successfully implement the appropriate technologies for its operations. In addition, there is a risk that third party provided systems are unable to meet business needs, emerging requirements or provide support of their product, which could adversely impact Boyd’s performance.


30


Increased reliance on computerized operational and reporting systems also results in increased cyber security risk, including potential unauthorized access to customer, supplier and employee sensitive information, corruption or loss of data and release of sensitive or confidential information. Disruptions due to cyber security incidents could adversely affect the business, results of operations and financial condition of the Company. Cyber security incidents could result in operational delays, disruption to work flow and reputational harm. There can be no assurance that Boyd will be able to anticipate, prevent or mitigate rapidly evolving types of cyber-attacks.

Supply Chain Risk

The Company requires access to parts, materials and paint in order to complete repairs. Disruptive events can negatively impact supply chains, which can adversely impact Boyd’s ability to complete repairs. This may result in increased repair cycle time, high levels of work-in-process and decreased margins, and could adversely impact the Company’s financial results.

Certain of the Company’s suppliers operate in unionized environments, where their workers are subject to collective bargaining agreements. A prolonged strike at a supplier could adversely impact Boyd’s ability to complete repairs. It is possible that a prolonged strike could disrupt the Company’s supply chain, which could have a material impact on the Company’s financial results.

Global issues, such as outbreaks and the spread of contagious diseases, political instability, war or other disruptive events can negatively impact global supply chains, which could adversely impact Boyd’s ability to complete repairs. It is possible that global issues could further disrupt the Company’s supply chain, which could have a material impact on the Company’s financial results.

Margin Pressure and Sales Mix Changes

The Company’s costs to repair vehicles, including the cost of labor, parts and materials are market driven and can fluctuate. There can be no assurance that increases in the costs to repair vehicles will ultimately be recoverable from the Company’s clients or customers.

The Company’s margin is also impacted by the mix of collision repair, retail glass and glass network sales, scanning and calibration, as well as the mix of parts, labor and materials within each business area. There can be no assurance that changes to sales mix will not occur that could negatively impact the financial performance of the Company.

The Company currently makes its own part sourcing decisions for parts used in the provision of vehicle repair services. The Company’s clients could, in the future, decide to source products directly, impose the use of certain parts suppliers on the Company or otherwise change the parts sourcing process. Such a decision could have an adverse effect on the Company’s margin.

Economic Downturn

Historically the collision repair industry has proven to be resilient to typical economic downturns along with the accompanying unemployment, and while the Company works to mitigate the effect of economic downturn on its operations, economic conditions, which are beyond the Company’s control, could lead to a decrease in accident repair claims volumes due to fewer miles driven, less traffic congestion, or due to vehicle owners being less inclined to have their vehicles repaired. It is difficult to predict the severity and the duration of any decrease in claims volumes resulting from an economic downturn and the accompanying unemployment and what effect it may have on the collision repair industry, in general, and the financial performance of the Company in particular. There can be no assurance that an economic downturn would not negatively affect the financial performance of the Company.


31


Changes in Client Relationships

A high percentage of the Company’s revenues are derived from insurance companies. Over the past 25+ years, many private insurance companies have implemented customer referral arrangements known as Direct Repair Programs (DRP’s) with collision repair operators who have been recognized as consistent high quality, performance based repairers in the industry. The Company’s ability to continue to grow its business, as well as maintain existing business volume and pricing, is largely reliant on its ability to maintain these DRP relationships. The Company continues to develop and monitor these relationships through ongoing measurement of the success factors considered critical by insurance clients. The loss of any existing material DRP relationship, or a material component of a significant DRP relationship, could have a material adverse effect on Boyd’s operations and business prospects. Of the top five insurance companies that the Company deals with, which in aggregate account for approximately 51% (2023 – 53%) of total sales, one insurance company represents approximately 16% (2023 – 19%) of the Company’s total sales, while a second insurance company represents approximately 12% (2023 – 11%).

DRP relationships are governed by agreements that are usually cancellable upon short notice. These relationships can change quickly, both in terms of pricing and volumes, depending upon collision repair shop performance, cycle time, cost of repair, customer satisfaction, competition, insurance company management, program changes and general economic activity. To mitigate this risk, management fosters close working relationships with its insurance company clients and customers and the Company continually seeks to diversify and grow its client base both in Canada and the U.S. There can be no assurance that relationships with insurance company clients will not change in the future, which could impair Boyd’s revenues and/or margins, and result in a material adverse effect on the Company’s business.

Environmental, Health and Safety Risk

The nature of the collision repair business means that hazardous substances must be used, which could cause damage to the environment or individuals if not handled properly. The Company’s environmental protection policy requires environmental site assessments to be performed on all business locations prior to acquisition, start-up or relocation so that any existing or potential environmental situations can be remedied or otherwise appropriately addressed. It is also Boyd’s practice to secure environmental indemnification from landlords and former owners of acquired collision repair businesses, where such indemnification is available. Boyd also engages a private environmental consulting firm to perform regular compliance reviews to ensure that the Company’s environmental and health and safety policies are followed.

To date, the Company has not encountered any environmental protection requirements or issues which would be expected to have a material financial or operational effect on its current business and it is not aware of any material environmental issues that could have a material impact on future results or prospects. No assurance can be given, however, that the prior activities of Boyd, or its predecessors, or the activities of a prior owner or lessee, have not created a material environmental problem or that future uses or evolving regulations will not result in the imposition of material environmental, health or safety liability upon Boyd.

Climate Change and Weather Conditions

Climate change is exacerbated in part by the burning of fossil fuels in order to generate electricity for consumers and industry. Greenhouse gasses from fossil fuels is leading to climate change and global warming, which is leading to increased frequency and severity of natural disasters and extreme weather condition events. The collision repair industry is not particularly carbon intensive. The business is focused on the collision repair industry and as such its primary product is providing a service. In providing this service, major inputs include replacement parts, water-based paint, skilled labor, and energy to run spray booths, compressors, lighting, HVAC and other equipment. The industry is highly fragmented with many independent owner operators who are not able to operate at scale. There are efforts to consolidate the industry and the Company is a leader in this effort. By doing so, the industry can operate more efficiently and have the central coordination and capital to invest in sustainability areas to reduce the impact the industry has on the environment.

Transitioning to a low carbon environment and sustainable business model will require additional investments in the long- term. Capital investments in energy saving or renewable energy technologies to operate the shop, can reduce or offset the contribution to carbon emissions that the Company currently emits. Investments could be necessary for sensors and other systems to manage electricity usage or identify future opportunities. Facility management and landscape management are areas of opportunity to improve the impact Boyd’s locations have on global warming.


32


The primary climate related risks for the business relate to the expected increase in extreme weather events, such as blizzards, hurricanes, wild-fires, torrential rain, and tornadoes. These events can cause physical damage to shops or hinder Boyd’s ability to process work and also tend to result in higher damage levels that result in more vehicles being non-repairable. Extreme weather can also slow or halt delivery of parts and in some cases prevent employees from attending work, which slows down cycle-time and therefore sales.

A number of initiatives related to climate change can benefit the Company. For example investing in LED lighting improves the working conditions for technicians and can improve the quality of the work they do, as well as lowering operating costs and reducing emissions. Continuous improvement and efficiency gains can improve quality and reduce repair cycle time, causing less waste, higher customer satisfaction and generating higher sales with the same level of inputs. A greater focus on repairing damaged parts as opposed to replacing those parts reduces waste and in some cases can improve profitability. Alignment with vehicle owner, insurance company and original equipment manufacturer objectives improves Boyd’s customer relationships and demonstrates an ability to align and partner with these stakeholders.

There is good alignment between climate change initiatives and the Company’s strategy. Core strategies of operational excellence, expense management and optimizing the business as well as new location and acquisition growth have overlap with sustainability. Being efficient, reducing waste and bringing corporate resources and investment to a fragmented industry supports a long-term alignment with sustainability. Environment, social and governance objectives are being integrated into the Company’s strategic projects. There is often a dimension of each business initiative that relates to sustainability. Boyd is committed to identifying those dimensions and bringing awareness throughout the company so that business objectives naturally contribute to our sustainability goals, which have been outlined in Boyd’s Environmental, Social and Governance Report, which is available on the Boyd website at www.boydgroup.com/sustainability.

The Board is investing more time on sustainability issues and has assigned the oversight responsibility for sustainability, including climate change risk management and disclosure to the Governance & Sustainability Committee. The topic is a standing agenda item with internal metrics and reporting being developed. Management has a Risk and Sustainability Committee tasked with developing sustainability objectives and processes for the company. Its current mandate is to work with the various operating groups to identify the key sustainability metrics for future reporting and target setting. These key metrics and targets will be focused on the priority areas defined for each of the environmental, social and governance pillars that have been outlined in Boyd’s Environmental, Social and Governance Report.

The effect of global warming and its impact on weather conditions may reduce collision repair volume and represent an element of risk to the Company’s ability to maintain sales. Historically, extremely mild winters and dry weather conditions have had a negative impact on collision repair sales volumes. Natural disasters resulting in business interruption, or supply chain interruption could also negatively impact the Company’s operations. Even with market share gains, weather-related decline in market size can result in sales declines which could have a material impact on the Company’s business. Business interruption due to natural disasters and extreme weather condition events, including supply chain interruption, may result in temporary store closures or limit production volume and could adversely impact Boyd’s ability to complete repairs, which could have a material adverse effect on the Company’s business.

Pandemic Risk

A local, regional, national or international outbreak of a contagious disease, such as the COVID-19 coronavirus, Middle East Respiratory Syndrome, Severe Acute Respiratory Syndrome, H1N1 influenza virus, avian flu or any other similar illness, could decrease the willingness of the general population to travel or customers to patronize the Company’s facilities, cause shortages of employees to staff the Company’s facilities, interrupt supplies from third parties upon which the Company relies, result in governmental regulation adversely impacting the Company’s business and otherwise have a material adverse effect on the Company’s business, financial condition and results of operations.

The outbreak of a contagious illness, such as the COVID-19 pandemic, could require the Company to develop and execute revised operating procedures intended to mitigate safety and health risks in the work environment. However, there can be no assurance that the enhanced protocols put in place will protect against an outbreak that could result in lost time and negatively affect the financial performance of the Company.


33


Competition

The collision repair industry in North America, estimated by Boyd to represent over $50 billion in annual revenue, is very competitive. The main competitive factors are cost of repair, cycle time, quality, customer satisfaction and adherence to various insurance company processes and performance requirements. There can be no assurance that Boyd’s competitors will not achieve greater market acceptance due to performance or other factors.

Although competition exists mainly on a regional basis, Boyd competes with a small number of other multi-location collision repair operators in multiple markets in which it operates.

Given these industry characteristics, existing or new competitors, including other automotive-related businesses, may become significantly larger and have greater financial and marketing resources than Boyd. Competitors may compete with Boyd in rendering services in the markets in which Boyd currently operates and also in seeking existing facilities to acquire, or new locations to open, in markets in which Boyd desires to expand. There can be no assurance that the Company will be able to maintain or achieve its desired market share.

Access to Capital

The Company grows, in part, through acquisition or start-up of collision and glass repair and replacement businesses. There can be no assurance that Boyd will have sufficient capital resources available to implement its growth strategy. Inability to raise new capital, in the form of debt or equity, could limit Boyd’s future growth through acquisition or start-up.

The Company will endeavor, through a variety of strategies, to ensure in advance that it has sufficient capital for growth. Potential sources of capital that the Company has been successful at accessing in the past include public and private equity placements, convertible debt offerings, using equity securities to directly pay for a portion of acquisitions, capital available through strategic alliances with trading partners, lease financing, seller financing and both senior and subordinate debt facilities or by deferring possible future purchase price payments using contingent consideration and call or put options. There can be no assurance that the Company will be successful in accessing these or other sources of capital in the future.

The Company and its subsidiaries use financial leverage through the use of debt, which have debt service obligations. The Company’s ability to refinance or to make scheduled payments of interest or principal on its indebtedness will depend on its future operating performance and cash flow, which are subject to prevailing economic conditions, prevailing interest rates, and financial, competitive, business and other factors, many of which are beyond its control.

The Company’s revolving credit facilities contain restrictive covenants that limit the discretion of the Company’s management and the ability of the Company to incur additional indebtedness, to make acquisitions of collision repair businesses, to create liens or other encumbrances, to pay dividends, to redeem any equity or debt, or to make investments, capital expenditures, loans or guarantees and to sell or otherwise dispose of assets and merge or consolidate with another entity. In addition, the revolving credit facilities contain a number of financial covenants that require BGSI and its subsidiaries to meet certain financial ratios and financial condition tests. A failure to comply with the obligations under these credit facilities could result in an event of default, which, if not cured or waived, could permit acceleration of the relevant indebtedness. If the indebtedness were to be accelerated, there can be no assurance that the assets of the Company and its subsidiaries would be sufficient to repay the indebtedness in full. There can also be no assurance that the Company will be able to refinance the credit facilities as and when they mature. The revolving credit facility is secured by the assets of the Company.


34


Dependence on Key Personnel

The success of the Company is dependent on the services of a number of members of management. The experience and talent of these individuals is a significant factor in Boyd’s continued success and growth. The loss of one or more of these individuals could have a material adverse effect on the Company’s business operations and prospects. The Company has entered into management agreements with key members of management and succession plans are in place for key executive positions, in order to mitigate this risk.

Tax Position Risk

BGSI and its subsidiaries account for income tax positions in accordance with accounting standards for income taxes, which require that the Company recognize in the financial statements, the impact of a tax position, if that position is more likely than not of being sustained on examination by taxation authorities, based on the technical merits of the position.

Inherent risks and uncertainties can arise over tax positions taken, or expected to be taken, with respect to matters including but not limited to acquisitions, transfer pricing, inter-company charges and allocations, financing charges, fees, related party transactions, tax credits, tax based incentives and stock based transactions. Management uses tax experts to assist in correctly applying and accounting for tax and government assistance program rules, however there can be no assurance that a position taken will not be challenged by the taxation authorities that could result in an unexpected material financial obligation.

Expenses incurred by BGSI and its subsidiaries are only deductible to the extent they are reasonable. There can be no assurance that the taxation authorities will not challenge the reasonableness of certain expenses. If such a challenge were successful, it may materially and adversely affect the financial results of BGSI and its subsidiaries.

BGSI’s shares are qualified investments for a Registered Plan under the Tax Act as the Shares are listed on a “designated stock exchange” (as defined in the Tax Act).

There can be no assurance that additional changes to the taxation of corporations or changes to other government laws, rules and regulations, either in Canada or the U.S., will not be undertaken which could have a material adverse effect on BGSI’s share price and business. There can be no assurance BGSI will benefit from these rules, that the rules will not change in the future or that BGSI will avail itself of them.

Corporate Governance

Securities law imposes statutory civil liability for misrepresentations in continuous disclosure documents including failure to make timely disclosure. Investors have a right of action if they are harmed by a misrepresentation in an issuer’s disclosure document or in a public oral statement relating to an issuer, or the failure of an issuer to make timely disclosure of a material change. Potentially liable parties include the issuer, each officer, and each Director of the issuer who authorizes, permits or acquiesces in the release of the document containing a misrepresentation, the making of the public statement containing a misrepresentation or in the failure to make a timely disclosure.

Under the Ontario Securities Act, section 138.4(6), a due diligence defense is available. The due diligence defense requires the following items to be addressed:


  •  

the issuer must have a system designed to ensure the issuer is meeting its disclosure obligations;


  •  

the defendant must have conducted a reasonable investigation to support reliance on the system; and


  •  

defendants must have no reasonable grounds to believe that the document or a public oral statement contained a misrepresentation or that the failure to make the required disclosure would occur.

BGSI is keenly aware of the significance of these laws and the interrelationships between civil liability, disclosure controls and good governance. BGSI has adopted policies, practices and processes to reduce the risk of a governance or control breakdown. A statement of BGSI’s governance practices is included in its most recent information circular which can be found at www.sedarplus.com. Although BGSI believes it follows good corporate governance practices, there can be no assurance that these practices will eliminate or mitigate the impact of a material lawsuit in this area.


35


The area of governance is growing to encompass not only traditional governance matters, but also environmental and social matters. This area is often referred to as Environmental, Social and Governance, or “ESG”. Increased awareness and attention by investors to ESG matters means that the Company needs to become more transparent in developing and reporting on ESG initiatives and increase or add ESG initiatives where there are significant gaps. BGSI is developing and enhancing ESG reporting and initiatives. Boyd publishes an ESG report, which complements previously adopted policies on reporting and anti-retaliation, occupational health and safety, non-discrimination and anti-harassment, human rights, diversity, code of business conduct and ethics, business partner code of conduct and anti-corruption. These policies, along with the ESG Report, are available on the Boyd website at www.boydgroup.com/sustainability.

Increased Government Regulation and Tax Risk

BGSI and its subsidiaries are subject to various federal, provincial, state and local laws, regulations and taxation authorities. Various federal, provincial, state and local agencies as well as other governmental departments administer such laws, regulations and their related rules and policies. New laws governing BGSI or its business could be enacted or changes or amendments to existing laws and regulations could be enacted which could have a significant impact on Boyd. For example, privacy legislation continues to evolve rapidly and tariff changes are being introduced with greater frequency. BGSI utilizes the services of professional advisors in the areas of taxation, environmental, health and safety, labor and general business law to mitigate the risk of non-compliance. Failure to comply with the applicable laws, regulations or tax changes may subject BGSI to civil or regulatory proceedings and no assurance can be given that this will not have a material impact on financial results.

BGSI and its subsidiaries operate distinct businesses in Canada and the U.S. The Company operates a service business and a major component of our services is labor which would not be subject to tariffs. The Company sources parts and materials from domestic vendors in Canada and the U.S. Any changes in tariffs on exports or imports to and from Canada and the U.S may impact the cost of repairs and decrease margins. There can be no assurance that the changes in tariffs would not negatively affect the financial performance of the Company.

A number of jurisdictions in which the Company operates have regulations to limit emissions and pollutants. The Company has adapted its processes in an effort to comply with these regulations. Although to date, there have been no negative consequences as a result of these regulations, there can be no assurance that these regulations will not have a material adverse impact on BGSI’s business or financial results. Future emission or pollutant regulation compliance requirements may have a material adverse impact on BGSI’s business or financial results.

Fluctuations in Operating Results and Seasonality

The Company’s operating results have been and are expected to continue to be subject to quarterly fluctuations due to a variety of factors including changes in customer purchasing patterns, pricing paid to insurance companies, general operating effectiveness, automobile technologies, general and regional economic downturns, unemployment rates, employee vacation timing and weather conditions. These factors can affect Boyd’s financial results.

Risk of Litigation

BGSI and its subsidiaries could become involved in various legal actions in the ordinary course of business. Litigation loss accruals may be established if it becomes probable that BGSI will incur an expense and the amount can be reasonably estimated. BGSI’s management and internal and external experts are involved in assessing the probability of litigation loss and in estimating any amounts involved. Changes in these assessments may lead to changes in recorded litigation loss accruals. Claims are reviewed on a case by case basis, taking into consideration all information available to BGSI.

The actual costs of resolving claims could be substantially higher or lower than the amounts accrued. In certain cases, legal claims may be covered under BGSI’s various insurance policies.


36


Execution on New Strategies

New initiatives are introduced from time to time in order to grow Boyd’s business. Initiatives such as entering new markets, introducing and improving related products and services, or identifying new strategies to capture additional market share have the potential to be accretive to the Company’s business when the opportunity is accurately identified and executed. There can be no assurance that the Company identifies new strategies that are accretive to the business or that it is successful in implementing such initiatives.

Insurance Risk

BGSI insures its property, plant and equipment, including vehicles, through insurance policies with insurance carriers located in Canada and the U.S. Included within these policies is insurance protection against property loss and general liability. BGSI also insures its directors and officers against liabilities arising from errors, omissions and wrongful acts. Management uses its knowledge, as well as the knowledge of experienced brokers, to ensure that insurable risks are insured appropriately under terms and conditions that would protect BGSI and its subsidiaries from losses. There can be no assurance that all perils would be fully covered or that a material loss would be recoverable under such insurance policies.

Interest Rates

The Company occasionally fixes the interest rate on its debt using interest rate swap contracts or other provisions available in its debt facilities. There can be no guarantee that interest rate swaps or other contract terms that effectively turn variable rate debt into fixed rates will be an effective hedge against long-term interest rate fluctuations.

The Company has not fixed interest rates within its revolving credit facility. There can be no assurance that interest rates either in Canada or the U.S. will not increase in the future, which could result in a material adverse effect on the Company’s business.

U.S. Health Care Costs and Workers Compensation Claims

BGSI accrues for the estimated amount of U.S. health care claims and workers compensation claims that may have occurred but were not reported at the end of the reporting period under its health care and workers compensation plans. The accruals are based upon the Company’s knowledge of current claims as well as third party estimates derived from past experience. Significant claim occurrences which remain unreported for a number of months could materially impact this accrual. In addition, as U.S health care costs increase, there can be no assurance given that the Company can continue to offer health care insurance to its employees at a reasonable cost.

Foreign Currency Risk

A substantial portion of Boyd’s revenue and cash flow are now, and are expected to continue to be, generated in U.S. dollars. Fluctuations in the exchange rates between the Canadian dollar and the U.S. currency may have a material adverse effect on BGSI’s share price, which is denominated and trades in Canadian dollars as well as BGSI’s ability to make future Canadian dollar cash dividends.

Capital Expenditures

The business of the Company requires ongoing capital maintenance. Moreover, opportunities may arise for capital upgrades providing returns or cost savings that may not be realized in the immediate future, but rather over several years. As vehicle technology advances and market needs change, the capital intensity of the industry is changing, requiring expenditures in excess of historical capital maintenance levels. To the extent that capital expenditures are in excess of amounts budgeted, the amounts of cash available for dividends may decrease.


37


Low Capture Rates

Sales growth can be enhanced if the Company is effective at booking repair orders for all sales opportunities that are identified. The Company is exposed to missed jobs when capacity is constrained and to the extent that employees are ineffective at capturing all sales opportunities. Measurement of capture rates, management support and training are methods that are employed to enhance capture rates. Efforts to increase capacity are limited by availability of qualified labor. It is possible that the Company may not be able to capture sales effectively enough to maximize sales.

Energy Costs

The Company is exposed to fluctuations in the price of energy. These costs not only impact the costs associated with occupying and operating collision repair facilities but may also affect costs of parts and materials used in the repair process as well as miles driven by automobile owners. There can be no assurance that escalating costs which cannot be offset by energy conservation practices, price increases to clients and customers or productivity gains, would not result in materially lower operating margins. As well, there can be no assurance that escalating energy costs will not materially reduce automobile miles driven and in turn reduce the number of collisions.

ADDITIONAL INFORMATION

BGSI’s shares trade on the Toronto Stock Exchange under the symbol TSX: BYD.TO. Additional information relating to the BGSI is available on SEDAR+ (www.sedarplus.com) and the Company website (www.boydgroup.com).


38