| Fund | Costs of a $10,000 Investment | Costs Paid as a Percentage of a $10,000 Investment |
|---|---|---|
| IPS Strategic Capital Absolute Return Fund | $78 | 1.50%1 |
The Fund delivered strong results during the 12-month period ending August 31, 2025, supported by a disciplined approach that combined options strategies, active risk management, and dynamic beta adjustments. This strategy placed the Fund in the top 30th percentile of its peer group over the last three years.
Core Drivers of Performance:
Box Spreads: The Adviser, IPS Strategic Capital, Inc., utilized OCC-cleared box spreads. This created a synthetic portfolio of long calls and puts, allowing the Fund to remain flexible while taking advantage of prevailing yields.
Put Bear Spreads and Ratio Spreads: Allowed the Adviser to create convexity with a negative delta, positive gamma and positive theta. Depending on the level of volatility (VIX), the Adviser is able to strike the ratios with either a positive or negative vega controlling the exposure to that Greek.
Positive Gamma Positioning: By maintaining a portfolio with positive gamma, the Fund was able to amplify participation during market rallies while naturally reducing exposure in downturns. This gamma effect smoothed portfolio outcomes by automatically raising beta in rising markets and lowering it in falling markets.
Active Beta Management: The Adviser adjusted the Fund's beta in response to market conditions—raising it during market pullbacks to capture rebounds and lowering it during rallies to protect realized gains. This tactical rebalancing reduced the risks often associated with traditional momentum-driven approaches, helping maintain steadier returns.
Outcome:
The combined effect of these strategies resulted in top-quartile performance relative to comparable funds. By leveraging higher interest rates, implementing sophisticated options structures, and carefully managing beta exposure, the Fund was able to capture gains in rising markets while limiting losses in declining ones. The result was a well-balanced and effective investment process that highlighted both risk control and return generation.
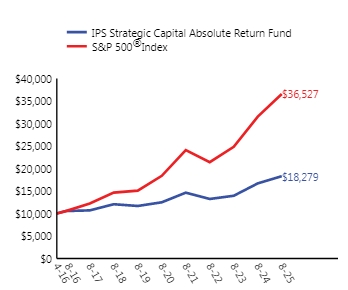
| One Year | Five Years | Inception (04/15/2016) | |
|---|---|---|---|
| IPS Strategic Capital Absolute Return Fund | 9.60% | 7.93% | 6.64% |
| S&P 500® Index | 15.88% | 14.74% | 14.82% |
| Net Assets ($) | $53,523,448 |
| Number of Portfolio Holdings | |
| Portfolio Turnover Rate (%) | 0% |
| Total Advisory Fees Paid ($) | $267,711 |
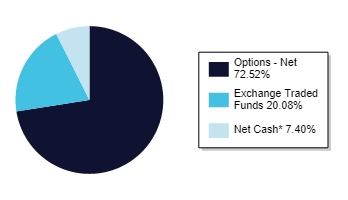
* Net Cash represents money market funds and other assets in excess of liabilities.