Pay vs Performance Disclosure - USD ($)
Jun. 30, 2023
May 04, 2023
Jun. 30, 2025
Jun. 30, 2024
Jun. 30, 2023
Pay Versus Performance Disclosure
Pay Versus Performance Table
PAY VERSUS PERFORMANCE | ||||||||||||||||||||||||||
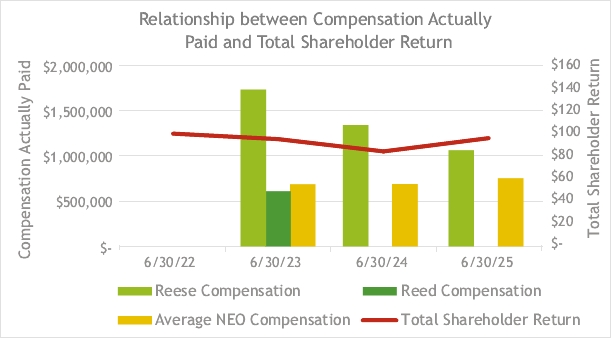
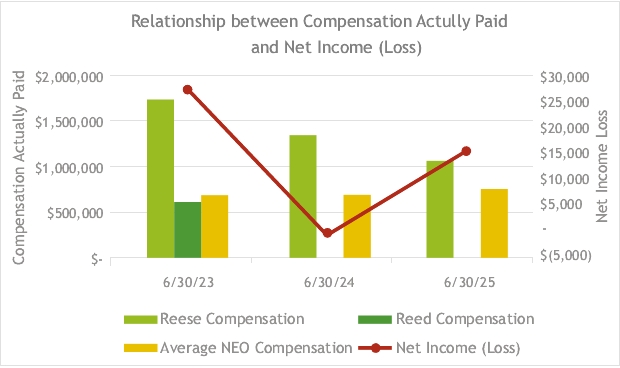
Year (a) | Summary Compensation Table (SCT) Total for Jason W. Reese (b-1)(1) | Compensation Actually Paid (CAP) to Jason W. Reese (c-1)(1)(2) | SCT Total for Peter A. Reed (b-2)(1) | CAP to Peter A. Reed (c-2)(1)(2) | Average SCT Total for Non-PEO Named Executive Officers (NEOs) (d)(1) | Average CAP to Non-PEO NEOs (e)(1)(2) | Value of Initial Fixed $100 Investment Based On: Total Shareholder Return (f)(3) | Net Income (Loss) (g) ($ in 000s) | ||||||||||||||||||
2025 | $1,249,999 | $1,061,027 | — | — | $741,926 | $751,789 | $96 | $15,550 | ||||||||||||||||||
2024 | $1,525,091 | $1,341,121 | — | — | $707,041 | $689,204 | $84 | $(926) | ||||||||||||||||||
2023 | $1,468,205 | $1,733,339 | $693,898 | $609,154 | $698,336 | $684,755 | $95 | $27,680 | ||||||||||||||||||
(1) | Mr. Reese has served as our principal executive officer (“PEO”) since May 4, 2023. Peter A. Reed served as our PEO from September 18, 2017 through May 4, 2023. For fiscal years 2025, 2024 and 2023, our non-PEO NEOs included Mr. Kleinman and Mrs. Milz. |
(2) | For each of 2025, 2024, and 2023, the values included in this column for the compensation actually paid to reach of Messrs. Reese and Reed, and the average compensation actually paid to our Non-PEO NEOs reflect the following adjustments to the values included in column (b-1), (b-2) and (d) for fiscal years 2025, 2024, and 2023, respectively: |
Jason W. Reese | 2025 | 2024 | 2023(5) | ||||||||
Summary Compensation Table Total for PEO (column (b-1)) | $1,249,999 | $1,525,091 | $1,468,205 | ||||||||
(-) SCT “Stock Awards” column value | $(249,999) | $(275,000) | — | ||||||||
(-) SCT “Option Awards” column value | — | — | $(400,000) | ||||||||
(+) year-end fair value of equity awards granted in the covered year that are outstanding and unvested as of the covered year-end | $202,148 | $179,347 | $415,006 | ||||||||
(+/-) year-over-year change in fair value of equity awards granted in prior years that are outstanding and unvested as of the covered year-end | $(215,278) | $(162,515)(4) | $(5,230) | ||||||||
(+) vesting date fair value of equity awards granted and vested in the covered year | $62,500 | $68,751 | $265,602 | ||||||||
(+/-) change in fair value as of vesting date (from the prior year-end) of equity awards granted in prior years that vested in the covered year | $11,657 | $5,447 | $(10,244) | ||||||||
(-) fair value as of prior-year end of equity awards granted in prior years that failed to vest in the covered year | — | — | — | ||||||||
(+) dollar value of dividends/earnings paid on equity awards in the covered year | — | — | — | ||||||||
(+) excess fair value for equity award modifications | — | — | — | ||||||||
Compensation Actually Paid to Jason W. Reese (column (c-1)) | $1,061,027 | $1,341,121 | $1,733,339 | ||||||||
Peter A. Reed | 2023 | ||||
Summary Compensation Table Total for PEO (column (b-2)) | $693,898 | ||||
(-) SCT “Stock Awards” column value | — | ||||
(-) SCT “Option Awards” column value | $(84,263) | ||||
(+) year-end fair value of equity awards granted in the covered year that are outstanding and unvested as of the covered year-end | — | ||||
(+/-) year-over-year change in fair value of equity awards granted in prior years that are outstanding and unvested as of the covered year-end | $(106) | ||||
(+) vesting date fair value of equity awards granted and vested in the covered year | — | ||||
(+/-) change in fair value as of vesting date (from the prior year-end) of equity awards granted in prior years that vested in the covered year | $(375) | ||||
(-) fair value as of prior-year end of equity awards granted in prior years that failed to vest in the covered year | — | ||||
(+) dollar value of dividends/earnings paid on equity awards in the covered year | — | ||||
(+) excess fair value for equity award modifications | — | ||||
Compensation Actually Paid to Peter A. Reed (column (c-2)) | $609,154 | ||||
Average for Non-PEO NEOs | 2025 | 2024(5) | 2023(5) | ||||||||
Average Summary Compensation Table Total for Non-PEO NEOs (column (d)) | $741,926 | $707,041 | $698,336 | ||||||||
(-) SCT “Stock Awards” column value | $(84,376) | $(137,500) | $(216,563) | ||||||||
(-) SCT “Option Awards” column value | — | — | — | ||||||||
(+) year-end fair value of equity awards granted in the covered year that are outstanding and unvested as of the covered year-end | $46,519 | $103,068 | $190,103 | ||||||||
(+/-) year-over-year change in fair value of equity awards granted in prior years that are outstanding and unvested as of the covered year-end | $12,814 | $(19,622) | $(411) | ||||||||
(+) vesting date fair value of equity awards granted and vested in the covered year | $25,204 | $34,376 | $13,478 | ||||||||
(+/-) change in fair value as of vesting date (from the prior year-end) of equity awards granted in prior years that vested in the covered year | $9,702 | $1,841 | $(188) | ||||||||
(-) fair value as of prior-year end of equity awards granted in prior years that failed to vest in the covered year | — | — | — | ||||||||
(+) dollar value of dividends/earnings paid on equity awards in the covered year | — | — | — | ||||||||
(+) excess fair value for equity award modifications | — | — | — | ||||||||
Average Compensation Actually Paid to Non-PEO NEOs (column (e)) | $751,789 | $689,204 | $684,755 | ||||||||
(3) | For each of fiscal year 2025, 2024 and 2023, the cumulative total shareholder return (“TSR”) for the Corporation was calculated as the yearly percentage change in cumulative TSR based on a deemed fixed investment of $100 at market close on June 30, 2021, assuming dividend reinvestment. Because fiscal years are presented in the table in reverse chronological order (from top to bottom), the table should be read from bottom to top for purposes of understanding cumulative returns over time. |
(4) | This amount was amended to reflect the change in the option value granted to Mr. Reese on May 11, 2023. The fair value or change in fair value for options was determined using a Monte-Carlo value as of the applicable year-end or vesting date. |
(5) | Certain amounts disclosed in this column were updated to amend amounts included in our proxy statement for the 2024 Annual Meeting. |
(1) | Mr. Reese has served as our principal executive officer (“PEO”) since May 4, 2023. Peter A. Reed served as our PEO from September 18, 2017 through May 4, 2023. For fiscal years 2025, 2024 and 2023, our non-PEO NEOs included Mr. Kleinman and Mrs. Milz. |
(2) | For each of 2025, 2024, and 2023, the values included in this column for the compensation actually paid to reach of Messrs. Reese and Reed, and the average compensation actually paid to our Non-PEO NEOs reflect the following adjustments to the values included in column (b-1), (b-2) and (d) for fiscal years 2025, 2024, and 2023, respectively: |
Jason W. Reese | 2025 | 2024 | 2023(5) | ||||||||
Summary Compensation Table Total for PEO (column (b-1)) | $1,249,999 | $1,525,091 | $1,468,205 | ||||||||
(-) SCT “Stock Awards” column value | $(249,999) | $(275,000) | — | ||||||||
(-) SCT “Option Awards” column value | — | — | $(400,000) | ||||||||
(+) year-end fair value of equity awards granted in the covered year that are outstanding and unvested as of the covered year-end | $202,148 | $179,347 | $415,006 | ||||||||
(+/-) year-over-year change in fair value of equity awards granted in prior years that are outstanding and unvested as of the covered year-end | $(215,278) | $(162,515)(4) | $(5,230) | ||||||||
(+) vesting date fair value of equity awards granted and vested in the covered year | $62,500 | $68,751 | $265,602 | ||||||||
(+/-) change in fair value as of vesting date (from the prior year-end) of equity awards granted in prior years that vested in the covered year | $11,657 | $5,447 | $(10,244) | ||||||||
(-) fair value as of prior-year end of equity awards granted in prior years that failed to vest in the covered year | — | — | — | ||||||||
(+) dollar value of dividends/earnings paid on equity awards in the covered year | — | — | — | ||||||||
(+) excess fair value for equity award modifications | — | — | — | ||||||||
Compensation Actually Paid to Jason W. Reese (column (c-1)) | $1,061,027 | $1,341,121 | $1,733,339 | ||||||||
Peter A. Reed | 2023 | ||||
Summary Compensation Table Total for PEO (column (b-2)) | $693,898 | ||||
(-) SCT “Stock Awards” column value | — | ||||
(-) SCT “Option Awards” column value | $(84,263) | ||||
(+) year-end fair value of equity awards granted in the covered year that are outstanding and unvested as of the covered year-end | — | ||||
(+/-) year-over-year change in fair value of equity awards granted in prior years that are outstanding and unvested as of the covered year-end | $(106) | ||||
(+) vesting date fair value of equity awards granted and vested in the covered year | — | ||||
(+/-) change in fair value as of vesting date (from the prior year-end) of equity awards granted in prior years that vested in the covered year | $(375) | ||||
(-) fair value as of prior-year end of equity awards granted in prior years that failed to vest in the covered year | — | ||||
(+) dollar value of dividends/earnings paid on equity awards in the covered year | — | ||||
(+) excess fair value for equity award modifications | — | ||||
Compensation Actually Paid to Peter A. Reed (column (c-2)) | $609,154 | ||||
(4) | This amount was amended to reflect the change in the option value granted to Mr. Reese on May 11, 2023. The fair value or change in fair value for options was determined using a Monte-Carlo value as of the applicable year-end or vesting date. |
(5) | Certain amounts disclosed in this column were updated to amend amounts included in our proxy statement for the 2024 Annual Meeting. |
(2) | For each of 2025, 2024, and 2023, the values included in this column for the compensation actually paid to reach of Messrs. Reese and Reed, and the average compensation actually paid to our Non-PEO NEOs reflect the following adjustments to the values included in column (b-1), (b-2) and (d) for fiscal years 2025, 2024, and 2023, respectively: |
Average for Non-PEO NEOs | 2025 | 2024(5) | 2023(5) | ||||||||
Average Summary Compensation Table Total for Non-PEO NEOs (column (d)) | $741,926 | $707,041 | $698,336 | ||||||||
(-) SCT “Stock Awards” column value | $(84,376) | $(137,500) | $(216,563) | ||||||||
(-) SCT “Option Awards” column value | — | — | — | ||||||||
(+) year-end fair value of equity awards granted in the covered year that are outstanding and unvested as of the covered year-end | $46,519 | $103,068 | $190,103 | ||||||||
(+/-) year-over-year change in fair value of equity awards granted in prior years that are outstanding and unvested as of the covered year-end | $12,814 | $(19,622) | $(411) | ||||||||
(+) vesting date fair value of equity awards granted and vested in the covered year | $25,204 | $34,376 | $13,478 | ||||||||
(+/-) change in fair value as of vesting date (from the prior year-end) of equity awards granted in prior years that vested in the covered year | $9,702 | $1,841 | $(188) | ||||||||
(-) fair value as of prior-year end of equity awards granted in prior years that failed to vest in the covered year | — | — | — | ||||||||
(+) dollar value of dividends/earnings paid on equity awards in the covered year | — | — | — | ||||||||
(+) excess fair value for equity award modifications | — | — | — | ||||||||
Average Compensation Actually Paid to Non-PEO NEOs (column (e)) | $751,789 | $689,204 | $684,755 | ||||||||
(5) | Certain amounts disclosed in this column were updated to amend amounts included in our proxy statement for the 2024 Annual Meeting. |