0000826686falseN-CSRSSGA FUNDSN-1A2025-08-310000826686ssga:C000143790Member2024-09-012025-08-3100008266862024-09-012025-08-310000826686ssga:SSGAIndexMSCIACWIexUSAIndex12337BroadBasedIndexMember2024-09-012025-08-310000826686ssga:SSGAIndexMSCIEAFENetDividendIndex12337AdditionalIndexMember2024-09-012025-08-310000826686ssga:C000143790Member2015-08-310000826686ssga:SSGAIndexMSCIACWIexUSAIndex12337BroadBasedIndexMember2015-08-310000826686ssga:SSGAIndexMSCIEAFENetDividendIndex12337AdditionalIndexMember2015-08-310000826686ssga:C000143790Member2015-09-300000826686ssga:SSGAIndexMSCIACWIexUSAIndex12337BroadBasedIndexMember2015-09-300000826686ssga:SSGAIndexMSCIEAFENetDividendIndex12337AdditionalIndexMember2015-09-300000826686ssga:C000143790Member2015-10-310000826686ssga:SSGAIndexMSCIACWIexUSAIndex12337BroadBasedIndexMember2015-10-310000826686ssga:SSGAIndexMSCIEAFENetDividendIndex12337AdditionalIndexMember2015-10-310000826686ssga:C000143790Member2015-11-300000826686ssga:SSGAIndexMSCIACWIexUSAIndex12337BroadBasedIndexMember2015-11-300000826686ssga:SSGAIndexMSCIEAFENetDividendIndex12337AdditionalIndexMember2015-11-300000826686ssga:C000143790Member2015-12-310000826686ssga:SSGAIndexMSCIACWIexUSAIndex12337BroadBasedIndexMember2015-12-310000826686ssga:SSGAIndexMSCIEAFENetDividendIndex12337AdditionalIndexMember2015-12-310000826686ssga:C000143790Member2016-01-310000826686ssga:SSGAIndexMSCIACWIexUSAIndex12337BroadBasedIndexMember2016-01-310000826686ssga:SSGAIndexMSCIEAFENetDividendIndex12337AdditionalIndexMember2016-01-310000826686ssga:C000143790Member2016-02-290000826686ssga:SSGAIndexMSCIACWIexUSAIndex12337BroadBasedIndexMember2016-02-290000826686ssga:SSGAIndexMSCIEAFENetDividendIndex12337AdditionalIndexMember2016-02-290000826686ssga:C000143790Member2016-03-310000826686ssga:SSGAIndexMSCIACWIexUSAIndex12337BroadBasedIndexMember2016-03-310000826686ssga:SSGAIndexMSCIEAFENetDividendIndex12337AdditionalIndexMember2016-03-310000826686ssga:C000143790Member2016-04-300000826686ssga:SSGAIndexMSCIACWIexUSAIndex12337BroadBasedIndexMember2016-04-300000826686ssga:SSGAIndexMSCIEAFENetDividendIndex12337AdditionalIndexMember2016-04-300000826686ssga:C000143790Member2016-05-310000826686ssga:SSGAIndexMSCIACWIexUSAIndex12337BroadBasedIndexMember2016-05-310000826686ssga:SSGAIndexMSCIEAFENetDividendIndex12337AdditionalIndexMember2016-05-310000826686ssga:C000143790Member2016-06-300000826686ssga:SSGAIndexMSCIACWIexUSAIndex12337BroadBasedIndexMember2016-06-300000826686ssga:SSGAIndexMSCIEAFENetDividendIndex12337AdditionalIndexMember2016-06-300000826686ssga:C000143790Member2016-07-310000826686ssga:SSGAIndexMSCIACWIexUSAIndex12337BroadBasedIndexMember2016-07-310000826686ssga:SSGAIndexMSCIEAFENetDividendIndex12337AdditionalIndexMember2016-07-310000826686ssga:C000143790Member2016-08-310000826686ssga:SSGAIndexMSCIACWIexUSAIndex12337BroadBasedIndexMember2016-08-310000826686ssga:SSGAIndexMSCIEAFENetDividendIndex12337AdditionalIndexMember2016-08-310000826686ssga:C000143790Member2016-09-300000826686ssga:SSGAIndexMSCIACWIexUSAIndex12337BroadBasedIndexMember2016-09-300000826686ssga:SSGAIndexMSCIEAFENetDividendIndex12337AdditionalIndexMember2016-09-300000826686ssga:C000143790Member2016-10-310000826686ssga:SSGAIndexMSCIACWIexUSAIndex12337BroadBasedIndexMember2016-10-310000826686ssga:SSGAIndexMSCIEAFENetDividendIndex12337AdditionalIndexMember2016-10-310000826686ssga:C000143790Member2016-11-300000826686ssga:SSGAIndexMSCIACWIexUSAIndex12337BroadBasedIndexMember2016-11-300000826686ssga:SSGAIndexMSCIEAFENetDividendIndex12337AdditionalIndexMember2016-11-300000826686ssga:C000143790Member2016-12-310000826686ssga:SSGAIndexMSCIACWIexUSAIndex12337BroadBasedIndexMember2016-12-310000826686ssga:SSGAIndexMSCIEAFENetDividendIndex12337AdditionalIndexMember2016-12-310000826686ssga:C000143790Member2017-01-310000826686ssga:SSGAIndexMSCIACWIexUSAIndex12337BroadBasedIndexMember2017-01-310000826686ssga:SSGAIndexMSCIEAFENetDividendIndex12337AdditionalIndexMember2017-01-310000826686ssga:C000143790Member2017-02-280000826686ssga:SSGAIndexMSCIACWIexUSAIndex12337BroadBasedIndexMember2017-02-280000826686ssga:SSGAIndexMSCIEAFENetDividendIndex12337AdditionalIndexMember2017-02-280000826686ssga:C000143790Member2017-03-310000826686ssga:SSGAIndexMSCIACWIexUSAIndex12337BroadBasedIndexMember2017-03-310000826686ssga:SSGAIndexMSCIEAFENetDividendIndex12337AdditionalIndexMember2017-03-310000826686ssga:C000143790Member2017-04-300000826686ssga:SSGAIndexMSCIACWIexUSAIndex12337BroadBasedIndexMember2017-04-300000826686ssga:SSGAIndexMSCIEAFENetDividendIndex12337AdditionalIndexMember2017-04-300000826686ssga:C000143790Member2017-05-310000826686ssga:SSGAIndexMSCIACWIexUSAIndex12337BroadBasedIndexMember2017-05-310000826686ssga:SSGAIndexMSCIEAFENetDividendIndex12337AdditionalIndexMember2017-05-310000826686ssga:C000143790Member2017-06-300000826686ssga:SSGAIndexMSCIACWIexUSAIndex12337BroadBasedIndexMember2017-06-300000826686ssga:SSGAIndexMSCIEAFENetDividendIndex12337AdditionalIndexMember2017-06-300000826686ssga:C000143790Member2017-07-310000826686ssga:SSGAIndexMSCIACWIexUSAIndex12337BroadBasedIndexMember2017-07-310000826686ssga:SSGAIndexMSCIEAFENetDividendIndex12337AdditionalIndexMember2017-07-310000826686ssga:C000143790Member2017-08-310000826686ssga:SSGAIndexMSCIACWIexUSAIndex12337BroadBasedIndexMember2017-08-310000826686ssga:SSGAIndexMSCIEAFENetDividendIndex12337AdditionalIndexMember2017-08-310000826686ssga:C000143790Member2017-09-300000826686ssga:SSGAIndexMSCIACWIexUSAIndex12337BroadBasedIndexMember2017-09-300000826686ssga:SSGAIndexMSCIEAFENetDividendIndex12337AdditionalIndexMember2017-09-300000826686ssga:C000143790Member2017-10-310000826686ssga:SSGAIndexMSCIACWIexUSAIndex12337BroadBasedIndexMember2017-10-310000826686ssga:SSGAIndexMSCIEAFENetDividendIndex12337AdditionalIndexMember2017-10-310000826686ssga:C000143790Member2017-11-300000826686ssga:SSGAIndexMSCIACWIexUSAIndex12337BroadBasedIndexMember2017-11-300000826686ssga:SSGAIndexMSCIEAFENetDividendIndex12337AdditionalIndexMember2017-11-300000826686ssga:C000143790Member2017-12-310000826686ssga:SSGAIndexMSCIACWIexUSAIndex12337BroadBasedIndexMember2017-12-310000826686ssga:SSGAIndexMSCIEAFENetDividendIndex12337AdditionalIndexMember2017-12-310000826686ssga:C000143790Member2018-01-310000826686ssga:SSGAIndexMSCIACWIexUSAIndex12337BroadBasedIndexMember2018-01-310000826686ssga:SSGAIndexMSCIEAFENetDividendIndex12337AdditionalIndexMember2018-01-310000826686ssga:C000143790Member2018-02-280000826686ssga:SSGAIndexMSCIACWIexUSAIndex12337BroadBasedIndexMember2018-02-280000826686ssga:SSGAIndexMSCIEAFENetDividendIndex12337AdditionalIndexMember2018-02-280000826686ssga:C000143790Member2018-03-310000826686ssga:SSGAIndexMSCIACWIexUSAIndex12337BroadBasedIndexMember2018-03-310000826686ssga:SSGAIndexMSCIEAFENetDividendIndex12337AdditionalIndexMember2018-03-310000826686ssga:C000143790Member2018-04-300000826686ssga:SSGAIndexMSCIACWIexUSAIndex12337BroadBasedIndexMember2018-04-300000826686ssga:SSGAIndexMSCIEAFENetDividendIndex12337AdditionalIndexMember2018-04-300000826686ssga:C000143790Member2018-05-310000826686ssga:SSGAIndexMSCIACWIexUSAIndex12337BroadBasedIndexMember2018-05-310000826686ssga:SSGAIndexMSCIEAFENetDividendIndex12337AdditionalIndexMember2018-05-310000826686ssga:C000143790Member2018-06-300000826686ssga:SSGAIndexMSCIACWIexUSAIndex12337BroadBasedIndexMember2018-06-300000826686ssga:SSGAIndexMSCIEAFENetDividendIndex12337AdditionalIndexMember2018-06-300000826686ssga:C000143790Member2018-07-310000826686ssga:SSGAIndexMSCIACWIexUSAIndex12337BroadBasedIndexMember2018-07-310000826686ssga:SSGAIndexMSCIEAFENetDividendIndex12337AdditionalIndexMember2018-07-310000826686ssga:C000143790Member2018-08-310000826686ssga:SSGAIndexMSCIACWIexUSAIndex12337BroadBasedIndexMember2018-08-310000826686ssga:SSGAIndexMSCIEAFENetDividendIndex12337AdditionalIndexMember2018-08-310000826686ssga:C000143790Member2018-09-300000826686ssga:SSGAIndexMSCIACWIexUSAIndex12337BroadBasedIndexMember2018-09-300000826686ssga:SSGAIndexMSCIEAFENetDividendIndex12337AdditionalIndexMember2018-09-300000826686ssga:C000143790Member2018-10-310000826686ssga:SSGAIndexMSCIACWIexUSAIndex12337BroadBasedIndexMember2018-10-310000826686ssga:SSGAIndexMSCIEAFENetDividendIndex12337AdditionalIndexMember2018-10-310000826686ssga:C000143790Member2018-11-300000826686ssga:SSGAIndexMSCIACWIexUSAIndex12337BroadBasedIndexMember2018-11-300000826686ssga:SSGAIndexMSCIEAFENetDividendIndex12337AdditionalIndexMember2018-11-300000826686ssga:C000143790Member2018-12-310000826686ssga:SSGAIndexMSCIACWIexUSAIndex12337BroadBasedIndexMember2018-12-310000826686ssga:SSGAIndexMSCIEAFENetDividendIndex12337AdditionalIndexMember2018-12-310000826686ssga:C000143790Member2019-01-310000826686ssga:SSGAIndexMSCIACWIexUSAIndex12337BroadBasedIndexMember2019-01-310000826686ssga:SSGAIndexMSCIEAFENetDividendIndex12337AdditionalIndexMember2019-01-310000826686ssga:C000143790Member2019-02-280000826686ssga:SSGAIndexMSCIACWIexUSAIndex12337BroadBasedIndexMember2019-02-280000826686ssga:SSGAIndexMSCIEAFENetDividendIndex12337AdditionalIndexMember2019-02-280000826686ssga:C000143790Member2019-03-310000826686ssga:SSGAIndexMSCIACWIexUSAIndex12337BroadBasedIndexMember2019-03-310000826686ssga:SSGAIndexMSCIEAFENetDividendIndex12337AdditionalIndexMember2019-03-310000826686ssga:C000143790Member2019-04-300000826686ssga:SSGAIndexMSCIACWIexUSAIndex12337BroadBasedIndexMember2019-04-300000826686ssga:SSGAIndexMSCIEAFENetDividendIndex12337AdditionalIndexMember2019-04-300000826686ssga:C000143790Member2019-05-310000826686ssga:SSGAIndexMSCIACWIexUSAIndex12337BroadBasedIndexMember2019-05-310000826686ssga:SSGAIndexMSCIEAFENetDividendIndex12337AdditionalIndexMember2019-05-310000826686ssga:C000143790Member2019-06-300000826686ssga:SSGAIndexMSCIACWIexUSAIndex12337BroadBasedIndexMember2019-06-300000826686ssga:SSGAIndexMSCIEAFENetDividendIndex12337AdditionalIndexMember2019-06-300000826686ssga:C000143790Member2019-07-310000826686ssga:SSGAIndexMSCIACWIexUSAIndex12337BroadBasedIndexMember2019-07-310000826686ssga:SSGAIndexMSCIEAFENetDividendIndex12337AdditionalIndexMember2019-07-310000826686ssga:C000143790Member2019-08-310000826686ssga:SSGAIndexMSCIACWIexUSAIndex12337BroadBasedIndexMember2019-08-310000826686ssga:SSGAIndexMSCIEAFENetDividendIndex12337AdditionalIndexMember2019-08-310000826686ssga:C000143790Member2019-09-300000826686ssga:SSGAIndexMSCIACWIexUSAIndex12337BroadBasedIndexMember2019-09-300000826686ssga:SSGAIndexMSCIEAFENetDividendIndex12337AdditionalIndexMember2019-09-300000826686ssga:C000143790Member2019-10-310000826686ssga:SSGAIndexMSCIACWIexUSAIndex12337BroadBasedIndexMember2019-10-310000826686ssga:SSGAIndexMSCIEAFENetDividendIndex12337AdditionalIndexMember2019-10-310000826686ssga:C000143790Member2019-11-300000826686ssga:SSGAIndexMSCIACWIexUSAIndex12337BroadBasedIndexMember2019-11-300000826686ssga:SSGAIndexMSCIEAFENetDividendIndex12337AdditionalIndexMember2019-11-300000826686ssga:C000143790Member2019-12-310000826686ssga:SSGAIndexMSCIACWIexUSAIndex12337BroadBasedIndexMember2019-12-310000826686ssga:SSGAIndexMSCIEAFENetDividendIndex12337AdditionalIndexMember2019-12-310000826686ssga:C000143790Member2020-01-310000826686ssga:SSGAIndexMSCIACWIexUSAIndex12337BroadBasedIndexMember2020-01-310000826686ssga:SSGAIndexMSCIEAFENetDividendIndex12337AdditionalIndexMember2020-01-310000826686ssga:C000143790Member2020-02-290000826686ssga:SSGAIndexMSCIACWIexUSAIndex12337BroadBasedIndexMember2020-02-290000826686ssga:SSGAIndexMSCIEAFENetDividendIndex12337AdditionalIndexMember2020-02-290000826686ssga:C000143790Member2020-03-310000826686ssga:SSGAIndexMSCIACWIexUSAIndex12337BroadBasedIndexMember2020-03-310000826686ssga:SSGAIndexMSCIEAFENetDividendIndex12337AdditionalIndexMember2020-03-310000826686ssga:C000143790Member2020-04-300000826686ssga:SSGAIndexMSCIACWIexUSAIndex12337BroadBasedIndexMember2020-04-300000826686ssga:SSGAIndexMSCIEAFENetDividendIndex12337AdditionalIndexMember2020-04-300000826686ssga:C000143790Member2020-05-310000826686ssga:SSGAIndexMSCIACWIexUSAIndex12337BroadBasedIndexMember2020-05-310000826686ssga:SSGAIndexMSCIEAFENetDividendIndex12337AdditionalIndexMember2020-05-310000826686ssga:C000143790Member2020-06-300000826686ssga:SSGAIndexMSCIACWIexUSAIndex12337BroadBasedIndexMember2020-06-300000826686ssga:SSGAIndexMSCIEAFENetDividendIndex12337AdditionalIndexMember2020-06-300000826686ssga:C000143790Member2020-07-310000826686ssga:SSGAIndexMSCIACWIexUSAIndex12337BroadBasedIndexMember2020-07-310000826686ssga:SSGAIndexMSCIEAFENetDividendIndex12337AdditionalIndexMember2020-07-310000826686ssga:C000143790Member2020-08-310000826686ssga:SSGAIndexMSCIACWIexUSAIndex12337BroadBasedIndexMember2020-08-310000826686ssga:SSGAIndexMSCIEAFENetDividendIndex12337AdditionalIndexMember2020-08-310000826686ssga:C000143790Member2020-09-300000826686ssga:SSGAIndexMSCIACWIexUSAIndex12337BroadBasedIndexMember2020-09-300000826686ssga:SSGAIndexMSCIEAFENetDividendIndex12337AdditionalIndexMember2020-09-300000826686ssga:C000143790Member2020-10-310000826686ssga:SSGAIndexMSCIACWIexUSAIndex12337BroadBasedIndexMember2020-10-310000826686ssga:SSGAIndexMSCIEAFENetDividendIndex12337AdditionalIndexMember2020-10-310000826686ssga:C000143790Member2020-11-300000826686ssga:SSGAIndexMSCIACWIexUSAIndex12337BroadBasedIndexMember2020-11-300000826686ssga:SSGAIndexMSCIEAFENetDividendIndex12337AdditionalIndexMember2020-11-300000826686ssga:C000143790Member2020-12-310000826686ssga:SSGAIndexMSCIACWIexUSAIndex12337BroadBasedIndexMember2020-12-310000826686ssga:SSGAIndexMSCIEAFENetDividendIndex12337AdditionalIndexMember2020-12-310000826686ssga:C000143790Member2021-01-310000826686ssga:SSGAIndexMSCIACWIexUSAIndex12337BroadBasedIndexMember2021-01-310000826686ssga:SSGAIndexMSCIEAFENetDividendIndex12337AdditionalIndexMember2021-01-310000826686ssga:C000143790Member2021-02-280000826686ssga:SSGAIndexMSCIACWIexUSAIndex12337BroadBasedIndexMember2021-02-280000826686ssga:SSGAIndexMSCIEAFENetDividendIndex12337AdditionalIndexMember2021-02-280000826686ssga:C000143790Member2021-03-310000826686ssga:SSGAIndexMSCIACWIexUSAIndex12337BroadBasedIndexMember2021-03-310000826686ssga:SSGAIndexMSCIEAFENetDividendIndex12337AdditionalIndexMember2021-03-310000826686ssga:C000143790Member2021-04-300000826686ssga:SSGAIndexMSCIACWIexUSAIndex12337BroadBasedIndexMember2021-04-300000826686ssga:SSGAIndexMSCIEAFENetDividendIndex12337AdditionalIndexMember2021-04-300000826686ssga:C000143790Member2021-05-310000826686ssga:SSGAIndexMSCIACWIexUSAIndex12337BroadBasedIndexMember2021-05-310000826686ssga:SSGAIndexMSCIEAFENetDividendIndex12337AdditionalIndexMember2021-05-310000826686ssga:C000143790Member2021-06-300000826686ssga:SSGAIndexMSCIACWIexUSAIndex12337BroadBasedIndexMember2021-06-300000826686ssga:SSGAIndexMSCIEAFENetDividendIndex12337AdditionalIndexMember2021-06-300000826686ssga:C000143790Member2021-07-310000826686ssga:SSGAIndexMSCIACWIexUSAIndex12337BroadBasedIndexMember2021-07-310000826686ssga:SSGAIndexMSCIEAFENetDividendIndex12337AdditionalIndexMember2021-07-310000826686ssga:C000143790Member2021-08-310000826686ssga:SSGAIndexMSCIACWIexUSAIndex12337BroadBasedIndexMember2021-08-310000826686ssga:SSGAIndexMSCIEAFENetDividendIndex12337AdditionalIndexMember2021-08-310000826686ssga:C000143790Member2021-09-300000826686ssga:SSGAIndexMSCIACWIexUSAIndex12337BroadBasedIndexMember2021-09-300000826686ssga:SSGAIndexMSCIEAFENetDividendIndex12337AdditionalIndexMember2021-09-300000826686ssga:C000143790Member2021-10-310000826686ssga:SSGAIndexMSCIACWIexUSAIndex12337BroadBasedIndexMember2021-10-310000826686ssga:SSGAIndexMSCIEAFENetDividendIndex12337AdditionalIndexMember2021-10-310000826686ssga:C000143790Member2021-11-300000826686ssga:SSGAIndexMSCIACWIexUSAIndex12337BroadBasedIndexMember2021-11-300000826686ssga:SSGAIndexMSCIEAFENetDividendIndex12337AdditionalIndexMember2021-11-300000826686ssga:C000143790Member2021-12-310000826686ssga:SSGAIndexMSCIACWIexUSAIndex12337BroadBasedIndexMember2021-12-310000826686ssga:SSGAIndexMSCIEAFENetDividendIndex12337AdditionalIndexMember2021-12-310000826686ssga:C000143790Member2022-01-310000826686ssga:SSGAIndexMSCIACWIexUSAIndex12337BroadBasedIndexMember2022-01-310000826686ssga:SSGAIndexMSCIEAFENetDividendIndex12337AdditionalIndexMember2022-01-310000826686ssga:C000143790Member2022-02-280000826686ssga:SSGAIndexMSCIACWIexUSAIndex12337BroadBasedIndexMember2022-02-280000826686ssga:SSGAIndexMSCIEAFENetDividendIndex12337AdditionalIndexMember2022-02-280000826686ssga:C000143790Member2022-03-310000826686ssga:SSGAIndexMSCIACWIexUSAIndex12337BroadBasedIndexMember2022-03-310000826686ssga:SSGAIndexMSCIEAFENetDividendIndex12337AdditionalIndexMember2022-03-310000826686ssga:C000143790Member2022-04-300000826686ssga:SSGAIndexMSCIACWIexUSAIndex12337BroadBasedIndexMember2022-04-300000826686ssga:SSGAIndexMSCIEAFENetDividendIndex12337AdditionalIndexMember2022-04-300000826686ssga:C000143790Member2022-05-310000826686ssga:SSGAIndexMSCIACWIexUSAIndex12337BroadBasedIndexMember2022-05-310000826686ssga:SSGAIndexMSCIEAFENetDividendIndex12337AdditionalIndexMember2022-05-310000826686ssga:C000143790Member2022-06-300000826686ssga:SSGAIndexMSCIACWIexUSAIndex12337BroadBasedIndexMember2022-06-300000826686ssga:SSGAIndexMSCIEAFENetDividendIndex12337AdditionalIndexMember2022-06-300000826686ssga:C000143790Member2022-07-310000826686ssga:SSGAIndexMSCIACWIexUSAIndex12337BroadBasedIndexMember2022-07-310000826686ssga:SSGAIndexMSCIEAFENetDividendIndex12337AdditionalIndexMember2022-07-310000826686ssga:C000143790Member2022-08-310000826686ssga:SSGAIndexMSCIACWIexUSAIndex12337BroadBasedIndexMember2022-08-310000826686ssga:SSGAIndexMSCIEAFENetDividendIndex12337AdditionalIndexMember2022-08-310000826686ssga:C000143790Member2022-09-300000826686ssga:SSGAIndexMSCIACWIexUSAIndex12337BroadBasedIndexMember2022-09-300000826686ssga:SSGAIndexMSCIEAFENetDividendIndex12337AdditionalIndexMember2022-09-300000826686ssga:C000143790Member2022-10-310000826686ssga:SSGAIndexMSCIACWIexUSAIndex12337BroadBasedIndexMember2022-10-310000826686ssga:SSGAIndexMSCIEAFENetDividendIndex12337AdditionalIndexMember2022-10-310000826686ssga:C000143790Member2022-11-300000826686ssga:SSGAIndexMSCIACWIexUSAIndex12337BroadBasedIndexMember2022-11-300000826686ssga:SSGAIndexMSCIEAFENetDividendIndex12337AdditionalIndexMember2022-11-300000826686ssga:C000143790Member2022-12-310000826686ssga:SSGAIndexMSCIACWIexUSAIndex12337BroadBasedIndexMember2022-12-310000826686ssga:SSGAIndexMSCIEAFENetDividendIndex12337AdditionalIndexMember2022-12-310000826686ssga:C000143790Member2023-01-310000826686ssga:SSGAIndexMSCIACWIexUSAIndex12337BroadBasedIndexMember2023-01-310000826686ssga:SSGAIndexMSCIEAFENetDividendIndex12337AdditionalIndexMember2023-01-310000826686ssga:C000143790Member2023-02-280000826686ssga:SSGAIndexMSCIACWIexUSAIndex12337BroadBasedIndexMember2023-02-280000826686ssga:SSGAIndexMSCIEAFENetDividendIndex12337AdditionalIndexMember2023-02-280000826686ssga:C000143790Member2023-03-310000826686ssga:SSGAIndexMSCIACWIexUSAIndex12337BroadBasedIndexMember2023-03-310000826686ssga:SSGAIndexMSCIEAFENetDividendIndex12337AdditionalIndexMember2023-03-310000826686ssga:C000143790Member2023-04-300000826686ssga:SSGAIndexMSCIACWIexUSAIndex12337BroadBasedIndexMember2023-04-300000826686ssga:SSGAIndexMSCIEAFENetDividendIndex12337AdditionalIndexMember2023-04-300000826686ssga:C000143790Member2023-05-310000826686ssga:SSGAIndexMSCIACWIexUSAIndex12337BroadBasedIndexMember2023-05-310000826686ssga:SSGAIndexMSCIEAFENetDividendIndex12337AdditionalIndexMember2023-05-310000826686ssga:C000143790Member2023-06-300000826686ssga:SSGAIndexMSCIACWIexUSAIndex12337BroadBasedIndexMember2023-06-300000826686ssga:SSGAIndexMSCIEAFENetDividendIndex12337AdditionalIndexMember2023-06-300000826686ssga:C000143790Member2023-07-310000826686ssga:SSGAIndexMSCIACWIexUSAIndex12337BroadBasedIndexMember2023-07-310000826686ssga:SSGAIndexMSCIEAFENetDividendIndex12337AdditionalIndexMember2023-07-310000826686ssga:C000143790Member2023-08-310000826686ssga:SSGAIndexMSCIACWIexUSAIndex12337BroadBasedIndexMember2023-08-310000826686ssga:SSGAIndexMSCIEAFENetDividendIndex12337AdditionalIndexMember2023-08-310000826686ssga:C000143790Member2023-09-300000826686ssga:SSGAIndexMSCIACWIexUSAIndex12337BroadBasedIndexMember2023-09-300000826686ssga:SSGAIndexMSCIEAFENetDividendIndex12337AdditionalIndexMember2023-09-300000826686ssga:C000143790Member2023-10-310000826686ssga:SSGAIndexMSCIACWIexUSAIndex12337BroadBasedIndexMember2023-10-310000826686ssga:SSGAIndexMSCIEAFENetDividendIndex12337AdditionalIndexMember2023-10-310000826686ssga:C000143790Member2023-11-300000826686ssga:SSGAIndexMSCIACWIexUSAIndex12337BroadBasedIndexMember2023-11-300000826686ssga:SSGAIndexMSCIEAFENetDividendIndex12337AdditionalIndexMember2023-11-300000826686ssga:C000143790Member2023-12-310000826686ssga:SSGAIndexMSCIACWIexUSAIndex12337BroadBasedIndexMember2023-12-310000826686ssga:SSGAIndexMSCIEAFENetDividendIndex12337AdditionalIndexMember2023-12-310000826686ssga:C000143790Member2024-01-310000826686ssga:SSGAIndexMSCIACWIexUSAIndex12337BroadBasedIndexMember2024-01-310000826686ssga:SSGAIndexMSCIEAFENetDividendIndex12337AdditionalIndexMember2024-01-310000826686ssga:C000143790Member2024-02-290000826686ssga:SSGAIndexMSCIACWIexUSAIndex12337BroadBasedIndexMember2024-02-290000826686ssga:SSGAIndexMSCIEAFENetDividendIndex12337AdditionalIndexMember2024-02-290000826686ssga:C000143790Member2024-03-310000826686ssga:SSGAIndexMSCIACWIexUSAIndex12337BroadBasedIndexMember2024-03-310000826686ssga:SSGAIndexMSCIEAFENetDividendIndex12337AdditionalIndexMember2024-03-310000826686ssga:C000143790Member2024-04-300000826686ssga:SSGAIndexMSCIACWIexUSAIndex12337BroadBasedIndexMember2024-04-300000826686ssga:SSGAIndexMSCIEAFENetDividendIndex12337AdditionalIndexMember2024-04-300000826686ssga:C000143790Member2024-05-310000826686ssga:SSGAIndexMSCIACWIexUSAIndex12337BroadBasedIndexMember2024-05-310000826686ssga:SSGAIndexMSCIEAFENetDividendIndex12337AdditionalIndexMember2024-05-310000826686ssga:C000143790Member2024-06-300000826686ssga:SSGAIndexMSCIACWIexUSAIndex12337BroadBasedIndexMember2024-06-300000826686ssga:SSGAIndexMSCIEAFENetDividendIndex12337AdditionalIndexMember2024-06-300000826686ssga:C000143790Member2024-07-310000826686ssga:SSGAIndexMSCIACWIexUSAIndex12337BroadBasedIndexMember2024-07-310000826686ssga:SSGAIndexMSCIEAFENetDividendIndex12337AdditionalIndexMember2024-07-310000826686ssga:C000143790Member2024-08-310000826686ssga:SSGAIndexMSCIACWIexUSAIndex12337BroadBasedIndexMember2024-08-310000826686ssga:SSGAIndexMSCIEAFENetDividendIndex12337AdditionalIndexMember2024-08-310000826686ssga:C000143790Member2024-09-300000826686ssga:SSGAIndexMSCIACWIexUSAIndex12337BroadBasedIndexMember2024-09-300000826686ssga:SSGAIndexMSCIEAFENetDividendIndex12337AdditionalIndexMember2024-09-300000826686ssga:C000143790Member2024-10-310000826686ssga:SSGAIndexMSCIACWIexUSAIndex12337BroadBasedIndexMember2024-10-310000826686ssga:SSGAIndexMSCIEAFENetDividendIndex12337AdditionalIndexMember2024-10-310000826686ssga:C000143790Member2024-11-300000826686ssga:SSGAIndexMSCIACWIexUSAIndex12337BroadBasedIndexMember2024-11-300000826686ssga:SSGAIndexMSCIEAFENetDividendIndex12337AdditionalIndexMember2024-11-300000826686ssga:C000143790Member2024-12-310000826686ssga:SSGAIndexMSCIACWIexUSAIndex12337BroadBasedIndexMember2024-12-310000826686ssga:SSGAIndexMSCIEAFENetDividendIndex12337AdditionalIndexMember2024-12-310000826686ssga:C000143790Member2025-01-310000826686ssga:SSGAIndexMSCIACWIexUSAIndex12337BroadBasedIndexMember2025-01-310000826686ssga:SSGAIndexMSCIEAFENetDividendIndex12337AdditionalIndexMember2025-01-310000826686ssga:C000143790Member2025-02-280000826686ssga:SSGAIndexMSCIACWIexUSAIndex12337BroadBasedIndexMember2025-02-280000826686ssga:SSGAIndexMSCIEAFENetDividendIndex12337AdditionalIndexMember2025-02-280000826686ssga:C000143790Member2025-03-310000826686ssga:SSGAIndexMSCIACWIexUSAIndex12337BroadBasedIndexMember2025-03-310000826686ssga:SSGAIndexMSCIEAFENetDividendIndex12337AdditionalIndexMember2025-03-310000826686ssga:C000143790Member2025-04-300000826686ssga:SSGAIndexMSCIACWIexUSAIndex12337BroadBasedIndexMember2025-04-300000826686ssga:SSGAIndexMSCIEAFENetDividendIndex12337AdditionalIndexMember2025-04-300000826686ssga:C000143790Member2025-05-310000826686ssga:SSGAIndexMSCIACWIexUSAIndex12337BroadBasedIndexMember2025-05-310000826686ssga:SSGAIndexMSCIEAFENetDividendIndex12337AdditionalIndexMember2025-05-310000826686ssga:C000143790Member2025-06-300000826686ssga:SSGAIndexMSCIACWIexUSAIndex12337BroadBasedIndexMember2025-06-300000826686ssga:SSGAIndexMSCIEAFENetDividendIndex12337AdditionalIndexMember2025-06-300000826686ssga:C000143790Member2025-07-310000826686ssga:SSGAIndexMSCIACWIexUSAIndex12337BroadBasedIndexMember2025-07-310000826686ssga:SSGAIndexMSCIEAFENetDividendIndex12337AdditionalIndexMember2025-07-310000826686ssga:C000143790Member2025-08-310000826686ssga:SSGAIndexMSCIACWIexUSAIndex12337BroadBasedIndexMember2025-08-310000826686ssga:SSGAIndexMSCIEAFENetDividendIndex12337AdditionalIndexMember2025-08-310000826686ssga:C000143790Memberoef:WithoutSalesLoadMember2024-09-012025-08-310000826686ssga:C000143790Memberoef:WithoutSalesLoadMember2020-09-012025-08-310000826686ssga:C000143790Memberoef:WithoutSalesLoadMember2015-09-012025-08-310000826686ssga:C000143790Member2020-09-012025-08-310000826686ssga:C000143790Member2015-09-012025-08-310000826686ssga:SSGAIndexMSCIACWIexUSAIndex12337BroadBasedIndexMember2020-09-012025-08-310000826686ssga:SSGAIndexMSCIACWIexUSAIndex12337BroadBasedIndexMember2015-09-012025-08-310000826686ssga:SSGAIndexMSCIEAFENetDividendIndex12337AdditionalIndexMember2020-09-012025-08-310000826686ssga:SSGAIndexMSCIEAFENetDividendIndex12337AdditionalIndexMember2015-09-012025-08-310000826686ssga:C000143790Memberssga:JapanCTIMember2025-08-310000826686ssga:C000143790Memberssga:UnitedKingdomCTIMember2025-08-310000826686ssga:C000143790Memberssga:GermanyCTIMember2025-08-310000826686ssga:C000143790Memberssga:FranceCTIMember2025-08-310000826686ssga:C000143790Memberssga:AustraliaCTIMember2025-08-310000826686ssga:C000143790Memberssga:UnitedStatesCTIMember2025-08-310000826686ssga:C000143790Memberssga:ItalyCTIMember2025-08-310000826686ssga:C000143790Memberssga:SpainCTIMember2025-08-310000826686ssga:C000143790Memberssga:NetherlandsCTIMember2025-08-310000826686ssga:C000143790Memberssga:IsraelCTIMember2025-08-310000826686ssga:C000143790Memberssga:NovartisAGFR710306903CTIMember2025-08-310000826686ssga:C000143790Memberssga:RocheHoldingAGFR711038901CTIMember2025-08-310000826686ssga:C000143790Memberssga:DeutscheTelekomAGFR584235907CTIMember2025-08-310000826686ssga:C000143790Memberssga:BritishAmericanTobaccoPLCFR028758902CTIMember2025-08-310000826686ssga:C000143790Memberssga:IntesaSanpaoloSpAFR407683002CTIMember2025-08-310000826686ssga:C000143790Memberssga:DeutscheBankAGFR575035902CTIMember2025-08-310000826686ssga:C000143790Memberssga:BarclaysPLCFR313486904CTIMember2025-08-310000826686ssga:C000143790Memberssga:LloydsBankingGroupPLCFR087061008CTIMember2025-08-310000826686ssga:C000143790Memberssga:NordeaBankAbpFRBFM0SV904CTIMember2025-08-310000826686ssga:C000143790Memberssga:BankLeumiLeMinusIsraelBMFR607642907CTIMember2025-08-310000826686ssga:C000143792Member2024-09-012025-08-310000826686ssga:SSGAIndexMSCIACWIexUSAIndex12339BroadBasedIndexMember2024-09-012025-08-310000826686ssga:SSGAIndexMSCIEAFENetDividendIndex12339AdditionalIndexMember2024-09-012025-08-310000826686ssga:C000143792Member2015-08-310000826686ssga:SSGAIndexMSCIACWIexUSAIndex12339BroadBasedIndexMember2015-08-310000826686ssga:SSGAIndexMSCIEAFENetDividendIndex12339AdditionalIndexMember2015-08-310000826686ssga:C000143792Member2015-09-300000826686ssga:SSGAIndexMSCIACWIexUSAIndex12339BroadBasedIndexMember2015-09-300000826686ssga:SSGAIndexMSCIEAFENetDividendIndex12339AdditionalIndexMember2015-09-300000826686ssga:C000143792Member2015-10-310000826686ssga:SSGAIndexMSCIACWIexUSAIndex12339BroadBasedIndexMember2015-10-310000826686ssga:SSGAIndexMSCIEAFENetDividendIndex12339AdditionalIndexMember2015-10-310000826686ssga:C000143792Member2015-11-300000826686ssga:SSGAIndexMSCIACWIexUSAIndex12339BroadBasedIndexMember2015-11-300000826686ssga:SSGAIndexMSCIEAFENetDividendIndex12339AdditionalIndexMember2015-11-300000826686ssga:C000143792Member2015-12-310000826686ssga:SSGAIndexMSCIACWIexUSAIndex12339BroadBasedIndexMember2015-12-310000826686ssga:SSGAIndexMSCIEAFENetDividendIndex12339AdditionalIndexMember2015-12-310000826686ssga:C000143792Member2016-01-310000826686ssga:SSGAIndexMSCIACWIexUSAIndex12339BroadBasedIndexMember2016-01-310000826686ssga:SSGAIndexMSCIEAFENetDividendIndex12339AdditionalIndexMember2016-01-310000826686ssga:C000143792Member2016-02-290000826686ssga:SSGAIndexMSCIACWIexUSAIndex12339BroadBasedIndexMember2016-02-290000826686ssga:SSGAIndexMSCIEAFENetDividendIndex12339AdditionalIndexMember2016-02-290000826686ssga:C000143792Member2016-03-310000826686ssga:SSGAIndexMSCIACWIexUSAIndex12339BroadBasedIndexMember2016-03-310000826686ssga:SSGAIndexMSCIEAFENetDividendIndex12339AdditionalIndexMember2016-03-310000826686ssga:C000143792Member2016-04-300000826686ssga:SSGAIndexMSCIACWIexUSAIndex12339BroadBasedIndexMember2016-04-300000826686ssga:SSGAIndexMSCIEAFENetDividendIndex12339AdditionalIndexMember2016-04-300000826686ssga:C000143792Member2016-05-310000826686ssga:SSGAIndexMSCIACWIexUSAIndex12339BroadBasedIndexMember2016-05-310000826686ssga:SSGAIndexMSCIEAFENetDividendIndex12339AdditionalIndexMember2016-05-310000826686ssga:C000143792Member2016-06-300000826686ssga:SSGAIndexMSCIACWIexUSAIndex12339BroadBasedIndexMember2016-06-300000826686ssga:SSGAIndexMSCIEAFENetDividendIndex12339AdditionalIndexMember2016-06-300000826686ssga:C000143792Member2016-07-310000826686ssga:SSGAIndexMSCIACWIexUSAIndex12339BroadBasedIndexMember2016-07-310000826686ssga:SSGAIndexMSCIEAFENetDividendIndex12339AdditionalIndexMember2016-07-310000826686ssga:C000143792Member2016-08-310000826686ssga:SSGAIndexMSCIACWIexUSAIndex12339BroadBasedIndexMember2016-08-310000826686ssga:SSGAIndexMSCIEAFENetDividendIndex12339AdditionalIndexMember2016-08-310000826686ssga:C000143792Member2016-09-300000826686ssga:SSGAIndexMSCIACWIexUSAIndex12339BroadBasedIndexMember2016-09-300000826686ssga:SSGAIndexMSCIEAFENetDividendIndex12339AdditionalIndexMember2016-09-300000826686ssga:C000143792Member2016-10-310000826686ssga:SSGAIndexMSCIACWIexUSAIndex12339BroadBasedIndexMember2016-10-310000826686ssga:SSGAIndexMSCIEAFENetDividendIndex12339AdditionalIndexMember2016-10-310000826686ssga:C000143792Member2016-11-300000826686ssga:SSGAIndexMSCIACWIexUSAIndex12339BroadBasedIndexMember2016-11-300000826686ssga:SSGAIndexMSCIEAFENetDividendIndex12339AdditionalIndexMember2016-11-300000826686ssga:C000143792Member2016-12-310000826686ssga:SSGAIndexMSCIACWIexUSAIndex12339BroadBasedIndexMember2016-12-310000826686ssga:SSGAIndexMSCIEAFENetDividendIndex12339AdditionalIndexMember2016-12-310000826686ssga:C000143792Member2017-01-310000826686ssga:SSGAIndexMSCIACWIexUSAIndex12339BroadBasedIndexMember2017-01-310000826686ssga:SSGAIndexMSCIEAFENetDividendIndex12339AdditionalIndexMember2017-01-310000826686ssga:C000143792Member2017-02-280000826686ssga:SSGAIndexMSCIACWIexUSAIndex12339BroadBasedIndexMember2017-02-280000826686ssga:SSGAIndexMSCIEAFENetDividendIndex12339AdditionalIndexMember2017-02-280000826686ssga:C000143792Member2017-03-310000826686ssga:SSGAIndexMSCIACWIexUSAIndex12339BroadBasedIndexMember2017-03-310000826686ssga:SSGAIndexMSCIEAFENetDividendIndex12339AdditionalIndexMember2017-03-310000826686ssga:C000143792Member2017-04-300000826686ssga:SSGAIndexMSCIACWIexUSAIndex12339BroadBasedIndexMember2017-04-300000826686ssga:SSGAIndexMSCIEAFENetDividendIndex12339AdditionalIndexMember2017-04-300000826686ssga:C000143792Member2017-05-310000826686ssga:SSGAIndexMSCIACWIexUSAIndex12339BroadBasedIndexMember2017-05-310000826686ssga:SSGAIndexMSCIEAFENetDividendIndex12339AdditionalIndexMember2017-05-310000826686ssga:C000143792Member2017-06-300000826686ssga:SSGAIndexMSCIACWIexUSAIndex12339BroadBasedIndexMember2017-06-300000826686ssga:SSGAIndexMSCIEAFENetDividendIndex12339AdditionalIndexMember2017-06-300000826686ssga:C000143792Member2017-07-310000826686ssga:SSGAIndexMSCIACWIexUSAIndex12339BroadBasedIndexMember2017-07-310000826686ssga:SSGAIndexMSCIEAFENetDividendIndex12339AdditionalIndexMember2017-07-310000826686ssga:C000143792Member2017-08-310000826686ssga:SSGAIndexMSCIACWIexUSAIndex12339BroadBasedIndexMember2017-08-310000826686ssga:SSGAIndexMSCIEAFENetDividendIndex12339AdditionalIndexMember2017-08-310000826686ssga:C000143792Member2017-09-300000826686ssga:SSGAIndexMSCIACWIexUSAIndex12339BroadBasedIndexMember2017-09-300000826686ssga:SSGAIndexMSCIEAFENetDividendIndex12339AdditionalIndexMember2017-09-300000826686ssga:C000143792Member2017-10-310000826686ssga:SSGAIndexMSCIACWIexUSAIndex12339BroadBasedIndexMember2017-10-310000826686ssga:SSGAIndexMSCIEAFENetDividendIndex12339AdditionalIndexMember2017-10-310000826686ssga:C000143792Member2017-11-300000826686ssga:SSGAIndexMSCIACWIexUSAIndex12339BroadBasedIndexMember2017-11-300000826686ssga:SSGAIndexMSCIEAFENetDividendIndex12339AdditionalIndexMember2017-11-300000826686ssga:C000143792Member2017-12-310000826686ssga:SSGAIndexMSCIACWIexUSAIndex12339BroadBasedIndexMember2017-12-310000826686ssga:SSGAIndexMSCIEAFENetDividendIndex12339AdditionalIndexMember2017-12-310000826686ssga:C000143792Member2018-01-310000826686ssga:SSGAIndexMSCIACWIexUSAIndex12339BroadBasedIndexMember2018-01-310000826686ssga:SSGAIndexMSCIEAFENetDividendIndex12339AdditionalIndexMember2018-01-310000826686ssga:C000143792Member2018-02-280000826686ssga:SSGAIndexMSCIACWIexUSAIndex12339BroadBasedIndexMember2018-02-280000826686ssga:SSGAIndexMSCIEAFENetDividendIndex12339AdditionalIndexMember2018-02-280000826686ssga:C000143792Member2018-03-310000826686ssga:SSGAIndexMSCIACWIexUSAIndex12339BroadBasedIndexMember2018-03-310000826686ssga:SSGAIndexMSCIEAFENetDividendIndex12339AdditionalIndexMember2018-03-310000826686ssga:C000143792Member2018-04-300000826686ssga:SSGAIndexMSCIACWIexUSAIndex12339BroadBasedIndexMember2018-04-300000826686ssga:SSGAIndexMSCIEAFENetDividendIndex12339AdditionalIndexMember2018-04-300000826686ssga:C000143792Member2018-05-310000826686ssga:SSGAIndexMSCIACWIexUSAIndex12339BroadBasedIndexMember2018-05-310000826686ssga:SSGAIndexMSCIEAFENetDividendIndex12339AdditionalIndexMember2018-05-310000826686ssga:C000143792Member2018-06-300000826686ssga:SSGAIndexMSCIACWIexUSAIndex12339BroadBasedIndexMember2018-06-300000826686ssga:SSGAIndexMSCIEAFENetDividendIndex12339AdditionalIndexMember2018-06-300000826686ssga:C000143792Member2018-07-310000826686ssga:SSGAIndexMSCIACWIexUSAIndex12339BroadBasedIndexMember2018-07-310000826686ssga:SSGAIndexMSCIEAFENetDividendIndex12339AdditionalIndexMember2018-07-310000826686ssga:C000143792Member2018-08-310000826686ssga:SSGAIndexMSCIACWIexUSAIndex12339BroadBasedIndexMember2018-08-310000826686ssga:SSGAIndexMSCIEAFENetDividendIndex12339AdditionalIndexMember2018-08-310000826686ssga:C000143792Member2018-09-300000826686ssga:SSGAIndexMSCIACWIexUSAIndex12339BroadBasedIndexMember2018-09-300000826686ssga:SSGAIndexMSCIEAFENetDividendIndex12339AdditionalIndexMember2018-09-300000826686ssga:C000143792Member2018-10-310000826686ssga:SSGAIndexMSCIACWIexUSAIndex12339BroadBasedIndexMember2018-10-310000826686ssga:SSGAIndexMSCIEAFENetDividendIndex12339AdditionalIndexMember2018-10-310000826686ssga:C000143792Member2018-11-300000826686ssga:SSGAIndexMSCIACWIexUSAIndex12339BroadBasedIndexMember2018-11-300000826686ssga:SSGAIndexMSCIEAFENetDividendIndex12339AdditionalIndexMember2018-11-300000826686ssga:C000143792Member2018-12-310000826686ssga:SSGAIndexMSCIACWIexUSAIndex12339BroadBasedIndexMember2018-12-310000826686ssga:SSGAIndexMSCIEAFENetDividendIndex12339AdditionalIndexMember2018-12-310000826686ssga:C000143792Member2019-01-310000826686ssga:SSGAIndexMSCIACWIexUSAIndex12339BroadBasedIndexMember2019-01-310000826686ssga:SSGAIndexMSCIEAFENetDividendIndex12339AdditionalIndexMember2019-01-310000826686ssga:C000143792Member2019-02-280000826686ssga:SSGAIndexMSCIACWIexUSAIndex12339BroadBasedIndexMember2019-02-280000826686ssga:SSGAIndexMSCIEAFENetDividendIndex12339AdditionalIndexMember2019-02-280000826686ssga:C000143792Member2019-03-310000826686ssga:SSGAIndexMSCIACWIexUSAIndex12339BroadBasedIndexMember2019-03-310000826686ssga:SSGAIndexMSCIEAFENetDividendIndex12339AdditionalIndexMember2019-03-310000826686ssga:C000143792Member2019-04-300000826686ssga:SSGAIndexMSCIACWIexUSAIndex12339BroadBasedIndexMember2019-04-300000826686ssga:SSGAIndexMSCIEAFENetDividendIndex12339AdditionalIndexMember2019-04-300000826686ssga:C000143792Member2019-05-310000826686ssga:SSGAIndexMSCIACWIexUSAIndex12339BroadBasedIndexMember2019-05-310000826686ssga:SSGAIndexMSCIEAFENetDividendIndex12339AdditionalIndexMember2019-05-310000826686ssga:C000143792Member2019-06-300000826686ssga:SSGAIndexMSCIACWIexUSAIndex12339BroadBasedIndexMember2019-06-300000826686ssga:SSGAIndexMSCIEAFENetDividendIndex12339AdditionalIndexMember2019-06-300000826686ssga:C000143792Member2019-07-310000826686ssga:SSGAIndexMSCIACWIexUSAIndex12339BroadBasedIndexMember2019-07-310000826686ssga:SSGAIndexMSCIEAFENetDividendIndex12339AdditionalIndexMember2019-07-310000826686ssga:C000143792Member2019-08-310000826686ssga:SSGAIndexMSCIACWIexUSAIndex12339BroadBasedIndexMember2019-08-310000826686ssga:SSGAIndexMSCIEAFENetDividendIndex12339AdditionalIndexMember2019-08-310000826686ssga:C000143792Member2019-09-300000826686ssga:SSGAIndexMSCIACWIexUSAIndex12339BroadBasedIndexMember2019-09-300000826686ssga:SSGAIndexMSCIEAFENetDividendIndex12339AdditionalIndexMember2019-09-300000826686ssga:C000143792Member2019-10-310000826686ssga:SSGAIndexMSCIACWIexUSAIndex12339BroadBasedIndexMember2019-10-310000826686ssga:SSGAIndexMSCIEAFENetDividendIndex12339AdditionalIndexMember2019-10-310000826686ssga:C000143792Member2019-11-300000826686ssga:SSGAIndexMSCIACWIexUSAIndex12339BroadBasedIndexMember2019-11-300000826686ssga:SSGAIndexMSCIEAFENetDividendIndex12339AdditionalIndexMember2019-11-300000826686ssga:C000143792Member2019-12-310000826686ssga:SSGAIndexMSCIACWIexUSAIndex12339BroadBasedIndexMember2019-12-310000826686ssga:SSGAIndexMSCIEAFENetDividendIndex12339AdditionalIndexMember2019-12-310000826686ssga:C000143792Member2020-01-310000826686ssga:SSGAIndexMSCIACWIexUSAIndex12339BroadBasedIndexMember2020-01-310000826686ssga:SSGAIndexMSCIEAFENetDividendIndex12339AdditionalIndexMember2020-01-310000826686ssga:C000143792Member2020-02-290000826686ssga:SSGAIndexMSCIACWIexUSAIndex12339BroadBasedIndexMember2020-02-290000826686ssga:SSGAIndexMSCIEAFENetDividendIndex12339AdditionalIndexMember2020-02-290000826686ssga:C000143792Member2020-03-310000826686ssga:SSGAIndexMSCIACWIexUSAIndex12339BroadBasedIndexMember2020-03-310000826686ssga:SSGAIndexMSCIEAFENetDividendIndex12339AdditionalIndexMember2020-03-310000826686ssga:C000143792Member2020-04-300000826686ssga:SSGAIndexMSCIACWIexUSAIndex12339BroadBasedIndexMember2020-04-300000826686ssga:SSGAIndexMSCIEAFENetDividendIndex12339AdditionalIndexMember2020-04-300000826686ssga:C000143792Member2020-05-310000826686ssga:SSGAIndexMSCIACWIexUSAIndex12339BroadBasedIndexMember2020-05-310000826686ssga:SSGAIndexMSCIEAFENetDividendIndex12339AdditionalIndexMember2020-05-310000826686ssga:C000143792Member2020-06-300000826686ssga:SSGAIndexMSCIACWIexUSAIndex12339BroadBasedIndexMember2020-06-300000826686ssga:SSGAIndexMSCIEAFENetDividendIndex12339AdditionalIndexMember2020-06-300000826686ssga:C000143792Member2020-07-310000826686ssga:SSGAIndexMSCIACWIexUSAIndex12339BroadBasedIndexMember2020-07-310000826686ssga:SSGAIndexMSCIEAFENetDividendIndex12339AdditionalIndexMember2020-07-310000826686ssga:C000143792Member2020-08-310000826686ssga:SSGAIndexMSCIACWIexUSAIndex12339BroadBasedIndexMember2020-08-310000826686ssga:SSGAIndexMSCIEAFENetDividendIndex12339AdditionalIndexMember2020-08-310000826686ssga:C000143792Member2020-09-300000826686ssga:SSGAIndexMSCIACWIexUSAIndex12339BroadBasedIndexMember2020-09-300000826686ssga:SSGAIndexMSCIEAFENetDividendIndex12339AdditionalIndexMember2020-09-300000826686ssga:C000143792Member2020-10-310000826686ssga:SSGAIndexMSCIACWIexUSAIndex12339BroadBasedIndexMember2020-10-310000826686ssga:SSGAIndexMSCIEAFENetDividendIndex12339AdditionalIndexMember2020-10-310000826686ssga:C000143792Member2020-11-300000826686ssga:SSGAIndexMSCIACWIexUSAIndex12339BroadBasedIndexMember2020-11-300000826686ssga:SSGAIndexMSCIEAFENetDividendIndex12339AdditionalIndexMember2020-11-300000826686ssga:C000143792Member2020-12-310000826686ssga:SSGAIndexMSCIACWIexUSAIndex12339BroadBasedIndexMember2020-12-310000826686ssga:SSGAIndexMSCIEAFENetDividendIndex12339AdditionalIndexMember2020-12-310000826686ssga:C000143792Member2021-01-310000826686ssga:SSGAIndexMSCIACWIexUSAIndex12339BroadBasedIndexMember2021-01-310000826686ssga:SSGAIndexMSCIEAFENetDividendIndex12339AdditionalIndexMember2021-01-310000826686ssga:C000143792Member2021-02-280000826686ssga:SSGAIndexMSCIACWIexUSAIndex12339BroadBasedIndexMember2021-02-280000826686ssga:SSGAIndexMSCIEAFENetDividendIndex12339AdditionalIndexMember2021-02-280000826686ssga:C000143792Member2021-03-310000826686ssga:SSGAIndexMSCIACWIexUSAIndex12339BroadBasedIndexMember2021-03-310000826686ssga:SSGAIndexMSCIEAFENetDividendIndex12339AdditionalIndexMember2021-03-310000826686ssga:C000143792Member2021-04-300000826686ssga:SSGAIndexMSCIACWIexUSAIndex12339BroadBasedIndexMember2021-04-300000826686ssga:SSGAIndexMSCIEAFENetDividendIndex12339AdditionalIndexMember2021-04-300000826686ssga:C000143792Member2021-05-310000826686ssga:SSGAIndexMSCIACWIexUSAIndex12339BroadBasedIndexMember2021-05-310000826686ssga:SSGAIndexMSCIEAFENetDividendIndex12339AdditionalIndexMember2021-05-310000826686ssga:C000143792Member2021-06-300000826686ssga:SSGAIndexMSCIACWIexUSAIndex12339BroadBasedIndexMember2021-06-300000826686ssga:SSGAIndexMSCIEAFENetDividendIndex12339AdditionalIndexMember2021-06-300000826686ssga:C000143792Member2021-07-310000826686ssga:SSGAIndexMSCIACWIexUSAIndex12339BroadBasedIndexMember2021-07-310000826686ssga:SSGAIndexMSCIEAFENetDividendIndex12339AdditionalIndexMember2021-07-310000826686ssga:C000143792Member2021-08-310000826686ssga:SSGAIndexMSCIACWIexUSAIndex12339BroadBasedIndexMember2021-08-310000826686ssga:SSGAIndexMSCIEAFENetDividendIndex12339AdditionalIndexMember2021-08-310000826686ssga:C000143792Member2021-09-300000826686ssga:SSGAIndexMSCIACWIexUSAIndex12339BroadBasedIndexMember2021-09-300000826686ssga:SSGAIndexMSCIEAFENetDividendIndex12339AdditionalIndexMember2021-09-300000826686ssga:C000143792Member2021-10-310000826686ssga:SSGAIndexMSCIACWIexUSAIndex12339BroadBasedIndexMember2021-10-310000826686ssga:SSGAIndexMSCIEAFENetDividendIndex12339AdditionalIndexMember2021-10-310000826686ssga:C000143792Member2021-11-300000826686ssga:SSGAIndexMSCIACWIexUSAIndex12339BroadBasedIndexMember2021-11-300000826686ssga:SSGAIndexMSCIEAFENetDividendIndex12339AdditionalIndexMember2021-11-300000826686ssga:C000143792Member2021-12-310000826686ssga:SSGAIndexMSCIACWIexUSAIndex12339BroadBasedIndexMember2021-12-310000826686ssga:SSGAIndexMSCIEAFENetDividendIndex12339AdditionalIndexMember2021-12-310000826686ssga:C000143792Member2022-01-310000826686ssga:SSGAIndexMSCIACWIexUSAIndex12339BroadBasedIndexMember2022-01-310000826686ssga:SSGAIndexMSCIEAFENetDividendIndex12339AdditionalIndexMember2022-01-310000826686ssga:C000143792Member2022-02-280000826686ssga:SSGAIndexMSCIACWIexUSAIndex12339BroadBasedIndexMember2022-02-280000826686ssga:SSGAIndexMSCIEAFENetDividendIndex12339AdditionalIndexMember2022-02-280000826686ssga:C000143792Member2022-03-310000826686ssga:SSGAIndexMSCIACWIexUSAIndex12339BroadBasedIndexMember2022-03-310000826686ssga:SSGAIndexMSCIEAFENetDividendIndex12339AdditionalIndexMember2022-03-310000826686ssga:C000143792Member2022-04-300000826686ssga:SSGAIndexMSCIACWIexUSAIndex12339BroadBasedIndexMember2022-04-300000826686ssga:SSGAIndexMSCIEAFENetDividendIndex12339AdditionalIndexMember2022-04-300000826686ssga:C000143792Member2022-05-310000826686ssga:SSGAIndexMSCIACWIexUSAIndex12339BroadBasedIndexMember2022-05-310000826686ssga:SSGAIndexMSCIEAFENetDividendIndex12339AdditionalIndexMember2022-05-310000826686ssga:C000143792Member2022-06-300000826686ssga:SSGAIndexMSCIACWIexUSAIndex12339BroadBasedIndexMember2022-06-300000826686ssga:SSGAIndexMSCIEAFENetDividendIndex12339AdditionalIndexMember2022-06-300000826686ssga:C000143792Member2022-07-310000826686ssga:SSGAIndexMSCIACWIexUSAIndex12339BroadBasedIndexMember2022-07-310000826686ssga:SSGAIndexMSCIEAFENetDividendIndex12339AdditionalIndexMember2022-07-310000826686ssga:C000143792Member2022-08-310000826686ssga:SSGAIndexMSCIACWIexUSAIndex12339BroadBasedIndexMember2022-08-310000826686ssga:SSGAIndexMSCIEAFENetDividendIndex12339AdditionalIndexMember2022-08-310000826686ssga:C000143792Member2022-09-300000826686ssga:SSGAIndexMSCIACWIexUSAIndex12339BroadBasedIndexMember2022-09-300000826686ssga:SSGAIndexMSCIEAFENetDividendIndex12339AdditionalIndexMember2022-09-300000826686ssga:C000143792Member2022-10-310000826686ssga:SSGAIndexMSCIACWIexUSAIndex12339BroadBasedIndexMember2022-10-310000826686ssga:SSGAIndexMSCIEAFENetDividendIndex12339AdditionalIndexMember2022-10-310000826686ssga:C000143792Member2022-11-300000826686ssga:SSGAIndexMSCIACWIexUSAIndex12339BroadBasedIndexMember2022-11-300000826686ssga:SSGAIndexMSCIEAFENetDividendIndex12339AdditionalIndexMember2022-11-300000826686ssga:C000143792Member2022-12-310000826686ssga:SSGAIndexMSCIACWIexUSAIndex12339BroadBasedIndexMember2022-12-310000826686ssga:SSGAIndexMSCIEAFENetDividendIndex12339AdditionalIndexMember2022-12-310000826686ssga:C000143792Member2023-01-310000826686ssga:SSGAIndexMSCIACWIexUSAIndex12339BroadBasedIndexMember2023-01-310000826686ssga:SSGAIndexMSCIEAFENetDividendIndex12339AdditionalIndexMember2023-01-310000826686ssga:C000143792Member2023-02-280000826686ssga:SSGAIndexMSCIACWIexUSAIndex12339BroadBasedIndexMember2023-02-280000826686ssga:SSGAIndexMSCIEAFENetDividendIndex12339AdditionalIndexMember2023-02-280000826686ssga:C000143792Member2023-03-310000826686ssga:SSGAIndexMSCIACWIexUSAIndex12339BroadBasedIndexMember2023-03-310000826686ssga:SSGAIndexMSCIEAFENetDividendIndex12339AdditionalIndexMember2023-03-310000826686ssga:C000143792Member2023-04-300000826686ssga:SSGAIndexMSCIACWIexUSAIndex12339BroadBasedIndexMember2023-04-300000826686ssga:SSGAIndexMSCIEAFENetDividendIndex12339AdditionalIndexMember2023-04-300000826686ssga:C000143792Member2023-05-310000826686ssga:SSGAIndexMSCIACWIexUSAIndex12339BroadBasedIndexMember2023-05-310000826686ssga:SSGAIndexMSCIEAFENetDividendIndex12339AdditionalIndexMember2023-05-310000826686ssga:C000143792Member2023-06-300000826686ssga:SSGAIndexMSCIACWIexUSAIndex12339BroadBasedIndexMember2023-06-300000826686ssga:SSGAIndexMSCIEAFENetDividendIndex12339AdditionalIndexMember2023-06-300000826686ssga:C000143792Member2023-07-310000826686ssga:SSGAIndexMSCIACWIexUSAIndex12339BroadBasedIndexMember2023-07-310000826686ssga:SSGAIndexMSCIEAFENetDividendIndex12339AdditionalIndexMember2023-07-310000826686ssga:C000143792Member2023-08-310000826686ssga:SSGAIndexMSCIACWIexUSAIndex12339BroadBasedIndexMember2023-08-310000826686ssga:SSGAIndexMSCIEAFENetDividendIndex12339AdditionalIndexMember2023-08-310000826686ssga:C000143792Member2023-09-300000826686ssga:SSGAIndexMSCIACWIexUSAIndex12339BroadBasedIndexMember2023-09-300000826686ssga:SSGAIndexMSCIEAFENetDividendIndex12339AdditionalIndexMember2023-09-300000826686ssga:C000143792Member2023-10-310000826686ssga:SSGAIndexMSCIACWIexUSAIndex12339BroadBasedIndexMember2023-10-310000826686ssga:SSGAIndexMSCIEAFENetDividendIndex12339AdditionalIndexMember2023-10-310000826686ssga:C000143792Member2023-11-300000826686ssga:SSGAIndexMSCIACWIexUSAIndex12339BroadBasedIndexMember2023-11-300000826686ssga:SSGAIndexMSCIEAFENetDividendIndex12339AdditionalIndexMember2023-11-300000826686ssga:C000143792Member2023-12-310000826686ssga:SSGAIndexMSCIACWIexUSAIndex12339BroadBasedIndexMember2023-12-310000826686ssga:SSGAIndexMSCIEAFENetDividendIndex12339AdditionalIndexMember2023-12-310000826686ssga:C000143792Member2024-01-310000826686ssga:SSGAIndexMSCIACWIexUSAIndex12339BroadBasedIndexMember2024-01-310000826686ssga:SSGAIndexMSCIEAFENetDividendIndex12339AdditionalIndexMember2024-01-310000826686ssga:C000143792Member2024-02-290000826686ssga:SSGAIndexMSCIACWIexUSAIndex12339BroadBasedIndexMember2024-02-290000826686ssga:SSGAIndexMSCIEAFENetDividendIndex12339AdditionalIndexMember2024-02-290000826686ssga:C000143792Member2024-03-310000826686ssga:SSGAIndexMSCIACWIexUSAIndex12339BroadBasedIndexMember2024-03-310000826686ssga:SSGAIndexMSCIEAFENetDividendIndex12339AdditionalIndexMember2024-03-310000826686ssga:C000143792Member2024-04-300000826686ssga:SSGAIndexMSCIACWIexUSAIndex12339BroadBasedIndexMember2024-04-300000826686ssga:SSGAIndexMSCIEAFENetDividendIndex12339AdditionalIndexMember2024-04-300000826686ssga:C000143792Member2024-05-310000826686ssga:SSGAIndexMSCIACWIexUSAIndex12339BroadBasedIndexMember2024-05-310000826686ssga:SSGAIndexMSCIEAFENetDividendIndex12339AdditionalIndexMember2024-05-310000826686ssga:C000143792Member2024-06-300000826686ssga:SSGAIndexMSCIACWIexUSAIndex12339BroadBasedIndexMember2024-06-300000826686ssga:SSGAIndexMSCIEAFENetDividendIndex12339AdditionalIndexMember2024-06-300000826686ssga:C000143792Member2024-07-310000826686ssga:SSGAIndexMSCIACWIexUSAIndex12339BroadBasedIndexMember2024-07-310000826686ssga:SSGAIndexMSCIEAFENetDividendIndex12339AdditionalIndexMember2024-07-310000826686ssga:C000143792Member2024-08-310000826686ssga:SSGAIndexMSCIACWIexUSAIndex12339BroadBasedIndexMember2024-08-310000826686ssga:SSGAIndexMSCIEAFENetDividendIndex12339AdditionalIndexMember2024-08-310000826686ssga:C000143792Member2024-09-300000826686ssga:SSGAIndexMSCIACWIexUSAIndex12339BroadBasedIndexMember2024-09-300000826686ssga:SSGAIndexMSCIEAFENetDividendIndex12339AdditionalIndexMember2024-09-300000826686ssga:C000143792Member2024-10-310000826686ssga:SSGAIndexMSCIACWIexUSAIndex12339BroadBasedIndexMember2024-10-310000826686ssga:SSGAIndexMSCIEAFENetDividendIndex12339AdditionalIndexMember2024-10-310000826686ssga:C000143792Member2024-11-300000826686ssga:SSGAIndexMSCIACWIexUSAIndex12339BroadBasedIndexMember2024-11-300000826686ssga:SSGAIndexMSCIEAFENetDividendIndex12339AdditionalIndexMember2024-11-300000826686ssga:C000143792Member2024-12-310000826686ssga:SSGAIndexMSCIACWIexUSAIndex12339BroadBasedIndexMember2024-12-310000826686ssga:SSGAIndexMSCIEAFENetDividendIndex12339AdditionalIndexMember2024-12-310000826686ssga:C000143792Member2025-01-310000826686ssga:SSGAIndexMSCIACWIexUSAIndex12339BroadBasedIndexMember2025-01-310000826686ssga:SSGAIndexMSCIEAFENetDividendIndex12339AdditionalIndexMember2025-01-310000826686ssga:C000143792Member2025-02-280000826686ssga:SSGAIndexMSCIACWIexUSAIndex12339BroadBasedIndexMember2025-02-280000826686ssga:SSGAIndexMSCIEAFENetDividendIndex12339AdditionalIndexMember2025-02-280000826686ssga:C000143792Member2025-03-310000826686ssga:SSGAIndexMSCIACWIexUSAIndex12339BroadBasedIndexMember2025-03-310000826686ssga:SSGAIndexMSCIEAFENetDividendIndex12339AdditionalIndexMember2025-03-310000826686ssga:C000143792Member2025-04-300000826686ssga:SSGAIndexMSCIACWIexUSAIndex12339BroadBasedIndexMember2025-04-300000826686ssga:SSGAIndexMSCIEAFENetDividendIndex12339AdditionalIndexMember2025-04-300000826686ssga:C000143792Member2025-05-310000826686ssga:SSGAIndexMSCIACWIexUSAIndex12339BroadBasedIndexMember2025-05-310000826686ssga:SSGAIndexMSCIEAFENetDividendIndex12339AdditionalIndexMember2025-05-310000826686ssga:C000143792Member2025-06-300000826686ssga:SSGAIndexMSCIACWIexUSAIndex12339BroadBasedIndexMember2025-06-300000826686ssga:SSGAIndexMSCIEAFENetDividendIndex12339AdditionalIndexMember2025-06-300000826686ssga:C000143792Member2025-07-310000826686ssga:SSGAIndexMSCIACWIexUSAIndex12339BroadBasedIndexMember2025-07-310000826686ssga:SSGAIndexMSCIEAFENetDividendIndex12339AdditionalIndexMember2025-07-310000826686ssga:C000143792Member2025-08-310000826686ssga:SSGAIndexMSCIACWIexUSAIndex12339BroadBasedIndexMember2025-08-310000826686ssga:SSGAIndexMSCIEAFENetDividendIndex12339AdditionalIndexMember2025-08-310000826686ssga:C000143792Memberoef:WithoutSalesLoadMember2024-09-012025-08-310000826686ssga:C000143792Memberoef:WithoutSalesLoadMember2020-09-012025-08-310000826686ssga:C000143792Memberoef:WithoutSalesLoadMember2015-09-012025-08-310000826686ssga:SSGAIndexMSCIACWIexUSAIndex12339BroadBasedIndexMember2020-09-012025-08-310000826686ssga:SSGAIndexMSCIACWIexUSAIndex12339BroadBasedIndexMember2015-09-012025-08-310000826686ssga:SSGAIndexMSCIEAFENetDividendIndex12339AdditionalIndexMember2020-09-012025-08-310000826686ssga:SSGAIndexMSCIEAFENetDividendIndex12339AdditionalIndexMember2015-09-012025-08-310000826686ssga:C000143792Memberssga:JapanCTIMember2025-08-310000826686ssga:C000143792Memberssga:UnitedKingdomCTIMember2025-08-310000826686ssga:C000143792Memberssga:GermanyCTIMember2025-08-310000826686ssga:C000143792Memberssga:FranceCTIMember2025-08-310000826686ssga:C000143792Memberssga:AustraliaCTIMember2025-08-310000826686ssga:C000143792Memberssga:UnitedStatesCTIMember2025-08-310000826686ssga:C000143792Memberssga:ItalyCTIMember2025-08-310000826686ssga:C000143792Memberssga:SpainCTIMember2025-08-310000826686ssga:C000143792Memberssga:NetherlandsCTIMember2025-08-310000826686ssga:C000143792Memberssga:IsraelCTIMember2025-08-310000826686ssga:C000143792Memberssga:NovartisAGFR710306903CTIMember2025-08-310000826686ssga:C000143792Memberssga:RocheHoldingAGFR711038901CTIMember2025-08-310000826686ssga:C000143792Memberssga:DeutscheTelekomAGFR584235907CTIMember2025-08-310000826686ssga:C000143792Memberssga:BritishAmericanTobaccoPLCFR028758902CTIMember2025-08-310000826686ssga:C000143792Memberssga:IntesaSanpaoloSpAFR407683002CTIMember2025-08-310000826686ssga:C000143792Memberssga:DeutscheBankAGFR575035902CTIMember2025-08-310000826686ssga:C000143792Memberssga:BarclaysPLCFR313486904CTIMember2025-08-310000826686ssga:C000143792Memberssga:LloydsBankingGroupPLCFR087061008CTIMember2025-08-310000826686ssga:C000143792Memberssga:NordeaBankAbpFRBFM0SV904CTIMember2025-08-310000826686ssga:C000143792Memberssga:BankLeumiLeMinusIsraelBMFR607642907CTIMember2025-08-310000826686ssga:C000143793Member2024-09-012025-08-310000826686ssga:SSGAIndexMSCIACWIexUSAIndex12340BroadBasedIndexMember2024-09-012025-08-310000826686ssga:SSGAIndexMSCIEAFENetDividendIndex12340AdditionalIndexMember2024-09-012025-08-310000826686ssga:C000143793Member2015-08-310000826686ssga:SSGAIndexMSCIACWIexUSAIndex12340BroadBasedIndexMember2015-08-310000826686ssga:SSGAIndexMSCIEAFENetDividendIndex12340AdditionalIndexMember2015-08-310000826686ssga:C000143793Member2015-09-300000826686ssga:SSGAIndexMSCIACWIexUSAIndex12340BroadBasedIndexMember2015-09-300000826686ssga:SSGAIndexMSCIEAFENetDividendIndex12340AdditionalIndexMember2015-09-300000826686ssga:C000143793Member2015-10-310000826686ssga:SSGAIndexMSCIACWIexUSAIndex12340BroadBasedIndexMember2015-10-310000826686ssga:SSGAIndexMSCIEAFENetDividendIndex12340AdditionalIndexMember2015-10-310000826686ssga:C000143793Member2015-11-300000826686ssga:SSGAIndexMSCIACWIexUSAIndex12340BroadBasedIndexMember2015-11-300000826686ssga:SSGAIndexMSCIEAFENetDividendIndex12340AdditionalIndexMember2015-11-300000826686ssga:C000143793Member2015-12-310000826686ssga:SSGAIndexMSCIACWIexUSAIndex12340BroadBasedIndexMember2015-12-310000826686ssga:SSGAIndexMSCIEAFENetDividendIndex12340AdditionalIndexMember2015-12-310000826686ssga:C000143793Member2016-01-310000826686ssga:SSGAIndexMSCIACWIexUSAIndex12340BroadBasedIndexMember2016-01-310000826686ssga:SSGAIndexMSCIEAFENetDividendIndex12340AdditionalIndexMember2016-01-310000826686ssga:C000143793Member2016-02-290000826686ssga:SSGAIndexMSCIACWIexUSAIndex12340BroadBasedIndexMember2016-02-290000826686ssga:SSGAIndexMSCIEAFENetDividendIndex12340AdditionalIndexMember2016-02-290000826686ssga:C000143793Member2016-03-310000826686ssga:SSGAIndexMSCIACWIexUSAIndex12340BroadBasedIndexMember2016-03-310000826686ssga:SSGAIndexMSCIEAFENetDividendIndex12340AdditionalIndexMember2016-03-310000826686ssga:C000143793Member2016-04-300000826686ssga:SSGAIndexMSCIACWIexUSAIndex12340BroadBasedIndexMember2016-04-300000826686ssga:SSGAIndexMSCIEAFENetDividendIndex12340AdditionalIndexMember2016-04-300000826686ssga:C000143793Member2016-05-310000826686ssga:SSGAIndexMSCIACWIexUSAIndex12340BroadBasedIndexMember2016-05-310000826686ssga:SSGAIndexMSCIEAFENetDividendIndex12340AdditionalIndexMember2016-05-310000826686ssga:C000143793Member2016-06-300000826686ssga:SSGAIndexMSCIACWIexUSAIndex12340BroadBasedIndexMember2016-06-300000826686ssga:SSGAIndexMSCIEAFENetDividendIndex12340AdditionalIndexMember2016-06-300000826686ssga:C000143793Member2016-07-310000826686ssga:SSGAIndexMSCIACWIexUSAIndex12340BroadBasedIndexMember2016-07-310000826686ssga:SSGAIndexMSCIEAFENetDividendIndex12340AdditionalIndexMember2016-07-310000826686ssga:C000143793Member2016-08-310000826686ssga:SSGAIndexMSCIACWIexUSAIndex12340BroadBasedIndexMember2016-08-310000826686ssga:SSGAIndexMSCIEAFENetDividendIndex12340AdditionalIndexMember2016-08-310000826686ssga:C000143793Member2016-09-300000826686ssga:SSGAIndexMSCIACWIexUSAIndex12340BroadBasedIndexMember2016-09-300000826686ssga:SSGAIndexMSCIEAFENetDividendIndex12340AdditionalIndexMember2016-09-300000826686ssga:C000143793Member2016-10-310000826686ssga:SSGAIndexMSCIACWIexUSAIndex12340BroadBasedIndexMember2016-10-310000826686ssga:SSGAIndexMSCIEAFENetDividendIndex12340AdditionalIndexMember2016-10-310000826686ssga:C000143793Member2016-11-300000826686ssga:SSGAIndexMSCIACWIexUSAIndex12340BroadBasedIndexMember2016-11-300000826686ssga:SSGAIndexMSCIEAFENetDividendIndex12340AdditionalIndexMember2016-11-300000826686ssga:C000143793Member2016-12-310000826686ssga:SSGAIndexMSCIACWIexUSAIndex12340BroadBasedIndexMember2016-12-310000826686ssga:SSGAIndexMSCIEAFENetDividendIndex12340AdditionalIndexMember2016-12-310000826686ssga:C000143793Member2017-01-310000826686ssga:SSGAIndexMSCIACWIexUSAIndex12340BroadBasedIndexMember2017-01-310000826686ssga:SSGAIndexMSCIEAFENetDividendIndex12340AdditionalIndexMember2017-01-310000826686ssga:C000143793Member2017-02-280000826686ssga:SSGAIndexMSCIACWIexUSAIndex12340BroadBasedIndexMember2017-02-280000826686ssga:SSGAIndexMSCIEAFENetDividendIndex12340AdditionalIndexMember2017-02-280000826686ssga:C000143793Member2017-03-310000826686ssga:SSGAIndexMSCIACWIexUSAIndex12340BroadBasedIndexMember2017-03-310000826686ssga:SSGAIndexMSCIEAFENetDividendIndex12340AdditionalIndexMember2017-03-310000826686ssga:C000143793Member2017-04-300000826686ssga:SSGAIndexMSCIACWIexUSAIndex12340BroadBasedIndexMember2017-04-300000826686ssga:SSGAIndexMSCIEAFENetDividendIndex12340AdditionalIndexMember2017-04-300000826686ssga:C000143793Member2017-05-310000826686ssga:SSGAIndexMSCIACWIexUSAIndex12340BroadBasedIndexMember2017-05-310000826686ssga:SSGAIndexMSCIEAFENetDividendIndex12340AdditionalIndexMember2017-05-310000826686ssga:C000143793Member2017-06-300000826686ssga:SSGAIndexMSCIACWIexUSAIndex12340BroadBasedIndexMember2017-06-300000826686ssga:SSGAIndexMSCIEAFENetDividendIndex12340AdditionalIndexMember2017-06-300000826686ssga:C000143793Member2017-07-310000826686ssga:SSGAIndexMSCIACWIexUSAIndex12340BroadBasedIndexMember2017-07-310000826686ssga:SSGAIndexMSCIEAFENetDividendIndex12340AdditionalIndexMember2017-07-310000826686ssga:C000143793Member2017-08-310000826686ssga:SSGAIndexMSCIACWIexUSAIndex12340BroadBasedIndexMember2017-08-310000826686ssga:SSGAIndexMSCIEAFENetDividendIndex12340AdditionalIndexMember2017-08-310000826686ssga:C000143793Member2017-09-300000826686ssga:SSGAIndexMSCIACWIexUSAIndex12340BroadBasedIndexMember2017-09-300000826686ssga:SSGAIndexMSCIEAFENetDividendIndex12340AdditionalIndexMember2017-09-300000826686ssga:C000143793Member2017-10-310000826686ssga:SSGAIndexMSCIACWIexUSAIndex12340BroadBasedIndexMember2017-10-310000826686ssga:SSGAIndexMSCIEAFENetDividendIndex12340AdditionalIndexMember2017-10-310000826686ssga:C000143793Member2017-11-300000826686ssga:SSGAIndexMSCIACWIexUSAIndex12340BroadBasedIndexMember2017-11-300000826686ssga:SSGAIndexMSCIEAFENetDividendIndex12340AdditionalIndexMember2017-11-300000826686ssga:C000143793Member2017-12-310000826686ssga:SSGAIndexMSCIACWIexUSAIndex12340BroadBasedIndexMember2017-12-310000826686ssga:SSGAIndexMSCIEAFENetDividendIndex12340AdditionalIndexMember2017-12-310000826686ssga:C000143793Member2018-01-310000826686ssga:SSGAIndexMSCIACWIexUSAIndex12340BroadBasedIndexMember2018-01-310000826686ssga:SSGAIndexMSCIEAFENetDividendIndex12340AdditionalIndexMember2018-01-310000826686ssga:C000143793Member2018-02-280000826686ssga:SSGAIndexMSCIACWIexUSAIndex12340BroadBasedIndexMember2018-02-280000826686ssga:SSGAIndexMSCIEAFENetDividendIndex12340AdditionalIndexMember2018-02-280000826686ssga:C000143793Member2018-03-310000826686ssga:SSGAIndexMSCIACWIexUSAIndex12340BroadBasedIndexMember2018-03-310000826686ssga:SSGAIndexMSCIEAFENetDividendIndex12340AdditionalIndexMember2018-03-310000826686ssga:C000143793Member2018-04-300000826686ssga:SSGAIndexMSCIACWIexUSAIndex12340BroadBasedIndexMember2018-04-300000826686ssga:SSGAIndexMSCIEAFENetDividendIndex12340AdditionalIndexMember2018-04-300000826686ssga:C000143793Member2018-05-310000826686ssga:SSGAIndexMSCIACWIexUSAIndex12340BroadBasedIndexMember2018-05-310000826686ssga:SSGAIndexMSCIEAFENetDividendIndex12340AdditionalIndexMember2018-05-310000826686ssga:C000143793Member2018-06-300000826686ssga:SSGAIndexMSCIACWIexUSAIndex12340BroadBasedIndexMember2018-06-300000826686ssga:SSGAIndexMSCIEAFENetDividendIndex12340AdditionalIndexMember2018-06-300000826686ssga:C000143793Member2018-07-310000826686ssga:SSGAIndexMSCIACWIexUSAIndex12340BroadBasedIndexMember2018-07-310000826686ssga:SSGAIndexMSCIEAFENetDividendIndex12340AdditionalIndexMember2018-07-310000826686ssga:C000143793Member2018-08-310000826686ssga:SSGAIndexMSCIACWIexUSAIndex12340BroadBasedIndexMember2018-08-310000826686ssga:SSGAIndexMSCIEAFENetDividendIndex12340AdditionalIndexMember2018-08-310000826686ssga:C000143793Member2018-09-300000826686ssga:SSGAIndexMSCIACWIexUSAIndex12340BroadBasedIndexMember2018-09-300000826686ssga:SSGAIndexMSCIEAFENetDividendIndex12340AdditionalIndexMember2018-09-300000826686ssga:C000143793Member2018-10-310000826686ssga:SSGAIndexMSCIACWIexUSAIndex12340BroadBasedIndexMember2018-10-310000826686ssga:SSGAIndexMSCIEAFENetDividendIndex12340AdditionalIndexMember2018-10-310000826686ssga:C000143793Member2018-11-300000826686ssga:SSGAIndexMSCIACWIexUSAIndex12340BroadBasedIndexMember2018-11-300000826686ssga:SSGAIndexMSCIEAFENetDividendIndex12340AdditionalIndexMember2018-11-300000826686ssga:C000143793Member2018-12-310000826686ssga:SSGAIndexMSCIACWIexUSAIndex12340BroadBasedIndexMember2018-12-310000826686ssga:SSGAIndexMSCIEAFENetDividendIndex12340AdditionalIndexMember2018-12-310000826686ssga:C000143793Member2019-01-310000826686ssga:SSGAIndexMSCIACWIexUSAIndex12340BroadBasedIndexMember2019-01-310000826686ssga:SSGAIndexMSCIEAFENetDividendIndex12340AdditionalIndexMember2019-01-310000826686ssga:C000143793Member2019-02-280000826686ssga:SSGAIndexMSCIACWIexUSAIndex12340BroadBasedIndexMember2019-02-280000826686ssga:SSGAIndexMSCIEAFENetDividendIndex12340AdditionalIndexMember2019-02-280000826686ssga:C000143793Member2019-03-310000826686ssga:SSGAIndexMSCIACWIexUSAIndex12340BroadBasedIndexMember2019-03-310000826686ssga:SSGAIndexMSCIEAFENetDividendIndex12340AdditionalIndexMember2019-03-310000826686ssga:C000143793Member2019-04-300000826686ssga:SSGAIndexMSCIACWIexUSAIndex12340BroadBasedIndexMember2019-04-300000826686ssga:SSGAIndexMSCIEAFENetDividendIndex12340AdditionalIndexMember2019-04-300000826686ssga:C000143793Member2019-05-310000826686ssga:SSGAIndexMSCIACWIexUSAIndex12340BroadBasedIndexMember2019-05-310000826686ssga:SSGAIndexMSCIEAFENetDividendIndex12340AdditionalIndexMember2019-05-310000826686ssga:C000143793Member2019-06-300000826686ssga:SSGAIndexMSCIACWIexUSAIndex12340BroadBasedIndexMember2019-06-300000826686ssga:SSGAIndexMSCIEAFENetDividendIndex12340AdditionalIndexMember2019-06-300000826686ssga:C000143793Member2019-07-310000826686ssga:SSGAIndexMSCIACWIexUSAIndex12340BroadBasedIndexMember2019-07-310000826686ssga:SSGAIndexMSCIEAFENetDividendIndex12340AdditionalIndexMember2019-07-310000826686ssga:C000143793Member2019-08-310000826686ssga:SSGAIndexMSCIACWIexUSAIndex12340BroadBasedIndexMember2019-08-310000826686ssga:SSGAIndexMSCIEAFENetDividendIndex12340AdditionalIndexMember2019-08-310000826686ssga:C000143793Member2019-09-300000826686ssga:SSGAIndexMSCIACWIexUSAIndex12340BroadBasedIndexMember2019-09-300000826686ssga:SSGAIndexMSCIEAFENetDividendIndex12340AdditionalIndexMember2019-09-300000826686ssga:C000143793Member2019-10-310000826686ssga:SSGAIndexMSCIACWIexUSAIndex12340BroadBasedIndexMember2019-10-310000826686ssga:SSGAIndexMSCIEAFENetDividendIndex12340AdditionalIndexMember2019-10-310000826686ssga:C000143793Member2019-11-300000826686ssga:SSGAIndexMSCIACWIexUSAIndex12340BroadBasedIndexMember2019-11-300000826686ssga:SSGAIndexMSCIEAFENetDividendIndex12340AdditionalIndexMember2019-11-300000826686ssga:C000143793Member2019-12-310000826686ssga:SSGAIndexMSCIACWIexUSAIndex12340BroadBasedIndexMember2019-12-310000826686ssga:SSGAIndexMSCIEAFENetDividendIndex12340AdditionalIndexMember2019-12-310000826686ssga:C000143793Member2020-01-310000826686ssga:SSGAIndexMSCIACWIexUSAIndex12340BroadBasedIndexMember2020-01-310000826686ssga:SSGAIndexMSCIEAFENetDividendIndex12340AdditionalIndexMember2020-01-310000826686ssga:C000143793Member2020-02-290000826686ssga:SSGAIndexMSCIACWIexUSAIndex12340BroadBasedIndexMember2020-02-290000826686ssga:SSGAIndexMSCIEAFENetDividendIndex12340AdditionalIndexMember2020-02-290000826686ssga:C000143793Member2020-03-310000826686ssga:SSGAIndexMSCIACWIexUSAIndex12340BroadBasedIndexMember2020-03-310000826686ssga:SSGAIndexMSCIEAFENetDividendIndex12340AdditionalIndexMember2020-03-310000826686ssga:C000143793Member2020-04-300000826686ssga:SSGAIndexMSCIACWIexUSAIndex12340BroadBasedIndexMember2020-04-300000826686ssga:SSGAIndexMSCIEAFENetDividendIndex12340AdditionalIndexMember2020-04-300000826686ssga:C000143793Member2020-05-310000826686ssga:SSGAIndexMSCIACWIexUSAIndex12340BroadBasedIndexMember2020-05-310000826686ssga:SSGAIndexMSCIEAFENetDividendIndex12340AdditionalIndexMember2020-05-310000826686ssga:C000143793Member2020-06-300000826686ssga:SSGAIndexMSCIACWIexUSAIndex12340BroadBasedIndexMember2020-06-300000826686ssga:SSGAIndexMSCIEAFENetDividendIndex12340AdditionalIndexMember2020-06-300000826686ssga:C000143793Member2020-07-310000826686ssga:SSGAIndexMSCIACWIexUSAIndex12340BroadBasedIndexMember2020-07-310000826686ssga:SSGAIndexMSCIEAFENetDividendIndex12340AdditionalIndexMember2020-07-310000826686ssga:C000143793Member2020-08-310000826686ssga:SSGAIndexMSCIACWIexUSAIndex12340BroadBasedIndexMember2020-08-310000826686ssga:SSGAIndexMSCIEAFENetDividendIndex12340AdditionalIndexMember2020-08-310000826686ssga:C000143793Member2020-09-300000826686ssga:SSGAIndexMSCIACWIexUSAIndex12340BroadBasedIndexMember2020-09-300000826686ssga:SSGAIndexMSCIEAFENetDividendIndex12340AdditionalIndexMember2020-09-300000826686ssga:C000143793Member2020-10-310000826686ssga:SSGAIndexMSCIACWIexUSAIndex12340BroadBasedIndexMember2020-10-310000826686ssga:SSGAIndexMSCIEAFENetDividendIndex12340AdditionalIndexMember2020-10-310000826686ssga:C000143793Member2020-11-300000826686ssga:SSGAIndexMSCIACWIexUSAIndex12340BroadBasedIndexMember2020-11-300000826686ssga:SSGAIndexMSCIEAFENetDividendIndex12340AdditionalIndexMember2020-11-300000826686ssga:C000143793Member2020-12-310000826686ssga:SSGAIndexMSCIACWIexUSAIndex12340BroadBasedIndexMember2020-12-310000826686ssga:SSGAIndexMSCIEAFENetDividendIndex12340AdditionalIndexMember2020-12-310000826686ssga:C000143793Member2021-01-310000826686ssga:SSGAIndexMSCIACWIexUSAIndex12340BroadBasedIndexMember2021-01-310000826686ssga:SSGAIndexMSCIEAFENetDividendIndex12340AdditionalIndexMember2021-01-310000826686ssga:C000143793Member2021-02-280000826686ssga:SSGAIndexMSCIACWIexUSAIndex12340BroadBasedIndexMember2021-02-280000826686ssga:SSGAIndexMSCIEAFENetDividendIndex12340AdditionalIndexMember2021-02-280000826686ssga:C000143793Member2021-03-310000826686ssga:SSGAIndexMSCIACWIexUSAIndex12340BroadBasedIndexMember2021-03-310000826686ssga:SSGAIndexMSCIEAFENetDividendIndex12340AdditionalIndexMember2021-03-310000826686ssga:C000143793Member2021-04-300000826686ssga:SSGAIndexMSCIACWIexUSAIndex12340BroadBasedIndexMember2021-04-300000826686ssga:SSGAIndexMSCIEAFENetDividendIndex12340AdditionalIndexMember2021-04-300000826686ssga:C000143793Member2021-05-310000826686ssga:SSGAIndexMSCIACWIexUSAIndex12340BroadBasedIndexMember2021-05-310000826686ssga:SSGAIndexMSCIEAFENetDividendIndex12340AdditionalIndexMember2021-05-310000826686ssga:C000143793Member2021-06-300000826686ssga:SSGAIndexMSCIACWIexUSAIndex12340BroadBasedIndexMember2021-06-300000826686ssga:SSGAIndexMSCIEAFENetDividendIndex12340AdditionalIndexMember2021-06-300000826686ssga:C000143793Member2021-07-310000826686ssga:SSGAIndexMSCIACWIexUSAIndex12340BroadBasedIndexMember2021-07-310000826686ssga:SSGAIndexMSCIEAFENetDividendIndex12340AdditionalIndexMember2021-07-310000826686ssga:C000143793Member2021-08-310000826686ssga:SSGAIndexMSCIACWIexUSAIndex12340BroadBasedIndexMember2021-08-310000826686ssga:SSGAIndexMSCIEAFENetDividendIndex12340AdditionalIndexMember2021-08-310000826686ssga:C000143793Member2021-09-300000826686ssga:SSGAIndexMSCIACWIexUSAIndex12340BroadBasedIndexMember2021-09-300000826686ssga:SSGAIndexMSCIEAFENetDividendIndex12340AdditionalIndexMember2021-09-300000826686ssga:C000143793Member2021-10-310000826686ssga:SSGAIndexMSCIACWIexUSAIndex12340BroadBasedIndexMember2021-10-310000826686ssga:SSGAIndexMSCIEAFENetDividendIndex12340AdditionalIndexMember2021-10-310000826686ssga:C000143793Member2021-11-300000826686ssga:SSGAIndexMSCIACWIexUSAIndex12340BroadBasedIndexMember2021-11-300000826686ssga:SSGAIndexMSCIEAFENetDividendIndex12340AdditionalIndexMember2021-11-300000826686ssga:C000143793Member2021-12-310000826686ssga:SSGAIndexMSCIACWIexUSAIndex12340BroadBasedIndexMember2021-12-310000826686ssga:SSGAIndexMSCIEAFENetDividendIndex12340AdditionalIndexMember2021-12-310000826686ssga:C000143793Member2022-01-310000826686ssga:SSGAIndexMSCIACWIexUSAIndex12340BroadBasedIndexMember2022-01-310000826686ssga:SSGAIndexMSCIEAFENetDividendIndex12340AdditionalIndexMember2022-01-310000826686ssga:C000143793Member2022-02-280000826686ssga:SSGAIndexMSCIACWIexUSAIndex12340BroadBasedIndexMember2022-02-280000826686ssga:SSGAIndexMSCIEAFENetDividendIndex12340AdditionalIndexMember2022-02-280000826686ssga:C000143793Member2022-03-310000826686ssga:SSGAIndexMSCIACWIexUSAIndex12340BroadBasedIndexMember2022-03-310000826686ssga:SSGAIndexMSCIEAFENetDividendIndex12340AdditionalIndexMember2022-03-310000826686ssga:C000143793Member2022-04-300000826686ssga:SSGAIndexMSCIACWIexUSAIndex12340BroadBasedIndexMember2022-04-300000826686ssga:SSGAIndexMSCIEAFENetDividendIndex12340AdditionalIndexMember2022-04-300000826686ssga:C000143793Member2022-05-310000826686ssga:SSGAIndexMSCIACWIexUSAIndex12340BroadBasedIndexMember2022-05-310000826686ssga:SSGAIndexMSCIEAFENetDividendIndex12340AdditionalIndexMember2022-05-310000826686ssga:C000143793Member2022-06-300000826686ssga:SSGAIndexMSCIACWIexUSAIndex12340BroadBasedIndexMember2022-06-300000826686ssga:SSGAIndexMSCIEAFENetDividendIndex12340AdditionalIndexMember2022-06-300000826686ssga:C000143793Member2022-07-310000826686ssga:SSGAIndexMSCIACWIexUSAIndex12340BroadBasedIndexMember2022-07-310000826686ssga:SSGAIndexMSCIEAFENetDividendIndex12340AdditionalIndexMember2022-07-310000826686ssga:C000143793Member2022-08-310000826686ssga:SSGAIndexMSCIACWIexUSAIndex12340BroadBasedIndexMember2022-08-310000826686ssga:SSGAIndexMSCIEAFENetDividendIndex12340AdditionalIndexMember2022-08-310000826686ssga:C000143793Member2022-09-300000826686ssga:SSGAIndexMSCIACWIexUSAIndex12340BroadBasedIndexMember2022-09-300000826686ssga:SSGAIndexMSCIEAFENetDividendIndex12340AdditionalIndexMember2022-09-300000826686ssga:C000143793Member2022-10-310000826686ssga:SSGAIndexMSCIACWIexUSAIndex12340BroadBasedIndexMember2022-10-310000826686ssga:SSGAIndexMSCIEAFENetDividendIndex12340AdditionalIndexMember2022-10-310000826686ssga:C000143793Member2022-11-300000826686ssga:SSGAIndexMSCIACWIexUSAIndex12340BroadBasedIndexMember2022-11-300000826686ssga:SSGAIndexMSCIEAFENetDividendIndex12340AdditionalIndexMember2022-11-300000826686ssga:C000143793Member2022-12-310000826686ssga:SSGAIndexMSCIACWIexUSAIndex12340BroadBasedIndexMember2022-12-310000826686ssga:SSGAIndexMSCIEAFENetDividendIndex12340AdditionalIndexMember2022-12-310000826686ssga:C000143793Member2023-01-310000826686ssga:SSGAIndexMSCIACWIexUSAIndex12340BroadBasedIndexMember2023-01-310000826686ssga:SSGAIndexMSCIEAFENetDividendIndex12340AdditionalIndexMember2023-01-310000826686ssga:C000143793Member2023-02-280000826686ssga:SSGAIndexMSCIACWIexUSAIndex12340BroadBasedIndexMember2023-02-280000826686ssga:SSGAIndexMSCIEAFENetDividendIndex12340AdditionalIndexMember2023-02-280000826686ssga:C000143793Member2023-03-310000826686ssga:SSGAIndexMSCIACWIexUSAIndex12340BroadBasedIndexMember2023-03-310000826686ssga:SSGAIndexMSCIEAFENetDividendIndex12340AdditionalIndexMember2023-03-310000826686ssga:C000143793Member2023-04-300000826686ssga:SSGAIndexMSCIACWIexUSAIndex12340BroadBasedIndexMember2023-04-300000826686ssga:SSGAIndexMSCIEAFENetDividendIndex12340AdditionalIndexMember2023-04-300000826686ssga:C000143793Member2023-05-310000826686ssga:SSGAIndexMSCIACWIexUSAIndex12340BroadBasedIndexMember2023-05-310000826686ssga:SSGAIndexMSCIEAFENetDividendIndex12340AdditionalIndexMember2023-05-310000826686ssga:C000143793Member2023-06-300000826686ssga:SSGAIndexMSCIACWIexUSAIndex12340BroadBasedIndexMember2023-06-300000826686ssga:SSGAIndexMSCIEAFENetDividendIndex12340AdditionalIndexMember2023-06-300000826686ssga:C000143793Member2023-07-310000826686ssga:SSGAIndexMSCIACWIexUSAIndex12340BroadBasedIndexMember2023-07-310000826686ssga:SSGAIndexMSCIEAFENetDividendIndex12340AdditionalIndexMember2023-07-310000826686ssga:C000143793Member2023-08-310000826686ssga:SSGAIndexMSCIACWIexUSAIndex12340BroadBasedIndexMember2023-08-310000826686ssga:SSGAIndexMSCIEAFENetDividendIndex12340AdditionalIndexMember2023-08-310000826686ssga:C000143793Member2023-09-300000826686ssga:SSGAIndexMSCIACWIexUSAIndex12340BroadBasedIndexMember2023-09-300000826686ssga:SSGAIndexMSCIEAFENetDividendIndex12340AdditionalIndexMember2023-09-300000826686ssga:C000143793Member2023-10-310000826686ssga:SSGAIndexMSCIACWIexUSAIndex12340BroadBasedIndexMember2023-10-310000826686ssga:SSGAIndexMSCIEAFENetDividendIndex12340AdditionalIndexMember2023-10-310000826686ssga:C000143793Member2023-11-300000826686ssga:SSGAIndexMSCIACWIexUSAIndex12340BroadBasedIndexMember2023-11-300000826686ssga:SSGAIndexMSCIEAFENetDividendIndex12340AdditionalIndexMember2023-11-300000826686ssga:C000143793Member2023-12-310000826686ssga:SSGAIndexMSCIACWIexUSAIndex12340BroadBasedIndexMember2023-12-310000826686ssga:SSGAIndexMSCIEAFENetDividendIndex12340AdditionalIndexMember2023-12-310000826686ssga:C000143793Member2024-01-310000826686ssga:SSGAIndexMSCIACWIexUSAIndex12340BroadBasedIndexMember2024-01-310000826686ssga:SSGAIndexMSCIEAFENetDividendIndex12340AdditionalIndexMember2024-01-310000826686ssga:C000143793Member2024-02-290000826686ssga:SSGAIndexMSCIACWIexUSAIndex12340BroadBasedIndexMember2024-02-290000826686ssga:SSGAIndexMSCIEAFENetDividendIndex12340AdditionalIndexMember2024-02-290000826686ssga:C000143793Member2024-03-310000826686ssga:SSGAIndexMSCIACWIexUSAIndex12340BroadBasedIndexMember2024-03-310000826686ssga:SSGAIndexMSCIEAFENetDividendIndex12340AdditionalIndexMember2024-03-310000826686ssga:C000143793Member2024-04-300000826686ssga:SSGAIndexMSCIACWIexUSAIndex12340BroadBasedIndexMember2024-04-300000826686ssga:SSGAIndexMSCIEAFENetDividendIndex12340AdditionalIndexMember2024-04-300000826686ssga:C000143793Member2024-05-310000826686ssga:SSGAIndexMSCIACWIexUSAIndex12340BroadBasedIndexMember2024-05-310000826686ssga:SSGAIndexMSCIEAFENetDividendIndex12340AdditionalIndexMember2024-05-310000826686ssga:C000143793Member2024-06-300000826686ssga:SSGAIndexMSCIACWIexUSAIndex12340BroadBasedIndexMember2024-06-300000826686ssga:SSGAIndexMSCIEAFENetDividendIndex12340AdditionalIndexMember2024-06-300000826686ssga:C000143793Member2024-07-310000826686ssga:SSGAIndexMSCIACWIexUSAIndex12340BroadBasedIndexMember2024-07-310000826686ssga:SSGAIndexMSCIEAFENetDividendIndex12340AdditionalIndexMember2024-07-310000826686ssga:C000143793Member2024-08-310000826686ssga:SSGAIndexMSCIACWIexUSAIndex12340BroadBasedIndexMember2024-08-310000826686ssga:SSGAIndexMSCIEAFENetDividendIndex12340AdditionalIndexMember2024-08-310000826686ssga:C000143793Member2024-09-300000826686ssga:SSGAIndexMSCIACWIexUSAIndex12340BroadBasedIndexMember2024-09-300000826686ssga:SSGAIndexMSCIEAFENetDividendIndex12340AdditionalIndexMember2024-09-300000826686ssga:C000143793Member2024-10-310000826686ssga:SSGAIndexMSCIACWIexUSAIndex12340BroadBasedIndexMember2024-10-310000826686ssga:SSGAIndexMSCIEAFENetDividendIndex12340AdditionalIndexMember2024-10-310000826686ssga:C000143793Member2024-11-300000826686ssga:SSGAIndexMSCIACWIexUSAIndex12340BroadBasedIndexMember2024-11-300000826686ssga:SSGAIndexMSCIEAFENetDividendIndex12340AdditionalIndexMember2024-11-300000826686ssga:C000143793Member2024-12-310000826686ssga:SSGAIndexMSCIACWIexUSAIndex12340BroadBasedIndexMember2024-12-310000826686ssga:SSGAIndexMSCIEAFENetDividendIndex12340AdditionalIndexMember2024-12-310000826686ssga:C000143793Member2025-01-310000826686ssga:SSGAIndexMSCIACWIexUSAIndex12340BroadBasedIndexMember2025-01-310000826686ssga:SSGAIndexMSCIEAFENetDividendIndex12340AdditionalIndexMember2025-01-310000826686ssga:C000143793Member2025-02-280000826686ssga:SSGAIndexMSCIACWIexUSAIndex12340BroadBasedIndexMember2025-02-280000826686ssga:SSGAIndexMSCIEAFENetDividendIndex12340AdditionalIndexMember2025-02-280000826686ssga:C000143793Member2025-03-310000826686ssga:SSGAIndexMSCIACWIexUSAIndex12340BroadBasedIndexMember2025-03-310000826686ssga:SSGAIndexMSCIEAFENetDividendIndex12340AdditionalIndexMember2025-03-310000826686ssga:C000143793Member2025-04-300000826686ssga:SSGAIndexMSCIACWIexUSAIndex12340BroadBasedIndexMember2025-04-300000826686ssga:SSGAIndexMSCIEAFENetDividendIndex12340AdditionalIndexMember2025-04-300000826686ssga:C000143793Member2025-05-310000826686ssga:SSGAIndexMSCIACWIexUSAIndex12340BroadBasedIndexMember2025-05-310000826686ssga:SSGAIndexMSCIEAFENetDividendIndex12340AdditionalIndexMember2025-05-310000826686ssga:C000143793Member2025-06-300000826686ssga:SSGAIndexMSCIACWIexUSAIndex12340BroadBasedIndexMember2025-06-300000826686ssga:SSGAIndexMSCIEAFENetDividendIndex12340AdditionalIndexMember2025-06-300000826686ssga:C000143793Member2025-07-310000826686ssga:SSGAIndexMSCIACWIexUSAIndex12340BroadBasedIndexMember2025-07-310000826686ssga:SSGAIndexMSCIEAFENetDividendIndex12340AdditionalIndexMember2025-07-310000826686ssga:C000143793Member2025-08-310000826686ssga:SSGAIndexMSCIACWIexUSAIndex12340BroadBasedIndexMember2025-08-310000826686ssga:SSGAIndexMSCIEAFENetDividendIndex12340AdditionalIndexMember2025-08-310000826686ssga:C000143793Memberoef:WithoutSalesLoadMember2024-09-012025-08-310000826686ssga:C000143793Memberoef:WithoutSalesLoadMember2020-09-012025-08-310000826686ssga:C000143793Memberoef:WithoutSalesLoadMember2015-09-012025-08-310000826686ssga:SSGAIndexMSCIACWIexUSAIndex12340BroadBasedIndexMember2020-09-012025-08-310000826686ssga:SSGAIndexMSCIACWIexUSAIndex12340BroadBasedIndexMember2015-09-012025-08-310000826686ssga:SSGAIndexMSCIEAFENetDividendIndex12340AdditionalIndexMember2020-09-012025-08-310000826686ssga:SSGAIndexMSCIEAFENetDividendIndex12340AdditionalIndexMember2015-09-012025-08-310000826686ssga:C000143793Memberssga:JapanCTIMember2025-08-310000826686ssga:C000143793Memberssga:UnitedKingdomCTIMember2025-08-310000826686ssga:C000143793Memberssga:GermanyCTIMember2025-08-310000826686ssga:C000143793Memberssga:FranceCTIMember2025-08-310000826686ssga:C000143793Memberssga:AustraliaCTIMember2025-08-310000826686ssga:C000143793Memberssga:UnitedStatesCTIMember2025-08-310000826686ssga:C000143793Memberssga:ItalyCTIMember2025-08-310000826686ssga:C000143793Memberssga:SpainCTIMember2025-08-310000826686ssga:C000143793Memberssga:NetherlandsCTIMember2025-08-310000826686ssga:C000143793Memberssga:IsraelCTIMember2025-08-310000826686ssga:C000143793Memberssga:NovartisAGFR710306903CTIMember2025-08-310000826686ssga:C000143793Memberssga:RocheHoldingAGFR711038901CTIMember2025-08-310000826686ssga:C000143793Memberssga:DeutscheTelekomAGFR584235907CTIMember2025-08-310000826686ssga:C000143793Memberssga:BritishAmericanTobaccoPLCFR028758902CTIMember2025-08-310000826686ssga:C000143793Memberssga:IntesaSanpaoloSpAFR407683002CTIMember2025-08-310000826686ssga:C000143793Memberssga:DeutscheBankAGFR575035902CTIMember2025-08-310000826686ssga:C000143793Memberssga:BarclaysPLCFR313486904CTIMember2025-08-310000826686ssga:C000143793Memberssga:LloydsBankingGroupPLCFR087061008CTIMember2025-08-310000826686ssga:C000143793Memberssga:NordeaBankAbpFRBFM0SV904CTIMember2025-08-310000826686ssga:C000143793Memberssga:BankLeumiLeMinusIsraelBMFR607642907CTIMember2025-08-310000826686ssga:C000014139Member2024-09-012025-08-310000826686ssga:SSGAIndexMSCIACWIexUSAIndex12341BroadBasedIndexMember2024-09-012025-08-310000826686ssga:SSGAIndexMSCIEAFENetDividendIndex12341AdditionalIndexMember2024-09-012025-08-310000826686ssga:C000014139Member2015-08-310000826686ssga:SSGAIndexMSCIACWIexUSAIndex12341BroadBasedIndexMember2015-08-310000826686ssga:SSGAIndexMSCIEAFENetDividendIndex12341AdditionalIndexMember2015-08-310000826686ssga:C000014139Member2015-09-300000826686ssga:SSGAIndexMSCIACWIexUSAIndex12341BroadBasedIndexMember2015-09-300000826686ssga:SSGAIndexMSCIEAFENetDividendIndex12341AdditionalIndexMember2015-09-300000826686ssga:C000014139Member2015-10-310000826686ssga:SSGAIndexMSCIACWIexUSAIndex12341BroadBasedIndexMember2015-10-310000826686ssga:SSGAIndexMSCIEAFENetDividendIndex12341AdditionalIndexMember2015-10-310000826686ssga:C000014139Member2015-11-300000826686ssga:SSGAIndexMSCIACWIexUSAIndex12341BroadBasedIndexMember2015-11-300000826686ssga:SSGAIndexMSCIEAFENetDividendIndex12341AdditionalIndexMember2015-11-300000826686ssga:C000014139Member2015-12-310000826686ssga:SSGAIndexMSCIACWIexUSAIndex12341BroadBasedIndexMember2015-12-310000826686ssga:SSGAIndexMSCIEAFENetDividendIndex12341AdditionalIndexMember2015-12-310000826686ssga:C000014139Member2016-01-310000826686ssga:SSGAIndexMSCIACWIexUSAIndex12341BroadBasedIndexMember2016-01-310000826686ssga:SSGAIndexMSCIEAFENetDividendIndex12341AdditionalIndexMember2016-01-310000826686ssga:C000014139Member2016-02-290000826686ssga:SSGAIndexMSCIACWIexUSAIndex12341BroadBasedIndexMember2016-02-290000826686ssga:SSGAIndexMSCIEAFENetDividendIndex12341AdditionalIndexMember2016-02-290000826686ssga:C000014139Member2016-03-310000826686ssga:SSGAIndexMSCIACWIexUSAIndex12341BroadBasedIndexMember2016-03-310000826686ssga:SSGAIndexMSCIEAFENetDividendIndex12341AdditionalIndexMember2016-03-310000826686ssga:C000014139Member2016-04-300000826686ssga:SSGAIndexMSCIACWIexUSAIndex12341BroadBasedIndexMember2016-04-300000826686ssga:SSGAIndexMSCIEAFENetDividendIndex12341AdditionalIndexMember2016-04-300000826686ssga:C000014139Member2016-05-310000826686ssga:SSGAIndexMSCIACWIexUSAIndex12341BroadBasedIndexMember2016-05-310000826686ssga:SSGAIndexMSCIEAFENetDividendIndex12341AdditionalIndexMember2016-05-310000826686ssga:C000014139Member2016-06-300000826686ssga:SSGAIndexMSCIACWIexUSAIndex12341BroadBasedIndexMember2016-06-300000826686ssga:SSGAIndexMSCIEAFENetDividendIndex12341AdditionalIndexMember2016-06-300000826686ssga:C000014139Member2016-07-310000826686ssga:SSGAIndexMSCIACWIexUSAIndex12341BroadBasedIndexMember2016-07-310000826686ssga:SSGAIndexMSCIEAFENetDividendIndex12341AdditionalIndexMember2016-07-310000826686ssga:C000014139Member2016-08-310000826686ssga:SSGAIndexMSCIACWIexUSAIndex12341BroadBasedIndexMember2016-08-310000826686ssga:SSGAIndexMSCIEAFENetDividendIndex12341AdditionalIndexMember2016-08-310000826686ssga:C000014139Member2016-09-300000826686ssga:SSGAIndexMSCIACWIexUSAIndex12341BroadBasedIndexMember2016-09-300000826686ssga:SSGAIndexMSCIEAFENetDividendIndex12341AdditionalIndexMember2016-09-300000826686ssga:C000014139Member2016-10-310000826686ssga:SSGAIndexMSCIACWIexUSAIndex12341BroadBasedIndexMember2016-10-310000826686ssga:SSGAIndexMSCIEAFENetDividendIndex12341AdditionalIndexMember2016-10-310000826686ssga:C000014139Member2016-11-300000826686ssga:SSGAIndexMSCIACWIexUSAIndex12341BroadBasedIndexMember2016-11-300000826686ssga:SSGAIndexMSCIEAFENetDividendIndex12341AdditionalIndexMember2016-11-300000826686ssga:C000014139Member2016-12-310000826686ssga:SSGAIndexMSCIACWIexUSAIndex12341BroadBasedIndexMember2016-12-310000826686ssga:SSGAIndexMSCIEAFENetDividendIndex12341AdditionalIndexMember2016-12-310000826686ssga:C000014139Member2017-01-310000826686ssga:SSGAIndexMSCIACWIexUSAIndex12341BroadBasedIndexMember2017-01-310000826686ssga:SSGAIndexMSCIEAFENetDividendIndex12341AdditionalIndexMember2017-01-310000826686ssga:C000014139Member2017-02-280000826686ssga:SSGAIndexMSCIACWIexUSAIndex12341BroadBasedIndexMember2017-02-280000826686ssga:SSGAIndexMSCIEAFENetDividendIndex12341AdditionalIndexMember2017-02-280000826686ssga:C000014139Member2017-03-310000826686ssga:SSGAIndexMSCIACWIexUSAIndex12341BroadBasedIndexMember2017-03-310000826686ssga:SSGAIndexMSCIEAFENetDividendIndex12341AdditionalIndexMember2017-03-310000826686ssga:C000014139Member2017-04-300000826686ssga:SSGAIndexMSCIACWIexUSAIndex12341BroadBasedIndexMember2017-04-300000826686ssga:SSGAIndexMSCIEAFENetDividendIndex12341AdditionalIndexMember2017-04-300000826686ssga:C000014139Member2017-05-310000826686ssga:SSGAIndexMSCIACWIexUSAIndex12341BroadBasedIndexMember2017-05-310000826686ssga:SSGAIndexMSCIEAFENetDividendIndex12341AdditionalIndexMember2017-05-310000826686ssga:C000014139Member2017-06-300000826686ssga:SSGAIndexMSCIACWIexUSAIndex12341BroadBasedIndexMember2017-06-300000826686ssga:SSGAIndexMSCIEAFENetDividendIndex12341AdditionalIndexMember2017-06-300000826686ssga:C000014139Member2017-07-310000826686ssga:SSGAIndexMSCIACWIexUSAIndex12341BroadBasedIndexMember2017-07-310000826686ssga:SSGAIndexMSCIEAFENetDividendIndex12341AdditionalIndexMember2017-07-310000826686ssga:C000014139Member2017-08-310000826686ssga:SSGAIndexMSCIACWIexUSAIndex12341BroadBasedIndexMember2017-08-310000826686ssga:SSGAIndexMSCIEAFENetDividendIndex12341AdditionalIndexMember2017-08-310000826686ssga:C000014139Member2017-09-300000826686ssga:SSGAIndexMSCIACWIexUSAIndex12341BroadBasedIndexMember2017-09-300000826686ssga:SSGAIndexMSCIEAFENetDividendIndex12341AdditionalIndexMember2017-09-300000826686ssga:C000014139Member2017-10-310000826686ssga:SSGAIndexMSCIACWIexUSAIndex12341BroadBasedIndexMember2017-10-310000826686ssga:SSGAIndexMSCIEAFENetDividendIndex12341AdditionalIndexMember2017-10-310000826686ssga:C000014139Member2017-11-300000826686ssga:SSGAIndexMSCIACWIexUSAIndex12341BroadBasedIndexMember2017-11-300000826686ssga:SSGAIndexMSCIEAFENetDividendIndex12341AdditionalIndexMember2017-11-300000826686ssga:C000014139Member2017-12-310000826686ssga:SSGAIndexMSCIACWIexUSAIndex12341BroadBasedIndexMember2017-12-310000826686ssga:SSGAIndexMSCIEAFENetDividendIndex12341AdditionalIndexMember2017-12-310000826686ssga:C000014139Member2018-01-310000826686ssga:SSGAIndexMSCIACWIexUSAIndex12341BroadBasedIndexMember2018-01-310000826686ssga:SSGAIndexMSCIEAFENetDividendIndex12341AdditionalIndexMember2018-01-310000826686ssga:C000014139Member2018-02-280000826686ssga:SSGAIndexMSCIACWIexUSAIndex12341BroadBasedIndexMember2018-02-280000826686ssga:SSGAIndexMSCIEAFENetDividendIndex12341AdditionalIndexMember2018-02-280000826686ssga:C000014139Member2018-03-310000826686ssga:SSGAIndexMSCIACWIexUSAIndex12341BroadBasedIndexMember2018-03-310000826686ssga:SSGAIndexMSCIEAFENetDividendIndex12341AdditionalIndexMember2018-03-310000826686ssga:C000014139Member2018-04-300000826686ssga:SSGAIndexMSCIACWIexUSAIndex12341BroadBasedIndexMember2018-04-300000826686ssga:SSGAIndexMSCIEAFENetDividendIndex12341AdditionalIndexMember2018-04-300000826686ssga:C000014139Member2018-05-310000826686ssga:SSGAIndexMSCIACWIexUSAIndex12341BroadBasedIndexMember2018-05-310000826686ssga:SSGAIndexMSCIEAFENetDividendIndex12341AdditionalIndexMember2018-05-310000826686ssga:C000014139Member2018-06-300000826686ssga:SSGAIndexMSCIACWIexUSAIndex12341BroadBasedIndexMember2018-06-300000826686ssga:SSGAIndexMSCIEAFENetDividendIndex12341AdditionalIndexMember2018-06-300000826686ssga:C000014139Member2018-07-310000826686ssga:SSGAIndexMSCIACWIexUSAIndex12341BroadBasedIndexMember2018-07-310000826686ssga:SSGAIndexMSCIEAFENetDividendIndex12341AdditionalIndexMember2018-07-310000826686ssga:C000014139Member2018-08-310000826686ssga:SSGAIndexMSCIACWIexUSAIndex12341BroadBasedIndexMember2018-08-310000826686ssga:SSGAIndexMSCIEAFENetDividendIndex12341AdditionalIndexMember2018-08-310000826686ssga:C000014139Member2018-09-300000826686ssga:SSGAIndexMSCIACWIexUSAIndex12341BroadBasedIndexMember2018-09-300000826686ssga:SSGAIndexMSCIEAFENetDividendIndex12341AdditionalIndexMember2018-09-300000826686ssga:C000014139Member2018-10-310000826686ssga:SSGAIndexMSCIACWIexUSAIndex12341BroadBasedIndexMember2018-10-310000826686ssga:SSGAIndexMSCIEAFENetDividendIndex12341AdditionalIndexMember2018-10-310000826686ssga:C000014139Member2018-11-300000826686ssga:SSGAIndexMSCIACWIexUSAIndex12341BroadBasedIndexMember2018-11-300000826686ssga:SSGAIndexMSCIEAFENetDividendIndex12341AdditionalIndexMember2018-11-300000826686ssga:C000014139Member2018-12-310000826686ssga:SSGAIndexMSCIACWIexUSAIndex12341BroadBasedIndexMember2018-12-310000826686ssga:SSGAIndexMSCIEAFENetDividendIndex12341AdditionalIndexMember2018-12-310000826686ssga:C000014139Member2019-01-310000826686ssga:SSGAIndexMSCIACWIexUSAIndex12341BroadBasedIndexMember2019-01-310000826686ssga:SSGAIndexMSCIEAFENetDividendIndex12341AdditionalIndexMember2019-01-310000826686ssga:C000014139Member2019-02-280000826686ssga:SSGAIndexMSCIACWIexUSAIndex12341BroadBasedIndexMember2019-02-280000826686ssga:SSGAIndexMSCIEAFENetDividendIndex12341AdditionalIndexMember2019-02-280000826686ssga:C000014139Member2019-03-310000826686ssga:SSGAIndexMSCIACWIexUSAIndex12341BroadBasedIndexMember2019-03-310000826686ssga:SSGAIndexMSCIEAFENetDividendIndex12341AdditionalIndexMember2019-03-310000826686ssga:C000014139Member2019-04-300000826686ssga:SSGAIndexMSCIACWIexUSAIndex12341BroadBasedIndexMember2019-04-300000826686ssga:SSGAIndexMSCIEAFENetDividendIndex12341AdditionalIndexMember2019-04-300000826686ssga:C000014139Member2019-05-310000826686ssga:SSGAIndexMSCIACWIexUSAIndex12341BroadBasedIndexMember2019-05-310000826686ssga:SSGAIndexMSCIEAFENetDividendIndex12341AdditionalIndexMember2019-05-310000826686ssga:C000014139Member2019-06-300000826686ssga:SSGAIndexMSCIACWIexUSAIndex12341BroadBasedIndexMember2019-06-300000826686ssga:SSGAIndexMSCIEAFENetDividendIndex12341AdditionalIndexMember2019-06-300000826686ssga:C000014139Member2019-07-310000826686ssga:SSGAIndexMSCIACWIexUSAIndex12341BroadBasedIndexMember2019-07-310000826686ssga:SSGAIndexMSCIEAFENetDividendIndex12341AdditionalIndexMember2019-07-310000826686ssga:C000014139Member2019-08-310000826686ssga:SSGAIndexMSCIACWIexUSAIndex12341BroadBasedIndexMember2019-08-310000826686ssga:SSGAIndexMSCIEAFENetDividendIndex12341AdditionalIndexMember2019-08-310000826686ssga:C000014139Member2019-09-300000826686ssga:SSGAIndexMSCIACWIexUSAIndex12341BroadBasedIndexMember2019-09-300000826686ssga:SSGAIndexMSCIEAFENetDividendIndex12341AdditionalIndexMember2019-09-300000826686ssga:C000014139Member2019-10-310000826686ssga:SSGAIndexMSCIACWIexUSAIndex12341BroadBasedIndexMember2019-10-310000826686ssga:SSGAIndexMSCIEAFENetDividendIndex12341AdditionalIndexMember2019-10-310000826686ssga:C000014139Member2019-11-300000826686ssga:SSGAIndexMSCIACWIexUSAIndex12341BroadBasedIndexMember2019-11-300000826686ssga:SSGAIndexMSCIEAFENetDividendIndex12341AdditionalIndexMember2019-11-300000826686ssga:C000014139Member2019-12-310000826686ssga:SSGAIndexMSCIACWIexUSAIndex12341BroadBasedIndexMember2019-12-310000826686ssga:SSGAIndexMSCIEAFENetDividendIndex12341AdditionalIndexMember2019-12-310000826686ssga:C000014139Member2020-01-310000826686ssga:SSGAIndexMSCIACWIexUSAIndex12341BroadBasedIndexMember2020-01-310000826686ssga:SSGAIndexMSCIEAFENetDividendIndex12341AdditionalIndexMember2020-01-310000826686ssga:C000014139Member2020-02-290000826686ssga:SSGAIndexMSCIACWIexUSAIndex12341BroadBasedIndexMember2020-02-290000826686ssga:SSGAIndexMSCIEAFENetDividendIndex12341AdditionalIndexMember2020-02-290000826686ssga:C000014139Member2020-03-310000826686ssga:SSGAIndexMSCIACWIexUSAIndex12341BroadBasedIndexMember2020-03-310000826686ssga:SSGAIndexMSCIEAFENetDividendIndex12341AdditionalIndexMember2020-03-310000826686ssga:C000014139Member2020-04-300000826686ssga:SSGAIndexMSCIACWIexUSAIndex12341BroadBasedIndexMember2020-04-300000826686ssga:SSGAIndexMSCIEAFENetDividendIndex12341AdditionalIndexMember2020-04-300000826686ssga:C000014139Member2020-05-310000826686ssga:SSGAIndexMSCIACWIexUSAIndex12341BroadBasedIndexMember2020-05-310000826686ssga:SSGAIndexMSCIEAFENetDividendIndex12341AdditionalIndexMember2020-05-310000826686ssga:C000014139Member2020-06-300000826686ssga:SSGAIndexMSCIACWIexUSAIndex12341BroadBasedIndexMember2020-06-300000826686ssga:SSGAIndexMSCIEAFENetDividendIndex12341AdditionalIndexMember2020-06-300000826686ssga:C000014139Member2020-07-310000826686ssga:SSGAIndexMSCIACWIexUSAIndex12341BroadBasedIndexMember2020-07-310000826686ssga:SSGAIndexMSCIEAFENetDividendIndex12341AdditionalIndexMember2020-07-310000826686ssga:C000014139Member2020-08-310000826686ssga:SSGAIndexMSCIACWIexUSAIndex12341BroadBasedIndexMember2020-08-310000826686ssga:SSGAIndexMSCIEAFENetDividendIndex12341AdditionalIndexMember2020-08-310000826686ssga:C000014139Member2020-09-300000826686ssga:SSGAIndexMSCIACWIexUSAIndex12341BroadBasedIndexMember2020-09-300000826686ssga:SSGAIndexMSCIEAFENetDividendIndex12341AdditionalIndexMember2020-09-300000826686ssga:C000014139Member2020-10-310000826686ssga:SSGAIndexMSCIACWIexUSAIndex12341BroadBasedIndexMember2020-10-310000826686ssga:SSGAIndexMSCIEAFENetDividendIndex12341AdditionalIndexMember2020-10-310000826686ssga:C000014139Member2020-11-300000826686ssga:SSGAIndexMSCIACWIexUSAIndex12341BroadBasedIndexMember2020-11-300000826686ssga:SSGAIndexMSCIEAFENetDividendIndex12341AdditionalIndexMember2020-11-300000826686ssga:C000014139Member2020-12-310000826686ssga:SSGAIndexMSCIACWIexUSAIndex12341BroadBasedIndexMember2020-12-310000826686ssga:SSGAIndexMSCIEAFENetDividendIndex12341AdditionalIndexMember2020-12-310000826686ssga:C000014139Member2021-01-310000826686ssga:SSGAIndexMSCIACWIexUSAIndex12341BroadBasedIndexMember2021-01-310000826686ssga:SSGAIndexMSCIEAFENetDividendIndex12341AdditionalIndexMember2021-01-310000826686ssga:C000014139Member2021-02-280000826686ssga:SSGAIndexMSCIACWIexUSAIndex12341BroadBasedIndexMember2021-02-280000826686ssga:SSGAIndexMSCIEAFENetDividendIndex12341AdditionalIndexMember2021-02-280000826686ssga:C000014139Member2021-03-310000826686ssga:SSGAIndexMSCIACWIexUSAIndex12341BroadBasedIndexMember2021-03-310000826686ssga:SSGAIndexMSCIEAFENetDividendIndex12341AdditionalIndexMember2021-03-310000826686ssga:C000014139Member2021-04-300000826686ssga:SSGAIndexMSCIACWIexUSAIndex12341BroadBasedIndexMember2021-04-300000826686ssga:SSGAIndexMSCIEAFENetDividendIndex12341AdditionalIndexMember2021-04-300000826686ssga:C000014139Member2021-05-310000826686ssga:SSGAIndexMSCIACWIexUSAIndex12341BroadBasedIndexMember2021-05-310000826686ssga:SSGAIndexMSCIEAFENetDividendIndex12341AdditionalIndexMember2021-05-310000826686ssga:C000014139Member2021-06-300000826686ssga:SSGAIndexMSCIACWIexUSAIndex12341BroadBasedIndexMember2021-06-300000826686ssga:SSGAIndexMSCIEAFENetDividendIndex12341AdditionalIndexMember2021-06-300000826686ssga:C000014139Member2021-07-310000826686ssga:SSGAIndexMSCIACWIexUSAIndex12341BroadBasedIndexMember2021-07-310000826686ssga:SSGAIndexMSCIEAFENetDividendIndex12341AdditionalIndexMember2021-07-310000826686ssga:C000014139Member2021-08-310000826686ssga:SSGAIndexMSCIACWIexUSAIndex12341BroadBasedIndexMember2021-08-310000826686ssga:SSGAIndexMSCIEAFENetDividendIndex12341AdditionalIndexMember2021-08-310000826686ssga:C000014139Member2021-09-300000826686ssga:SSGAIndexMSCIACWIexUSAIndex12341BroadBasedIndexMember2021-09-300000826686ssga:SSGAIndexMSCIEAFENetDividendIndex12341AdditionalIndexMember2021-09-300000826686ssga:C000014139Member2021-10-310000826686ssga:SSGAIndexMSCIACWIexUSAIndex12341BroadBasedIndexMember2021-10-310000826686ssga:SSGAIndexMSCIEAFENetDividendIndex12341AdditionalIndexMember2021-10-310000826686ssga:C000014139Member2021-11-300000826686ssga:SSGAIndexMSCIACWIexUSAIndex12341BroadBasedIndexMember2021-11-300000826686ssga:SSGAIndexMSCIEAFENetDividendIndex12341AdditionalIndexMember2021-11-300000826686ssga:C000014139Member2021-12-310000826686ssga:SSGAIndexMSCIACWIexUSAIndex12341BroadBasedIndexMember2021-12-310000826686ssga:SSGAIndexMSCIEAFENetDividendIndex12341AdditionalIndexMember2021-12-310000826686ssga:C000014139Member2022-01-310000826686ssga:SSGAIndexMSCIACWIexUSAIndex12341BroadBasedIndexMember2022-01-310000826686ssga:SSGAIndexMSCIEAFENetDividendIndex12341AdditionalIndexMember2022-01-310000826686ssga:C000014139Member2022-02-280000826686ssga:SSGAIndexMSCIACWIexUSAIndex12341BroadBasedIndexMember2022-02-280000826686ssga:SSGAIndexMSCIEAFENetDividendIndex12341AdditionalIndexMember2022-02-280000826686ssga:C000014139Member2022-03-310000826686ssga:SSGAIndexMSCIACWIexUSAIndex12341BroadBasedIndexMember2022-03-310000826686ssga:SSGAIndexMSCIEAFENetDividendIndex12341AdditionalIndexMember2022-03-310000826686ssga:C000014139Member2022-04-300000826686ssga:SSGAIndexMSCIACWIexUSAIndex12341BroadBasedIndexMember2022-04-300000826686ssga:SSGAIndexMSCIEAFENetDividendIndex12341AdditionalIndexMember2022-04-300000826686ssga:C000014139Member2022-05-310000826686ssga:SSGAIndexMSCIACWIexUSAIndex12341BroadBasedIndexMember2022-05-310000826686ssga:SSGAIndexMSCIEAFENetDividendIndex12341AdditionalIndexMember2022-05-310000826686ssga:C000014139Member2022-06-300000826686ssga:SSGAIndexMSCIACWIexUSAIndex12341BroadBasedIndexMember2022-06-300000826686ssga:SSGAIndexMSCIEAFENetDividendIndex12341AdditionalIndexMember2022-06-300000826686ssga:C000014139Member2022-07-310000826686ssga:SSGAIndexMSCIACWIexUSAIndex12341BroadBasedIndexMember2022-07-310000826686ssga:SSGAIndexMSCIEAFENetDividendIndex12341AdditionalIndexMember2022-07-310000826686ssga:C000014139Member2022-08-310000826686ssga:SSGAIndexMSCIACWIexUSAIndex12341BroadBasedIndexMember2022-08-310000826686ssga:SSGAIndexMSCIEAFENetDividendIndex12341AdditionalIndexMember2022-08-310000826686ssga:C000014139Member2022-09-300000826686ssga:SSGAIndexMSCIACWIexUSAIndex12341BroadBasedIndexMember2022-09-300000826686ssga:SSGAIndexMSCIEAFENetDividendIndex12341AdditionalIndexMember2022-09-300000826686ssga:C000014139Member2022-10-310000826686ssga:SSGAIndexMSCIACWIexUSAIndex12341BroadBasedIndexMember2022-10-310000826686ssga:SSGAIndexMSCIEAFENetDividendIndex12341AdditionalIndexMember2022-10-310000826686ssga:C000014139Member2022-11-300000826686ssga:SSGAIndexMSCIACWIexUSAIndex12341BroadBasedIndexMember2022-11-300000826686ssga:SSGAIndexMSCIEAFENetDividendIndex12341AdditionalIndexMember2022-11-300000826686ssga:C000014139Member2022-12-310000826686ssga:SSGAIndexMSCIACWIexUSAIndex12341BroadBasedIndexMember2022-12-310000826686ssga:SSGAIndexMSCIEAFENetDividendIndex12341AdditionalIndexMember2022-12-310000826686ssga:C000014139Member2023-01-310000826686ssga:SSGAIndexMSCIACWIexUSAIndex12341BroadBasedIndexMember2023-01-310000826686ssga:SSGAIndexMSCIEAFENetDividendIndex12341AdditionalIndexMember2023-01-310000826686ssga:C000014139Member2023-02-280000826686ssga:SSGAIndexMSCIACWIexUSAIndex12341BroadBasedIndexMember2023-02-280000826686ssga:SSGAIndexMSCIEAFENetDividendIndex12341AdditionalIndexMember2023-02-280000826686ssga:C000014139Member2023-03-310000826686ssga:SSGAIndexMSCIACWIexUSAIndex12341BroadBasedIndexMember2023-03-310000826686ssga:SSGAIndexMSCIEAFENetDividendIndex12341AdditionalIndexMember2023-03-310000826686ssga:C000014139Member2023-04-300000826686ssga:SSGAIndexMSCIACWIexUSAIndex12341BroadBasedIndexMember2023-04-300000826686ssga:SSGAIndexMSCIEAFENetDividendIndex12341AdditionalIndexMember2023-04-300000826686ssga:C000014139Member2023-05-310000826686ssga:SSGAIndexMSCIACWIexUSAIndex12341BroadBasedIndexMember2023-05-310000826686ssga:SSGAIndexMSCIEAFENetDividendIndex12341AdditionalIndexMember2023-05-310000826686ssga:C000014139Member2023-06-300000826686ssga:SSGAIndexMSCIACWIexUSAIndex12341BroadBasedIndexMember2023-06-300000826686ssga:SSGAIndexMSCIEAFENetDividendIndex12341AdditionalIndexMember2023-06-300000826686ssga:C000014139Member2023-07-310000826686ssga:SSGAIndexMSCIACWIexUSAIndex12341BroadBasedIndexMember2023-07-310000826686ssga:SSGAIndexMSCIEAFENetDividendIndex12341AdditionalIndexMember2023-07-310000826686ssga:C000014139Member2023-08-310000826686ssga:SSGAIndexMSCIACWIexUSAIndex12341BroadBasedIndexMember2023-08-310000826686ssga:SSGAIndexMSCIEAFENetDividendIndex12341AdditionalIndexMember2023-08-310000826686ssga:C000014139Member2023-09-300000826686ssga:SSGAIndexMSCIACWIexUSAIndex12341BroadBasedIndexMember2023-09-300000826686ssga:SSGAIndexMSCIEAFENetDividendIndex12341AdditionalIndexMember2023-09-300000826686ssga:C000014139Member2023-10-310000826686ssga:SSGAIndexMSCIACWIexUSAIndex12341BroadBasedIndexMember2023-10-310000826686ssga:SSGAIndexMSCIEAFENetDividendIndex12341AdditionalIndexMember2023-10-310000826686ssga:C000014139Member2023-11-300000826686ssga:SSGAIndexMSCIACWIexUSAIndex12341BroadBasedIndexMember2023-11-300000826686ssga:SSGAIndexMSCIEAFENetDividendIndex12341AdditionalIndexMember2023-11-300000826686ssga:C000014139Member2023-12-310000826686ssga:SSGAIndexMSCIACWIexUSAIndex12341BroadBasedIndexMember2023-12-310000826686ssga:SSGAIndexMSCIEAFENetDividendIndex12341AdditionalIndexMember2023-12-310000826686ssga:C000014139Member2024-01-310000826686ssga:SSGAIndexMSCIACWIexUSAIndex12341BroadBasedIndexMember2024-01-310000826686ssga:SSGAIndexMSCIEAFENetDividendIndex12341AdditionalIndexMember2024-01-310000826686ssga:C000014139Member2024-02-290000826686ssga:SSGAIndexMSCIACWIexUSAIndex12341BroadBasedIndexMember2024-02-290000826686ssga:SSGAIndexMSCIEAFENetDividendIndex12341AdditionalIndexMember2024-02-290000826686ssga:C000014139Member2024-03-310000826686ssga:SSGAIndexMSCIACWIexUSAIndex12341BroadBasedIndexMember2024-03-310000826686ssga:SSGAIndexMSCIEAFENetDividendIndex12341AdditionalIndexMember2024-03-310000826686ssga:C000014139Member2024-04-300000826686ssga:SSGAIndexMSCIACWIexUSAIndex12341BroadBasedIndexMember2024-04-300000826686ssga:SSGAIndexMSCIEAFENetDividendIndex12341AdditionalIndexMember2024-04-300000826686ssga:C000014139Member2024-05-310000826686ssga:SSGAIndexMSCIACWIexUSAIndex12341BroadBasedIndexMember2024-05-310000826686ssga:SSGAIndexMSCIEAFENetDividendIndex12341AdditionalIndexMember2024-05-310000826686ssga:C000014139Member2024-06-300000826686ssga:SSGAIndexMSCIACWIexUSAIndex12341BroadBasedIndexMember2024-06-300000826686ssga:SSGAIndexMSCIEAFENetDividendIndex12341AdditionalIndexMember2024-06-300000826686ssga:C000014139Member2024-07-310000826686ssga:SSGAIndexMSCIACWIexUSAIndex12341BroadBasedIndexMember2024-07-310000826686ssga:SSGAIndexMSCIEAFENetDividendIndex12341AdditionalIndexMember2024-07-310000826686ssga:C000014139Member2024-08-310000826686ssga:SSGAIndexMSCIACWIexUSAIndex12341BroadBasedIndexMember2024-08-310000826686ssga:SSGAIndexMSCIEAFENetDividendIndex12341AdditionalIndexMember2024-08-310000826686ssga:C000014139Member2024-09-300000826686ssga:SSGAIndexMSCIACWIexUSAIndex12341BroadBasedIndexMember2024-09-300000826686ssga:SSGAIndexMSCIEAFENetDividendIndex12341AdditionalIndexMember2024-09-300000826686ssga:C000014139Member2024-10-310000826686ssga:SSGAIndexMSCIACWIexUSAIndex12341BroadBasedIndexMember2024-10-310000826686ssga:SSGAIndexMSCIEAFENetDividendIndex12341AdditionalIndexMember2024-10-310000826686ssga:C000014139Member2024-11-300000826686ssga:SSGAIndexMSCIACWIexUSAIndex12341BroadBasedIndexMember2024-11-300000826686ssga:SSGAIndexMSCIEAFENetDividendIndex12341AdditionalIndexMember2024-11-300000826686ssga:C000014139Member2024-12-310000826686ssga:SSGAIndexMSCIACWIexUSAIndex12341BroadBasedIndexMember2024-12-310000826686ssga:SSGAIndexMSCIEAFENetDividendIndex12341AdditionalIndexMember2024-12-310000826686ssga:C000014139Member2025-01-310000826686ssga:SSGAIndexMSCIACWIexUSAIndex12341BroadBasedIndexMember2025-01-310000826686ssga:SSGAIndexMSCIEAFENetDividendIndex12341AdditionalIndexMember2025-01-310000826686ssga:C000014139Member2025-02-280000826686ssga:SSGAIndexMSCIACWIexUSAIndex12341BroadBasedIndexMember2025-02-280000826686ssga:SSGAIndexMSCIEAFENetDividendIndex12341AdditionalIndexMember2025-02-280000826686ssga:C000014139Member2025-03-310000826686ssga:SSGAIndexMSCIACWIexUSAIndex12341BroadBasedIndexMember2025-03-310000826686ssga:SSGAIndexMSCIEAFENetDividendIndex12341AdditionalIndexMember2025-03-310000826686ssga:C000014139Member2025-04-300000826686ssga:SSGAIndexMSCIACWIexUSAIndex12341BroadBasedIndexMember2025-04-300000826686ssga:SSGAIndexMSCIEAFENetDividendIndex12341AdditionalIndexMember2025-04-300000826686ssga:C000014139Member2025-05-310000826686ssga:SSGAIndexMSCIACWIexUSAIndex12341BroadBasedIndexMember2025-05-310000826686ssga:SSGAIndexMSCIEAFENetDividendIndex12341AdditionalIndexMember2025-05-310000826686ssga:C000014139Member2025-06-300000826686ssga:SSGAIndexMSCIACWIexUSAIndex12341BroadBasedIndexMember2025-06-300000826686ssga:SSGAIndexMSCIEAFENetDividendIndex12341AdditionalIndexMember2025-06-300000826686ssga:C000014139Member2025-07-310000826686ssga:SSGAIndexMSCIACWIexUSAIndex12341BroadBasedIndexMember2025-07-310000826686ssga:SSGAIndexMSCIEAFENetDividendIndex12341AdditionalIndexMember2025-07-310000826686ssga:C000014139Member2025-08-310000826686ssga:SSGAIndexMSCIACWIexUSAIndex12341BroadBasedIndexMember2025-08-310000826686ssga:SSGAIndexMSCIEAFENetDividendIndex12341AdditionalIndexMember2025-08-310000826686ssga:C000014139Memberoef:WithoutSalesLoadMember2024-09-012025-08-310000826686ssga:C000014139Memberoef:WithoutSalesLoadMember2020-09-012025-08-310000826686ssga:C000014139Memberoef:WithoutSalesLoadMember2015-09-012025-08-310000826686ssga:SSGAIndexMSCIACWIexUSAIndex12341BroadBasedIndexMember2020-09-012025-08-310000826686ssga:SSGAIndexMSCIACWIexUSAIndex12341BroadBasedIndexMember2015-09-012025-08-310000826686ssga:SSGAIndexMSCIEAFENetDividendIndex12341AdditionalIndexMember2020-09-012025-08-310000826686ssga:SSGAIndexMSCIEAFENetDividendIndex12341AdditionalIndexMember2015-09-012025-08-310000826686ssga:C000014139Memberssga:JapanCTIMember2025-08-310000826686ssga:C000014139Memberssga:UnitedKingdomCTIMember2025-08-310000826686ssga:C000014139Memberssga:GermanyCTIMember2025-08-310000826686ssga:C000014139Memberssga:FranceCTIMember2025-08-310000826686ssga:C000014139Memberssga:AustraliaCTIMember2025-08-310000826686ssga:C000014139Memberssga:UnitedStatesCTIMember2025-08-310000826686ssga:C000014139Memberssga:ItalyCTIMember2025-08-310000826686ssga:C000014139Memberssga:SpainCTIMember2025-08-310000826686ssga:C000014139Memberssga:NetherlandsCTIMember2025-08-310000826686ssga:C000014139Memberssga:IsraelCTIMember2025-08-310000826686ssga:C000014139Memberssga:NovartisAGFR710306903CTIMember2025-08-310000826686ssga:C000014139Memberssga:RocheHoldingAGFR711038901CTIMember2025-08-310000826686ssga:C000014139Memberssga:DeutscheTelekomAGFR584235907CTIMember2025-08-310000826686ssga:C000014139Memberssga:BritishAmericanTobaccoPLCFR028758902CTIMember2025-08-310000826686ssga:C000014139Memberssga:IntesaSanpaoloSpAFR407683002CTIMember2025-08-310000826686ssga:C000014139Memberssga:DeutscheBankAGFR575035902CTIMember2025-08-310000826686ssga:C000014139Memberssga:BarclaysPLCFR313486904CTIMember2025-08-310000826686ssga:C000014139Memberssga:LloydsBankingGroupPLCFR087061008CTIMember2025-08-310000826686ssga:C000014139Memberssga:NordeaBankAbpFRBFM0SV904CTIMember2025-08-310000826686ssga:C000014139Memberssga:BankLeumiLeMinusIsraelBMFR607642907CTIMember2025-08-310000826686ssga:C000014159Member2024-09-012025-08-310000826686ssga:SPDRETFsIndexSP500Index12323BroadBasedIndexMember2024-09-012025-08-310000826686ssga:C000014159Member2015-08-310000826686ssga:SPDRETFsIndexSP500Index12323BroadBasedIndexMember2015-08-310000826686ssga:C000014159Member2015-09-300000826686ssga:SPDRETFsIndexSP500Index12323BroadBasedIndexMember2015-09-300000826686ssga:C000014159Member2015-10-310000826686ssga:SPDRETFsIndexSP500Index12323BroadBasedIndexMember2015-10-310000826686ssga:C000014159Member2015-11-300000826686ssga:SPDRETFsIndexSP500Index12323BroadBasedIndexMember2015-11-300000826686ssga:C000014159Member2015-12-310000826686ssga:SPDRETFsIndexSP500Index12323BroadBasedIndexMember2015-12-310000826686ssga:C000014159Member2016-01-310000826686ssga:SPDRETFsIndexSP500Index12323BroadBasedIndexMember2016-01-310000826686ssga:C000014159Member2016-02-290000826686ssga:SPDRETFsIndexSP500Index12323BroadBasedIndexMember2016-02-290000826686ssga:C000014159Member2016-03-310000826686ssga:SPDRETFsIndexSP500Index12323BroadBasedIndexMember2016-03-310000826686ssga:C000014159Member2016-04-300000826686ssga:SPDRETFsIndexSP500Index12323BroadBasedIndexMember2016-04-300000826686ssga:C000014159Member2016-05-310000826686ssga:SPDRETFsIndexSP500Index12323BroadBasedIndexMember2016-05-310000826686ssga:C000014159Member2016-06-300000826686ssga:SPDRETFsIndexSP500Index12323BroadBasedIndexMember2016-06-300000826686ssga:C000014159Member2016-07-310000826686ssga:SPDRETFsIndexSP500Index12323BroadBasedIndexMember2016-07-310000826686ssga:C000014159Member2016-08-310000826686ssga:SPDRETFsIndexSP500Index12323BroadBasedIndexMember2016-08-310000826686ssga:C000014159Member2016-09-300000826686ssga:SPDRETFsIndexSP500Index12323BroadBasedIndexMember2016-09-300000826686ssga:C000014159Member2016-10-310000826686ssga:SPDRETFsIndexSP500Index12323BroadBasedIndexMember2016-10-310000826686ssga:C000014159Member2016-11-300000826686ssga:SPDRETFsIndexSP500Index12323BroadBasedIndexMember2016-11-300000826686ssga:C000014159Member2016-12-310000826686ssga:SPDRETFsIndexSP500Index12323BroadBasedIndexMember2016-12-310000826686ssga:C000014159Member2017-01-310000826686ssga:SPDRETFsIndexSP500Index12323BroadBasedIndexMember2017-01-310000826686ssga:C000014159Member2017-02-280000826686ssga:SPDRETFsIndexSP500Index12323BroadBasedIndexMember2017-02-280000826686ssga:C000014159Member2017-03-310000826686ssga:SPDRETFsIndexSP500Index12323BroadBasedIndexMember2017-03-310000826686ssga:C000014159Member2017-04-300000826686ssga:SPDRETFsIndexSP500Index12323BroadBasedIndexMember2017-04-300000826686ssga:C000014159Member2017-05-310000826686ssga:SPDRETFsIndexSP500Index12323BroadBasedIndexMember2017-05-310000826686ssga:C000014159Member2017-06-300000826686ssga:SPDRETFsIndexSP500Index12323BroadBasedIndexMember2017-06-300000826686ssga:C000014159Member2017-07-310000826686ssga:SPDRETFsIndexSP500Index12323BroadBasedIndexMember2017-07-310000826686ssga:C000014159Member2017-08-310000826686ssga:SPDRETFsIndexSP500Index12323BroadBasedIndexMember2017-08-310000826686ssga:C000014159Member2017-09-300000826686ssga:SPDRETFsIndexSP500Index12323BroadBasedIndexMember2017-09-300000826686ssga:C000014159Member2017-10-310000826686ssga:SPDRETFsIndexSP500Index12323BroadBasedIndexMember2017-10-310000826686ssga:C000014159Member2017-11-300000826686ssga:SPDRETFsIndexSP500Index12323BroadBasedIndexMember2017-11-300000826686ssga:C000014159Member2017-12-310000826686ssga:SPDRETFsIndexSP500Index12323BroadBasedIndexMember2017-12-310000826686ssga:C000014159Member2018-01-310000826686ssga:SPDRETFsIndexSP500Index12323BroadBasedIndexMember2018-01-310000826686ssga:C000014159Member2018-02-280000826686ssga:SPDRETFsIndexSP500Index12323BroadBasedIndexMember2018-02-280000826686ssga:C000014159Member2018-03-310000826686ssga:SPDRETFsIndexSP500Index12323BroadBasedIndexMember2018-03-310000826686ssga:C000014159Member2018-04-300000826686ssga:SPDRETFsIndexSP500Index12323BroadBasedIndexMember2018-04-300000826686ssga:C000014159Member2018-05-310000826686ssga:SPDRETFsIndexSP500Index12323BroadBasedIndexMember2018-05-310000826686ssga:C000014159Member2018-06-300000826686ssga:SPDRETFsIndexSP500Index12323BroadBasedIndexMember2018-06-300000826686ssga:C000014159Member2018-07-310000826686ssga:SPDRETFsIndexSP500Index12323BroadBasedIndexMember2018-07-310000826686ssga:C000014159Member2018-08-310000826686ssga:SPDRETFsIndexSP500Index12323BroadBasedIndexMember2018-08-310000826686ssga:C000014159Member2018-09-300000826686ssga:SPDRETFsIndexSP500Index12323BroadBasedIndexMember2018-09-300000826686ssga:C000014159Member2018-10-310000826686ssga:SPDRETFsIndexSP500Index12323BroadBasedIndexMember2018-10-310000826686ssga:C000014159Member2018-11-300000826686ssga:SPDRETFsIndexSP500Index12323BroadBasedIndexMember2018-11-300000826686ssga:C000014159Member2018-12-310000826686ssga:SPDRETFsIndexSP500Index12323BroadBasedIndexMember2018-12-310000826686ssga:C000014159Member2019-01-310000826686ssga:SPDRETFsIndexSP500Index12323BroadBasedIndexMember2019-01-310000826686ssga:C000014159Member2019-02-280000826686ssga:SPDRETFsIndexSP500Index12323BroadBasedIndexMember2019-02-280000826686ssga:C000014159Member2019-03-310000826686ssga:SPDRETFsIndexSP500Index12323BroadBasedIndexMember2019-03-310000826686ssga:C000014159Member2019-04-300000826686ssga:SPDRETFsIndexSP500Index12323BroadBasedIndexMember2019-04-300000826686ssga:C000014159Member2019-05-310000826686ssga:SPDRETFsIndexSP500Index12323BroadBasedIndexMember2019-05-310000826686ssga:C000014159Member2019-06-300000826686ssga:SPDRETFsIndexSP500Index12323BroadBasedIndexMember2019-06-300000826686ssga:C000014159Member2019-07-310000826686ssga:SPDRETFsIndexSP500Index12323BroadBasedIndexMember2019-07-310000826686ssga:C000014159Member2019-08-310000826686ssga:SPDRETFsIndexSP500Index12323BroadBasedIndexMember2019-08-310000826686ssga:C000014159Member2019-09-300000826686ssga:SPDRETFsIndexSP500Index12323BroadBasedIndexMember2019-09-300000826686ssga:C000014159Member2019-10-310000826686ssga:SPDRETFsIndexSP500Index12323BroadBasedIndexMember2019-10-310000826686ssga:C000014159Member2019-11-300000826686ssga:SPDRETFsIndexSP500Index12323BroadBasedIndexMember2019-11-300000826686ssga:C000014159Member2019-12-310000826686ssga:SPDRETFsIndexSP500Index12323BroadBasedIndexMember2019-12-310000826686ssga:C000014159Member2020-01-310000826686ssga:SPDRETFsIndexSP500Index12323BroadBasedIndexMember2020-01-310000826686ssga:C000014159Member2020-02-290000826686ssga:SPDRETFsIndexSP500Index12323BroadBasedIndexMember2020-02-290000826686ssga:C000014159Member2020-03-310000826686ssga:SPDRETFsIndexSP500Index12323BroadBasedIndexMember2020-03-310000826686ssga:C000014159Member2020-04-300000826686ssga:SPDRETFsIndexSP500Index12323BroadBasedIndexMember2020-04-300000826686ssga:C000014159Member2020-05-310000826686ssga:SPDRETFsIndexSP500Index12323BroadBasedIndexMember2020-05-310000826686ssga:C000014159Member2020-06-300000826686ssga:SPDRETFsIndexSP500Index12323BroadBasedIndexMember2020-06-300000826686ssga:C000014159Member2020-07-310000826686ssga:SPDRETFsIndexSP500Index12323BroadBasedIndexMember2020-07-310000826686ssga:C000014159Member2020-08-310000826686ssga:SPDRETFsIndexSP500Index12323BroadBasedIndexMember2020-08-310000826686ssga:C000014159Member2020-09-300000826686ssga:SPDRETFsIndexSP500Index12323BroadBasedIndexMember2020-09-300000826686ssga:C000014159Member2020-10-310000826686ssga:SPDRETFsIndexSP500Index12323BroadBasedIndexMember2020-10-310000826686ssga:C000014159Member2020-11-300000826686ssga:SPDRETFsIndexSP500Index12323BroadBasedIndexMember2020-11-300000826686ssga:C000014159Member2020-12-310000826686ssga:SPDRETFsIndexSP500Index12323BroadBasedIndexMember2020-12-310000826686ssga:C000014159Member2021-01-310000826686ssga:SPDRETFsIndexSP500Index12323BroadBasedIndexMember2021-01-310000826686ssga:C000014159Member2021-02-280000826686ssga:SPDRETFsIndexSP500Index12323BroadBasedIndexMember2021-02-280000826686ssga:C000014159Member2021-03-310000826686ssga:SPDRETFsIndexSP500Index12323BroadBasedIndexMember2021-03-310000826686ssga:C000014159Member2021-04-300000826686ssga:SPDRETFsIndexSP500Index12323BroadBasedIndexMember2021-04-300000826686ssga:C000014159Member2021-05-310000826686ssga:SPDRETFsIndexSP500Index12323BroadBasedIndexMember2021-05-310000826686ssga:C000014159Member2021-06-300000826686ssga:SPDRETFsIndexSP500Index12323BroadBasedIndexMember2021-06-300000826686ssga:C000014159Member2021-07-310000826686ssga:SPDRETFsIndexSP500Index12323BroadBasedIndexMember2021-07-310000826686ssga:C000014159Member2021-08-310000826686ssga:SPDRETFsIndexSP500Index12323BroadBasedIndexMember2021-08-310000826686ssga:C000014159Member2021-09-300000826686ssga:SPDRETFsIndexSP500Index12323BroadBasedIndexMember2021-09-300000826686ssga:C000014159Member2021-10-310000826686ssga:SPDRETFsIndexSP500Index12323BroadBasedIndexMember2021-10-310000826686ssga:C000014159Member2021-11-300000826686ssga:SPDRETFsIndexSP500Index12323BroadBasedIndexMember2021-11-300000826686ssga:C000014159Member2021-12-310000826686ssga:SPDRETFsIndexSP500Index12323BroadBasedIndexMember2021-12-310000826686ssga:C000014159Member2022-01-310000826686ssga:SPDRETFsIndexSP500Index12323BroadBasedIndexMember2022-01-310000826686ssga:C000014159Member2022-02-280000826686ssga:SPDRETFsIndexSP500Index12323BroadBasedIndexMember2022-02-280000826686ssga:C000014159Member2022-03-310000826686ssga:SPDRETFsIndexSP500Index12323BroadBasedIndexMember2022-03-310000826686ssga:C000014159Member2022-04-300000826686ssga:SPDRETFsIndexSP500Index12323BroadBasedIndexMember2022-04-300000826686ssga:C000014159Member2022-05-310000826686ssga:SPDRETFsIndexSP500Index12323BroadBasedIndexMember2022-05-310000826686ssga:C000014159Member2022-06-300000826686ssga:SPDRETFsIndexSP500Index12323BroadBasedIndexMember2022-06-300000826686ssga:C000014159Member2022-07-310000826686ssga:SPDRETFsIndexSP500Index12323BroadBasedIndexMember2022-07-310000826686ssga:C000014159Member2022-08-310000826686ssga:SPDRETFsIndexSP500Index12323BroadBasedIndexMember2022-08-310000826686ssga:C000014159Member2022-09-300000826686ssga:SPDRETFsIndexSP500Index12323BroadBasedIndexMember2022-09-300000826686ssga:C000014159Member2022-10-310000826686ssga:SPDRETFsIndexSP500Index12323BroadBasedIndexMember2022-10-310000826686ssga:C000014159Member2022-11-300000826686ssga:SPDRETFsIndexSP500Index12323BroadBasedIndexMember2022-11-300000826686ssga:C000014159Member2022-12-310000826686ssga:SPDRETFsIndexSP500Index12323BroadBasedIndexMember2022-12-310000826686ssga:C000014159Member2023-01-310000826686ssga:SPDRETFsIndexSP500Index12323BroadBasedIndexMember2023-01-310000826686ssga:C000014159Member2023-02-280000826686ssga:SPDRETFsIndexSP500Index12323BroadBasedIndexMember2023-02-280000826686ssga:C000014159Member2023-03-310000826686ssga:SPDRETFsIndexSP500Index12323BroadBasedIndexMember2023-03-310000826686ssga:C000014159Member2023-04-300000826686ssga:SPDRETFsIndexSP500Index12323BroadBasedIndexMember2023-04-300000826686ssga:C000014159Member2023-05-310000826686ssga:SPDRETFsIndexSP500Index12323BroadBasedIndexMember2023-05-310000826686ssga:C000014159Member2023-06-300000826686ssga:SPDRETFsIndexSP500Index12323BroadBasedIndexMember2023-06-300000826686ssga:C000014159Member2023-07-310000826686ssga:SPDRETFsIndexSP500Index12323BroadBasedIndexMember2023-07-310000826686ssga:C000014159Member2023-08-310000826686ssga:SPDRETFsIndexSP500Index12323BroadBasedIndexMember2023-08-310000826686ssga:C000014159Member2023-09-300000826686ssga:SPDRETFsIndexSP500Index12323BroadBasedIndexMember2023-09-300000826686ssga:C000014159Member2023-10-310000826686ssga:SPDRETFsIndexSP500Index12323BroadBasedIndexMember2023-10-310000826686ssga:C000014159Member2023-11-300000826686ssga:SPDRETFsIndexSP500Index12323BroadBasedIndexMember2023-11-300000826686ssga:C000014159Member2023-12-310000826686ssga:SPDRETFsIndexSP500Index12323BroadBasedIndexMember2023-12-310000826686ssga:C000014159Member2024-01-310000826686ssga:SPDRETFsIndexSP500Index12323BroadBasedIndexMember2024-01-310000826686ssga:C000014159Member2024-02-290000826686ssga:SPDRETFsIndexSP500Index12323BroadBasedIndexMember2024-02-290000826686ssga:C000014159Member2024-03-310000826686ssga:SPDRETFsIndexSP500Index12323BroadBasedIndexMember2024-03-310000826686ssga:C000014159Member2024-04-300000826686ssga:SPDRETFsIndexSP500Index12323BroadBasedIndexMember2024-04-300000826686ssga:C000014159Member2024-05-310000826686ssga:SPDRETFsIndexSP500Index12323BroadBasedIndexMember2024-05-310000826686ssga:C000014159Member2024-06-300000826686ssga:SPDRETFsIndexSP500Index12323BroadBasedIndexMember2024-06-300000826686ssga:C000014159Member2024-07-310000826686ssga:SPDRETFsIndexSP500Index12323BroadBasedIndexMember2024-07-310000826686ssga:C000014159Member2024-08-310000826686ssga:SPDRETFsIndexSP500Index12323BroadBasedIndexMember2024-08-310000826686ssga:C000014159Member2024-09-300000826686ssga:SPDRETFsIndexSP500Index12323BroadBasedIndexMember2024-09-300000826686ssga:C000014159Member2024-10-310000826686ssga:SPDRETFsIndexSP500Index12323BroadBasedIndexMember2024-10-310000826686ssga:C000014159Member2024-11-300000826686ssga:SPDRETFsIndexSP500Index12323BroadBasedIndexMember2024-11-300000826686ssga:C000014159Member2024-12-310000826686ssga:SPDRETFsIndexSP500Index12323BroadBasedIndexMember2024-12-310000826686ssga:C000014159Member2025-01-310000826686ssga:SPDRETFsIndexSP500Index12323BroadBasedIndexMember2025-01-310000826686ssga:C000014159Member2025-02-280000826686ssga:SPDRETFsIndexSP500Index12323BroadBasedIndexMember2025-02-280000826686ssga:C000014159Member2025-03-310000826686ssga:SPDRETFsIndexSP500Index12323BroadBasedIndexMember2025-03-310000826686ssga:C000014159Member2025-04-300000826686ssga:SPDRETFsIndexSP500Index12323BroadBasedIndexMember2025-04-300000826686ssga:C000014159Member2025-05-310000826686ssga:SPDRETFsIndexSP500Index12323BroadBasedIndexMember2025-05-310000826686ssga:C000014159Member2025-06-300000826686ssga:SPDRETFsIndexSP500Index12323BroadBasedIndexMember2025-06-300000826686ssga:C000014159Member2025-07-310000826686ssga:SPDRETFsIndexSP500Index12323BroadBasedIndexMember2025-07-310000826686ssga:C000014159Member2025-08-310000826686ssga:SPDRETFsIndexSP500Index12323BroadBasedIndexMember2025-08-310000826686ssga:C000014159Memberoef:WithoutSalesLoadMember2024-09-012025-08-310000826686ssga:C000014159Memberoef:WithoutSalesLoadMember2020-09-012025-08-310000826686ssga:C000014159Memberoef:WithoutSalesLoadMember2015-09-012025-08-310000826686ssga:SPDRETFsIndexSP500Index12323BroadBasedIndexMember2020-09-012025-08-310000826686ssga:SPDRETFsIndexSP500Index12323BroadBasedIndexMember2015-09-012025-08-310000826686ssga:C000014159Memberssga:SectorInformationTechnologySectorMember2025-08-310000826686ssga:C000014159Memberssga:SectorFinancialsSectorMember2025-08-310000826686ssga:C000014159Memberssga:SectorConsumerDiscretionarySectorMember2025-08-310000826686ssga:C000014159Memberssga:SectorCommunicationServicesSectorMember2025-08-310000826686ssga:C000014159Memberssga:SectorHealthCareSectorMember2025-08-310000826686ssga:C000014159Memberssga:SectorIndustrialsSectorMember2025-08-310000826686ssga:C000014159Memberssga:SectorConsumerStaplesSectorMember2025-08-310000826686ssga:C000014159Memberssga:SectorEnergySectorMember2025-08-310000826686ssga:C000014159Memberssga:SectorUtilitiesSectorMember2025-08-310000826686ssga:C000014159Memberssga:SectorRealEstateSectorMember2025-08-310000826686ssga:C000014159Memberssga:NVIDIACorpFR67066G104CTIMember2025-08-310000826686ssga:C000014159Memberssga:MicrosoftCorpFR594918104CTIMember2025-08-310000826686ssga:C000014159Memberssga:AppleIncFR037833100CTIMember2025-08-310000826686ssga:C000014159Memberssga:AmazoncomIncFR023135106CTIMember2025-08-310000826686ssga:C000014159Memberssga:MetaPlatformsIncFR30303M102CTIMember2025-08-310000826686ssga:C000014159Memberssga:BroadcomIncFR11135F101CTIMember2025-08-310000826686ssga:C000014159Memberssga:AlphabetIncFR02079K305CTIMember2025-08-310000826686ssga:C000014159Memberssga:AlphabetIncFR02079K107CTIMember2025-08-310000826686ssga:C000014159Memberssga:TeslaIncFR88160R101CTIMember2025-08-310000826686ssga:C000014159Memberssga:BerkshireHathawayIncFR084670702CTIMember2025-08-31iso4217:USDxbrli:sharesiso4217:USDxbrli:sharesxbrli:pureutr:Dssga:Holding
UNITED STATES
SECURITIES AND EXCHANGE COMMISSION
Washington, D.C. 20549
FORM N-CSR
CERTIFIED SHAREHOLDER REPORT OF REGISTERED
MANAGEMENT INVESTMENT COMPANIES
Investment Company Act file number: 811-05430
SSGA FUNDS
(Exact name of registrant as specified in charter)
One Congress Street, Boston, Massachusetts 02114
(Address of principal executive offices) (Zip code)
|
|
|
| (Name and Address of Agent for Service) |
|
Copy to: |
|
|
| Andrew J. DeLorme, Esq. Chief Legal Officer c/o SSGA Funds Management, Inc. One Congress Street Boston, Massachusetts 02114 |
|
Adam M. Schlichtmann, Esq. Ropes & Gray LLP Prudential Tower 800 Boylston Street Boston, Massachusetts 02199-3600 |
Registrant’s telephone number, including area code: (617) 664-3920
Date of fiscal year end: August 31
Date of reporting period: August 31, 2025
Item 1. Reports to Shareholders.
(a) The Reports to Shareholders are attached herewith.
State Street International Stock Selection Fund
Annual Shareholder Report
August 31, 2025
This annual shareholder report contains important information about the State Street International Stock Selection Fund (the "Fund") for the period of September 1, 2024 through August 31, 2025. You can find additional information about the Fund at https://www.ssga.com/us/en/institutional/fund-finder?type=mf . You can also request this information about the Fund by contacting us at 1-800-647-7327.
What were the Fund costs for the last year? (based on a hypothetical $10,000 Investment)
Class Name |
Costs of a $10,000 investment |
Costs paid as a percentage of a $10,000 investment |
Class A |
$131 |
1.18% |
How did the Fund perform last year and what affected its performance?
Value and Sentiment-based factors were the primary drivers of Fund performance during the reporting period relative to the Index. Value yielded positive returns, mainly in Europe, as lower-valued firms outpaced pricier ones. Sentiment delivered gains in all regions with market-favored companies outperforming peers. Stock selection in each of the Financials, Materials and Consumer Staples sectors was the largest positive contribution to Fund performance, while stock selection in Communication Services and Utilities sectors was the largest negative contribution to excess return relative to the Index. At the regional level, stock selection added value mostly in Europe and Asia Pacific ex Japan.
The Fund's benchmarks are unmanaged indices used as a general measure of market performance. Calculations assume dividends and capital gains.
Comparison of Change in Value of a $10,000 Investment
(Based on Net Asset Value)
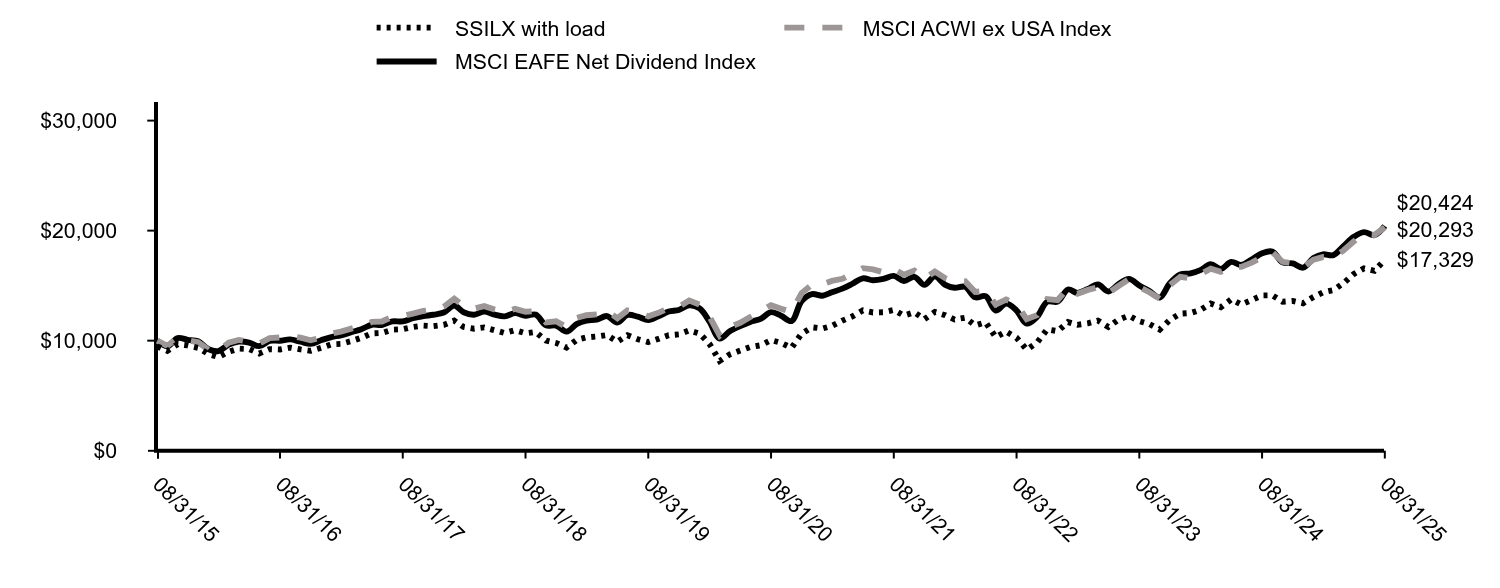
|
SSILX with load |
MSCI ACWI ex USA Index |
MSCI EAFE Net Dividend Index |
08/31/15 |
$9,475 |
$10,000 |
$10,000 |
09/30/15 |
$9,074 |
$9,536 |
$9,492 |
10/31/15 |
$9,679 |
$10,246 |
$10,234 |
11/30/15 |
$9,564 |
$10,035 |
$10,075 |
12/31/15 |
$9,348 |
$9,846 |
$9,939 |
01/31/16 |
$8,780 |
$9,176 |
$9,221 |
02/29/16 |
$8,505 |
$9,071 |
$9,052 |
03/31/16 |
$8,991 |
$9,809 |
$9,641 |
04/30/16 |
$9,275 |
$10,067 |
$9,920 |
05/31/16 |
$9,238 |
$9,897 |
$9,830 |
06/30/16 |
$8,835 |
$9,746 |
$9,500 |
07/31/16 |
$9,229 |
$10,227 |
$9,981 |
08/31/16 |
$9,201 |
$10,292 |
$9,988 |
09/30/16 |
$9,366 |
$10,419 |
$10,111 |
10/31/16 |
$9,201 |
$10,269 |
$9,904 |
11/30/16 |
$9,073 |
$10,032 |
$9,707 |
12/31/16 |
$9,348 |
$10,288 |
$10,039 |
01/31/17 |
$9,667 |
$10,653 |
$10,330 |
02/28/17 |
$9,705 |
$10,823 |
$10,478 |
03/31/17 |
$9,958 |
$11,097 |
$10,766 |
04/30/17 |
$10,258 |
$11,335 |
$11,040 |
05/31/17 |
$10,662 |
$11,702 |
$11,445 |
06/30/17 |
$10,699 |
$11,739 |
$11,425 |
07/31/17 |
$11,000 |
$12,171 |
$11,755 |
08/31/17 |
$11,037 |
$12,235 |
$11,750 |
09/30/17 |
$11,234 |
$12,462 |
$12,042 |
10/31/17 |
$11,366 |
$12,697 |
$12,225 |
11/30/17 |
$11,319 |
$12,800 |
$12,354 |
12/31/17 |
$11,436 |
$13,086 |
$12,552 |
01/31/18 |
$11,816 |
$13,815 |
$13,181 |
02/28/18 |
$11,242 |
$13,163 |
$12,586 |
03/31/18 |
$11,086 |
$12,931 |
$12,360 |
04/30/18 |
$11,203 |
$13,138 |
$12,642 |
05/31/18 |
$10,950 |
$12,834 |
$12,358 |
06/30/18 |
$10,697 |
$12,593 |
$12,207 |
07/31/18 |
$10,950 |
$12,894 |
$12,507 |
08/31/18 |
$10,668 |
$12,624 |
$12,266 |
09/30/18 |
$10,794 |
$12,682 |
$12,372 |
10/31/18 |
$10,006 |
$11,650 |
$11,387 |
11/30/18 |
$9,792 |
$11,761 |
$11,373 |
12/31/18 |
$9,378 |
$11,228 |
$10,821 |
01/31/19 |
$10,088 |
$12,077 |
$11,532 |
02/28/19 |
$10,294 |
$12,313 |
$11,826 |
03/31/19 |
$10,377 |
$12,386 |
$11,901 |
04/30/19 |
$10,510 |
$12,713 |
$12,235 |
05/31/19 |
$9,903 |
$12,031 |
$11,648 |
06/30/19 |
$10,490 |
$12,755 |
$12,339 |
07/31/19 |
$10,130 |
$12,601 |
$12,182 |
08/31/19 |
$9,872 |
$12,212 |
$11,866 |
09/30/19 |
$10,160 |
$12,526 |
$12,206 |
10/31/19 |
$10,490 |
$12,963 |
$12,645 |
11/30/19 |
$10,572 |
$13,077 |
$12,787 |
12/31/19 |
$10,926 |
$13,644 |
$13,203 |
01/31/20 |
$10,650 |
$13,277 |
$12,927 |
02/29/20 |
$9,726 |
$12,228 |
$11,759 |
03/31/20 |
$8,155 |
$10,457 |
$10,189 |
04/30/20 |
$8,749 |
$11,250 |
$10,848 |
05/31/20 |
$9,100 |
$11,618 |
$11,320 |
06/30/20 |
$9,418 |
$12,143 |
$11,705 |
07/31/20 |
$9,577 |
$12,684 |
$11,978 |
08/31/20 |
$10,045 |
$13,227 |
$12,594 |
09/30/20 |
$9,800 |
$12,902 |
$12,267 |
10/31/20 |
$9,354 |
$12,625 |
$11,777 |
11/30/20 |
$10,639 |
$14,323 |
$13,603 |
12/31/20 |
$11,212 |
$15,097 |
$14,235 |
01/31/21 |
$11,104 |
$15,130 |
$14,083 |
02/28/21 |
$11,342 |
$15,429 |
$14,399 |
03/31/21 |
$11,817 |
$15,624 |
$14,730 |
04/30/21 |
$12,206 |
$16,084 |
$15,173 |
05/31/21 |
$12,746 |
$16,587 |
$15,668 |
06/30/21 |
$12,562 |
$16,480 |
$15,492 |
07/31/21 |
$12,584 |
$16,208 |
$15,609 |
08/31/21 |
$12,789 |
$16,516 |
$15,884 |
09/30/21 |
$12,282 |
$15,988 |
$15,423 |
10/31/21 |
$12,573 |
$16,369 |
$15,802 |
11/30/21 |
$11,957 |
$15,632 |
$15,067 |
12/31/21 |
$12,605 |
$16,278 |
$15,838 |
01/31/22 |
$12,312 |
$15,678 |
$15,073 |
02/28/22 |
$11,918 |
$15,368 |
$14,806 |
03/31/22 |
$12,087 |
$15,392 |
$14,902 |
04/30/22 |
$11,389 |
$14,426 |
$13,938 |
05/31/22 |
$11,670 |
$14,529 |
$14,042 |
06/30/22 |
$10,319 |
$13,280 |
$12,739 |
07/31/22 |
$10,825 |
$13,734 |
$13,374 |
08/31/22 |
$10,262 |
$13,292 |
$12,739 |
09/30/22 |
$9,181 |
$11,964 |
$11,547 |
10/31/22 |
$9,823 |
$12,321 |
$12,168 |
11/30/22 |
$11,028 |
$13,776 |
$13,539 |
12/31/22 |
$10,864 |
$13,673 |
$13,549 |
01/31/23 |
$11,689 |
$14,782 |
$14,647 |
02/28/23 |
$11,441 |
$14,263 |
$14,341 |
03/31/23 |
$11,576 |
$14,612 |
$14,696 |
04/30/23 |
$11,825 |
$14,865 |
$15,111 |
05/31/23 |
$11,237 |
$14,325 |
$14,472 |
06/30/23 |
$11,904 |
$14,968 |
$15,130 |
07/31/23 |
$12,266 |
$15,576 |
$15,620 |
08/31/23 |
$11,769 |
$14,873 |
$15,022 |
09/30/23 |
$11,508 |
$14,403 |
$14,508 |
10/31/23 |
$11,011 |
$13,809 |
$13,920 |
11/30/23 |
$11,882 |
$15,052 |
$15,212 |
12/31/23 |
$12,458 |
$15,808 |
$16,021 |
01/31/24 |
$12,515 |
$15,651 |
$16,113 |
02/29/24 |
$12,792 |
$16,047 |
$16,408 |
03/31/24 |
$13,381 |
$16,549 |
$16,947 |
04/30/24 |
$13,035 |
$16,252 |
$16,513 |
05/31/24 |
$13,751 |
$16,723 |
$17,153 |
06/30/24 |
$13,289 |
$16,708 |
$16,876 |
07/31/24 |
$13,693 |
$17,094 |
$17,371 |
08/31/24 |
$14,109 |
$17,581 |
$17,936 |
09/30/24 |
$14,120 |
$18,055 |
$18,102 |
10/31/24 |
$13,543 |
$17,169 |
$17,117 |
11/30/24 |
$13,612 |
$17,013 |
$17,020 |
12/31/24 |
$13,400 |
$16,683 |
$16,633 |
01/31/25 |
$13,973 |
$17,355 |
$17,507 |
02/28/25 |
$14,391 |
$17,596 |
$17,847 |
03/31/25 |
$14,594 |
$17,556 |
$17,775 |
04/30/25 |
$15,215 |
$18,190 |
$18,589 |
05/31/25 |
$16,063 |
$19,023 |
$19,439 |
06/30/25 |
$16,565 |
$19,668 |
$19,868 |
07/31/25 |
$16,350 |
$19,612 |
$19,589 |
08/31/25 |
$17,329 |
$20,293 |
$20,424 |
Average Annual Total Returns (%)
Name |
1 Year |
5 Years |
10 Years |
SSILX |
22.83% |
11.52% |
6.22% |
SSILX (Adjusted for the 5.25% Maximum Sales Charge) |
16.35% |
10.34% |
5.65% |
MSCI ACWI ex USA Index |
15.42% |
8.94% |
7.33% |
MSCI EAFE Net Dividend Index |
13.87% |
10.15% |
7.40% |
The Fund’s past performance is not necessarily an indication of how the Fund will perform in the future. The returns do not reflect the deduction of taxes that a shareholder would pay on Fund distributions or on the redemption or sale of Fund shares. Updated performance information is available by calling 1-800-647-7327 or visiting our website at www.ssga.com.
Key Fund Statistics as of 8/31/2025
- Total Net Assets$180,458,345
- Number of Portfolio Holdings181
- Portfolio Turnover Rate131%
- Total Advisory Fees Paid$739,393
What did the Fund invest in as of 8/31/2025? (as a percentage of total net assets)
Countries |
% |
Japan |
22.1% |
United Kingdom |
13.9% |
Germany |
10.5% |
France |
8.1% |
Australia |
7.1% |
United States |
5.9% |
Italy |
4.8% |
Spain |
3.3% |
Netherlands |
3.1% |
Israel |
2.7% |
Holdings |
% |
Novartis AG |
2.2% |
Roche Holding AG |
2.0% |
Deutsche Telekom AG |
1.6% |
British American Tobacco PLC |
1.6% |
Intesa Sanpaolo SpA |
1.4% |
Deutsche Bank AG |
1.3% |
Barclays PLC |
1.3% |
Lloyds Banking Group PLC |
1.3% |
Nordea Bank Abp |
1.2% |
Bank Leumi Le-Israel BM |
1.2% |
Availability of Additional Information
For additional information about the Fund, including its Prospectus, Statement of Additional Information, financial statements, holdings and
proxy information please visit: https://www.ssga.com/us/en/institutional/fund-finder?type=mf .
State Street International Stock Selection Fund
Annual Shareholder Report
August 31, 2025
This annual shareholder report contains important information about the State Street International Stock Selection Fund (the "Fund") for the period of September 1, 2024 through August 31, 2025. You can find additional information about the Fund at https://www.ssga.com/us/en/institutional/fund-finder?type=mf . You can also request this information about the Fund by contacting us at 1-800-647-7327.
What were the Fund costs for the last year? (based on a hypothetical $10,000 Investment)
Class Name |
Costs of a $10,000 investment |
Costs paid as a percentage of a $10,000 investment |
Class I |
$92 |
0.82% |
How did the Fund perform last year and what affected its performance?
Value and Sentiment-based factors were the primary drivers of Fund performance during the reporting period relative to the Index. Value yielded positive returns, mainly in Europe, as lower-valued firms outpaced pricier ones. Sentiment delivered gains in all regions with market-favored companies outperforming peers. Stock selection in each of the Financials, Materials and Consumer Staples sectors was the largest positive contribution to Fund performance, while stock selection in Communication Services and Utilities sectors was the largest negative contribution to excess return relative to the Index. At the regional level, stock selection added value mostly in Europe and Asia Pacific ex Japan.
The Fund's benchmarks are unmanaged indices used as a general measure of market performance. Calculations assume dividends and capital gains.
Comparison of Change in Value of a $10,000 Investment
(Based on Net Asset Value)

|
SSIPX |
MSCI ACWI ex USA Index |
MSCI EAFE Net Dividend Index |
08/31/15 |
$10,000 |
$10,000 |
$10,000 |
09/30/15 |
$9,577 |
$9,536 |
$9,492 |
10/31/15 |
$10,216 |
$10,246 |
$10,234 |
11/30/15 |
$10,103 |
$10,035 |
$10,075 |
12/31/15 |
$9,885 |
$9,846 |
$9,939 |
01/31/16 |
$9,277 |
$9,176 |
$9,221 |
02/29/16 |
$8,997 |
$9,071 |
$9,052 |
03/31/16 |
$9,499 |
$9,809 |
$9,641 |
04/30/16 |
$9,807 |
$10,067 |
$9,920 |
05/31/16 |
$9,778 |
$9,897 |
$9,830 |
06/30/16 |
$9,344 |
$9,746 |
$9,500 |
07/31/16 |
$9,769 |
$10,227 |
$9,981 |
08/31/16 |
$9,740 |
$10,292 |
$9,988 |
09/30/16 |
$9,913 |
$10,419 |
$10,111 |
10/31/16 |
$9,750 |
$10,269 |
$9,904 |
11/30/16 |
$9,605 |
$10,032 |
$9,707 |
12/31/16 |
$9,905 |
$10,288 |
$10,039 |
01/31/17 |
$10,243 |
$10,653 |
$10,330 |
02/28/17 |
$10,292 |
$10,823 |
$10,478 |
03/31/17 |
$10,560 |
$11,097 |
$10,766 |
04/30/17 |
$10,887 |
$11,335 |
$11,040 |
05/31/17 |
$11,313 |
$11,702 |
$11,445 |
06/30/17 |
$11,353 |
$11,739 |
$11,425 |
07/31/17 |
$11,680 |
$12,171 |
$11,755 |
08/31/17 |
$11,710 |
$12,235 |
$11,750 |
09/30/17 |
$11,928 |
$12,462 |
$12,042 |
10/31/17 |
$12,067 |
$12,697 |
$12,225 |
11/30/17 |
$12,017 |
$12,800 |
$12,354 |
12/31/17 |
$12,140 |
$13,086 |
$12,552 |
01/31/18 |
$12,553 |
$13,815 |
$13,181 |
02/28/18 |
$11,955 |
$13,163 |
$12,586 |
03/31/18 |
$11,800 |
$12,931 |
$12,360 |
04/30/18 |
$11,924 |
$13,138 |
$12,642 |
05/31/18 |
$11,666 |
$12,834 |
$12,358 |
06/30/18 |
$11,409 |
$12,593 |
$12,207 |
07/31/18 |
$11,677 |
$12,894 |
$12,507 |
08/31/18 |
$11,378 |
$12,624 |
$12,266 |
09/30/18 |
$11,512 |
$12,682 |
$12,372 |
10/31/18 |
$10,677 |
$11,650 |
$11,387 |
11/30/18 |
$10,461 |
$11,761 |
$11,373 |
12/31/18 |
$10,019 |
$11,228 |
$10,821 |
01/31/19 |
$10,776 |
$12,077 |
$11,532 |
02/28/19 |
$11,006 |
$12,313 |
$11,826 |
03/31/19 |
$11,105 |
$12,386 |
$11,901 |
04/30/19 |
$11,236 |
$12,713 |
$12,235 |
05/31/19 |
$10,600 |
$12,031 |
$11,648 |
06/30/19 |
$11,225 |
$12,755 |
$12,339 |
07/31/19 |
$10,842 |
$12,601 |
$12,182 |
08/31/19 |
$10,578 |
$12,212 |
$11,866 |
09/30/19 |
$10,896 |
$12,526 |
$12,206 |
10/31/19 |
$11,247 |
$12,963 |
$12,645 |
11/30/19 |
$11,335 |
$13,077 |
$12,787 |
12/31/19 |
$11,722 |
$13,644 |
$13,203 |
01/31/20 |
$11,427 |
$13,277 |
$12,927 |
02/29/20 |
$10,429 |
$12,228 |
$11,759 |
03/31/20 |
$8,749 |
$10,457 |
$10,189 |
04/30/20 |
$9,396 |
$11,250 |
$10,848 |
05/31/20 |
$9,770 |
$11,618 |
$11,320 |
06/30/20 |
$10,111 |
$12,143 |
$11,705 |
07/31/20 |
$10,292 |
$12,684 |
$11,978 |
08/31/20 |
$10,792 |
$13,227 |
$12,594 |
09/30/20 |
$10,531 |
$12,902 |
$12,267 |
10/31/20 |
$10,066 |
$12,625 |
$11,777 |
11/30/20 |
$11,439 |
$14,323 |
$13,603 |
12/31/20 |
$12,059 |
$15,097 |
$14,235 |
01/31/21 |
$11,943 |
$15,130 |
$14,083 |
02/28/21 |
$12,221 |
$15,429 |
$14,399 |
03/31/21 |
$12,730 |
$15,624 |
$14,730 |
04/30/21 |
$13,147 |
$16,084 |
$15,173 |
05/31/21 |
$13,749 |
$16,587 |
$15,668 |
06/30/21 |
$13,540 |
$16,480 |
$15,492 |
07/31/21 |
$13,575 |
$16,208 |
$15,609 |
08/31/21 |
$13,807 |
$16,516 |
$15,884 |
09/30/21 |
$13,263 |
$15,988 |
$15,423 |
10/31/21 |
$13,575 |
$16,369 |
$15,802 |
11/30/21 |
$12,915 |
$15,632 |
$15,067 |
12/31/21 |
$13,628 |
$16,278 |
$15,838 |
01/31/22 |
$13,313 |
$15,678 |
$15,073 |
02/28/22 |
$12,888 |
$15,368 |
$14,806 |
03/31/22 |
$13,082 |
$15,392 |
$14,902 |
04/30/22 |
$12,331 |
$14,426 |
$13,938 |
05/31/22 |
$12,634 |
$14,529 |
$14,042 |
06/30/22 |
$11,179 |
$13,280 |
$12,739 |
07/31/22 |
$11,737 |
$13,734 |
$13,374 |
08/31/22 |
$11,118 |
$13,292 |
$12,739 |
09/30/22 |
$9,954 |
$11,964 |
$11,547 |
10/31/22 |
$10,645 |
$12,321 |
$12,168 |
11/30/22 |
$11,967 |
$13,776 |
$13,539 |
12/31/22 |
$11,792 |
$13,673 |
$13,549 |
01/31/23 |
$12,697 |
$14,782 |
$14,647 |
02/28/23 |
$12,584 |
$14,263 |
$14,341 |
03/31/23 |
$12,735 |
$14,612 |
$14,696 |
04/30/23 |
$13,011 |
$14,865 |
$15,111 |
05/31/23 |
$12,370 |
$14,325 |
$14,472 |
06/30/23 |
$13,112 |
$14,968 |
$15,130 |
07/31/23 |
$13,514 |
$15,576 |
$15,620 |
08/31/23 |
$13,099 |
$14,873 |
$15,022 |
09/30/23 |
$12,810 |
$14,403 |
$14,508 |
10/31/23 |
$12,269 |
$13,809 |
$13,920 |
11/30/23 |
$13,237 |
$15,052 |
$15,212 |
12/31/23 |
$13,887 |
$15,808 |
$16,021 |
01/31/24 |
$13,953 |
$15,651 |
$16,113 |
02/29/24 |
$14,273 |
$16,047 |
$16,408 |
03/31/24 |
$14,938 |
$16,549 |
$16,947 |
04/30/24 |
$14,552 |
$16,252 |
$16,513 |
05/31/24 |
$15,365 |
$16,723 |
$17,153 |
06/30/24 |
$14,845 |
$16,708 |
$16,876 |
07/31/24 |
$15,298 |
$17,094 |
$17,371 |
08/31/24 |
$15,777 |
$17,581 |
$17,936 |
09/30/24 |
$15,791 |
$18,055 |
$18,102 |
10/31/24 |
$15,138 |
$17,169 |
$17,117 |
11/30/24 |
$15,231 |
$17,013 |
$17,020 |
12/31/24 |
$14,999 |
$16,683 |
$16,633 |
01/31/25 |
$15,635 |
$17,355 |
$17,507 |
02/28/25 |
$16,105 |
$17,596 |
$17,847 |
03/31/25 |
$16,340 |
$17,556 |
$17,775 |
04/30/25 |
$17,045 |
$18,190 |
$18,589 |
05/31/25 |
$17,999 |
$19,023 |
$19,439 |
06/30/25 |
$18,580 |
$19,668 |
$19,868 |
07/31/25 |
$18,331 |
$19,612 |
$19,589 |
08/31/25 |
$19,437 |
$20,293 |
$20,424 |
Average Annual Total Returns (%)
Name |
1 Year |
5 Years |
10 Years |
SSIPX |
23.20% |
12.49% |
6.87% |
MSCI ACWI ex USA Index |
15.42% |
8.94% |
7.33% |
MSCI EAFE Net Dividend Index |
13.87% |
10.15% |
7.40% |
The Fund’s past performance is not necessarily an indication of how the Fund will perform in the future. The returns do not reflect the deduction of taxes that a shareholder would pay on Fund distributions or on the redemption or sale of Fund shares. Updated performance information is available by calling 1-800-647-7327 or visiting our website at www.ssga.com.
Key Fund Statistics as of 8/31/2025
- Total Net Assets$180,458,345
- Number of Portfolio Holdings181
- Portfolio Turnover Rate131%
- Total Advisory Fees Paid$739,393
What did the Fund invest in as of 8/31/2025? (as a percentage of total net assets)
Countries |
% |
Japan |
22.1% |
United Kingdom |
13.9% |
Germany |
10.5% |
France |
8.1% |
Australia |
7.1% |
United States |
5.9% |
Italy |
4.8% |
Spain |
3.3% |
Netherlands |
3.1% |
Israel |
2.7% |
Holdings |
% |
Novartis AG |
2.2% |
Roche Holding AG |
2.0% |
Deutsche Telekom AG |
1.6% |
British American Tobacco PLC |
1.6% |
Intesa Sanpaolo SpA |
1.4% |
Deutsche Bank AG |
1.3% |
Barclays PLC |
1.3% |
Lloyds Banking Group PLC |
1.3% |
Nordea Bank Abp |
1.2% |
Bank Leumi Le-Israel BM |
1.2% |
Availability of Additional Information
For additional information about the Fund, including its Prospectus, Statement of Additional Information, financial statements, holdings and
proxy information please visit: https://www.ssga.com/us/en/institutional/fund-finder?type=mf .
State Street International Stock Selection Fund
Annual Shareholder Report
August 31, 2025
This annual shareholder report contains important information about the State Street International Stock Selection Fund (the "Fund") for the period of September 1, 2024 through August 31, 2025. You can find additional information about the Fund at https://www.ssga.com/us/en/institutional/fund-finder?type=mf . You can also request this information about the Fund by contacting us at 1-800-647-7327.
What were the Fund costs for the last year? (based on a hypothetical $10,000 Investment)
Class Name |
Costs of a $10,000 investment |
Costs paid as a percentage of a $10,000 investment |
Class K |
$84 |
0.75% |
How did the Fund perform last year and what affected its performance?
Value and Sentiment-based factors were the primary drivers of Fund performance during the reporting period relative to the Index. Value yielded positive returns, mainly in Europe, as lower-valued firms outpaced pricier ones. Sentiment delivered gains in all regions with market-favored companies outperforming peers. Stock selection in each of the Financials, Materials and Consumer Staples sectors was the largest positive contribution to Fund performance, while stock selection in Communication Services and Utilities sectors was the largest negative contribution to excess return relative to the Index. At the regional level, stock selection added value mostly in Europe and Asia Pacific ex Japan.
The Fund's benchmarks are unmanaged indices used as a general measure of market performance. Calculations assume dividends and capital gains.
Comparison of Change in Value of a $10,000 Investment
(Based on Net Asset Value)

|
SSIQX |
MSCI ACWI ex USA Index |
MSCI EAFE Net Dividend Index |
08/31/15 |
$10,000 |
$10,000 |
$10,000 |
09/30/15 |
$9,578 |
$9,536 |
$9,492 |
10/31/15 |
$10,225 |
$10,246 |
$10,234 |
11/30/15 |
$10,112 |
$10,035 |
$10,075 |
12/31/15 |
$9,891 |
$9,846 |
$9,939 |
01/31/16 |
$9,283 |
$9,176 |
$9,221 |
02/29/16 |
$9,004 |
$9,071 |
$9,052 |
03/31/16 |
$9,505 |
$9,809 |
$9,641 |
04/30/16 |
$9,813 |
$10,067 |
$9,920 |
05/31/16 |
$9,785 |
$9,897 |
$9,830 |
06/30/16 |
$9,351 |
$9,746 |
$9,500 |
07/31/16 |
$9,775 |
$10,227 |
$9,981 |
08/31/16 |
$9,756 |
$10,292 |
$9,988 |
09/30/16 |
$9,929 |
$10,419 |
$10,111 |
10/31/16 |
$9,756 |
$10,269 |
$9,904 |
11/30/16 |
$9,621 |
$10,032 |
$9,707 |
12/31/16 |
$9,924 |
$10,288 |
$10,039 |
01/31/17 |
$10,261 |
$10,653 |
$10,330 |
02/28/17 |
$10,311 |
$10,823 |
$10,478 |
03/31/17 |
$10,579 |
$11,097 |
$10,766 |
04/30/17 |
$10,907 |
$11,335 |
$11,040 |
05/31/17 |
$11,334 |
$11,702 |
$11,445 |
06/30/17 |
$11,374 |
$11,739 |
$11,425 |
07/31/17 |
$11,702 |
$12,171 |
$11,755 |
08/31/17 |
$11,732 |
$12,235 |
$11,750 |
09/30/17 |
$11,960 |
$12,462 |
$12,042 |
10/31/17 |
$12,089 |
$12,697 |
$12,225 |
11/30/17 |
$12,040 |
$12,800 |
$12,354 |
12/31/17 |
$12,167 |
$13,086 |
$12,552 |
01/31/18 |
$12,580 |
$13,815 |
$13,181 |
02/28/18 |
$11,981 |
$13,163 |
$12,586 |
03/31/18 |
$11,826 |
$12,931 |
$12,360 |
04/30/18 |
$11,950 |
$13,138 |
$12,642 |
05/31/18 |
$11,692 |
$12,834 |
$12,358 |
06/30/18 |
$11,434 |
$12,593 |
$12,207 |
07/31/18 |
$11,692 |
$12,894 |
$12,507 |
08/31/18 |
$11,403 |
$12,624 |
$12,266 |
09/30/18 |
$11,537 |
$12,682 |
$12,372 |
10/31/18 |
$10,700 |
$11,650 |
$11,387 |
11/30/18 |
$10,483 |
$11,761 |
$11,373 |
12/31/18 |
$10,046 |
$11,228 |
$10,821 |
01/31/19 |
$10,804 |
$12,077 |
$11,532 |
02/28/19 |
$11,035 |
$12,313 |
$11,826 |
03/31/19 |
$11,134 |
$12,386 |
$11,901 |
04/30/19 |
$11,266 |
$12,713 |
$12,235 |
05/31/19 |
$10,628 |
$12,031 |
$11,648 |
06/30/19 |
$11,255 |
$12,755 |
$12,339 |
07/31/19 |
$10,870 |
$12,601 |
$12,182 |
08/31/19 |
$10,606 |
$12,212 |
$11,866 |
09/30/19 |
$10,925 |
$12,526 |
$12,206 |
10/31/19 |
$11,277 |
$12,963 |
$12,645 |
11/30/19 |
$11,364 |
$13,077 |
$12,787 |
12/31/19 |
$11,763 |
$13,644 |
$13,203 |
01/31/20 |
$11,456 |
$13,277 |
$12,927 |
02/29/20 |
$10,465 |
$12,228 |
$11,759 |
03/31/20 |
$8,780 |
$10,457 |
$10,189 |
04/30/20 |
$9,429 |
$11,250 |
$10,848 |
05/31/20 |
$9,805 |
$11,618 |
$11,320 |
06/30/20 |
$10,158 |
$12,143 |
$11,705 |
07/31/20 |
$10,340 |
$12,684 |
$11,978 |
08/31/20 |
$10,841 |
$13,227 |
$12,594 |
09/30/20 |
$10,579 |
$12,902 |
$12,267 |
10/31/20 |
$10,112 |
$12,625 |
$11,777 |
11/30/20 |
$11,490 |
$14,323 |
$13,603 |
12/31/20 |
$12,117 |
$15,097 |
$14,235 |
01/31/21 |
$12,001 |
$15,130 |
$14,083 |
02/28/21 |
$12,269 |
$15,429 |
$14,399 |
03/31/21 |
$12,792 |
$15,624 |
$14,730 |
04/30/21 |
$13,211 |
$16,084 |
$15,173 |
05/31/21 |
$13,815 |
$16,587 |
$15,668 |
06/30/21 |
$13,606 |
$16,480 |
$15,492 |
07/31/21 |
$13,641 |
$16,208 |
$15,609 |
08/31/21 |
$13,873 |
$16,516 |
$15,884 |
09/30/21 |
$13,339 |
$15,988 |
$15,423 |
10/31/21 |
$13,641 |
$16,369 |
$15,802 |
11/30/21 |
$12,978 |
$15,632 |
$15,067 |
12/31/21 |
$13,703 |
$16,278 |
$15,838 |
01/31/22 |
$13,386 |
$15,678 |
$15,073 |
02/28/22 |
$12,960 |
$15,368 |
$14,806 |
03/31/22 |
$13,142 |
$15,392 |
$14,902 |
04/30/22 |
$12,399 |
$14,426 |
$13,938 |
05/31/22 |
$12,704 |
$14,529 |
$14,042 |
06/30/22 |
$11,241 |
$13,280 |
$12,739 |
07/31/22 |
$11,801 |
$13,734 |
$13,374 |
08/31/22 |
$11,180 |
$13,292 |
$12,739 |
09/30/22 |
$10,009 |
$11,964 |
$11,547 |
10/31/22 |
$10,704 |
$12,321 |
$12,168 |
11/30/22 |
$12,033 |
$13,776 |
$13,539 |
12/31/22 |
$11,865 |
$13,673 |
$13,549 |
01/31/23 |
$12,776 |
$14,782 |
$14,647 |
02/28/23 |
$12,662 |
$14,263 |
$14,341 |
03/31/23 |
$12,814 |
$14,612 |
$14,696 |
04/30/23 |
$13,092 |
$14,865 |
$15,111 |
05/31/23 |
$12,447 |
$14,325 |
$14,472 |
06/30/23 |
$13,193 |
$14,968 |
$15,130 |
07/31/23 |
$13,598 |
$15,576 |
$15,620 |
08/31/23 |
$13,193 |
$14,873 |
$15,022 |
09/30/23 |
$12,902 |
$14,403 |
$14,508 |
10/31/23 |
$12,346 |
$13,809 |
$13,920 |
11/30/23 |
$13,332 |
$15,052 |
$15,212 |
12/31/23 |
$13,987 |
$15,808 |
$16,021 |
01/31/24 |
$14,054 |
$15,651 |
$16,113 |
02/29/24 |
$14,376 |
$16,047 |
$16,408 |
03/31/24 |
$15,047 |
$16,549 |
$16,947 |
04/30/24 |
$14,658 |
$16,252 |
$16,513 |
05/31/24 |
$15,476 |
$16,723 |
$17,153 |
06/30/24 |
$14,953 |
$16,708 |
$16,876 |
07/31/24 |
$15,422 |
$17,094 |
$17,371 |
08/31/24 |
$15,891 |
$17,581 |
$17,936 |
09/30/24 |
$15,905 |
$18,055 |
$18,102 |
10/31/24 |
$15,261 |
$17,169 |
$17,117 |
11/30/24 |
$15,342 |
$17,013 |
$17,020 |
12/31/24 |
$15,120 |
$16,683 |
$16,633 |
01/31/25 |
$15,761 |
$17,355 |
$17,507 |
02/28/25 |
$16,235 |
$17,596 |
$17,847 |
03/31/25 |
$16,486 |
$17,556 |
$17,775 |
04/30/25 |
$17,182 |
$18,190 |
$18,589 |
05/31/25 |
$18,144 |
$19,023 |
$19,439 |
06/30/25 |
$18,729 |
$19,668 |
$19,868 |
07/31/25 |
$18,492 |
$19,612 |
$19,589 |
08/31/25 |
$19,607 |
$20,293 |
$20,424 |
Average Annual Total Returns (%)
Name |
1 Year |
5 Years |
10 Years |
SSIQX |
23.38% |
12.58% |
6.96% |
MSCI ACWI ex USA Index |
15.42% |
8.94% |
7.33% |
MSCI EAFE Net Dividend Index |
13.87% |
10.15% |
7.40% |
The Fund’s past performance is not necessarily an indication of how the Fund will perform in the future. The returns do not reflect the deduction of taxes that a shareholder would pay on Fund distributions or on the redemption or sale of Fund shares. Updated performance information is available by calling 1-800-647-7327 or visiting our website at www.ssga.com.
Key Fund Statistics as of 8/31/2025
- Total Net Assets$180,458,345
- Number of Portfolio Holdings181
- Portfolio Turnover Rate131%
- Total Advisory Fees Paid$739,393
What did the Fund invest in as of 8/31/2025? (as a percentage of total net assets)
Countries |
% |
Japan |
22.1% |
United Kingdom |
13.9% |
Germany |
10.5% |
France |
8.1% |
Australia |
7.1% |
United States |
5.9% |
Italy |
4.8% |
Spain |
3.3% |
Netherlands |
3.1% |
Israel |
2.7% |
Holdings |
% |
Novartis AG |
2.2% |
Roche Holding AG |
2.0% |
Deutsche Telekom AG |
1.6% |
British American Tobacco PLC |
1.6% |
Intesa Sanpaolo SpA |
1.4% |
Deutsche Bank AG |
1.3% |
Barclays PLC |
1.3% |
Lloyds Banking Group PLC |
1.3% |
Nordea Bank Abp |
1.2% |
Bank Leumi Le-Israel BM |
1.2% |
Availability of Additional Information
For additional information about the Fund, including its Prospectus, Statement of Additional Information, financial statements, holdings and
proxy information please visit: https://www.ssga.com/us/en/institutional/fund-finder?type=mf .
State Street International Stock Selection Fund
Annual Shareholder Report
August 31, 2025
This annual shareholder report contains important information about the State Street International Stock Selection Fund (the "Fund") for the period of September 1, 2024 through August 31, 2025. You can find additional information about the Fund at https://www.ssga.com/us/en/institutional/fund-finder?type=mf . You can also request this information about the Fund by contacting us at 1-800-647-7327.
What were the Fund costs for the last year? (based on a hypothetical $10,000 Investment)
Class Name |
Costs of a $10,000 investment |
Costs paid as a percentage of a $10,000 investment |
Class N |
$112 |
1.00% |
How did the Fund perform last year and what affected its performance?
Value and Sentiment-based factors were the primary drivers of Fund performance during the reporting period relative to the Index. Value yielded positive returns, mainly in Europe, as lower-valued firms outpaced pricier ones. Sentiment delivered gains in all regions with market-favored companies outperforming peers. Stock selection in each of the Financials, Materials and Consumer Staples sectors was the largest positive contribution to Fund performance, while stock selection in Communication Services and Utilities sectors was the largest negative contribution to excess return relative to the Index. At the regional level, stock selection added value mostly in Europe and Asia Pacific ex Japan.
The Fund's benchmarks are unmanaged indices used as a general measure of market performance. Calculations assume dividends and capital gains.
Comparison of Change in Value of a $10,000 Investment
(Based on Net Asset Value)
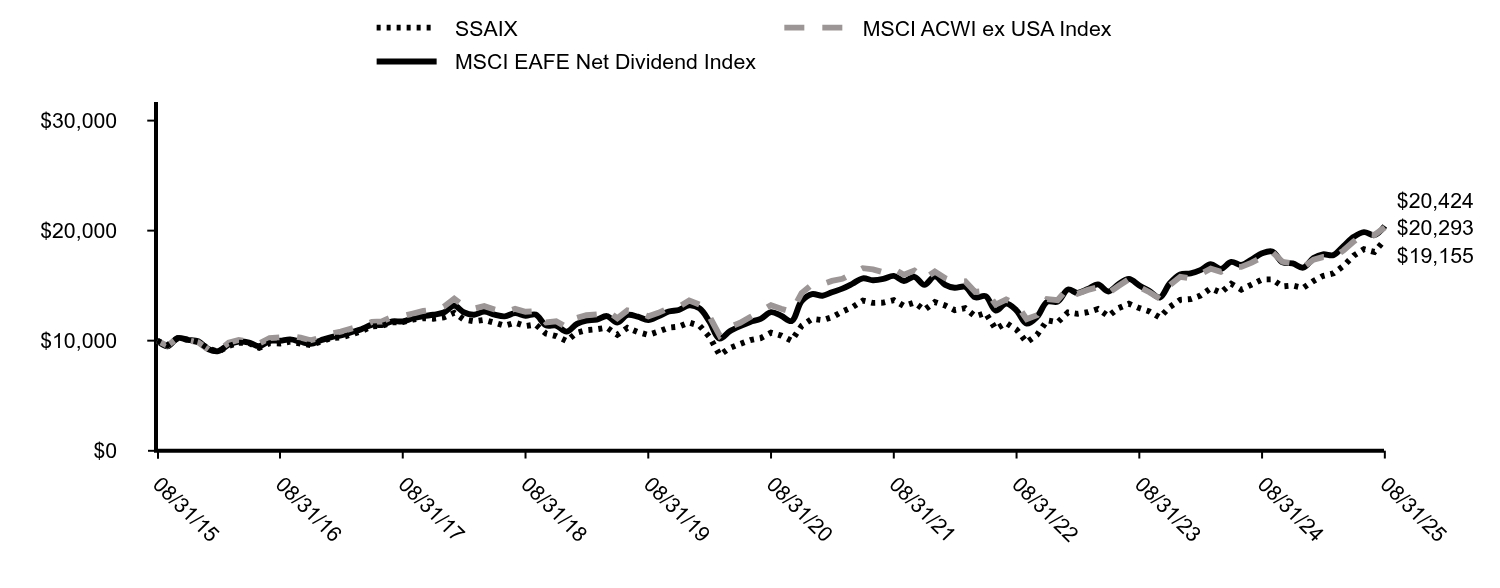
|
SSAIX |
MSCI ACWI ex USA Index |
MSCI EAFE Net Dividend Index |
08/31/15 |
$10,000 |
$10,000 |
$10,000 |
09/30/15 |
$9,577 |
$9,536 |
$9,492 |
10/31/15 |
$10,216 |
$10,246 |
$10,234 |
11/30/15 |
$10,103 |
$10,035 |
$10,075 |
12/31/15 |
$9,883 |
$9,846 |
$9,939 |
01/31/16 |
$9,277 |
$9,176 |
$9,221 |
02/29/16 |
$8,997 |
$9,071 |
$9,052 |
03/31/16 |
$9,508 |
$9,809 |
$9,641 |
04/30/16 |
$9,816 |
$10,067 |
$9,920 |
05/31/16 |
$9,777 |
$9,897 |
$9,830 |
06/30/16 |
$9,344 |
$9,746 |
$9,500 |
07/31/16 |
$9,768 |
$10,227 |
$9,981 |
08/31/16 |
$9,739 |
$10,292 |
$9,988 |
09/30/16 |
$9,912 |
$10,419 |
$10,111 |
10/31/16 |
$9,739 |
$10,269 |
$9,904 |
11/30/16 |
$9,604 |
$10,032 |
$9,707 |
12/31/16 |
$9,908 |
$10,288 |
$10,039 |
01/31/17 |
$10,245 |
$10,653 |
$10,330 |
02/28/17 |
$10,285 |
$10,823 |
$10,478 |
03/31/17 |
$10,552 |
$11,097 |
$10,766 |
04/30/17 |
$10,869 |
$11,335 |
$11,040 |
05/31/17 |
$11,294 |
$11,702 |
$11,445 |
06/30/17 |
$11,344 |
$11,739 |
$11,425 |
07/31/17 |
$11,661 |
$12,171 |
$11,755 |
08/31/17 |
$11,690 |
$12,235 |
$11,750 |
09/30/17 |
$11,908 |
$12,462 |
$12,042 |
10/31/17 |
$12,047 |
$12,697 |
$12,225 |
11/30/17 |
$11,997 |
$12,800 |
$12,354 |
12/31/17 |
$12,113 |
$13,086 |
$12,552 |
01/31/18 |
$12,524 |
$13,815 |
$13,181 |
02/28/18 |
$11,928 |
$13,163 |
$12,586 |
03/31/18 |
$11,764 |
$12,931 |
$12,360 |
04/30/18 |
$11,887 |
$13,138 |
$12,642 |
05/31/18 |
$11,630 |
$12,834 |
$12,358 |
06/30/18 |
$11,364 |
$12,593 |
$12,207 |
07/31/18 |
$11,630 |
$12,894 |
$12,507 |
08/31/18 |
$11,333 |
$12,624 |
$12,266 |
09/30/18 |
$11,466 |
$12,682 |
$12,372 |
10/31/18 |
$10,635 |
$11,650 |
$11,387 |
11/30/18 |
$10,409 |
$11,761 |
$11,373 |
12/31/18 |
$9,973 |
$11,228 |
$10,821 |
01/31/19 |
$10,725 |
$12,077 |
$11,532 |
02/28/19 |
$10,953 |
$12,313 |
$11,826 |
03/31/19 |
$11,040 |
$12,386 |
$11,901 |
04/30/19 |
$11,182 |
$12,713 |
$12,235 |
05/31/19 |
$10,540 |
$12,031 |
$11,648 |
06/30/19 |
$11,160 |
$12,755 |
$12,339 |
07/31/19 |
$10,779 |
$12,601 |
$12,182 |
08/31/19 |
$10,518 |
$12,212 |
$11,866 |
09/30/19 |
$10,823 |
$12,526 |
$12,206 |
10/31/19 |
$11,182 |
$12,963 |
$12,645 |
11/30/19 |
$11,269 |
$13,077 |
$12,787 |
12/31/19 |
$11,644 |
$13,644 |
$13,203 |
01/31/20 |
$11,352 |
$13,277 |
$12,927 |
02/29/20 |
$10,362 |
$12,228 |
$11,759 |
03/31/20 |
$8,697 |
$10,457 |
$10,189 |
04/30/20 |
$9,327 |
$11,250 |
$10,848 |
05/31/20 |
$9,709 |
$11,618 |
$11,320 |
06/30/20 |
$10,047 |
$12,143 |
$11,705 |
07/31/20 |
$10,227 |
$12,684 |
$11,978 |
08/31/20 |
$10,722 |
$13,227 |
$12,594 |
09/30/20 |
$10,463 |
$12,902 |
$12,267 |
10/31/20 |
$9,990 |
$12,625 |
$11,777 |
11/30/20 |
$11,352 |
$14,323 |
$13,603 |
12/31/20 |
$11,977 |
$15,097 |
$14,235 |
01/31/21 |
$11,862 |
$15,130 |
$14,083 |
02/28/21 |
$12,126 |
$15,429 |
$14,399 |
03/31/21 |
$12,641 |
$15,624 |
$14,730 |
04/30/21 |
$13,043 |
$16,084 |
$15,173 |
05/31/21 |
$13,639 |
$16,587 |
$15,668 |
06/30/21 |
$13,432 |
$16,480 |
$15,492 |
07/31/21 |
$13,455 |
$16,208 |
$15,609 |
08/31/21 |
$13,684 |
$16,516 |
$15,884 |
09/30/21 |
$13,157 |
$15,988 |
$15,423 |
10/31/21 |
$13,455 |
$16,369 |
$15,802 |
11/30/21 |
$12,802 |
$15,632 |
$15,067 |
12/31/21 |
$13,505 |
$16,278 |
$15,838 |
01/31/22 |
$13,194 |
$15,678 |
$15,073 |
02/28/22 |
$12,774 |
$15,368 |
$14,806 |
03/31/22 |
$12,954 |
$15,392 |
$14,902 |
04/30/22 |
$12,211 |
$14,426 |
$13,938 |
05/31/22 |
$12,511 |
$14,529 |
$14,042 |
06/30/22 |
$11,061 |
$13,280 |
$12,739 |
07/31/22 |
$11,612 |
$13,734 |
$13,374 |
08/31/22 |
$11,001 |
$13,292 |
$12,739 |
09/30/22 |
$9,850 |
$11,964 |
$11,547 |
10/31/22 |
$10,533 |
$12,321 |
$12,168 |
11/30/22 |
$11,840 |
$13,776 |
$13,539 |
12/31/22 |
$11,668 |
$13,673 |
$13,549 |
01/31/23 |
$12,561 |
$14,782 |
$14,647 |
02/28/23 |
$12,437 |
$14,263 |
$14,341 |
03/31/23 |
$12,586 |
$14,612 |
$14,696 |
04/30/23 |
$12,871 |
$14,865 |
$15,111 |
05/31/23 |
$12,226 |
$14,325 |
$14,472 |
06/30/23 |
$12,957 |
$14,968 |
$15,130 |
07/31/23 |
$13,354 |
$15,576 |
$15,620 |
08/31/23 |
$12,957 |
$14,873 |
$15,022 |
09/30/23 |
$12,660 |
$14,403 |
$14,508 |
10/31/23 |
$12,114 |
$13,809 |
$13,920 |
11/30/23 |
$13,069 |
$15,052 |
$15,212 |
12/31/23 |
$13,713 |
$15,808 |
$16,021 |
01/31/24 |
$13,778 |
$15,651 |
$16,113 |
02/29/24 |
$14,093 |
$16,047 |
$16,408 |
03/31/24 |
$14,748 |
$16,549 |
$16,947 |
04/30/24 |
$14,368 |
$16,252 |
$16,513 |
05/31/24 |
$15,168 |
$16,723 |
$17,153 |
06/30/24 |
$14,643 |
$16,708 |
$16,876 |
07/31/24 |
$15,102 |
$17,094 |
$17,371 |
08/31/24 |
$15,561 |
$17,581 |
$17,936 |
09/30/24 |
$15,574 |
$18,055 |
$18,102 |
10/31/24 |
$14,932 |
$17,169 |
$17,117 |
11/30/24 |
$15,010 |
$17,013 |
$17,020 |
12/31/24 |
$14,794 |
$16,683 |
$16,633 |
01/31/25 |
$15,419 |
$17,355 |
$17,507 |
02/28/25 |
$15,881 |
$17,596 |
$17,847 |
03/31/25 |
$16,112 |
$17,556 |
$17,775 |
04/30/25 |
$16,791 |
$18,190 |
$18,589 |
05/31/25 |
$17,742 |
$19,023 |
$19,439 |
06/30/25 |
$18,312 |
$19,668 |
$19,868 |
07/31/25 |
$18,068 |
$19,612 |
$19,589 |
08/31/25 |
$19,155 |
$20,293 |
$20,424 |
Average Annual Total Returns (%)
Name |
1 Year |
5 Years |
10 Years |
SSAIX |
23.09% |
12.31% |
6.72% |
MSCI ACWI ex USA Index |
15.42% |
8.94% |
7.33% |
MSCI EAFE Net Dividend Index |
13.87% |
10.15% |
7.40% |
The Fund’s past performance is not necessarily an indication of how the Fund will perform in the future. The returns do not reflect the deduction of taxes that a shareholder would pay on Fund distributions or on the redemption or sale of Fund shares. Updated performance information is available by calling 1-800-647-7327 or visiting our website at www.ssga.com.
Key Fund Statistics as of 8/31/2025
- Total Net Assets$180,458,345
- Number of Portfolio Holdings181
- Portfolio Turnover Rate131%
- Total Advisory Fees Paid$739,393
What did the Fund invest in as of 8/31/2025? (as a percentage of total net assets)
Countries |
% |
Japan |
22.1% |
United Kingdom |
13.9% |
Germany |
10.5% |
France |
8.1% |
Australia |
7.1% |
United States |
5.9% |
Italy |
4.8% |
Spain |
3.3% |
Netherlands |
3.1% |
Israel |
2.7% |
Holdings |
% |
Novartis AG |
2.2% |
Roche Holding AG |
2.0% |
Deutsche Telekom AG |
1.6% |
British American Tobacco PLC |
1.6% |
Intesa Sanpaolo SpA |
1.4% |
Deutsche Bank AG |
1.3% |
Barclays PLC |
1.3% |
Lloyds Banking Group PLC |
1.3% |
Nordea Bank Abp |
1.2% |
Bank Leumi Le-Israel BM |
1.2% |
Availability of Additional Information
For additional information about the Fund, including its Prospectus, Statement of Additional Information, financial statements, holdings and
proxy information please visit: https://www.ssga.com/us/en/institutional/fund-finder?type=mf .
State Street S&P 500 Index Fund
Annual Shareholder Report
August 31, 2025
This annual shareholder report contains important information about the State Street S&P 500 Index Fund (the "Fund") for the period of September 1, 2024 through August 31, 2025. You can find additional information about the Fund at https://www.ssga.com/us/en/institutional/fund-finder?type=mf . You can also request this information about the Fund by contacting us at 1-800-647-7327.
What were the Fund costs for the last year? (based on a hypothetical $10,000 Investment)
Class Name |
Costs of a $10,000 investment |
Costs paid as a percentage of a $10,000 investment |
Class N |
$17 |
0.16% |
How did the Fund perform last year and what affected its performance?
The Fund posted positive returns in seven of the twelve months of the reporting period. Over this time period, the S&P 500 was influenced by a mix of macroeconomic and sector-specific factors. AI-driven growth in major tech firms fueled optimism, with the “Magnificent Seven” posting strong earnings and leading market gains. Broader corporate earnings were solid, with over 80% of companies beating estimates in Q2 2025. Early 2025 saw volatility due to tariff concerns, but the impact was limited. Investor sentiment improved as recession fears faded and the U.S. Federal Reserve signaled a potential rate cut, boosting equity valuations. P/E ratios expanded above historical norms, reflecting confidence in future growth. Consumer resilience and easing inflation also supported performance. Despite early headwinds, the index posted a strong year, driven by concentrated gains in large-cap stocks and improving economic indicators.
The Fund's benchmark is an unmanaged index used as a general measure of market performance. Calculations assume dividends and capital gains.
Comparison of Change in Value of a $10,000 Investment
(Based on Net Asset Value)
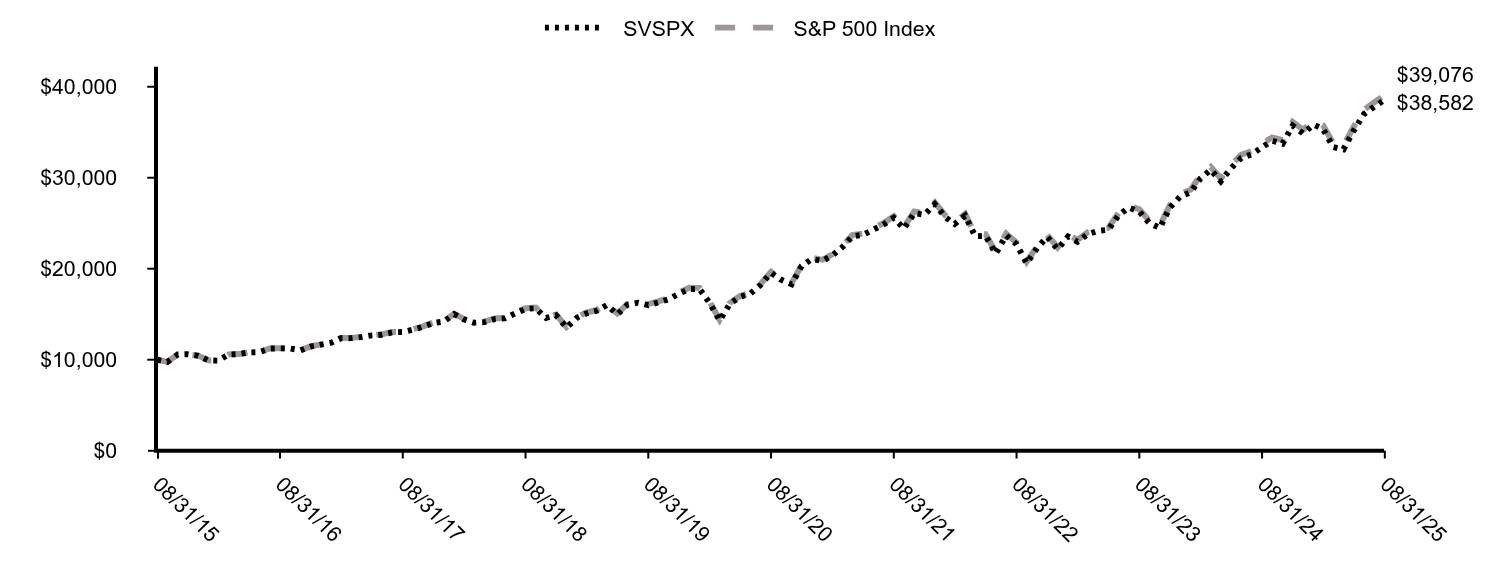
|
SVSPX |
S&P 500 Index |
08/31/15 |
$10,000 |
$10,000 |
09/30/15 |
$9,751 |
$9,753 |
10/31/15 |
$10,574 |
$10,575 |
11/30/15 |
$10,603 |
$10,607 |
12/31/15 |
$10,436 |
$10,439 |
01/31/16 |
$9,916 |
$9,921 |
02/29/16 |
$9,900 |
$9,908 |
03/31/16 |
$10,571 |
$10,580 |
04/30/16 |
$10,614 |
$10,621 |
05/31/16 |
$10,802 |
$10,812 |
06/30/16 |
$10,826 |
$10,840 |
07/31/16 |
$11,225 |
$11,240 |
08/31/16 |
$11,238 |
$11,255 |
09/30/16 |
$11,238 |
$11,257 |
10/31/16 |
$11,031 |
$11,052 |
11/30/16 |
$11,439 |
$11,461 |
12/31/16 |
$11,664 |
$11,688 |
01/31/17 |
$11,882 |
$11,910 |
02/28/17 |
$12,354 |
$12,382 |
03/31/17 |
$12,367 |
$12,397 |
04/30/17 |
$12,493 |
$12,524 |
05/31/17 |
$12,667 |
$12,701 |
06/30/17 |
$12,745 |
$12,780 |
07/31/17 |
$13,002 |
$13,043 |
08/31/17 |
$13,042 |
$13,082 |
09/30/17 |
$13,309 |
$13,352 |
10/31/17 |
$13,618 |
$13,664 |
11/30/17 |
$14,037 |
$14,083 |
12/31/17 |
$14,192 |
$14,240 |
01/31/18 |
$15,001 |
$15,055 |
02/28/18 |
$14,441 |
$14,500 |
03/31/18 |
$14,069 |
$14,131 |
04/30/18 |
$14,122 |
$14,186 |
05/31/18 |
$14,460 |
$14,527 |
06/30/18 |
$14,543 |
$14,617 |
07/31/18 |
$15,085 |
$15,161 |
08/31/18 |
$15,574 |
$15,655 |
09/30/18 |
$15,661 |
$15,744 |
10/31/18 |
$14,590 |
$14,668 |
11/30/18 |
$14,882 |
$14,967 |
12/31/18 |
$13,536 |
$13,615 |
01/31/19 |
$14,621 |
$14,706 |
02/28/19 |
$15,086 |
$15,179 |
03/31/19 |
$15,379 |
$15,473 |
04/30/19 |
$15,999 |
$16,100 |
05/31/19 |
$14,979 |
$15,077 |
06/30/19 |
$16,035 |
$16,139 |
07/31/19 |
$16,264 |
$16,371 |
08/31/19 |
$15,996 |
$16,112 |
09/30/19 |
$16,295 |
$16,414 |
10/31/19 |
$16,647 |
$16,769 |
11/30/19 |
$17,246 |
$17,378 |
12/31/19 |
$17,768 |
$17,902 |
01/31/20 |
$17,755 |
$17,895 |
02/29/20 |
$16,289 |
$16,422 |
03/31/20 |
$14,313 |
$14,394 |
04/30/20 |
$16,145 |
$16,239 |
05/31/20 |
$16,914 |
$17,012 |
06/30/20 |
$17,259 |
$17,351 |
07/31/20 |
$18,231 |
$18,329 |
08/31/20 |
$19,538 |
$19,647 |
09/30/20 |
$18,789 |
$18,900 |
10/31/20 |
$18,290 |
$18,397 |
11/30/20 |
$20,295 |
$20,411 |
12/31/20 |
$21,072 |
$21,196 |
01/31/21 |
$20,855 |
$20,982 |
02/28/21 |
$21,429 |
$21,561 |
03/31/21 |
$22,369 |
$22,505 |
04/30/21 |
$23,562 |
$23,706 |
05/31/21 |
$23,723 |
$23,872 |
06/30/21 |
$24,272 |
$24,429 |
07/31/21 |
$24,844 |
$25,009 |
08/31/21 |
$25,597 |
$25,770 |
09/30/21 |
$24,406 |
$24,571 |
10/31/21 |
$26,114 |
$26,292 |
11/30/21 |
$25,926 |
$26,110 |
12/31/21 |
$27,086 |
$27,280 |
01/31/22 |
$25,679 |
$25,869 |
02/28/22 |
$24,909 |
$25,094 |
03/31/22 |
$25,831 |
$26,026 |
04/30/22 |
$23,571 |
$23,756 |
05/31/22 |
$23,613 |
$23,800 |
06/30/22 |
$21,663 |
$21,835 |
07/31/22 |
$23,661 |
$23,849 |
08/31/22 |
$22,689 |
$22,876 |
09/30/22 |
$20,595 |
$20,769 |
10/31/22 |
$22,260 |
$22,451 |
11/30/22 |
$23,502 |
$23,706 |
12/31/22 |
$22,144 |
$22,340 |
01/31/23 |
$23,535 |
$23,743 |
02/28/23 |
$22,959 |
$23,164 |
03/31/23 |
$23,799 |
$24,015 |
04/30/23 |
$24,167 |
$24,389 |
05/31/23 |
$24,269 |
$24,495 |
06/30/23 |
$25,872 |
$26,114 |
07/31/23 |
$26,704 |
$26,953 |
08/31/23 |
$26,276 |
$26,524 |
09/30/23 |
$25,017 |
$25,259 |
10/31/23 |
$24,484 |
$24,728 |
11/30/23 |
$26,718 |
$26,986 |
12/31/23 |
$27,933 |
$28,212 |
01/31/24 |
$28,398 |
$28,686 |
02/29/24 |
$29,910 |
$30,218 |
03/31/24 |
$30,869 |
$31,190 |
04/30/24 |
$29,604 |
$29,916 |
05/31/24 |
$31,070 |
$31,400 |
06/30/24 |
$32,181 |
$32,527 |
07/31/24 |
$32,566 |
$32,922 |
08/31/24 |
$33,350 |
$33,721 |
09/30/24 |
$34,058 |
$34,441 |
10/31/24 |
$33,743 |
$34,129 |
11/30/24 |
$35,721 |
$36,132 |
12/31/24 |
$34,867 |
$35,271 |
01/31/25 |
$35,833 |
$36,253 |
02/28/25 |
$35,360 |
$35,780 |
03/31/25 |
$33,358 |
$33,764 |
04/30/25 |
$33,119 |
$33,535 |
05/31/25 |
$35,205 |
$35,646 |
06/30/25 |
$36,989 |
$37,459 |
07/31/25 |
$37,817 |
$38,299 |
08/31/25 |
$38,582 |
$39,076 |
Average Annual Total Returns (%)
Name |
1 Year |
5 Years |
10 Years |
SVSPX |
15.69% |
14.58% |
14.46% |
S&P 500 Index |
15.88% |
14.74% |
14.60% |
The Fund’s past performance is not necessarily an indication of how the Fund will perform in the future. The returns do not reflect the deduction of taxes that a shareholder would pay on Fund distributions or on the redemption or sale of Fund shares. Updated performance information is available by calling 1-800-647-7327 or visiting our website at www.ssga.com.
Key Fund Statistics as of 8/31/2025
- Total Net Assets$1,594,650,784
- Number of Portfolio Holdings506
- Portfolio Turnover Rate2%
- Total Advisory Fees Paid$227,566
What did the Fund invest in as of 8/31/2025? (as a percentage of total net assets)
Sectors |
% |
Information Technology |
33.5% |
Financials |
14.0% |
Consumer Discretionary |
10.5% |
Communication Services |
10.0% |
Health Care |
9.1% |
Industrials |
8.5% |
Consumer Staples |
5.2% |
Energy |
3.0% |
Utilities |
2.3% |
Real Estate |
2.0% |
Holdings |
% |
NVIDIA Corp. |
7.7% |
Microsoft Corp. |
6.9% |
Apple, Inc. |
6.3% |
Amazon.com, Inc. |
4.0% |
Meta Platforms, Inc., Class A |
2.9% |
Broadcom, Inc. |
2.6% |
Alphabet, Inc., Class A |
2.3% |
Alphabet, Inc., Class C |
1.8% |
Tesla, Inc. |
1.7% |
Berkshire Hathaway, Inc., Class B |
1.7% |
Availability of Additional Information
For additional information about the Fund, including its Prospectus, Statement of Additional Information, financial statements, holdings and
proxy information please visit: https://www.ssga.com/us/en/institutional/fund-finder?type=mf .
| (b) |
Not applicable to the Registrant. |
Item 2. Code of Ethics.
As of the end of the period covered by this report, SSGA Funds (the “Trust,” “Fund Entity” or “Registrant”) has adopted a code of ethics, as defined in Item 2(b) of Form N-CSR, that applies to the Registrant’s principal executive officer, principal financial officer, principal accounting officer or controller, or persons performing similar functions, regardless of whether these individuals are employed by the Registrant or a third party (the “Code”). That Code comprises written standards that are reasonably designed to deter wrongdoing and to promote: (1) honest and ethical conduct, including the ethical handling of actual or apparent conflicts of interest between personal and professional relationships; (2) full, fair, accurate, timely and understandable disclosure in reports and documents that the Registrant files with, or submits to, the U.S. Securities Exchange Commission (the “SEC”) and in other public communications made by the Registrant; (3) compliance with applicable laws and governmental rules and regulations; (4) the prompt internal reporting to an appropriate person or persons identified in the Code of violations of the Code; and (5) accountability for adherence to the Code. For the period covered by the report, the Code was combined with other mutual funds advised by SSGA Funds Management, Inc. (“SSGA FM” or the “Adviser”). The Registrant has not made any amendments to the Code that relates to any element of the code of ethics definition set forth in Item 2(b) of Form N-CSR during the covered period. The Registrant has not granted any waivers from any provisions of the Code during the covered period. A copy of the Code is filed as Exhibit 19(a)(1) to this Form N-CSR.
Item 3. Audit Committee Financial Expert.
The Trust’s Board of Trustees (the “Board”) has determined that the Trust has the following “audit committee financial experts” as defined in Item 3(b) of Form N-CSR serving on its audit committee (the “Audit Committee”): Messrs. George M. Pereira, Mark E. Swanson and Ms. Donna M. Rapaccioli. Each of the “audit committee financial experts” is “independent” as that term is defined in Item 3(a)(2) of Form N-CSR.
An “audit committee financial expert” is not an “expert” for any purpose, including for purposes of Section 11 of the Securities Act of 1933, as amended, as a result of being designated as an “audit committee financial expert.” Further, the designation of a person as an “audit committee financial expert” does not mean that the person has any greater duties, obligations, or liability than those imposed on the person without the “audit committee financial expert” designation. Similarly, the designation of a person as an “audit committee financial expert” does not affect the duties, obligations, or liability of any other member of the Audit Committee or the Board.
Item 4. Principal Accountant Fees and Services.
(a) Audit Fees
For the fiscal years ended August 31, 2025 and August 31, 2024, the aggregate audit fees billed for professional services rendered by Ernst & Young LLP (“E&Y”), the Trust’s principal accountant, for the audit of the Trust’s annual financial statements or services normally provided by E&Y in connection with the Trust’s statutory and regulatory filings and engagements were $66,688 and $66,688, respectively.
(b) Audit-Related Fees
For the fiscal years ended August 31, 2025 and August 31, 2024, there were no fees for assurance and related services by E&Y reasonably related to the performance of the audit of the Trust’s financial statements that were not reported under paragraph (a) of this Item.
(c) Tax Fees
For the fiscal years ended August 31, 2025 and August 31, 2024, the aggregate tax fees billed for professional services rendered by E&Y for the review of year-end distribution requirements were $5,062 and $5,062, respectively.
(d) All Other Fees
For the fiscal years ended August 31, 2025 and August 31, 2024, there were no fees billed for professional services rendered by E&Y for products and services provided by E&Y to the Trust, other than the services reported in paragraphs (a) through (c).
For the fiscal years ended August 31, 2025 and August 31, 2024, the aggregate fees for professional services rendered by E&Y for products and services provided by E&Y to the Adviser and any entity controlling, controlled by, or under common control with the Adviser that provides ongoing services to the Trust that (i) relate directly to the operations and financial reporting of the Trust and (ii) were pre-approved by the Audit Committee were approximately $9,637,151 and $9,387,702, respectively.
(e)(1) Audit Committee Pre-Approval Policies and Procedures
The Trust’s Audit Committee Charter states the following with respect to pre-approval procedures:
The Audit Committee shall have the following duties and powers:
| |
• |
|
To pre-approve engagements by a Fund Entity’s independent auditor for non-audit services to be rendered to the Fund’s investment adviser (not including any subadviser whose role is primarily portfolio management and is subcontracted with or overseen by another investment adviser), and any entity controlling, controlled by, or under common control with the investment adviser that provides ongoing services to the Fund, if the engagement relates directly to the operations and financial reporting of the Fund; |
| |
• |
|
To establish, if deemed necessary or appropriate as an alternative to Audit Committee pre-approval of services to be provided by the independent auditor as required by paragraph (b) above, policies and procedures to permit such services to be pre-approved by other means, such as by action of a designated member or members of the Audit Committee, subject to the requirement that the decision of any member to whom authority is delegated to pre-approve an activity shall be presented to the full Audit Committee at its next scheduled meeting; |
Alternate Pre-Approval Procedure:
| |
• |
|
The Chairperson, or Vice Chairperson, of the Audit Committee is authorized to pre-approve any engagement involving the Fund Entity’s independent auditors to the same extent as the Audit Committee. Any pre-approval decision by the Chairperson, or Vice Chairperson, under the foregoing authority shall be presented to the Audit Committee at its next scheduled meeting. |
(e)(2) Percentages of Services
None of the services described in paragraphs (b) through (d) of this Item were performed in reliance on paragraph (c)(7)(i)(C) of Rule 2-01 of Regulation S-X during the period of time for which such rule was effective.
(f) Not applicable.
(g) Total Fees Paid By Adviser and Certain Affiliates
The aggregate non-audit fees billed for by E&Y for services rendered to the Trust and the Adviser and any entity controlling, controlled by, or under common control with the Adviser that provided ongoing services to the Trust were as follows:
|
|
|
|
|
|
|
|
|
| |
|
FY 2025
(in millions) |
|
|
FY 2024
(in millions) |
|
| Non audit services billed to: |
|
|
|
|
|
|
|
|
| Registrant: |
|
|
See Item 4 |
(c) |
|
|
See Item 4 |
(c) |
| Investment Adviser: |
|
|
— |
|
|
|
— |
|
| Other entities in the Investment Company Complex(1)(2): |
|
|
|
|
|
|
|
|
| Audit Related Fees |
|
$ |
18.6 |
|
|
$ |
18.3 |
|
| Tax Fees |
|
$ |
3.4 |
|
|
$ |
3.1 |
|
| All Other Fees |
|
$ |
15.8 |
|
|
$ |
15.0 |
|
|
|
|
|
|
|
|
|
|
| (1) |
Information is for the calendar years 2025 and 2024, respectively. |
| (2) |
Services under the caption Audit-Related Fees consisted principally of reports on the processing of transactions by servicing organizations, audits of employee benefit plan, non-statutory audits and due diligence procedures. Services under the caption Tax Fees consisted principally of expatriate, compliance and corporate tax advisory services. Services under the caption All Other Fees primarily related to statutory and financial statement audits and the requirement to opine on the design and operating effectiveness of internal control over financial reporting. |
(h) E&Y notified the Trust’s Audit Committee of all non-audit services that were rendered by E&Y to the Adviser and any entity controlling, controlled by, or under common control with the Adviser that provides services to the Trust, which services were not required to be pre-approved pursuant to paragraph (c)(7)(ii) of Rule 2-01 of Regulation S-X, allowing the Trust’s Audit Committee to consider whether such services were compatible with maintaining E&Y’s independence.
(i) Not applicable.
(j) Not applicable.
Item 5. Audit Committee of Listed Registrants.
Not applicable to the Registrant.
Item 6. Investments.
(a) Schedules of Investments are included as a part of the Financial Statements filed under Item 7(a) of this Form N-CSR.
(b) Not applicable.
Item 7. Financial Statements and Financial Highlights for Open-End Management Investment Companies
(a) The Registrant’s Financial Statements are attached herewith.
(b) The Registrant’s Financial Highlights are included as part of the Financial Statements filed under Item 7(a) of this Form N-CSR.
Annual Financial Statements and Other Information
August 31, 2025
SSGA Funds
| State Street S&P 500 Index Fund |
The information contained in this report is intended for the general information of shareholders of the Trust. This report is not authorized for distribution to prospective investors unless preceded or accompanied by a current Trust prospectus which contains important information concerning the Trust. You may obtain a current prospectus and SAI from the Distributor by calling 1-800-647-7327 or visiting www.ssga.com. Please read the prospectus carefully before you invest.
TABLE OF CONTENTS
Changes in and Disagreements with Accountants for Open-End Management Investment Companies (N-CSR Item 8) - Not Applicable
Proxy Disclosures for Open-End Management Investment Companies (N-CSR Item 9) - Not Applicable
Remuneration Paid to Directors, Officers, and Others of Open-End Management Investment Companies (N-CSR Item 10) - Please see Statement of Operations in the Financial Statements under Item 7 above
STATE STREET S&P 500 INDEX FUND
SCHEDULE OF INVESTMENTS
August 31, 2025
| Security Description |
|
|
Shares |
|
Value |
| COMMON STOCKS — 100.0% |
|
|
|
|
|
| COMMUNICATION SERVICES — 10.0% |
|
|
|
Alphabet, Inc. Class A
|
|
|
169,377 |
|
$36,062,057 |
Alphabet, Inc. Class C
|
|
|
136,598 |
|
29,167,771 |
AT&T, Inc.
|
|
|
208,441 |
|
6,105,237 |
Charter Communications, Inc. Class A (a)
|
|
|
2,900 |
|
770,182 |
Comcast Corp. Class A
|
|
|
107,787 |
|
3,661,524 |
Electronic Arts, Inc.
|
|
|
6,642 |
|
1,142,092 |
Fox Corp. Class A
|
|
|
5,616 |
|
335,275 |
Fox Corp. Class B
|
|
|
2,900 |
|
158,195 |
Interpublic Group of Cos., Inc.
|
|
|
12,228 |
|
328,200 |
Live Nation Entertainment, Inc. (a)
|
|
|
4,400 |
|
732,556 |
Match Group, Inc.
|
|
|
7,587 |
|
283,299 |
Meta Platforms, Inc. Class A
|
|
|
63,203 |
|
46,688,056 |
Netflix, Inc. (a)
|
|
|
12,412 |
|
14,996,799 |
News Corp. Class A
|
|
|
12,561 |
|
369,419 |
News Corp. Class B (b)
|
|
|
3,800 |
|
128,706 |
Omnicom Group, Inc. (b)
|
|
|
5,198 |
|
407,159 |
Paramount Skydance Corp. (a) (b)
|
|
|
7,358 |
|
108,163 |
Take-Two Interactive Software, Inc. (a)
|
|
|
4,594 |
|
1,071,642 |
TKO Group Holdings, Inc.
|
|
|
2,000 |
|
379,120 |
T-Mobile U.S., Inc.
|
|
|
13,885 |
|
3,498,881 |
Trade Desk, Inc. Class A (a)
|
|
|
13,100 |
|
716,046 |
Verizon Communications, Inc.
|
|
|
122,164 |
|
5,403,314 |
Walt Disney Co.
|
|
|
52,518 |
|
6,217,081 |
Warner Bros Discovery, Inc. (a)
|
|
|
66,333 |
|
772,116 |
| |
|
|
|
|
159,502,890 |
| CONSUMER DISCRETIONARY — 10.5% |
|
|
|
Airbnb, Inc. Class A (a)
|
|
|
12,600 |
|
1,644,678 |
Amazon.com, Inc. (a)
|
|
|
275,108 |
|
62,999,732 |
Aptiv PLC (a)
|
|
|
6,403 |
|
509,231 |
AutoZone, Inc. (a)
|
|
|
471 |
|
1,977,508 |
Best Buy Co., Inc.
|
|
|
5,145 |
|
378,878 |
Booking Holdings, Inc.
|
|
|
950 |
|
5,319,098 |
Caesars Entertainment, Inc. (a)
|
|
|
6,777 |
|
181,420 |
CarMax, Inc. (a)
|
|
|
5,192 |
|
318,529 |
Carnival Corp. (a)
|
|
|
32,449 |
|
1,034,799 |
Chipotle Mexican Grill, Inc. (a)
|
|
|
39,400 |
|
1,660,316 |
Darden Restaurants, Inc.
|
|
|
3,340 |
|
691,180 |
Deckers Outdoor Corp. (a)
|
|
|
4,800 |
|
574,224 |
Domino's Pizza, Inc.
|
|
|
931 |
|
426,677 |
DoorDash, Inc. Class A (a)
|
|
|
9,700 |
|
2,378,925 |
DR Horton, Inc.
|
|
|
7,836 |
|
1,328,045 |
eBay, Inc.
|
|
|
13,392 |
|
1,213,449 |
Expedia Group, Inc.
|
|
|
3,475 |
|
746,430 |
Ford Motor Co.
|
|
|
109,631 |
|
1,290,357 |
Garmin Ltd.
|
|
|
4,299 |
|
1,039,584 |
General Motors Co.
|
|
|
27,241 |
|
1,596,050 |
Genuine Parts Co.
|
|
|
4,220 |
|
587,973 |
Hasbro, Inc.
|
|
|
4,232 |
|
343,511 |
Hilton Worldwide Holdings, Inc.
|
|
|
6,743 |
|
1,861,473 |
| Security Description |
|
|
Shares |
|
Value |
Home Depot, Inc.
|
|
|
28,936 |
|
$11,770,297 |
Las Vegas Sands Corp.
|
|
|
9,805 |
|
565,062 |
Lennar Corp. Class A
|
|
|
6,380 |
|
849,433 |
LKQ Corp.
|
|
|
8,100 |
|
264,222 |
Lowe's Cos., Inc.
|
|
|
16,303 |
|
4,207,152 |
Lululemon Athletica, Inc. (a)
|
|
|
3,400 |
|
687,480 |
Marriott International, Inc. Class A
|
|
|
6,806 |
|
1,823,055 |
McDonald's Corp.
|
|
|
20,629 |
|
6,468,017 |
MGM Resorts International (a)
|
|
|
5,184 |
|
205,753 |
Mohawk Industries, Inc. (a)
|
|
|
1,969 |
|
261,267 |
NIKE, Inc. Class B
|
|
|
33,826 |
|
2,617,118 |
Norwegian Cruise Line Holdings Ltd. (a)
|
|
|
13,900 |
|
345,276 |
NVR, Inc. (a)
|
|
|
90 |
|
730,589 |
O'Reilly Automotive, Inc. (a)
|
|
|
24,390 |
|
2,528,755 |
Pool Corp. (b)
|
|
|
1,265 |
|
393,048 |
PulteGroup, Inc.
|
|
|
6,252 |
|
825,389 |
Ralph Lauren Corp.
|
|
|
1,196 |
|
355,128 |
Ross Stores, Inc.
|
|
|
9,534 |
|
1,403,023 |
Royal Caribbean Cruises Ltd.
|
|
|
7,197 |
|
2,614,094 |
Starbucks Corp.
|
|
|
32,669 |
|
2,881,079 |
Tapestry, Inc.
|
|
|
6,281 |
|
639,531 |
Tesla, Inc. (a)
|
|
|
81,335 |
|
27,155,316 |
TJX Cos., Inc.
|
|
|
32,524 |
|
4,443,104 |
Tractor Supply Co.
|
|
|
15,865 |
|
979,822 |
Ulta Beauty, Inc. (a)
|
|
|
1,249 |
|
615,420 |
Williams-Sonoma, Inc.
|
|
|
3,700 |
|
696,303 |
Wynn Resorts Ltd.
|
|
|
1,991 |
|
252,359 |
Yum! Brands, Inc.
|
|
|
8,249 |
|
1,212,356 |
| |
|
|
|
|
167,891,515 |
| CONSUMER STAPLES — 5.2% |
|
|
|
Altria Group, Inc.
|
|
|
49,741 |
|
3,343,093 |
Archer-Daniels-Midland Co.
|
|
|
13,061 |
|
818,141 |
Brown-Forman Corp. Class B (b)
|
|
|
5,827 |
|
174,460 |
Bunge Global SA
|
|
|
4,300 |
|
362,146 |
Campbell's Co.
|
|
|
6,461 |
|
206,300 |
Church & Dwight Co., Inc.
|
|
|
7,203 |
|
671,032 |
Clorox Co.
|
|
|
3,498 |
|
413,464 |
Coca-Cola Co.
|
|
|
112,733 |
|
7,777,450 |
Colgate-Palmolive Co.
|
|
|
23,262 |
|
1,955,636 |
Conagra Brands, Inc.
|
|
|
14,679 |
|
280,809 |
Constellation Brands, Inc. Class A
|
|
|
4,776 |
|
773,425 |
Costco Wholesale Corp.
|
|
|
12,891 |
|
12,160,338 |
Dollar General Corp.
|
|
|
6,174 |
|
671,484 |
Dollar Tree, Inc. (a)
|
|
|
5,479 |
|
598,142 |
Estee Lauder Cos., Inc. Class A
|
|
|
6,164 |
|
565,424 |
General Mills, Inc.
|
|
|
16,995 |
|
838,363 |
Hershey Co.
|
|
|
4,006 |
|
736,103 |
Hormel Foods Corp.
|
|
|
7,898 |
|
200,925 |
J.M. Smucker Co.
|
|
|
3,555 |
|
392,863 |
Kellanova
|
|
|
8,484 |
|
674,478 |
Kenvue, Inc.
|
|
|
56,263 |
|
1,165,207 |
Keurig Dr. Pepper, Inc.
|
|
|
40,589 |
|
1,180,734 |
See accompanying notes to financial statements.
1
STATE STREET S&P 500 INDEX FUND
SCHEDULE OF INVESTMENTS (continued)
August 31, 2025
| Security Description |
|
|
Shares |
|
Value |
Kimberly-Clark Corp.
|
|
|
9,547 |
|
$1,232,900 |
Kraft Heinz Co.
|
|
|
26,151 |
|
731,444 |
Kroger Co.
|
|
|
17,342 |
|
1,176,481 |
Lamb Weston Holdings, Inc.
|
|
|
4,700 |
|
270,391 |
McCormick & Co., Inc.
|
|
|
6,922 |
|
487,101 |
Molson Coors Beverage Co. Class B
|
|
|
5,909 |
|
298,345 |
Mondelez International, Inc. Class A
|
|
|
37,910 |
|
2,329,190 |
Monster Beverage Corp. (a)
|
|
|
20,410 |
|
1,273,788 |
PepsiCo, Inc.
|
|
|
39,821 |
|
5,919,392 |
Philip Morris International, Inc.
|
|
|
45,285 |
|
7,568,482 |
Procter & Gamble Co.
|
|
|
68,336 |
|
10,731,486 |
Sysco Corp.
|
|
|
13,341 |
|
1,073,550 |
Target Corp.
|
|
|
13,236 |
|
1,270,391 |
Tyson Foods, Inc. Class A
|
|
|
8,849 |
|
502,446 |
Walmart, Inc.
|
|
|
125,533 |
|
12,174,190 |
| |
|
|
|
|
82,999,594 |
| ENERGY — 3.0% |
|
|
|
APA Corp.
|
|
|
9,509 |
|
220,799 |
Baker Hughes Co.
|
|
|
30,098 |
|
1,366,449 |
Chevron Corp.
|
|
|
55,948 |
|
8,985,249 |
ConocoPhillips
|
|
|
36,448 |
|
3,607,258 |
Coterra Energy, Inc.
|
|
|
21,852 |
|
534,063 |
Devon Energy Corp.
|
|
|
19,086 |
|
689,005 |
Diamondback Energy, Inc.
|
|
|
5,566 |
|
827,998 |
EOG Resources, Inc.
|
|
|
15,623 |
|
1,950,063 |
EQT Corp.
|
|
|
16,995 |
|
881,021 |
Expand Energy Corp.
|
|
|
6,400 |
|
619,392 |
Exxon Mobil Corp.
|
|
|
125,446 |
|
14,337,223 |
Halliburton Co.
|
|
|
25,080 |
|
570,068 |
Kinder Morgan, Inc.
|
|
|
56,155 |
|
1,515,062 |
Marathon Petroleum Corp.
|
|
|
8,575 |
|
1,541,013 |
Occidental Petroleum Corp.
|
|
|
19,460 |
|
926,491 |
ONEOK, Inc.
|
|
|
17,966 |
|
1,372,243 |
Phillips 66 Co.
|
|
|
11,892 |
|
1,588,533 |
Schlumberger NV
|
|
|
43,811 |
|
1,613,997 |
Targa Resources Corp.
|
|
|
6,404 |
|
1,074,335 |
Texas Pacific Land Corp.
|
|
|
600 |
|
560,088 |
Valero Energy Corp.
|
|
|
9,375 |
|
1,425,094 |
Williams Cos., Inc.
|
|
|
36,394 |
|
2,106,485 |
| |
|
|
|
|
48,311,929 |
| FINANCIALS — 14.0% |
|
|
|
Aflac, Inc.
|
|
|
13,868 |
|
1,481,935 |
Allstate Corp.
|
|
|
7,867 |
|
1,600,541 |
American Express Co.
|
|
|
15,912 |
|
5,271,327 |
American International Group, Inc.
|
|
|
16,346 |
|
1,329,257 |
Ameriprise Financial, Inc.
|
|
|
2,776 |
|
1,429,113 |
Aon PLC Class A
|
|
|
6,148 |
|
2,256,316 |
Apollo Global Management, Inc.
|
|
|
12,900 |
|
1,757,367 |
Arch Capital Group Ltd.
|
|
|
11,464 |
|
1,049,300 |
Arthur J Gallagher & Co.
|
|
|
7,315 |
|
2,214,616 |
Assurant, Inc.
|
|
|
1,704 |
|
367,399 |
Bank of America Corp.
|
|
|
189,906 |
|
9,635,830 |
| Security Description |
|
|
Shares |
|
Value |
Bank of New York Mellon Corp.
|
|
|
20,472 |
|
$2,161,843 |
Berkshire Hathaway, Inc. Class B (a)
|
|
|
53,211 |
|
26,764,069 |
Blackrock, Inc.
|
|
|
4,234 |
|
4,772,311 |
Blackstone, Inc.
|
|
|
21,376 |
|
3,663,846 |
Block, Inc. (a)
|
|
|
16,200 |
|
1,290,168 |
Brown & Brown, Inc.
|
|
|
8,179 |
|
792,954 |
Capital One Financial Corp.
|
|
|
18,289 |
|
4,155,627 |
Cboe Global Markets, Inc.
|
|
|
2,959 |
|
698,176 |
Charles Schwab Corp.
|
|
|
50,266 |
|
4,817,493 |
Chubb Ltd.
|
|
|
10,888 |
|
2,994,962 |
Cincinnati Financial Corp.
|
|
|
4,274 |
|
656,486 |
Citigroup, Inc.
|
|
|
54,331 |
|
5,246,745 |
Citizens Financial Group, Inc.
|
|
|
12,894 |
|
674,098 |
CME Group, Inc.
|
|
|
10,658 |
|
2,840,464 |
Coinbase Global, Inc. Class A (a)
|
|
|
6,300 |
|
1,918,602 |
Corpay, Inc. (a)
|
|
|
2,065 |
|
672,509 |
Erie Indemnity Co. Class A
|
|
|
800 |
|
283,504 |
Everest Group Ltd.
|
|
|
1,158 |
|
395,897 |
FactSet Research Systems, Inc.
|
|
|
1,101 |
|
411,025 |
Fidelity National Information Services, Inc.
|
|
|
14,914 |
|
1,041,146 |
Fifth Third Bancorp
|
|
|
19,410 |
|
888,396 |
Fiserv, Inc. (a)
|
|
|
16,361 |
|
2,260,763 |
Franklin Resources, Inc.
|
|
|
10,551 |
|
270,739 |
Global Payments, Inc.
|
|
|
7,257 |
|
644,567 |
Globe Life, Inc.
|
|
|
2,584 |
|
361,631 |
Goldman Sachs Group, Inc.
|
|
|
8,903 |
|
6,634,961 |
Hartford Insurance Group, Inc.
|
|
|
8,067 |
|
1,067,345 |
Huntington Bancshares, Inc.
|
|
|
44,914 |
|
799,918 |
Interactive Brokers Group, Inc. Class A
|
|
|
12,700 |
|
790,448 |
Intercontinental Exchange, Inc.
|
|
|
16,539 |
|
2,920,787 |
Invesco Ltd.
|
|
|
14,689 |
|
321,542 |
Jack Henry & Associates, Inc.
|
|
|
2,380 |
|
388,559 |
JPMorgan Chase & Co.
|
|
|
81,039 |
|
24,426,775 |
KeyCorp
|
|
|
30,771 |
|
595,727 |
KKR & Co., Inc.
|
|
|
19,400 |
|
2,706,106 |
Loews Corp.
|
|
|
5,606 |
|
542,661 |
M&T Bank Corp.
|
|
|
4,943 |
|
996,805 |
MarketAxess Holdings, Inc.
|
|
|
1,100 |
|
202,224 |
Marsh & McLennan Cos., Inc.
|
|
|
14,211 |
|
2,924,766 |
Mastercard, Inc. Class A
|
|
|
23,573 |
|
14,032,771 |
MetLife, Inc.
|
|
|
16,023 |
|
1,303,631 |
Moody's Corp.
|
|
|
4,464 |
|
2,275,569 |
Morgan Stanley
|
|
|
35,638 |
|
5,362,806 |
MSCI, Inc.
|
|
|
2,188 |
|
1,242,171 |
Nasdaq, Inc.
|
|
|
11,575 |
|
1,096,616 |
Northern Trust Corp.
|
|
|
5,468 |
|
717,839 |
PayPal Holdings, Inc. (a)
|
|
|
27,927 |
|
1,960,196 |
PNC Financial Services Group, Inc.
|
|
|
11,647 |
|
2,416,054 |
Principal Financial Group, Inc.
|
|
|
6,126 |
|
493,204 |
Progressive Corp.
|
|
|
16,800 |
|
4,150,608 |
Prudential Financial, Inc.
|
|
|
9,906 |
|
1,086,292 |
See accompanying notes to financial statements.
2
STATE STREET S&P 500 INDEX FUND
SCHEDULE OF INVESTMENTS (continued)
August 31, 2025
| Security Description |
|
|
Shares |
|
Value |
Raymond James Financial, Inc.
|
|
|
5,600 |
|
$948,864 |
Regions Financial Corp.
|
|
|
25,829 |
|
707,456 |
S&P Global, Inc.
|
|
|
9,156 |
|
5,021,517 |
State Street Corp. (c)
|
|
|
8,533 |
|
981,039 |
Synchrony Financial
|
|
|
11,497 |
|
877,681 |
T. Rowe Price Group, Inc.
|
|
|
6,522 |
|
701,898 |
Travelers Cos., Inc.
|
|
|
6,582 |
|
1,787,079 |
Truist Financial Corp.
|
|
|
36,836 |
|
1,724,662 |
U.S. Bancorp
|
|
|
44,651 |
|
2,180,308 |
Visa, Inc. Class A
|
|
|
49,563 |
|
17,435,272 |
W.R. Berkley Corp.
|
|
|
9,375 |
|
672,094 |
Wells Fargo & Co.
|
|
|
94,422 |
|
7,759,600 |
Willis Towers Watson PLC
|
|
|
3,028 |
|
989,520 |
| |
|
|
|
|
222,314,393 |
| HEALTH CARE — 9.1% |
|
|
|
Abbott Laboratories
|
|
|
50,455 |
|
6,693,360 |
AbbVie, Inc.
|
|
|
51,442 |
|
10,823,397 |
Agilent Technologies, Inc.
|
|
|
8,436 |
|
1,060,068 |
Align Technology, Inc. (a)
|
|
|
1,772 |
|
251,553 |
Amgen, Inc.
|
|
|
15,451 |
|
4,445,407 |
Baxter International, Inc.
|
|
|
13,909 |
|
343,413 |
Becton Dickinson & Co.
|
|
|
8,550 |
|
1,649,979 |
Biogen, Inc. (a)
|
|
|
3,947 |
|
521,872 |
Bio-Techne Corp.
|
|
|
5,004 |
|
273,369 |
Boston Scientific Corp. (a)
|
|
|
42,698 |
|
4,504,639 |
Bristol-Myers Squibb Co.
|
|
|
58,473 |
|
2,758,756 |
Cardinal Health, Inc.
|
|
|
6,770 |
|
1,007,241 |
Cencora, Inc.
|
|
|
4,852 |
|
1,414,892 |
Centene Corp. (a)
|
|
|
14,296 |
|
415,156 |
Charles River Laboratories International, Inc. (a)
|
|
|
1,695 |
|
276,810 |
Cigna Group
|
|
|
7,873 |
|
2,368,750 |
Cooper Cos., Inc. (a)
|
|
|
5,600 |
|
377,412 |
CVS Health Corp.
|
|
|
37,369 |
|
2,733,542 |
Danaher Corp.
|
|
|
18,456 |
|
3,798,614 |
DaVita, Inc. (a)
|
|
|
1,472 |
|
202,783 |
Dexcom, Inc. (a)
|
|
|
11,420 |
|
860,383 |
Edwards Lifesciences Corp. (a)
|
|
|
17,508 |
|
1,424,101 |
Elevance Health, Inc.
|
|
|
6,482 |
|
2,065,489 |
Eli Lilly & Co.
|
|
|
22,876 |
|
16,758,500 |
GE HealthCare Technologies, Inc.
|
|
|
13,395 |
|
987,613 |
Gilead Sciences, Inc.
|
|
|
36,060 |
|
4,073,698 |
HCA Healthcare, Inc.
|
|
|
4,910 |
|
1,983,444 |
Henry Schein, Inc. (a)
|
|
|
4,200 |
|
292,236 |
Hologic, Inc. (a)
|
|
|
6,758 |
|
453,597 |
Humana, Inc.
|
|
|
3,665 |
|
1,112,914 |
IDEXX Laboratories, Inc. (a)
|
|
|
2,348 |
|
1,519,367 |
Incyte Corp. (a)
|
|
|
4,600 |
|
389,206 |
Insulet Corp. (a)
|
|
|
2,200 |
|
747,736 |
Intuitive Surgical, Inc. (a)
|
|
|
10,396 |
|
4,920,375 |
IQVIA Holdings, Inc. (a)
|
|
|
4,473 |
|
853,493 |
Johnson & Johnson
|
|
|
70,155 |
|
12,429,361 |
Labcorp Holdings, Inc.
|
|
|
2,574 |
|
715,546 |
McKesson Corp.
|
|
|
3,599 |
|
2,471,217 |
Medtronic PLC
|
|
|
37,039 |
|
3,437,590 |
| Security Description |
|
|
Shares |
|
Value |
Merck & Co., Inc.
|
|
|
73,436 |
|
$6,177,436 |
Mettler-Toledo International, Inc. (a)
|
|
|
590 |
|
767,614 |
Moderna, Inc. (a)
|
|
|
10,800 |
|
260,172 |
Molina Healthcare, Inc. (a)
|
|
|
1,797 |
|
324,952 |
Pfizer, Inc.
|
|
|
163,929 |
|
4,058,882 |
Quest Diagnostics, Inc.
|
|
|
3,310 |
|
601,228 |
Regeneron Pharmaceuticals, Inc.
|
|
|
3,090 |
|
1,794,363 |
ResMed, Inc.
|
|
|
4,289 |
|
1,177,373 |
Revvity, Inc. (b)
|
|
|
3,690 |
|
332,506 |
Solventum Corp. (a)
|
|
|
4,617 |
|
337,457 |
STERIS PLC
|
|
|
2,854 |
|
699,401 |
Stryker Corp.
|
|
|
9,945 |
|
3,892,572 |
Thermo Fisher Scientific, Inc.
|
|
|
10,815 |
|
5,328,767 |
UnitedHealth Group, Inc.
|
|
|
26,331 |
|
8,159,187 |
Universal Health Services, Inc. Class B
|
|
|
1,900 |
|
345,002 |
Vertex Pharmaceuticals, Inc. (a)
|
|
|
7,382 |
|
2,886,510 |
Viatris, Inc.
|
|
|
39,337 |
|
415,005 |
Waters Corp. (a)
|
|
|
1,867 |
|
563,461 |
West Pharmaceutical Services, Inc.
|
|
|
2,270 |
|
560,576 |
Zimmer Biomet Holdings, Inc.
|
|
|
5,927 |
|
628,855 |
Zoetis, Inc.
|
|
|
12,889 |
|
2,015,840 |
| |
|
|
|
|
144,744,038 |
| INDUSTRIALS — 8.5% |
|
|
|
3M Co.
|
|
|
15,869 |
|
2,468,106 |
A.O. Smith Corp.
|
|
|
4,100 |
|
292,289 |
Allegion PLC
|
|
|
2,315 |
|
393,087 |
AMETEK, Inc.
|
|
|
6,876 |
|
1,270,685 |
Automatic Data Processing, Inc.
|
|
|
11,734 |
|
3,567,723 |
Axon Enterprise, Inc. (a)
|
|
|
2,100 |
|
1,569,309 |
Boeing Co. (a)
|
|
|
22,198 |
|
5,209,427 |
Broadridge Financial Solutions, Inc.
|
|
|
3,400 |
|
869,108 |
Builders FirstSource, Inc. (a)
|
|
|
2,700 |
|
374,436 |
Carrier Global Corp.
|
|
|
23,625 |
|
1,540,350 |
Caterpillar, Inc.
|
|
|
13,627 |
|
5,710,258 |
CH Robinson Worldwide, Inc.
|
|
|
3,797 |
|
488,674 |
Cintas Corp.
|
|
|
9,888 |
|
2,076,777 |
Copart, Inc. (a)
|
|
|
25,624 |
|
1,250,707 |
CSX Corp.
|
|
|
55,033 |
|
1,789,123 |
Cummins, Inc.
|
|
|
4,134 |
|
1,647,151 |
Dayforce, Inc. (a)
|
|
|
4,300 |
|
300,011 |
Deere & Co.
|
|
|
7,292 |
|
3,490,243 |
Delta Air Lines, Inc.
|
|
|
18,849 |
|
1,164,491 |
Dover Corp.
|
|
|
4,075 |
|
728,854 |
Eaton Corp. PLC
|
|
|
11,273 |
|
3,935,855 |
Emerson Electric Co.
|
|
|
16,176 |
|
2,135,232 |
Equifax, Inc.
|
|
|
3,739 |
|
920,916 |
Expeditors International of Washington, Inc.
|
|
|
4,267 |
|
514,344 |
Fastenal Co.
|
|
|
34,038 |
|
1,690,327 |
FedEx Corp.
|
|
|
6,436 |
|
1,487,167 |
Fortive Corp.
|
|
|
10,091 |
|
482,955 |
See accompanying notes to financial statements.
3
STATE STREET S&P 500 INDEX FUND
SCHEDULE OF INVESTMENTS (continued)
August 31, 2025
| Security Description |
|
|
Shares |
|
Value |
GE Vernova, Inc.
|
|
|
7,900 |
|
$4,842,463 |
Generac Holdings, Inc. (a)
|
|
|
1,423 |
|
263,611 |
General Dynamics Corp.
|
|
|
7,190 |
|
2,333,658 |
General Electric Co.
|
|
|
31,199 |
|
8,585,965 |
Honeywell International, Inc.
|
|
|
18,820 |
|
4,130,990 |
Howmet Aerospace, Inc.
|
|
|
11,629 |
|
2,024,609 |
Hubbell, Inc.
|
|
|
1,600 |
|
689,584 |
Huntington Ingalls Industries, Inc.
|
|
|
1,279 |
|
346,340 |
IDEX Corp.
|
|
|
2,284 |
|
375,718 |
Illinois Tool Works, Inc.
|
|
|
7,901 |
|
2,091,000 |
Ingersoll Rand, Inc.
|
|
|
12,106 |
|
961,580 |
Jacobs Solutions, Inc.
|
|
|
3,016 |
|
441,030 |
JB Hunt Transport Services, Inc.
|
|
|
2,617 |
|
379,439 |
Johnson Controls International PLC
|
|
|
19,031 |
|
2,034,224 |
L3Harris Technologies, Inc.
|
|
|
5,331 |
|
1,479,992 |
Leidos Holdings, Inc.
|
|
|
3,500 |
|
633,220 |
Lennox International, Inc.
|
|
|
1,000 |
|
557,860 |
Lockheed Martin Corp.
|
|
|
6,180 |
|
2,815,793 |
Masco Corp.
|
|
|
5,915 |
|
434,102 |
Nordson Corp.
|
|
|
1,737 |
|
390,981 |
Norfolk Southern Corp.
|
|
|
6,485 |
|
1,815,670 |
Northrop Grumman Corp.
|
|
|
3,997 |
|
2,358,390 |
Old Dominion Freight Line, Inc.
|
|
|
5,500 |
|
830,335 |
Otis Worldwide Corp.
|
|
|
11,113 |
|
959,941 |
PACCAR, Inc.
|
|
|
14,919 |
|
1,491,602 |
Parker-Hannifin Corp.
|
|
|
3,675 |
|
2,790,611 |
Paychex, Inc.
|
|
|
9,263 |
|
1,291,772 |
Paycom Software, Inc.
|
|
|
1,322 |
|
300,292 |
Pentair PLC
|
|
|
4,363 |
|
469,153 |
Quanta Services, Inc.
|
|
|
4,454 |
|
1,683,434 |
Republic Services, Inc.
|
|
|
5,857 |
|
1,370,362 |
Rockwell Automation, Inc.
|
|
|
3,263 |
|
1,120,612 |
Rollins, Inc.
|
|
|
8,825 |
|
498,965 |
RTX Corp.
|
|
|
38,697 |
|
6,137,344 |
Snap-on, Inc.
|
|
|
1,606 |
|
522,335 |
Southwest Airlines Co.
|
|
|
16,127 |
|
530,578 |
Stanley Black & Decker, Inc.
|
|
|
5,068 |
|
376,502 |
Textron, Inc.
|
|
|
5,563 |
|
445,930 |
Trane Technologies PLC
|
|
|
6,460 |
|
2,684,776 |
TransDigm Group, Inc.
|
|
|
1,637 |
|
2,289,967 |
Uber Technologies, Inc. (a)
|
|
|
60,600 |
|
5,681,250 |
Union Pacific Corp.
|
|
|
17,139 |
|
3,831,766 |
United Airlines Holdings, Inc. (a)
|
|
|
9,417 |
|
988,785 |
United Parcel Service, Inc. Class B
|
|
|
21,634 |
|
1,891,677 |
United Rentals, Inc.
|
|
|
1,867 |
|
1,785,487 |
Veralto Corp.
|
|
|
6,685 |
|
709,880 |
Verisk Analytics, Inc.
|
|
|
4,105 |
|
1,100,633 |
Waste Management, Inc.
|
|
|
10,838 |
|
2,453,615 |
Westinghouse Air Brake Technologies Corp.
|
|
|
5,182 |
|
1,002,717 |
WW Grainger, Inc.
|
|
|
1,311 |
|
1,328,698 |
Xylem, Inc.
|
|
|
6,934 |
|
981,577 |
| |
|
|
|
|
134,904,420 |
| Security Description |
|
|
Shares |
|
Value |
| INFORMATION TECHNOLOGY — 33.5% |
|
|
|
Accenture PLC Class A
|
|
|
18,166 |
|
$4,722,615 |
Adobe, Inc. (a)
|
|
|
12,340 |
|
4,401,678 |
Advanced Micro Devices, Inc. (a)
|
|
|
47,068 |
|
7,654,669 |
Akamai Technologies, Inc. (a)
|
|
|
4,784 |
|
378,558 |
Amphenol Corp. Class A
|
|
|
35,430 |
|
3,856,910 |
Analog Devices, Inc.
|
|
|
14,291 |
|
3,591,471 |
Apple, Inc.
|
|
|
434,244 |
|
100,805,402 |
Applied Materials, Inc.
|
|
|
23,374 |
|
3,757,604 |
Arista Networks, Inc. (a)
|
|
|
30,108 |
|
4,111,247 |
Autodesk, Inc. (a)
|
|
|
6,189 |
|
1,947,678 |
Broadcom, Inc.
|
|
|
136,862 |
|
40,701,390 |
Cadence Design Systems, Inc. (a)
|
|
|
8,027 |
|
2,812,902 |
CDW Corp.
|
|
|
4,047 |
|
666,784 |
Cisco Systems, Inc.
|
|
|
115,822 |
|
8,002,142 |
Cognizant Technology Solutions Corp. Class A
|
|
|
14,697 |
|
1,061,858 |
Corning, Inc.
|
|
|
21,676 |
|
1,452,942 |
Crowdstrike Holdings, Inc. Class A (a)
|
|
|
7,100 |
|
3,008,270 |
Datadog, Inc. Class A (a)
|
|
|
9,300 |
|
1,271,124 |
Dell Technologies, Inc. Class C
|
|
|
9,000 |
|
1,099,350 |
Enphase Energy, Inc. (a)
|
|
|
4,455 |
|
167,954 |
EPAM Systems, Inc. (a)
|
|
|
1,468 |
|
258,896 |
F5, Inc. (a)
|
|
|
1,755 |
|
549,561 |
Fair Isaac Corp. (a)
|
|
|
700 |
|
1,065,148 |
First Solar, Inc. (a)
|
|
|
3,300 |
|
644,127 |
Fortinet, Inc. (a)
|
|
|
18,173 |
|
1,431,487 |
Gartner, Inc. (a)
|
|
|
2,100 |
|
527,499 |
Gen Digital, Inc.
|
|
|
17,519 |
|
529,074 |
GoDaddy, Inc. Class A (a)
|
|
|
4,064 |
|
602,732 |
Hewlett Packard Enterprise Co.
|
|
|
36,733 |
|
829,064 |
HP, Inc.
|
|
|
28,392 |
|
810,308 |
Intel Corp. (a)
|
|
|
128,332 |
|
3,124,884 |
International Business Machines Corp.
|
|
|
26,920 |
|
6,554,751 |
Intuit, Inc.
|
|
|
8,063 |
|
5,378,021 |
Jabil, Inc.
|
|
|
3,130 |
|
641,118 |
Keysight Technologies, Inc. (a)
|
|
|
5,114 |
|
835,781 |
KLA Corp.
|
|
|
3,868 |
|
3,372,896 |
Lam Research Corp.
|
|
|
37,050 |
|
3,710,557 |
Microchip Technology, Inc.
|
|
|
16,412 |
|
1,066,780 |
Micron Technology, Inc.
|
|
|
32,690 |
|
3,890,437 |
Microsoft Corp.
|
|
|
216,154 |
|
109,523,070 |
Monolithic Power Systems, Inc.
|
|
|
1,287 |
|
1,075,623 |
Motorola Solutions, Inc.
|
|
|
4,854 |
|
2,293,321 |
NetApp, Inc.
|
|
|
6,087 |
|
686,553 |
NVIDIA Corp.
|
|
|
709,245 |
|
123,536,294 |
NXP Semiconductors NV
|
|
|
7,200 |
|
1,690,920 |
ON Semiconductor Corp. (a)
|
|
|
12,316 |
|
610,750 |
Oracle Corp.
|
|
|
47,212 |
|
10,676,050 |
Palantir Technologies, Inc. Class A (a)
|
|
|
61,762 |
|
9,678,723 |
Palo Alto Networks, Inc. (a)
|
|
|
19,532 |
|
3,721,237 |
PTC, Inc. (a)
|
|
|
3,479 |
|
742,767 |
See accompanying notes to financial statements.
4
STATE STREET S&P 500 INDEX FUND
SCHEDULE OF INVESTMENTS (continued)
August 31, 2025
| Security Description |
|
|
Shares |
|
Value |
QUALCOMM, Inc.
|
|
|
31,826 |
|
$5,115,393 |
Roper Technologies, Inc.
|
|
|
3,191 |
|
1,679,455 |
Salesforce, Inc.
|
|
|
27,820 |
|
7,128,875 |
Seagate Technology Holdings PLC
|
|
|
6,121 |
|
1,024,655 |
ServiceNow, Inc. (a)
|
|
|
6,052 |
|
5,552,468 |
Skyworks Solutions, Inc.
|
|
|
5,143 |
|
385,416 |
Super Micro Computer, Inc. (a) (b)
|
|
|
13,900 |
|
577,406 |
Synopsys, Inc. (a)
|
|
|
5,431 |
|
3,277,717 |
TE Connectivity PLC
|
|
|
8,854 |
|
1,828,351 |
Teledyne Technologies, Inc. (a)
|
|
|
1,453 |
|
781,961 |
Teradyne, Inc.
|
|
|
5,098 |
|
602,788 |
Texas Instruments, Inc.
|
|
|
26,353 |
|
5,335,955 |
Trimble, Inc. (a)
|
|
|
6,891 |
|
556,931 |
Tyler Technologies, Inc. (a)
|
|
|
1,344 |
|
756,511 |
VeriSign, Inc.
|
|
|
2,490 |
|
680,691 |
Western Digital Corp.
|
|
|
10,717 |
|
861,004 |
Workday, Inc. Class A (a)
|
|
|
6,300 |
|
1,454,166 |
Zebra Technologies Corp. Class A (a)
|
|
|
1,647 |
|
522,247 |
| |
|
|
|
|
533,652,967 |
| MATERIALS — 1.9% |
|
|
|
Air Products & Chemicals, Inc.
|
|
|
6,548 |
|
1,925,832 |
Albemarle Corp.
|
|
|
3,730 |
|
316,752 |
Amcor PLC
|
|
|
68,308 |
|
589,498 |
Avery Dennison Corp.
|
|
|
2,581 |
|
443,029 |
Ball Corp.
|
|
|
8,326 |
|
438,281 |
CF Industries Holdings, Inc.
|
|
|
4,861 |
|
421,108 |
Corteva, Inc.
|
|
|
19,461 |
|
1,443,811 |
Dow, Inc.
|
|
|
21,391 |
|
526,860 |
DuPont de Nemours, Inc.
|
|
|
12,702 |
|
977,038 |
Eastman Chemical Co.
|
|
|
3,755 |
|
264,127 |
Ecolab, Inc.
|
|
|
7,402 |
|
2,050,650 |
Freeport-McMoRan, Inc.
|
|
|
42,729 |
|
1,897,167 |
International Flavors & Fragrances, Inc.
|
|
|
7,817 |
|
527,726 |
International Paper Co. (b)
|
|
|
15,912 |
|
790,508 |
Linde PLC
|
|
|
13,646 |
|
6,526,745 |
LyondellBasell Industries NV Class A
|
|
|
7,022 |
|
395,690 |
Martin Marietta Materials, Inc.
|
|
|
1,702 |
|
1,049,113 |
Mosaic Co.
|
|
|
9,816 |
|
327,854 |
Newmont Corp.
|
|
|
33,177 |
|
2,468,369 |
Nucor Corp.
|
|
|
7,049 |
|
1,048,398 |
Packaging Corp. of America
|
|
|
2,700 |
|
588,492 |
PPG Industries, Inc.
|
|
|
7,094 |
|
789,066 |
Sherwin-Williams Co.
|
|
|
6,624 |
|
2,423,258 |
Smurfit WestRock PLC
|
|
|
13,453 |
|
637,134 |
Steel Dynamics, Inc.
|
|
|
4,300 |
|
562,956 |
Vulcan Materials Co.
|
|
|
3,690 |
|
1,074,380 |
| |
|
|
|
|
30,503,842 |
| REAL ESTATE — 2.0% |
|
|
|
Alexandria Real Estate Equities, Inc. REIT
|
|
|
4,770 |
|
393,239 |
| Security Description |
|
|
Shares |
|
Value |
American Tower Corp. REIT
|
|
|
13,460 |
|
$2,743,821 |
AvalonBay Communities, Inc. REIT
|
|
|
4,228 |
|
828,054 |
BXP, Inc. REIT
|
|
|
4,739 |
|
343,625 |
Camden Property Trust REIT
|
|
|
3,529 |
|
395,177 |
CBRE Group, Inc. Class A (a)
|
|
|
8,337 |
|
1,351,594 |
CoStar Group, Inc. (a)
|
|
|
12,153 |
|
1,087,572 |
Crown Castle, Inc. REIT
|
|
|
12,719 |
|
1,260,962 |
Digital Realty Trust, Inc. REIT
|
|
|
9,362 |
|
1,569,446 |
Equinix, Inc. REIT
|
|
|
2,900 |
|
2,279,951 |
Equity Residential REIT
|
|
|
9,682 |
|
640,174 |
Essex Property Trust, Inc. REIT
|
|
|
1,975 |
|
533,665 |
Extra Space Storage, Inc. REIT
|
|
|
5,994 |
|
860,619 |
Federal Realty Investment Trust REIT
|
|
|
1,900 |
|
191,045 |
Healthpeak Properties, Inc. REIT
|
|
|
20,531 |
|
368,326 |
Host Hotels & Resorts, Inc. REIT
|
|
|
22,759 |
|
391,682 |
Invitation Homes, Inc. REIT
|
|
|
15,523 |
|
485,715 |
Iron Mountain, Inc. REIT
|
|
|
8,374 |
|
773,171 |
Kimco Realty Corp. REIT
|
|
|
20,350 |
|
457,672 |
Mid-America Apartment Communities, Inc. REIT
|
|
|
3,664 |
|
534,284 |
Prologis, Inc. REIT
|
|
|
27,226 |
|
3,097,774 |
Public Storage REIT
|
|
|
4,446 |
|
1,309,747 |
Realty Income Corp. REIT
|
|
|
25,500 |
|
1,498,380 |
Regency Centers Corp. REIT
|
|
|
4,363 |
|
316,318 |
SBA Communications Corp. REIT
|
|
|
2,965 |
|
607,380 |
Simon Property Group, Inc. REIT
|
|
|
8,741 |
|
1,579,149 |
UDR, Inc. REIT
|
|
|
9,900 |
|
391,743 |
Ventas, Inc. REIT
|
|
|
13,102 |
|
891,984 |
VICI Properties, Inc. REIT
|
|
|
29,766 |
|
1,005,495 |
Welltower, Inc. REIT
|
|
|
18,181 |
|
3,059,499 |
Weyerhaeuser Co. REIT
|
|
|
21,067 |
|
545,003 |
| |
|
|
|
|
31,792,266 |
| UTILITIES — 2.3% |
|
|
|
AES Corp.
|
|
|
21,959 |
|
297,325 |
Alliant Energy Corp.
|
|
|
7,500 |
|
488,025 |
Ameren Corp.
|
|
|
7,640 |
|
762,319 |
American Electric Power Co., Inc.
|
|
|
16,038 |
|
1,780,539 |
American Water Works Co., Inc.
|
|
|
5,887 |
|
844,843 |
Atmos Energy Corp.
|
|
|
4,300 |
|
714,359 |
CenterPoint Energy, Inc.
|
|
|
17,886 |
|
674,481 |
CMS Energy Corp.
|
|
|
8,501 |
|
608,417 |
Consolidated Edison, Inc.
|
|
|
10,372 |
|
1,018,842 |
Constellation Energy Corp.
|
|
|
9,055 |
|
2,788,759 |
Dominion Energy, Inc. (b)
|
|
|
24,411 |
|
1,462,219 |
DTE Energy Co.
|
|
|
5,759 |
|
786,967 |
Duke Energy Corp.
|
|
|
22,905 |
|
2,805,633 |
Edison International
|
|
|
11,249 |
|
631,406 |
Entergy Corp.
|
|
|
12,184 |
|
1,073,289 |
Evergy, Inc.
|
|
|
6,074 |
|
432,833 |
See accompanying notes to financial statements.
5
STATE STREET S&P 500 INDEX FUND
SCHEDULE OF INVESTMENTS (continued)
August 31, 2025
| Security Description |
|
|
Shares |
|
Value |
Eversource Energy
|
|
|
10,196 |
|
$653,258 |
Exelon Corp.
|
|
|
29,464 |
|
1,286,987 |
FirstEnergy Corp.
|
|
|
14,960 |
|
652,555 |
NextEra Energy, Inc.
|
|
|
59,574 |
|
4,292,307 |
NiSource, Inc.
|
|
|
14,178 |
|
599,304 |
NRG Energy, Inc.
|
|
|
5,298 |
|
771,177 |
PG&E Corp.
|
|
|
65,449 |
|
1,000,061 |
Pinnacle West Capital Corp. (b)
|
|
|
2,969 |
|
265,310 |
PPL Corp.
|
|
|
20,604 |
|
751,428 |
Public Service Enterprise Group, Inc.
|
|
|
14,970 |
|
1,232,480 |
Sempra
|
|
|
18,152 |
|
1,498,629 |
Southern Co.
|
|
|
32,552 |
|
3,004,550 |
Vistra Corp.
|
|
|
9,800 |
|
1,853,278 |
WEC Energy Group, Inc.
|
|
|
9,270 |
|
987,348 |
Xcel Energy, Inc.
|
|
|
16,624 |
|
1,203,411 |
| |
|
|
|
|
37,222,339 |
TOTAL COMMON STOCKS
(Cost $249,947,271)
|
|
|
|
|
1,593,840,193 |
| SHORT-TERM INVESTMENTS — 0.3% |
|
|
|
|
|
State Street Institutional U.S. Government Money Market Fund, Class G Shares 4.27% (d) (e)
|
|
|
1,437,430 |
|
1,437,430 |
| Security Description |
|
|
Shares |
|
Value |
State Street Navigator Securities Lending Portfolio II (c) (f)
|
|
|
3,607,169 |
|
$3,607,169 |
TOTAL SHORT-TERM INVESTMENTS
(Cost $5,044,599)
|
|
5,044,599 |
|
TOTAL INVESTMENTS — 100.3%
(Cost $254,991,870)
|
|
1,598,884,792 |
|
LIABILITIES IN EXCESS OF OTHER ASSETS —
(0.3)%
|
|
|
|
|
(4,234,008) |
NET ASSETS — 100.0%
|
|
|
|
|
$1,594,650,784 |
| (a) |
Non-income producing security. |
| (b) |
All or a portion of the shares of the security are on loan at August 31, 2025. |
| (c) |
The Fund invested in an affiliated entity. Amounts related to these investments during the year ended August 31, 2025 are shown in the Affiliate Table below. |
| (d) |
The Fund invested in certain money market funds managed by SSGA Funds Management, Inc. Amounts related to these investments during the year ended August 31, 2025 are shown in the Affiliate Table below. |
| (e) |
The rate shown is the annualized seven-day yield at August 31, 2025. |
| (f) |
Investment of cash collateral for securities loaned. |
| REIT |
Real Estate Investment Trust |
At August 31, 2025, open futures contracts were as follows:
| Description |
|
Number of
Contracts |
|
Expiration
Date |
|
Notional
Amount |
|
Value |
|
Unrealized
Appreciation
(Depreciation) |
| E-mini S&P 500 Index (long) |
|
15 |
|
09/19/2025 |
|
$4,552,388 |
|
$4,853,312 |
|
$300,924 |
During the year ended August 31, 2025, the average notional value related to futures contracts was $9,530,738.
The following table summarizes the value of the Fund's investments according to the fair value hierarchy as of August 31, 2025.
| Description |
|
Level 1 –
Quoted Prices |
|
Level 2 –
Other Significant
Observable Inputs |
|
Level 3 –
Significant
Unobservable Inputs |
|
Total |
| ASSETS: |
|
|
|
|
|
|
|
|
| INVESTMENTS: |
|
|
|
|
|
|
|
|
Common Stocks
|
|
$1,593,840,193 |
|
$— |
|
$— |
|
$1,593,840,193 |
Short-Term Investments
|
|
5,044,599 |
|
— |
|
— |
|
5,044,599 |
TOTAL INVESTMENTS
|
|
$1,598,884,792 |
|
$— |
|
$— |
|
$1,598,884,792 |
| OTHER FINANCIAL INSTRUMENTS: |
|
|
|
|
|
|
|
|
Futures Contracts - Unrealized Appreciation
|
|
$300,924 |
|
$— |
|
$— |
|
$300,924 |
TOTAL OTHER FINANCIAL INSTRUMENTS:
|
|
$300,924 |
|
$— |
|
$— |
|
$300,924 |
See accompanying notes to financial statements.
6
STATE STREET S&P 500 INDEX FUND
SCHEDULE OF INVESTMENTS (continued)
August 31, 2025
Affiliate Table
| |
Number of
Shares Held
at
8/31/24 |
|
Value at
8/31/24 |
|
Cost of
Purchases |
|
Proceeds
from
Shares Sold |
|
Realized
Gain (Loss) |
|
Change in
Unrealized
Appreciation/
Depreciation |
|
Number of
Shares Held
at
8/31/25 |
|
Value at
8/31/25 |
|
Dividend
Income |
State Street Corp.
|
9,633 |
|
$839,034 |
|
$— |
|
$108,015 |
|
$79,689 |
|
$170,331 |
|
8,533 |
|
$981,039 |
|
$26,776 |
State Street Institutional U.S. Government Money Market Fund, Class G Shares
|
7,973,574 |
|
7,973,574 |
|
125,684,560 |
|
132,220,704 |
|
— |
|
— |
|
1,437,430 |
|
1,437,430 |
|
303,489 |
State Street Navigator Securities Lending Portfolio II
|
1,545,919 |
|
1,545,919 |
|
92,594,010 |
|
90,532,760 |
|
— |
|
— |
|
3,607,169 |
|
3,607,169 |
|
3,915 |
Total
|
|
|
$10,358,527 |
|
$218,278,570 |
|
$222,861,479 |
|
$79,689 |
|
$170,331 |
|
|
|
$6,025,638 |
|
$334,180 |
See accompanying notes to financial statements.
7
State Street S&P 500 Index Fund
Statement of Assets and Liabilities
August 31, 2025
| ASSETS |
|
Investments in unaffiliated issuers, at value*
|
$1,592,859,154 |
Investments in affiliated issuers, at value
|
6,025,638 |
Total Investments
|
1,598,884,792 |
Net cash at broker
|
15,915 |
Cash
|
13 |
Receivable from broker — accumulated variation margin on futures contracts
|
302,175 |
Receivable for fund shares sold
|
199,585 |
Dividends receivable — unaffiliated issuers
|
1,576,200 |
Dividends receivable — affiliated issuers
|
15,066 |
Securities lending income receivable — unaffiliated issuers
|
42 |
Securities lending income receivable — affiliated issuers
|
257 |
Receivable from Adviser
|
5,861 |
Receivable for foreign taxes recoverable
|
2,318 |
Prepaid expenses and other assets
|
13,614 |
TOTAL ASSETS
|
1,601,015,838 |
| LIABILITIES |
|
Payable upon return of securities loaned
|
3,607,169 |
Payable for fund shares repurchased
|
2,333,257 |
Advisory fee payable
|
159,246 |
Custodian fees payable
|
25,298 |
Administration fees payable
|
46,247 |
Shareholder servicing fee payable
|
32,309 |
Distribution fees payable
|
49,603 |
Trustees’ fees and expenses payable
|
189 |
Transfer agent fees payable
|
27,480 |
Registration and filing fees payable
|
752 |
Professional fees payable
|
48,107 |
Printing and postage fees payable
|
31,891 |
Accrued expenses and other liabilities
|
3,506 |
TOTAL LIABILITIES
|
6,365,054 |
NET ASSETS
|
$1,594,650,784 |
| NET ASSETS CONSIST OF: |
|
Paid-in capital
|
$181,170,231 |
Total distributable earnings (loss)
|
1,413,480,553 |
NET ASSETS
|
$1,594,650,784 |
| NET ASSET VALUE PER SHARE |
|
Net asset value per share
|
$283.11 |
Shares outstanding (unlimited amount authorized, $0.01 par value)
|
5,632,662 |
| COST OF INVESTMENTS: |
|
Investments in unaffiliated issuers
|
$249,727,547 |
Investments in affiliated issuers
|
5,264,323 |
Total cost of investments
|
$254,991,870 |
* Includes investments in securities on loan, at value
|
$4,362,053 |
See accompanying notes to financial statements.
8
State Street S&P 500 Index Fund
Statement of Operations
For the Year Ended August 31, 2025
| INVESTMENT INCOME |
|
Interest income — unaffiliated issuers
|
$25,794 |
Dividend income — unaffiliated issuers
|
19,669,745 |
Dividend income — affiliated issuers
|
330,265 |
Unaffiliated securities lending income
|
715 |
Affiliated securities lending income
|
3,915 |
Foreign taxes withheld
|
(4,277) |
TOTAL INVESTMENT INCOME (LOSS)
|
20,026,157 |
| EXPENSES |
|
Advisory fee
|
456,250 |
Administration fees
|
760,417 |
Shareholder servicing fees
|
365,000 |
Distribution fees
|
562,709 |
Custodian fees
|
76,328 |
Trustees’ fees and expenses
|
28,338 |
Transfer agent fees
|
130,384 |
Registration and filing fees
|
61,574 |
Professional fees and expenses
|
46,314 |
Printing and postage fees
|
75,805 |
Insurance expense
|
16,514 |
Miscellaneous expenses
|
36,761 |
TOTAL EXPENSES
|
2,616,394 |
Expenses waived/reimbursed by the Adviser
|
(228,684) |
NET EXPENSES
|
2,387,710 |
NET INVESTMENT INCOME (LOSS)
|
$17,638,447 |
| REALIZED AND UNREALIZED GAIN (LOSS) |
|
| Net realized gain (loss) on: |
|
Investments — unaffiliated issuers
|
111,956,455 |
Investments — affiliated issuers
|
79,689 |
Futures contracts
|
350,762 |
Net realized gain (loss)
|
112,386,906 |
| Net change in unrealized appreciation/depreciation on: |
|
Investments — unaffiliated issuers
|
91,885,048 |
Investments — affiliated issuers
|
170,331 |
Futures contracts
|
(8,154) |
Net change in unrealized appreciation/depreciation
|
92,047,225 |
NET REALIZED AND UNREALIZED GAIN (LOSS)
|
204,434,131 |
NET INCREASE (DECREASE) IN NET ASSETS FROM OPERATIONS
|
$222,072,578 |
See accompanying notes to financial statements.
9
State Street S&P 500 Index Fund
Statements of Changes in Net Assets
| |
Year Ended
8/31/25 |
|
Year Ended
8/31/24 |
| INCREASE (DECREASE) IN NET ASSETS FROM OPERATIONS: |
|
|
|
Net investment income (loss)
|
$17,638,447 |
|
$18,527,811 |
Net realized gain (loss)
|
112,386,906 |
|
118,436,290 |
Net change in unrealized appreciation/depreciation
|
92,047,225 |
|
198,853,887 |
Net increase (decrease) in net assets resulting from operations
|
222,072,578 |
|
335,817,988 |
Distributions to shareholders
|
(133,943,905) |
|
(151,157,900) |
| FROM BENEFICIAL INTEREST TRANSACTIONS: |
|
|
|
Proceeds from shares sold
|
130,670,057 |
|
107,122,353 |
Reinvestment of distributions
|
131,139,786 |
|
149,126,681 |
Cost of shares redeemed
|
(273,063,542) |
|
(253,017,705) |
Net increase (decrease) in net assets from beneficial interest transactions
|
(11,253,699) |
|
3,231,329 |
Net increase (decrease) in net assets during the period
|
76,874,974 |
|
187,891,417 |
Net assets at beginning of period
|
1,517,775,810 |
|
1,329,884,393 |
NET ASSETS AT END OF PERIOD
|
$1,594,650,784 |
|
$1,517,775,810 |
| SHARES OF BENEFICIAL INTEREST: |
|
|
|
Shares sold
|
495,763 |
|
447,019 |
Reinvestment of distributions
|
501,731 |
|
660,848 |
Shares redeemed
|
(1,038,820) |
|
(1,046,009) |
Net increase (decrease)
|
(41,326) |
|
61,858 |
See accompanying notes to financial statements.
10
State Street S&P 500 Index Fund
Financial Highlights
Selected data for a share outstanding throughout each period
| |
Year
Ended
8/31/25 |
|
Year
Ended
8/31/24 |
|
Year
Ended
8/31/23 |
|
Year
Ended
8/31/22 |
|
Year
Ended
8/31/21 |
Net asset value, beginning of period
|
$267.50 |
|
$236.97 |
|
$226.34 |
|
$286.85 |
|
$253.59 |
| Income (loss) from investment operations: |
|
|
|
|
|
|
|
|
|
Net investment income (loss) (a)
|
3.07 |
|
3.22 |
|
3.43 |
|
3.36 |
|
3.43 |
Net realized and unrealized gain (loss)
|
36.67 |
|
55.11 |
|
28.42 |
|
(32.17) |
|
66.60 |
Total from investment operations
|
39.74 |
|
58.33 |
|
31.85 |
|
(28.81) |
|
70.03 |
| Distributions to shareholders from: |
|
|
|
|
|
|
|
|
|
Net investment income
|
(3.18) |
|
(3.33) |
|
(3.43) |
|
(4.54) |
|
(2.88) |
Net realized gains
|
(20.95) |
|
(24.47) |
|
(17.79) |
|
(27.16) |
|
(33.89) |
Total distributions
|
(24.13) |
|
(27.80) |
|
(21.22) |
|
(31.70) |
|
(36.77) |
Net asset value, end of period
|
$283.11 |
|
$267.50 |
|
$236.97 |
|
$226.34 |
|
$286.85 |
Total return (b)
|
15.69% |
|
26.92% |
|
15.81% |
|
(11.36)% |
|
31.01% |
| Ratios and Supplemental Data: |
|
|
|
|
|
|
|
|
|
Net assets, end of period (in 000s)
|
$1,594,651 |
|
$1,517,776 |
|
$1,329,884 |
|
$1,370,769 |
|
$1,709,109 |
| Ratios to average net assets: |
|
|
|
|
|
|
|
|
|
Total expenses
|
0.17% |
|
0.16% |
|
0.17% |
|
0.17% |
|
0.18% |
Net expenses
|
0.16%(c)(d) |
|
0.16%(c)(d) |
|
0.16%(c)(d) |
|
0.16%(c)(d) |
|
0.16%(c)(d) |
Net investment income (loss)
|
1.16%(c)(d) |
|
1.33%(c)(d) |
|
1.56%(c)(d) |
|
1.31%(c)(d) |
|
1.33%(c)(d) |
Portfolio turnover rate
|
2% |
|
2% |
|
2% |
|
2% |
|
4% |
| (a) |
Per share numbers have been calculated using average shares outstanding, which more appropriately presents the per share data for the year. |
| (b) |
Total return is calculated assuming a purchase of shares at net asset value on the first day and a sale at net asset value on the last day of each period reported. Distributions are assumed, for the purpose of this calculation, to be reinvested at net asset value per share on the respective payment dates of the Fund. Results represent past performance and are not indicative of future results. |
| (c) |
Reflects amounts waived by the administrator. |
| (d) |
Reflects amounts waived and/or reimbursed by the investment adviser. |
See accompanying notes to financial statements.
11
SSGA FUNDS
STATE STREET S&P 500 INDEX FUND
Notes to Financial Statements — August 31, 2025
1. Organization
The SSGA Funds (the “Trust”), a Massachusetts business trust registered under the Investment Company Act of 1940, as amended (the “1940 Act”), is an open-end management investment company.
As of August 31, 2025, the Trust consists of two (2) series (and corresponding classes, each of which have the same rights and privileges, including voting rights), each of which represents a separate series of beneficial interest in the Trust. The Declaration of Trust permits the Board of Trustees of the Trust (the “Board” and each member thereof, a “Trustee”) to authorize the issuance of an unlimited number of shares of beneficial interest at $0.001 par value. The financial statements herein relate to the following series (the “Fund”):
| Fund |
Classes |
Commencement of Operations |
Diversification Classification |
| State Street S&P 500 Index Fund |
Class N |
December 30, 1992 |
Diversified |
Under the Trust’s organizational documents, its officers and Trustees are indemnified against certain liabilities arising out of the performance of their duties to the Trust. Additionally, in the normal course of business, the Trust enters into contracts with service providers that contain general indemnification clauses. The Trust’s maximum exposure under these arrangements is unknown as this would involve future claims that may be made against the Trust that have not yet occurred.
2. Segment Reporting
The Fund has one reportable segment. Business activities are managed on a consolidated basis and revenues are derived primarily through the Fund's investments in accordance with its investment objective. The Fund's chief operating decision maker (“CODM”) is the President of the Trust. The CODM assesses performance based on the Fund's Total Return as reported in the Financial Highlights, and the same accounting policies are applied as described in the summary of significant accounting policies. The Fund's Total Return is utilized by the CODM to compare results, including the impact of the Fund's costs, to the Fund's competitors and to the Fund's benchmark index.
3. Summary of Significant Accounting Policies
The following is a summary of significant accounting policies followed by the Trust in the preparation of its financial statements:
The preparation of financial statements in accordance with U.S. generally accepted accounting principles (“U.S. GAAP”) requires management to make estimates and assumptions that affect the reported amounts and disclosures in the financial statements. Actual results could differ from those estimates. The Fund is an investment company under U.S. GAAP and follows the accounting and reporting guidance applicable to investment companies.
Security Valuation
The Fund's investments are valued at fair value each day that the New York Stock Exchange (“NYSE”) is open and, for financial reporting purposes, as of the report date should the reporting period end on a day that the NYSE is not open. Fair value is generally defined as the price the Fund would receive to sell an asset or pay to transfer a liability in an orderly transaction between market participants at the measurement date. By its nature, a fair value price is a good faith estimate of the valuation in a current sale and may not reflect an actual market price. The investments of the Fund are valued pursuant to the policy and procedures developed by the Oversight Committee (the “Committee”) and approved by the Board. The Committee provides oversight of the valuation of investments for the Fund. The Board has responsibility for overseeing the determination of the fair value of investments.
Valuation techniques used to value the Fund's investments by major category are as follows:
• Equity investments traded on a recognized securities exchange for which market quotations are readily available are valued at the last sale price or official closing price, as applicable, on the primary market or exchange on which they trade. Equity investments traded on a recognized exchange for which there were no sales on that day are valued at the last published sale price or at fair value.
• Investments in registered investment companies (including money market funds) or other unitized pooled investment vehicles that are not traded on an exchange are valued at that day’s published net asset value
SSGA FUNDS
STATE STREET S&P 500 INDEX FUND (continued)
Notes to Financial Statements — August 31, 2025
(“NAV”) per share or unit.
• Exchange-traded futures contracts are valued at the closing settlement price on the primary market on which they are traded most extensively. Exchange-traded futures contracts traded on a recognized exchange for which there were no sales on that day are valued at the last reported sale price obtained from independent pricing services or brokers or at fair value.
In the event prices or quotations are not readily available or that the application of these valuation methods results in a price for an investment that is deemed to be not representative of the fair value of such investment, fair value will be determined in good faith by the Committee, in accordance with the valuation policy and procedures approved by the Board.
Various inputs are used in determining the value of the Fund's investments.
The Fund values its assets and liabilities at fair value using a fair value hierarchy consisting of three broad levels that prioritize the inputs to valuation techniques giving the highest priority to readily available unadjusted quoted prices in active markets for identical assets or liabilities (Level 1 measurements) and the lowest priority to unobservable inputs (Level 3 measurements) when market prices are not readily available or reliable. The categorization of a value determined for an investment within the hierarchy is based upon the pricing transparency of the investment and is not necessarily an indication of the risk associated with investing in it.
The three levels of the fair value hierarchy are as follows:
• Level 1 – Unadjusted quoted prices in active markets for an identical asset or liability;
• Level 2 – Inputs other than quoted prices included within Level 1 that are observable for the asset or liability either directly or indirectly, including quoted prices for similar assets or liabilities in active markets, quoted prices for identical or similar assets or liabilities in markets that are not considered to be active, inputs other than quoted prices that are observable for the asset or liability (such as exchange rates, financing terms, interest rates, yield curves, volatilities, prepayment speeds, loss severities, credit risks and default rates) or other market-corroborated inputs; and
• Level 3 – Unobservable inputs for the asset or liability, including the Committee’s assumptions used in determining the fair value of investments.
The value of the Fund’s investments according to the fair value hierarchy as of August 31, 2025 is disclosed in the Fund’s Schedule of Investments.
Investment Transactions and Income Recognition
Investment transactions are accounted for on the trade date for financial reporting purposes. Realized gains and losses from the sale and disposition of investments are determined using the identified cost method. Dividend income and capital gain distributions, if any, are recognized on the ex-dividend date, or when the information becomes available, net of any foreign taxes withheld at source, if any. Non-cash dividends received in the form of stock, if any, are recorded as dividend income at fair value.
The Fund invests in real estate investment trusts (“REITs”). REITs determine the tax character of their distributions annually and may characterize a portion of their distributions as a return of capital or capital gain. The Fund’s policy is to record all REIT distributions initially as dividend income and re-designate a portion of the capital or capital gains distributions at year end based on information provided by the REIT and/or SSGA Funds Management, Inc.’s (the “Adviser” or “SSGA FM”) estimates of such re-designations for which actual information has not yet been reported.
Expenses
Certain expenses, which are directly identifiable to a specific Fund, are applied to that Fund within the Trust. Other expenses which cannot be attributed to a specific Fund are allocated in such a manner as deemed equitable, taking into consideration the nature and type of expense and relative net assets of the Fund within the Trust.
SSGA FUNDS
STATE STREET S&P 500 INDEX FUND (continued)
Notes to Financial Statements — August 31, 2025
Distributions
Distributions from net investment income, if any, are declared and paid quarterly. Net realized capital gains, if any, are distributed annually, unless additional distributions are required for compliance with applicable tax regulations. The amount and character of income and capital gains to be distributed are determined in accordance with applicable tax regulations which may differ from net investment income and realized gains recognized for U.S. GAAP purposes.
4. Derivative Financial Instruments
Futures Contracts
The Fund may enter into futures contracts to meet its objectives. A futures contract is a standardized, exchange-traded agreement to buy or sell a financial instrument at a set price on a future date. Upon entering into a futures contract, the Fund is required to deposit with the broker, cash or securities in an amount equal to the minimum initial margin requirements of the clearing house. Securities deposited, if any, are designated on the Schedule of Investments and cash deposited, if any, is included in Net cash at broker on the Statement of Assets and Liabilities. Subsequent payments are made or received by the Fund equal to the daily change in the contract value, accumulated, exchange rates and or other transactional fees. The accumulation of those payments are recorded as variation margin receivable or payable with a corresponding offset to unrealized gains or losses. The Fund recognizes a realized gain or loss when the contract is closed.
Losses may arise if the value of a futures contract decreases due to unfavorable changes in the market rates or values of the underlying instrument during the term of the contract or if the counterparty does not perform under the contract. The use of futures contracts also involves the risk that the movements in the price of the futures contracts do not correlate with the movement of the assets underlying such contracts.
For the year ended August 31, 2025, the Fund entered into futures contracts for cash equitization, to reduce tracking error and to facilitate daily liquidity.
The following tables summarize the value of the Fund's derivative instruments as of August 31, 2025, and the related location in the accompanying Statement of Assets and Liabilities and Statement of Operations, presented by primary underlying risk exposure:
| |
Asset Derivatives |
| |
Interest
Rate
Risk |
|
Foreign
Exchange
Risk |
|
Credit
Risk |
|
Equity
Risk |
|
Commodity
Risk |
|
Total |
| State Street S&P 500 Index Fund |
|
|
|
|
|
|
|
|
|
|
|
Futures Contracts
|
$— |
|
$— |
|
$— |
|
$302,175 |
|
$— |
|
$302,175 |
| |
Net Realized Gain (Loss) |
| |
Interest
Rate
Risk |
|
Foreign
Exchange
Risk |
|
Credit
Risk |
|
Equity
Risk |
|
Commodity
Risk |
|
Total |
| State Street S&P 500 Index Fund |
|
|
|
|
|
|
|
|
|
|
|
Futures Contracts
|
$— |
|
$— |
|
$— |
|
$350,762 |
|
$— |
|
$350,762 |
| |
Net Change in Unrealized Appreciation/Depreciation |
| |
Interest
Rate
Risk |
|
Foreign
Exchange
Risk |
|
Credit
Risk |
|
Equity
Risk |
|
Commodity
Risk |
|
Total |
| State Street S&P 500 Index Fund |
|
|
|
|
|
|
|
|
|
|
|
Futures Contracts
|
$— |
|
$— |
|
$— |
|
$(8,154) |
|
$— |
|
$(8,154) |
SSGA FUNDS
STATE STREET S&P 500 INDEX FUND (continued)
Notes to Financial Statements — August 31, 2025
5. Fees and Transactions with Affiliates
Advisory Fee
The Trust, on behalf of the Fund, has entered into an Investment Advisory Agreement with SSGA FM. The Adviser is a wholly-owned subsidiary of State Street Global Advisors, Inc., which itself is a wholly-owned subsidiary of State Street Corporation. For its advisory services, the Fund pays the Adviser a management fee at an annual rate of 0.03% of its average daily net assets. The fees are accrued daily and paid monthly.
The Adviser is contractually obligated until December 31, 2025 to waive up to the full amount of the advisory fee payable by the Fund and/or reimburse the Fund to the extent that total annual Fund operating expenses exceed 0.157% of average daily net assets on an annual basis. This waiver and/or reimbursement may not be terminated prior to December 31, 2025 except with the approval of the Board. During the year ended August 31, 2025, SSGA FM agreed to reimburse fees of $76,601.
Administrator, Sub-Administrator and Custodian Fees
SSGA FM serves as administrator and State Street Bank and Trust Company ("State Street"), an affiliate of the Adviser, serves as custodian and sub-administrator. For its administrative services, the Fund pays SSGA FM a fee at an annual rate of 0.05% of its average daily net assets. The fees are accrued daily and paid monthly. SSGA FM has contractually agreed to waive 0.01% of its administration fee. The waiver may not be terminated or modified except with the approval of the Board and shall continue until at least December 31, 2025. For the year ended August 31, 2025, SSGA FM waived fees in the amount of $152,083.
The Adviser and the Fund each bear a portion of the fee paid to State Street for providing sub-administration and custodian services with respect to the Fund.
Distribution and Shareholder Servicing Fees
State Street Global Advisors Funds Distributors, LLC (“SSGA FD” or the “Distributor”), an affiliate of the Adviser, serves as the distributor of the Trust.
The Fund has adopted a distribution plan pursuant to Rule 12b-1 under the 1940 Act, under which the Fund may compensate the Distributor (or others) for services in connection with the distribution of the Fund’s Class N shares and for services provided to shareholders in that class (the “Plan”).
The Plan calls for payments at an annual rate (based on average daily net assets) of 0.25% of the Fund’s net assets attributable to its Class N shares. In addition to payments under the Plan, the Fund may reimburse the Distributor or its affiliates for payments it makes to financial intermediaries that provide certain administrative, recordkeeping and account maintenance services. The amount of the reimbursement and the manner in which it is calculated are reviewed by the Trustees periodically.
Additionally, the Board approved a limit of 0.062% of average daily net assets on the amount of Rule 12b-1 fees paid to the Distributor.
Other Transactions with Affiliates - Securities Lending
State Street, an affiliate of the Fund, acts as the securities lending agent for the Fund, pursuant to an amended and restated securities lending authorization agreement dated January 6, 2017, as amended.
Net proceeds collected by State Street on investment of cash collateral or any fee income less rebates payable to borrowers, are paid as follows: If the calendar year to date net proceeds is below a specified threshold across participating affiliated funds, the Fund retains eighty five percent (85%) of the net proceeds and fifteen percent (15%) of such net proceeds is payable to State Street. Starting the business day following the date that calendar year to date net proceeds exceeds a specified threshold, the Fund retains ninety percent (90%) of the net proceeds and ten percent (10%) of such net proceeds is payable to State Street.
In addition, cash collateral from lending activities is invested in the State Street Navigator Securities Lending Portfolio II, an affiliated fund, for which SSGA FM serves as investment adviser. See Note 9 for additional information regarding securities lending.
SSGA FUNDS
STATE STREET S&P 500 INDEX FUND (continued)
Notes to Financial Statements — August 31, 2025
Other Transactions with Affiliates
The Fund may invest in affiliated entities, including securities issued by State Street Corporation, affiliated funds, or entities deemed to be affiliates as a result of the Fund owning more than five percent of the entity’s voting securities or outstanding shares. Amounts relating to these transactions during the year ended August 31, 2025 are disclosed in the Fund's Schedule of Investments.
6. Trustees’ Fees
The fees and expenses of the Trustees, who are not “interested persons” of the Trust, as defined in the 1940 Act (“Independent Trustees”), are paid directly by the Fund. The Independent Trustees are reimbursed for travel and other out-of-pocket expenses in connection with meeting attendance and industry seminars.
7. Investment Transactions
Purchases and sales of investments (excluding in-kind transactions, derivative contracts and short term investments) for the year ended August 31, 2025 were as follows:
| |
Purchases |
|
Sales |
State Street S&P 500 Index Fund
|
$34,667,669 |
|
$152,142,599 |
8. Income Tax Information
The Fund has qualified and intends to continue to qualify as a regulated investment company under Subchapter M of the Internal Revenue Code of 1986, as amended. The Fund will not be subject to federal income taxes to the extent it distributes its taxable income, including any net realized capital gains, for each fiscal year. Therefore, no provision for federal income tax is required.
The Fund files federal and various state and local tax returns as required. No income tax returns are currently under examination. Generally, the federal returns are subject to examination by the Internal Revenue Service for a period of three years from date of filing, while the state returns may remain open for an additional year depending upon jurisdiction. SSGA FM has analyzed the Fund's tax positions taken on tax returns for all open years and does not believe there are any uncertain tax positions that would require recognition of a tax liability.
Distributions to shareholders are recorded on ex-dividend date. Income dividends and gain distributions are determined in accordance with income tax rules and regulations, which may differ from generally accepted accounting principles.
Certain capital accounts in the financial statements have been adjusted for permanent book-tax differences. These adjustments have no impact on net asset values or results of operations. Temporary book-tax differences will reverse in the future. These book-tax differences are primarily due to nontaxable dividend adjustments to income, wash sale loss deferrals, real estate investment trusts, and futures contracts. In addition, the Fund has claimed a portion of the payments made to redeeming shareholders as a distribution for income tax purposes.
The tax character of distributions paid during the year ended August 31, 2025 was as follows:
| |
Ordinary
Income |
|
Long-Term
Capital Gains |
|
Total |
State Street S&P 500 Index Fund
|
$19,819,109 |
|
$114,124,796 |
|
$133,943,905 |
The tax character of distributions paid during the year ended August 31, 2024 was as follows:
| |
Ordinary
Income |
|
Long-Term
Capital Gains |
|
Total |
State Street S&P 500 Index Fund
|
$ 18,772,565 |
|
$ 132,385,335 |
|
$ 151,157,900 |
SSGA FUNDS
STATE STREET S&P 500 INDEX FUND (continued)
Notes to Financial Statements — August 31, 2025
At August 31, 2025, the components of distributable earnings on a tax basis were as follows:
| |
Undistributed
Ordinary Income |
|
Capital Loss
Carryforwards |
|
Undistributed
Long-Term
Capital Gains |
|
Net Unrealized
Gains (Losses) |
|
Total |
State Street S&P 500 Index Fund
|
$3,442,327 |
|
$— |
|
$90,176,954 |
|
$1,319,861,272 |
|
$1,413,480,553 |
As of August 31, 2025, gross unrealized appreciation and gross unrealized depreciation of investments and other financial instruments based on cost for federal income tax purposes were as follows:
| |
Tax
Cost |
|
Gross
Unrealized
Appreciation |
|
Gross
Unrealized
Depreciation |
|
Net Unrealized
Appreciation
(Depreciation) |
State Street S&P 500 Index Fund
|
$279,324,444 |
|
$1,334,118,087 |
|
$14,256,815 |
|
$1,319,861,272 |
9. Securities Lending
The Fund may lend securities to qualified broker-dealers or institutional investors. The loans are secured at all times by cash, cash equivalents or U.S. government securities in an amount at least equal to the market value of the securities loaned, plus accrued interest and dividends, determined on a daily basis and adjusted accordingly. The value of the collateral with respect to a loaned security may be temporarily more or less than the value of a security due to market fluctuations of securities values. With respect to each loan, if on any U.S. business day the aggregate market value of securities collateral plus cash collateral is less than the aggregate market value of the securities which are subject to the loan, the borrower will be notified to provide additional collateral on the next business day.
The Fund will regain record ownership of loaned securities to exercise certain beneficial rights; however, the Fund may bear the risk of delay in recovery of, or even loss of rights in the securities loaned should the borrower fail financially. In addition, the Fund will bear the risk of loss of any cash collateral that it may invest. The Fund receives compensation for lending its securities from interest or dividends earned on the cash, cash equivalents or U.S. government securities held as collateral, net of fee rebates paid to the borrower and net of fees paid to State Street as the lending agent. Additionally, the Fund will receive a fee from the borrower for non-cash collateral equal to a percentage of the market value of the loaned securities.
The market value of securities on loan as of August 31, 2025, and the value of the invested cash collateral are disclosed in the Fund's Statement of Assets and Liabilities. Non-cash collateral is not disclosed in the Fund's Statement of Assets and Liabilities as it is held by the lending agent on behalf of the Fund, and the Fund does not have the ability to re-hypothecate those securities. Securities lending income, as disclosed in the Fund's Statement of Operations, represents the income earned from the non-cash collateral and the investment of cash collateral, net of fee rebates paid to the borrower and net of fees paid to State Street as lending agent.
The following is a summary of the Fund's securities lending agreements and related cash and non-cash collateral received as of August 31, 2025:
| Fund |
|
Market Value of
Securities on Loan |
|
Cash
Collateral
Received |
|
Non-Cash
Collateral
Received |
|
Total
Collateral
Received |
State Street S&P 500 Index Fund
|
|
$ 4,362,053 |
|
$ 3,607,169 |
|
$ 868,431 |
|
$ 4,475,600 |
SSGA FUNDS
STATE STREET S&P 500 INDEX FUND (continued)
Notes to Financial Statements — August 31, 2025
The following table reflects a breakdown of transactions accounted for as secured borrowings, the gross obligation by the type of collateral pledged or securities loaned, and the remaining contractual maturity of those transactions as of August 31, 2025:
| |
|
|
|
Remaining Contractual Maturity of the Agreements
as of August 31, 2025 |
| Fund |
|
Securities
Lending
Transactions |
|
Overnight
and
Continuous |
|
<30 Days |
|
Between
30 & 90
Days |
|
>90 Days |
|
Total
Borrowings |
|
Gross Amount
of Recognized
Liabilities for
Securities Lending Transactions |
State Street S&P 500 Index Fund
|
|
Common Stocks |
|
$3,607,169 |
|
$— |
|
$— |
|
$— |
|
$3,607,169 |
|
$3,607,169 |
10. Risks
Market Risk
The Fund’s investments are subject to changes in general economic conditions, general market fluctuations and the risks inherent in investment in securities markets. Investment markets can be volatile and prices of investments can change substantially due to various factors including, but not limited to, economic growth or recession, changes in interest rates, changes in the actual or perceived creditworthiness of issuers, and general market liquidity. The Fund is subject to the risk that geopolitical events will disrupt securities markets and adversely affect global economies and markets. Local, regional or global events such as war, acts of terrorism, the spread of infectious illness, such as COVID-19, or other public health issues, or other events could have a significant impact on the Fund and its investments.
Credit Risk
The Fund may be exposed to credit risk in the event that an issuer or guarantor fails to perform or that an institution or entity with which the Fund has unsettled or open transactions defaults.
11. Subsequent Events
Management has evaluated the impact of all subsequent events on the Fund through the date the financial statements were available to be issued and has determined that there were no subsequent events requiring adjustment or disclosure in the financial statements.
SSGA FUNDS
State Street S&P 500 Index Fund
REPORT OF INDEPENDENT REGISTERED PUBLIC ACCOUNTING FIRM
To the Shareholders and the Board of Trustees of State Street S&P 500 Index Fund
Opinion on the Financial Statements
We have audited the accompanying statement of assets and liabilities of State Street S&P 500 Index Fund (the “Fund”) (one of the funds constituting SSGA Funds (the “Trust”)), including the schedule of investments, as of August 31, 2025, and the related statement of operations for the year then ended, the statements of changes in net assets for each of the two years in the period then ended, the financial highlights for each of the five years in the period then ended and the related notes (collectively referred to as the “financial statements”). In our opinion, the financial statements present fairly, in all material respects, the financial position of the Fund (one of the funds constituting SSGA Funds) at August 31, 2025, the results of its operations for the year then ended, the changes in its net assets for each of the two years in the period then ended and its financial highlights for each of the five years in the period then ended, in conformity with U.S. generally accepted accounting principles.
Basis for Opinion
These financial statements are the responsibility of the Trust’s management. Our responsibility is to express an opinion on the Fund’s financial statements based on our audits. We are a public accounting firm registered with the Public Company Accounting Oversight Board (United States) (“PCAOB”) and are required to be independent with respect to the Trust in accordance with the U.S. federal securities laws and the applicable rules and regulations of the Securities and Exchange Commission and the PCAOB.
We conducted our audits in accordance with the standards of the PCAOB. Those standards require that we plan and perform the audit to obtain reasonable assurance about whether the financial statements are free of material misstatement, whether due to error or fraud. The Trust is not required to have, nor were we engaged to perform, an audit of the Trust’s internal control over financial reporting. As part of our audits, we are required to obtain an understanding of internal control over financial reporting but not for the purpose of expressing an opinion on the effectiveness of the Trust’s internal control over financial reporting. Accordingly, we express no such opinion.
Our audits included performing procedures to assess the risks of material misstatement of the financial statements, whether due to error or fraud, and performing procedures that respond to those risks. Such procedures included examining, on a test basis, evidence regarding the amounts and disclosures in the financial statements. Our procedures included confirmation of securities owned as of August 31, 2025, by correspondence with the custodian, brokers and others; when replies were not received from brokers and others, we performed other auditing procedures. Our audits also included evaluating the accounting principles used and significant estimates made by management, as well as evaluating the overall presentation of the financial statements. We believe that our audits provide a reasonable basis for our opinion.
We have served as the auditor of one or more State Street Investment Management (formerly State Street Global Advisors) investment companies since 2000.
Boston, Massachusetts
October 21, 2025
SSGA FUNDS
State Street S&P 500 Index Fund
Other Information — August 31, 2025 (Unaudited)
Tax Information
For federal income tax purposes, the following information is furnished with respect to the distributions of the Fund for its fiscal year ended August 31, 2025.
Dividends Received Deduction
The Fund reports the maximum amount allowable of its net taxable income as eligible for the corporate dividends received deduction.
Qualified Business Income Deduction
The Fund reports the maximum amount allowable of qualified REIT dividends eligible for the qualified business income deduction under Section 199A.
Qualified Dividend Income
A portion of dividends distributed by the Fund during the fiscal year ended August 31, 2025 is considered qualified dividend income and is eligible for reduced tax rates. The Fund reports the maximum amount allowable of its net taxable income as qualified dividend income as provided in the Jobs and Growth Tax Relief Reconciliation Act of 2003.
Qualified Interest Income
The Fund reports the maximum amount allowable of its net taxable income and short-term capital gain as qualified interest income.
Capital Gain Dividend
Long term capital gains dividends were paid from the following Fund during the year ended August 31, 2025:
| |
Amount |
State Street S&P 500 Index Fund
|
$121,333,003 |
SSGA FUNDS
STATE STREET S&P 500 INDEX FUND
STATEMENT REGARDING BASIS FOR APPROVAL OF INVESTMENT ADVISORY CONTRACT
August 31, 2025 (Unaudited)
TRUSTEE CONSIDERATIONS IN APPROVING CONTINUATION OF INVESTMENT ADVISORY AGREEMENT1
Overview of the Contract Review Process
Under the Investment Company Act of 1940, as amended (the “1940 Act”), an investment advisory agreement between a mutual fund and its investment adviser may continue in effect from year to year only if its continuance is approved at least annually by the fund’s board of trustees or its shareholders, and by a vote of a majority of those trustees who are not “interested persons” of the fund (the “Independent Trustees”) cast in person at a meeting called for the purpose of considering such approval.
Consistent with these requirements, the Board of Trustees (the “Board”) of the SSGA Funds (the “Trust”), met in person on April 2, 2025 and May 7-8, 2025, including in executive sessions attended by the Independent Trustees, to consider a proposal to approve, with respect to State Street S&P 500 Index Fund (the “Fund”), the continuation of the investment advisory agreement (the “Advisory Agreement”) with SSGA Funds Management, Inc. (“SSGA FM” or the “Adviser”). Prior to voting on the proposal, the Independent Trustees reviewed information furnished by the Adviser and others reasonably necessary to permit the Board to evaluate the proposal fully. The Independent Trustees were separately represented by counsel who are independent of the Adviser (“Independent Counsel”) in connection with their consideration of approval of the Advisory Agreement. In advance of the meetings held on April 2, 2025 and May 7-8, 2025, the Independent Trustees met with their Independent Counsel on March 27, 2025, in a private session to review and discuss the information provided by the Adviser in connection with the proposal. Following the April 2, 2025 meeting, the Independent Trustees submitted questions and requests for additional information to management, and considered management’s responses thereto prior to and at the May 7-8, 2025 meeting. The Independent Trustees considered, among other things, the following:
Information about Performance, Expenses and Fees
| • |
A report prepared by an independent third-party provider of investment company data, which includes for the Fund: |
| o |
Comparisons of the Fund’s performance over the past one-, three-, five- and ten-year periods ended December 31, 2024, to the performance of an appropriate benchmark provided by Broadridge Financial Solutions, Inc. (“Broadridge”) for the Fund (the “Benchmark”) and a universe of other mutual funds with similar investment objectives and policies (the “Performance Group” and/or the “Performance Universe”) constructed by Broadridge; |
| o |
Comparisons of the Fund’s expense ratio (with detail of component expenses) to the expense ratios of a group of comparable mutual funds selected by the independent third-party data provider (the “Expense Group” and/or “Expense Universe”); |
| o |
A chart showing the Fund’s historical average net assets relative to its total expenses, management fees, and non-management expenses over the past five calendar years; and |
| o |
Comparisons of the Fund’s contractual management fee to the contractual management fees of comparable mutual funds at different asset levels. |
______________________________________________
1 Over the course of many years overseeing the Fund and other investment companies, the Independent Trustees have identified numerous relevant issues, factors and concerns ("issues, factors and concerns") that they consider each year in connection with the proposed continuation of the advisory agreement, the administration agreement, the distribution plans, the distribution agreement and various related-party service agreements (the "annual review process"). The statement of issues, factors and concerns and the related conclusions of the Independent Trustees may not change substantially from year to year. However, the information requested by, and provided to, the Independent Trustees with respect to the issues, factors and concerns and on which their conclusions are based is updated annually and, in some cases, may differ substantially from the previous year. The Independent Trustees schedule annually a separate in-person meeting that is dedicated to the annual review process (the "special meeting"). At the special meeting and throughout the annual review process, the Independent Trustees take a fresh look at each of the issues, factors and concerns in light of the latest available information and each year present one or more sets of comments and questions to management with respect to specific issues, factors and concerns. Management responds to such comments and questions to the satisfaction of the Independent Trustees before the annual review process is completed and prior to the Independent Trustees voting on proposals to approve continuation of the agreements and plans.
SSGA FUNDS
STATE STREET S&P 500 INDEX FUND
STATEMENT REGARDING BASIS FOR APPROVAL OF INVESTMENT ADVISORY CONTRACT (continued)
August 31, 2025 (Unaudited)
| • |
Comparative information concerning fees charged by the Adviser for managing institutional accounts using investment strategies and techniques similar to those used in managing the Fund, as applicable; and |
| • |
Profitability analyses for (a) the Adviser with respect to the Fund and (b) affiliates of the Adviser that provide services to the Fund (“Affiliated Service Providers”). |
Information about Portfolio Management
| • |
Descriptions of the investment management services provided by the Adviser, including its investment strategies and processes; |
| • |
Information concerning the allocation of brokerage; and |
| • |
Information regarding the procedures and processes used to value the assets of the Fund. |
Information about the Adviser
| • |
Reports detailing the financial results and condition of the Adviser and its affiliates; |
| • |
Descriptions of the qualifications, education and experience of the individual investment and other professionals responsible for managing the portfolio of the Fund and for Fund operations; |
| • |
Information relating to compliance with and the administration of the Code of Ethics adopted by the Adviser; |
| • |
Information about the Adviser’s proxy voting policies and procedures and information regarding the Adviser’s practices for overseeing proxy vendors; |
| • |
Information concerning the resources devoted by the Adviser to overseeing compliance by the Fund and its service providers, including information concerning compliance with investment policies and restrictions and other operating policies of the Fund; |
| • |
A description of the adequacy and sophistication of the Adviser’s technology and systems with respect to investment and administrative matters and a description of any material improvements or changes in technology or systems in the past year; |
| • |
A description of the business continuity and disaster recovery plans of the Adviser; and |
| • |
Information regarding the Adviser’s risk management processes. |
Other Relevant Information
| • |
Information concerning the nature, extent, quality and cost of services provided to the Fund by SSGA FM in its capacity as the Fund’s administrator (the “Administrator”); |
| • |
Information concerning the nature, extent, quality and cost of various non-investment management services provided to the Fund by affiliates of the Adviser, including the custodian, sub-administrator, fund accountant and securities lending agent of the Fund, as applicable, and the role of the Adviser in managing the Fund’s relationship with these service providers; |
| • |
Copies of the Advisory Agreement and agreements with other service providers of the Fund; |
| • |
Responses to a request for information reviewed prior to the April 2, 2025 and May 7-8, 2025 meetings by Independent Counsel, requesting specific information from each of: |
| o |
SSGA FM, in its capacity as the Fund’s Adviser and Administrator, with respect to its operations relating to the Fund and its approximate profit margins from such operations for the calendar year ended December 31, 2024; and the relevant operations of other Affiliated Service Providers to the Fund, together with their approximate profit margins from such relevant operations for the calendar year ended December 31, 2024; |
| o |
State Street Bank and Trust Company (“State Street”), the sub-administrator, custodian and securities lending agent for the Fund, with respect to its operations relating to the Fund; and |
| o |
State Street Global Advisors Funds Distributors, LLC, the principal underwriter and distributor of the shares of the Fund (the “Distributor”), with respect to its operations relating to the Fund, together with the Fund’s related distribution plans and arrangements under Rule 12b-1 of the 1940 Act; |
SSGA FUNDS
STATE STREET S&P 500 INDEX FUND
STATEMENT REGARDING BASIS FOR APPROVAL OF INVESTMENT ADVISORY CONTRACT (continued)
August 31, 2025 (Unaudited)
| • |
Information from SSGA FM, State Street and the Distributor with respect to the Trust providing any material changes to the previous information supplied in response to the letter from Independent Counsel prior to the executive session of the Board on May 7-8, 2025; and |
| • |
Materials provided by Broadridge, circulated to the Independent Trustees and to Independent Counsel. |
In addition to the information identified above, the Board considered information provided from time to time by the Adviser, and other service providers of the Fund throughout the year at meetings of the Board and its committees. At such meetings, the Trustees received, among other things, presentations by the portfolio managers and other investment professionals of the Adviser relating to the performance of the Fund and the investment strategies used in pursuing the Fund’s investment objective.
The Independent Trustees were assisted throughout the contract review process by their Independent Counsel. The Independent Trustees relied upon the advice of such counsel and their own business judgment in determining the material factors to be considered in evaluating the Advisory Agreement, and the weight to be given to each such factor. The conclusions reached with respect to the Advisory Agreement were based on a comprehensive evaluation of all the information provided and not any single factor. Moreover, each Trustee may have placed varying emphasis on particular factors in reaching conclusions with respect to the Fund.
Results of the Process
Based on a consideration of the foregoing and such other information as deemed relevant, including the factors and conclusions described below, at the meeting held on May 7-8, 2025, the Board, including a majority of the Independent Trustees, voted to approve the continuation of the Advisory Agreement effective June 1, 2025, for an additional year with respect to the Fund.
Nature, Extent and Quality of Services
In considering whether to approve the Advisory Agreement, the Board evaluated the nature, extent and quality of services provided to the Fund by the Adviser.
The Board considered the Adviser’s management capabilities and investment process with respect to the types of investments held by the Fund, including the education, experience and number of investment professionals and other personnel who provide portfolio management, investment research, and similar services to the Fund. The Board evaluated, where relevant, the abilities and experience of such investment personnel in analyzing particular markets, industries and specific issuers of securities in these markets and industries. The Board also considered the substantial expertise of the Adviser in developing and applying proprietary quantitative models for managing various funds that invest primarily in equity securities. The Board considered the extensive experience and resources committed by the Adviser to risk management, including with respect to investment risk, liquidity risk, operational risk, counterparty risk and model risk. Further, the Board considered material enhancements made to the risk management processes and systems over the past year. The Trustees also considered the significant risks assumed by the Adviser in connection with the services provided to the Fund, including reputational and entrepreneurial risks. The Board also took into account the compensation paid to recruit and retain investment personnel, and the time and attention devoted to the Fund by senior management, as well as the Adviser’s succession planning process.
The Board had previously reviewed the compliance programs of SSGA FM and various Affiliated Service Providers. Among other things, the Board considered compliance and reporting matters relating to personal trading by investment personnel, selective disclosure of portfolio holdings, late trading, frequent trading, portfolio valuation, business continuity, the allocation of investment opportunities and the voting of proxies. The Board also considered the role of the Adviser in overseeing the Fund’s securities lending activities.
On the basis of the foregoing and other relevant information, the Board concluded that the Adviser can be expected to continue to provide high quality investment management and related services for the Fund.
Fund Performance
The Board compared the Fund’s investment performance to the performance of an appropriate benchmark and universe of comparable mutual funds for various time periods ended December 31, 2024. For purposes of these comparisons the Independent Trustees relied on the Performance Group, Performance Universe and Benchmark and the analyses of the related data provided by Broadridge. It was noted that while the Board found the Broadridge data generally useful, they recognized its limitations, including that the data may vary depending on the end date selected and that the results of the performance comparisons may vary depending on the selection of the peer group and its composition over time. The Board also noted that it had received and discussed with management information throughout the year at periodic intervals comparing the Fund’s performance against its
SSGA FUNDS
STATE STREET S&P 500 INDEX FUND
STATEMENT REGARDING BASIS FOR APPROVAL OF INVESTMENT ADVISORY CONTRACT (continued)
August 31, 2025 (Unaudited)
benchmark and against the Fund’s peers. The Board also considered the Fund’s performance in light of overall financial market conditions. Among other information, the Board considered the following performance information in its evaluation of the Fund:
State Street S&P 500 Index Fund. The Board considered that the Fund’s performance was above the medians of its Performance Group and Performance Universe for the 1-, 3-, 5- and 10-year periods. The Board also considered that the Fund’s performance was below the Benchmark for the 1-, 3-, 5- and 10-year periods. The Board also took into account the fact that the Fund is designed to track a designated index.
On the basis of the foregoing and other relevant information, the Board concluded that the performance of the Fund is satisfactory.
Management Fees and Expenses
The Board reviewed the contractual investment advisory fee rates payable by the Fund and actual fees paid by the Fund, net of waivers. As part of its review, the Board considered the Fund’s management fee and total expense ratio, including the portion attributable to administrative services provided by SSGA FM (both before and after giving effect to any expense caps), as compared to its Expense Group and Expense Universe, as constructed by Broadridge, and the related Broadridge analysis for the Fund. The Board also considered the comparability of the fees charged and the services provided to the Fund by the Adviser to the fees charged and services provided to other clients of the Adviser, including institutional accounts. In addition, the Board considered the willingness of the Adviser to provide undertakings from time to time to waive fees or pay expenses of the Fund to limit the total expenses borne by shareholders of the Fund. Among other information, the Board considered the following expense information in its evaluation of the Fund:
State Street S&P 500 Index Fund. The Board considered that the Fund’s actual management fee was below the medians of its Expense Group and Expense Universe. The Board also considered that the Fund’s total expenses were below the medians of its Expense Group and Expense Universe.
On the basis of the foregoing and other relevant information, and in light of the nature, extent and quality of the services provided by the Adviser, the Board concluded that the fees and the expense ratio of the Fund compare favorably to the fees and expenses of the Expense Group and Expense Universe and are reasonable in relation to the services provided.
Profitability
The Board reviewed the level of profits realized by the Adviser and its affiliates in providing investment advisory and other services to the Fund and to all funds within the fund complex. The Board considered other direct and indirect benefits received by the Adviser and Affiliated Service Providers in connection with their relationships with the Fund, together with the profitability of each of the Affiliated Service Providers with respect to their services to the Fund and/or fund complex. The Board also considered the various risks borne by SSGA FM and State Street in connection with their various roles in servicing the Trust, including reputational and entrepreneurial risks.
The Board concluded that the profitability of the Adviser with respect to the Fund, and the profitability range of each of the Affiliated Service Providers with respect to its services to the Fund, were reasonable in relation to the services provided.
Economies of Scale
In reviewing management fees and profitability, the Board also considered the extent to which the Adviser and its affiliates, on the one hand, and the Fund and the fund complex, on the other hand, can expect to realize benefits from economies of scale as the assets of the Fund and fund complex increase. The Board acknowledged the difficulty in accurately measuring the benefits resulting from the economies of scale with respect to the management of the Fund or the fund complex taken as a whole. The Board concluded that, in light of the current size of the Fund and the fund complex, the level of profitability of the Adviser and its affiliates with respect to the Fund and the fund complex over various time periods, and the comparative management fee and expense ratio of the Fund during these periods, it does not appear that the Adviser or its affiliates has realized benefits from economies of scale in managing the assets of the Fund to such an extent that previously agreed advisory fees should be reduced or that breakpoints in such fees should be implemented for the Fund at this time.
Conclusions
In reaching its decision to approve the Advisory Agreement, the Board did not identify any single factor as being controlling, but based its recommendation on each of the factors it considered. Each Trustee may have contributed different weight to the various factors. Based upon the materials reviewed, the representations made and the
SSGA FUNDS
STATE STREET S&P 500 INDEX FUND
STATEMENT REGARDING BASIS FOR APPROVAL OF INVESTMENT ADVISORY CONTRACT (continued)
August 31, 2025 (Unaudited)
considerations described above, and as part of its deliberations, the Board, including the Independent Trustees, concluded that the Adviser possesses the capability and resources to perform the duties required of it under the Advisory Agreement.
Further, based upon its review of the Advisory Agreement, the materials provided, and the considerations described above, the Board, including the Independent Trustees, concluded that (1) the terms of the Advisory Agreement are reasonable, fair, and in the best interests of the Fund and its shareholders, and (2) the rates payable under the Advisory Agreement are fair and reasonable in light of the usual and customary charges made for services of the same nature and quality.
Annual Financial Statements and Other Information
August 31, 2025
SSGA Funds
| State Street International Stock Selection Fund |
The information contained in this report is intended for the general information of shareholders of the Trust. This report is not authorized for distribution to prospective investors unless preceded or accompanied by a current Trust prospectus which contains important information concerning the Trust. You may obtain a current prospectus and SAI from the Distributor by calling 1-800-647-7327 or visiting www.ssga.com. Please read the prospectus carefully before you invest.
TABLE OF CONTENTS
Changes in and Disagreements with Accountants for Open-End Management Investment Companies (N-CSR Item 8) - Not Applicable
Proxy Disclosures for Open-End Management Investment Companies (N-CSR Item 9) - Not Applicable
Remuneration Paid to Directors, Officers, and Others of Open-End Management Investment Companies (N-CSR Item 10) - Please see Statement of Operations in the Financial Statements under Item 7 above
STATE STREET INTERNATIONAL STOCK SELECTION FUND
SCHEDULE OF INVESTMENTS
August 31, 2025
| Security Description |
|
|
Shares |
|
Value |
| COMMON STOCKS — 98.3% |
|
|
|
|
|
| AUSTRALIA — 7.1% |
|
Brambles Ltd.
|
|
118,881 |
|
$2,018,953 |
Coles Group Ltd.
|
|
120,237 |
|
1,879,095 |
Commonwealth Bank of Australia (a)
|
|
516 |
|
57,510 |
Computershare Ltd.
|
|
8,921 |
|
222,850 |
G8 Education Ltd. (a)
|
|
51,258 |
|
28,514 |
Helia Group Ltd.
|
|
159,758 |
|
580,273 |
Perenti Ltd.
|
|
203,521 |
|
314,339 |
Perseus Mining Ltd.
|
|
361,293 |
|
893,774 |
Qantas Airways Ltd.
|
|
250,867 |
|
1,929,113 |
QBE Insurance Group Ltd.
|
|
33,656 |
|
476,866 |
Resolute Mining Ltd. (b)
|
|
763,947 |
|
322,477 |
Scentre Group REIT
|
|
454,827 |
|
1,214,459 |
Service Stream Ltd.
|
|
84,218 |
|
114,642 |
Stockland REIT
|
|
20,028 |
|
81,265 |
Telstra Group Ltd.
|
|
574,138 |
|
1,837,391 |
Ventia Services Group Pty. Ltd. (a)
|
|
248,590 |
|
885,032 |
| |
|
|
|
|
12,856,553 |
| AUSTRIA — 0.1% |
|
Kontron AG
|
|
1,044 |
|
29,850 |
Porr AG
|
|
2,967 |
|
102,918 |
| |
|
|
|
|
132,768 |
| BELGIUM — 2.3% |
|
Ageas SA
|
|
25,699 |
|
1,809,928 |
KBC Group NV
|
|
17,207 |
|
2,028,145 |
Umicore SA
|
|
25,195 |
|
393,205 |
| |
|
|
|
|
4,231,278 |
| CHINA — 1.0% |
|
BOC Hong Kong Holdings Ltd.
|
|
70,500 |
|
318,519 |
SITC International Holdings Co. Ltd.
|
|
409,000 |
|
1,441,770 |
| |
|
|
|
|
1,760,289 |
| DENMARK — 1.6% |
|
AP Moller - Maersk AS Class B
|
|
389 |
|
816,932 |
Danske Bank AS
|
|
47,624 |
|
1,957,744 |
Sydbank AS
|
|
2,234 |
|
169,737 |
| |
|
|
|
|
2,944,413 |
| FINLAND — 1.2% |
|
Nordea Bank Abp
|
|
140,977 |
|
2,150,674 |
| FRANCE — 8.1% |
|
AXA SA
|
|
16,450 |
|
765,753 |
BioMerieux
|
|
4,878 |
|
677,394 |
BNP Paribas SA
|
|
11,248 |
|
1,011,009 |
Carmila SA REIT (b)
|
|
39,219 |
|
789,176 |
Cie de Saint-Gobain SA
|
|
18,013 |
|
1,942,968 |
Cie des Alpes
|
|
8,358 |
|
216,583 |
Covivio SA REIT
|
|
4,247 |
|
278,736 |
Derichebourg SA
|
|
78,243 |
|
547,388 |
Eiffage SA
|
|
12,691 |
|
1,596,074 |
Engie SA
|
|
97,147 |
|
2,010,509 |
Forvia SE (b)
|
|
40,738 |
|
542,840 |
Kaufman & Broad SA
|
|
9,048 |
|
303,267 |
| Security Description |
|
|
Shares |
|
Value |
Klepierre SA REIT
|
|
43,158 |
|
$1,683,355 |
Opmobility
|
|
15,279 |
|
246,316 |
Societe Generale SA
|
|
7,168 |
|
442,102 |
Technip Energies NV
|
|
18,084 |
|
835,257 |
Vicat SACA
|
|
9,554 |
|
668,398 |
| |
|
|
|
|
14,557,125 |
| GERMANY — 10.5% |
|
Bayer AG
|
|
13,249 |
|
431,830 |
Bilfinger SE
|
|
6,824 |
|
706,930 |
Cewe Stiftung & Co. KGaA
|
|
215 |
|
24,197 |
Commerzbank AG
|
|
50,563 |
|
1,929,592 |
Continental AG
|
|
5,395 |
|
473,371 |
Deutsche Bank AG
|
|
67,493 |
|
2,371,170 |
Deutsche Telekom AG
|
|
77,585 |
|
2,833,736 |
E.ON SE
|
|
97,703 |
|
1,742,545 |
Fresenius Medical Care AG
|
|
31,349 |
|
1,606,007 |
Fresenius SE & Co. KGaA
|
|
36,506 |
|
1,982,095 |
Heidelberg Materials AG
|
|
5,250 |
|
1,240,679 |
RWE AG
|
|
44,108 |
|
1,766,850 |
SAP SE
|
|
5,564 |
|
1,508,210 |
Siemens AG
|
|
597 |
|
165,249 |
Talanx AG
|
|
932 |
|
126,589 |
| |
|
|
|
|
18,909,050 |
| HONG KONG — 2.1% |
|
AIA Group Ltd.
|
|
143,200 |
|
1,348,326 |
Johnson Electric Holdings Ltd.
|
|
168,500 |
|
616,893 |
WH Group Ltd. (c)
|
|
1,686,000 |
|
1,803,764 |
| |
|
|
|
|
3,768,983 |
| INDONESIA — 0.5% |
|
First Pacific Co. Ltd.
|
|
1,004,000 |
|
859,044 |
| IRELAND — 1.2% |
|
AerCap Holdings NV
|
|
16,100 |
|
1,988,350 |
Cairn Homes PLC
|
|
107,719 |
|
277,875 |
| |
|
|
|
|
2,266,225 |
| ISRAEL — 2.7% |
|
Bank Hapoalim BM
|
|
99,467 |
|
1,946,009 |
Bank Leumi Le-Israel BM
|
|
110,195 |
|
2,119,579 |
Delek Group Ltd.
|
|
1,538 |
|
338,686 |
Paz Retail & Energy Ltd.
|
|
796 |
|
150,414 |
Plus500 Ltd.
|
|
4,404 |
|
180,478 |
Shufersal Ltd.
|
|
5,156 |
|
64,031 |
| |
|
|
|
|
4,799,197 |
| ITALY — 4.8% |
|
Coca-Cola HBC AG
|
|
32,816 |
|
1,657,069 |
Hera SpA
|
|
7,175 |
|
30,840 |
Intesa Sanpaolo SpA
|
|
412,119 |
|
2,591,492 |
OVS SpA (c)
|
|
186,413 |
|
898,945 |
Ryanair Holdings PLC
|
|
69,610 |
|
2,056,277 |
UniCredit SpA
|
|
18,261 |
|
1,410,848 |
| |
|
|
|
|
8,645,471 |
| JAPAN — 22.1% |
|
Aica Kogyo Co. Ltd.
|
|
15,400 |
|
397,169 |
See accompanying notes to financial statements.
1
STATE STREET INTERNATIONAL STOCK SELECTION FUND
SCHEDULE OF INVESTMENTS (continued)
August 31, 2025
| Security Description |
|
|
Shares |
|
Value |
Aisin Corp.
|
|
114,600 |
|
$1,912,145 |
Anritsu Corp. (a)
|
|
73,000 |
|
866,085 |
Chugoku Marine Paints Ltd.
|
|
26,600 |
|
641,673 |
Daiwa House Industry Co. Ltd.
|
|
53,600 |
|
1,907,212 |
Exedy Corp.
|
|
8,800 |
|
319,173 |
FCC Co. Ltd.
|
|
40,900 |
|
875,305 |
Fuji Seal International, Inc.
|
|
40,700 |
|
801,786 |
Global One Real Estate Investment Corp. REIT
|
|
80 |
|
80,406 |
Hamakyorex Co. Ltd.
|
|
63,900 |
|
655,284 |
Inpex Corp.
|
|
40,400 |
|
699,107 |
Kanamoto Co. Ltd.
|
|
3,800 |
|
90,762 |
Kanematsu Corp.
|
|
26,900 |
|
571,297 |
Kitz Corp.
|
|
86,700 |
|
887,915 |
Komatsu Ltd.
|
|
60,900 |
|
2,087,811 |
Marubeni Corp.
|
|
46,400 |
|
1,067,843 |
Meidensha Corp.
|
|
14,900 |
|
595,169 |
Mitsubishi Electric Corp.
|
|
57,200 |
|
1,382,562 |
NIPPON REIT Investment Corp.
|
|
47 |
|
31,439 |
Nippon Yusen KK (a)
|
|
3,900 |
|
141,531 |
Nishio Holdings Co. Ltd.
|
|
5,100 |
|
145,585 |
Niterra Co. Ltd.
|
|
24,400 |
|
880,993 |
Nojima Corp.
|
|
35,800 |
|
806,356 |
Nomura Holdings, Inc.
|
|
278,400 |
|
2,008,125 |
Open House Group Co. Ltd.
|
|
16,900 |
|
869,524 |
Osaka Gas Co. Ltd.
|
|
26,700 |
|
762,546 |
Otsuka Holdings Co. Ltd.
|
|
14,300 |
|
755,699 |
Raito Kogyo Co. Ltd.
|
|
29,800 |
|
669,184 |
Sakata INX Corp. (a)
|
|
23,900 |
|
367,880 |
SCREEN Holdings Co. Ltd.
|
|
20,100 |
|
1,556,517 |
Senshu Electric Co. Ltd.
|
|
1,000 |
|
30,690 |
SoftBank Group Corp.
|
|
4,700 |
|
519,077 |
Sumitomo Corp.
|
|
73,900 |
|
2,085,423 |
Sumitomo Electric Industries Ltd.
|
|
72,100 |
|
2,062,103 |
Sumitomo Riko Co. Ltd.
|
|
17,200 |
|
258,547 |
Suzuki Motor Corp.
|
|
122,700 |
|
1,645,685 |
Taisei Corp.
|
|
3,000 |
|
203,736 |
Takeda Pharmaceutical Co. Ltd. (a)
|
|
40,700 |
|
1,224,420 |
TDK Corp.
|
|
26,700 |
|
351,748 |
Toyo Seikan Group Holdings Ltd.
|
|
36,400 |
|
888,977 |
Toyo Tire Corp.
|
|
35,100 |
|
899,982 |
Toyota Motor Corp.
|
|
17,000 |
|
332,353 |
Toyota Tsusho Corp.
|
|
71,600 |
|
1,935,254 |
Tsubakimoto Chain Co.
|
|
36,500 |
|
549,406 |
UACJ Corp.
|
|
3,000 |
|
129,223 |
Valor Holdings Co. Ltd.
|
|
12,400 |
|
237,528 |
Yokogawa Electric Corp.
|
|
50,200 |
|
1,482,549 |
Yurtec Corp.
|
|
13,000 |
|
234,160 |
| |
|
|
|
|
39,904,944 |
| LUXEMBOURG — 0.7% |
|
ArcelorMittal SA
|
|
41,029 |
|
1,366,075 |
| NETHERLANDS — 3.1% |
|
ASML Holding NV
|
|
1,329 |
|
989,784 |
Koninklijke KPN NV
|
|
380,357 |
|
1,813,737 |
NN Group NV
|
|
28,397 |
|
1,954,097 |
| Security Description |
|
|
Shares |
|
Value |
SBM Offshore NV
|
|
33,556 |
|
$917,047 |
| |
|
|
|
|
5,674,665 |
| NORWAY — 0.2% |
|
Aker Solutions ASA
|
|
119,205 |
|
368,804 |
| SINGAPORE — 0.8% |
|
DBS Group Holdings Ltd.
|
|
17,900 |
|
704,784 |
United Overseas Bank Ltd.
|
|
29,700 |
|
814,545 |
| |
|
|
|
|
1,519,329 |
| SPAIN — 3.3% |
|
ACS Actividades de Construccion y Servicios SA
|
|
25,720 |
|
1,942,298 |
Banco Bilbao Vizcaya Argentaria SA
|
|
59,828 |
|
1,084,188 |
Banco Santander SA
|
|
206,632 |
|
1,972,589 |
Indra Sistemas SA (a)
|
|
18,324 |
|
739,156 |
Prosegur Cia de Seguridad SA
|
|
50,491 |
|
156,534 |
| |
|
|
|
|
5,894,765 |
| SWEDEN — 2.6% |
|
AcadeMedia AB (c)
|
|
11,612 |
|
113,734 |
Attendo AB (c)
|
|
70,551 |
|
491,982 |
Clas Ohlson AB Class B
|
|
21,278 |
|
752,244 |
Loomis AB
|
|
20,187 |
|
894,546 |
Peab AB Class B
|
|
46,198 |
|
360,232 |
Securitas AB Class B
|
|
10,322 |
|
157,865 |
SSAB AB Class A
|
|
32,792 |
|
190,699 |
Svenska Handelsbanken AB Class A (a)
|
|
1,989 |
|
25,565 |
Telefonaktiebolaget LM Ericsson Class B
|
|
222,245 |
|
1,768,191 |
| |
|
|
|
|
4,755,058 |
| SWITZERLAND — 2.5% |
|
Avolta AG
|
|
31,167 |
|
1,790,988 |
EFG International AG
|
|
36,646 |
|
728,203 |
Logitech International SA
|
|
18,641 |
|
1,924,788 |
| |
|
|
|
|
4,443,979 |
| UNITED KINGDOM — 13.9% |
|
3i Group PLC
|
|
37,592 |
|
2,042,027 |
AstraZeneca PLC
|
|
3,310 |
|
527,460 |
Aviva PLC
|
|
122,378 |
|
1,077,786 |
Balfour Beatty PLC
|
|
47,226 |
|
378,835 |
Barclays PLC
|
|
486,104 |
|
2,367,893 |
British American Tobacco PLC
|
|
49,731 |
|
2,813,007 |
Drax Group PLC
|
|
75,998 |
|
667,673 |
HSBC Holdings PLC
|
|
24,706 |
|
316,128 |
Imperial Brands PLC
|
|
49,286 |
|
2,079,719 |
International Consolidated Airlines Group SA (a)
|
|
324,087 |
|
1,672,807 |
Johnson Matthey PLC
|
|
36,005 |
|
929,976 |
Keller Group PLC
|
|
6,012 |
|
108,398 |
Lloyds Banking Group PLC
|
|
2,152,764 |
|
2,313,774 |
Mitie Group PLC
|
|
389,755 |
|
737,510 |
NatWest Group PLC
|
|
216,601 |
|
1,494,822 |
OSB Group PLC
|
|
69,844 |
|
497,966 |
Paragon Banking Group PLC
|
|
30,121 |
|
353,783 |
See accompanying notes to financial statements.
2
STATE STREET INTERNATIONAL STOCK SELECTION FUND
SCHEDULE OF INVESTMENTS (continued)
August 31, 2025
| Security Description |
|
|
Shares |
|
Value |
Smith & Nephew PLC
|
|
96,936 |
|
$1,811,988 |
Standard Chartered PLC
|
|
20,127 |
|
377,042 |
Tesco PLC
|
|
368,948 |
|
2,107,878 |
Vodafone Group PLC
|
|
298,682 |
|
351,218 |
| |
|
|
|
|
25,027,690 |
| UNITED STATES — 5.9% |
|
BP PLC
|
|
47,710 |
|
278,639 |
Holcim AG
|
|
23,420 |
|
1,961,057 |
Nestle SA
|
|
4,662 |
|
439,253 |
Novartis AG
|
|
31,659 |
|
4,002,530 |
Roche Holding AG
|
|
10,989 |
|
3,574,876 |
Roche Holding AG Bearer Shares
|
|
251 |
|
86,014 |
Shell PLC
|
|
6,206 |
|
228,490 |
| |
|
|
|
|
10,570,859 |
TOTAL COMMON STOCKS
(Cost $147,440,367)
|
|
|
|
|
177,407,238 |
| SHORT-TERM INVESTMENTS — 5.6% |
|
|
|
State Street Institutional U.S. Government Money Market Fund, Class G Shares 4.27% (d) (e)
|
|
5,529,029 |
|
5,529,029 |
State Street Navigator Securities Lending Portfolio II (f) (g)
|
|
4,505,110 |
|
4,505,110 |
TOTAL SHORT-TERM INVESTMENTS
(Cost $10,034,139)
|
|
10,034,139 |
|
TOTAL INVESTMENTS — 103.9%
(Cost $157,474,506)
|
|
187,441,377 |
|
LIABILITIES IN EXCESS OF OTHER
ASSETS — (3.9)%
|
|
(6,983,032) |
|
NET ASSETS — 100.0%
|
|
$180,458,345 |
|
| (a) |
All or a portion of the shares of the security are on loan at August 31, 2025. |
| (b) |
Non-income producing security. |
| (c) |
Securities purchased pursuant to Rule 144A of the Securities Act of 1933, as amended. These securities, which represent 1.8% of net assets as of August 31, 2025, may be resold in transactions exempt from registration, normally to qualified institutional buyers. |
| (d) |
The Fund invested in certain money market funds managed by SSGA Funds Management, Inc. Amounts related to these investments during the year ended August 31, 2025 are shown in the Affiliate Table below. |
| (e) |
The rate shown is the annualized seven-day yield at August 31, 2025. |
| (f) |
The Fund invested in an affiliated entity. Amounts related to these investments during the year ended August 31, 2025 are shown in the Affiliate Table below. |
| (g) |
Investment of cash collateral for securities loaned. |
| REIT |
Real Estate Investment Trust |
At August 31, 2025, open futures contracts were as follows:
| Description |
|
Number of
Contracts |
|
Expiration
Date |
|
Notional
Amount |
|
Value |
|
Unrealized
Appreciation
(Depreciation) |
| MSCI EAFE Index (long) |
|
24 |
|
09/19/2025 |
|
$3,239,955 |
|
$3,265,269 |
|
$25,314 |
During the year ended August 31, 2025, the average notional value related to futures contracts was $2,867,293.
See accompanying notes to financial statements.
3
STATE STREET INTERNATIONAL STOCK SELECTION FUND
SCHEDULE OF INVESTMENTS (continued)
August 31, 2025
The following table summarizes the value of the Fund's investments according to the fair value hierarchy as of August 31, 2025.
| Description |
|
Level 1 –
Quoted Prices |
|
Level 2 –
Other Significant
Observable Inputs |
|
Level 3 –
Significant
Unobservable Inputs |
|
Total |
| ASSETS: |
|
|
|
|
|
|
|
|
| INVESTMENTS: |
|
|
|
|
|
|
|
|
Common Stocks
|
|
$177,407,238 |
|
$— |
|
$— |
|
$177,407,238 |
Short-Term Investments
|
|
10,034,139 |
|
— |
|
— |
|
10,034,139 |
TOTAL INVESTMENTS
|
|
$187,441,377 |
|
$— |
|
$— |
|
$187,441,377 |
| OTHER FINANCIAL INSTRUMENTS: |
|
|
|
|
|
|
|
|
Futures Contracts - Unrealized Appreciation
|
|
$25,314 |
|
$— |
|
$— |
|
$25,314 |
TOTAL OTHER FINANCIAL INSTRUMENTS:
|
|
$25,314 |
|
$— |
|
$— |
|
$25,314 |
Affiliate Table
| |
Number of
Shares Held
at
8/31/24 |
|
Value at
8/31/24 |
|
Cost of
Purchases |
|
Proceeds
from
Shares Sold |
|
Realized
Gain (Loss) |
|
Change in
Unrealized
Appreciation/
Depreciation |
|
Number of
Shares Held
at
8/31/25 |
|
Value at
8/31/25 |
|
Dividend
Income |
State Street Institutional U.S. Government Money Market Fund, Class G Shares
|
533,957 |
|
$533,957 |
|
$75,371,965 |
|
$70,376,893 |
|
$— |
|
$— |
|
5,529,029 |
|
$5,529,029 |
|
$118,491 |
State Street Navigator Securities Lending Portfolio II
|
225,675 |
|
225,675 |
|
48,067,947 |
|
43,788,512 |
|
— |
|
— |
|
4,505,110 |
|
4,505,110 |
|
12,043 |
Total
|
|
|
$759,632 |
|
$123,439,912 |
|
$114,165,405 |
|
$— |
|
$— |
|
|
|
$10,034,139 |
|
$130,534 |
See accompanying notes to financial statements.
4
STATE STREET INTERNATIONAL STOCK SELECTION FUND
Statement of Assets and Liabilities
August 31, 2025
| ASSETS |
|
Investments in unaffiliated issuers, at value*
|
$177,407,238 |
Investments in affiliated issuers, at value
|
10,034,139 |
Total Investments
|
187,441,377 |
Foreign currency, at value
|
778,815 |
Net cash at broker
|
53,164 |
Receivable from broker — variation margin on open futures contracts
|
25,365 |
Receivable for investments sold
|
6,231,398 |
Receivable for fund shares sold
|
24,109 |
Dividends receivable — unaffiliated issuers
|
485,165 |
Dividends receivable — affiliated issuers
|
12,110 |
Securities lending income receivable — unaffiliated issuers
|
267 |
Securities lending income receivable — affiliated issuers
|
881 |
Net receivable for foreign taxes recoverable
|
613,100 |
Prepaid expenses and other assets
|
1,521 |
TOTAL ASSETS
|
195,667,272 |
| LIABILITIES |
|
Payable upon return of securities loaned
|
4,505,110 |
Payable for investments purchased
|
10,150,560 |
Payable for fund shares repurchased
|
392,589 |
Advisory fee payable
|
49,099 |
Custodian fees payable
|
21,294 |
Administration fees payable
|
6,335 |
Shareholder servicing fee payable
|
2,462 |
Distribution fees payable
|
24,226 |
Transfer agent fees payable
|
8,641 |
Sub-transfer agent fee payable
|
398 |
Registration and filing fees payable
|
1,454 |
Professional fees payable
|
36,200 |
Printing and postage fees payable
|
3,620 |
Accrued expenses and other liabilities
|
6,939 |
TOTAL LIABILITIES
|
15,208,927 |
NET ASSETS
|
$180,458,345 |
| NET ASSETS CONSIST OF: |
|
Paid-in capital
|
$146,108,390 |
Total distributable earnings (loss)
|
34,349,955 |
NET ASSETS
|
$180,458,345 |
| Class A |
|
Net Assets
|
$672,853 |
Shares Outstanding
|
46,367 |
Net asset value, offering and redemption price per share
|
$14.51 |
Maximum sales charge
|
5.25% |
Maximum offering price per share
|
$15.31 |
| Class I |
|
Net Assets
|
$4,514,880 |
Shares Outstanding
|
320,990 |
Net asset value, offering and redemption price per share
|
$14.07 |
| Class K |
|
Net Assets
|
$47,856,660 |
Shares Outstanding
|
3,401,505 |
Net asset value, offering and redemption price per share
|
$14.07 |
| Class N |
|
Net Assets
|
$127,413,952 |
Shares Outstanding
|
9,037,713 |
Net asset value, offering and redemption price per share
|
$14.10 |
See accompanying notes to financial statements.
5
STATE STREET INTERNATIONAL STOCK SELECTION FUND
Statement of Assets and Liabilities (continued)
August 31, 2025
| COST OF INVESTMENTS: |
|
Investments in unaffiliated issuers
|
$147,440,367 |
Investments in affiliated issuers
|
10,034,139 |
Total cost of investments
|
$157,474,506 |
Foreign currency, at cost
|
$776,857 |
* Includes investments in securities on loan, at value
|
$5,991,138 |
See accompanying notes to financial statements.
6
STATE STREET INTERNATIONAL STOCK SELECTION FUND
Statement of Operations
For the Year Ended August 31, 2025
| INVESTMENT INCOME |
|
Interest income — unaffiliated issuers
|
$3,459 |
Dividend income — unaffiliated issuers
|
5,462,996 |
Dividend income — affiliated issuers
|
118,491 |
Unaffiliated securities lending income
|
5,517 |
Affiliated securities lending income
|
12,043 |
Foreign taxes withheld
|
(494,812) |
TOTAL INVESTMENT INCOME (LOSS)
|
5,107,694 |
| EXPENSES |
|
Advisory fee
|
1,082,852 |
Administration fees
|
72,190 |
| Shareholder servicing fees |
|
Class N
|
21,574 |
| Distribution fees |
|
Class A
|
740 |
Class N
|
211,047 |
Custodian fees
|
75,448 |
Trustees’ fees and expenses
|
21,200 |
Transfer agent fees
|
30,742 |
Class A
|
542 |
Class I
|
2,416 |
Registration and filing fees
|
68,834 |
Professional fees and expenses
|
35,944 |
Printing and postage fees
|
12,575 |
Insurance expense
|
1,520 |
Taxes and fees
|
2,117 |
Miscellaneous expenses
|
25,006 |
TOTAL EXPENSES
|
1,664,747 |
Expenses waived/reimbursed by the Adviser
|
(343,459) |
NET EXPENSES
|
1,321,288 |
NET INVESTMENT INCOME (LOSS)
|
$3,786,406 |
| REALIZED AND UNREALIZED GAIN (LOSS) |
|
| Net realized gain (loss) on: |
|
Investments — unaffiliated issuers
|
17,410,709 |
Foreign currency transactions
|
12,419 |
Futures contracts
|
41,342 |
Net realized gain (loss)
|
17,464,470 |
| Net change in unrealized appreciation/depreciation on: |
|
Investments — unaffiliated issuers
|
10,444,077 |
Foreign currency translations
|
22,033 |
Futures contracts
|
(124,434) |
Net change in unrealized appreciation/depreciation
|
10,341,676 |
NET REALIZED AND UNREALIZED GAIN (LOSS)
|
27,806,146 |
NET INCREASE (DECREASE) IN NET ASSETS FROM OPERATIONS
|
$31,592,552 |
See accompanying notes to financial statements.
7
STATE STREET INTERNATIONAL STOCK SELECTION FUND
Statements of Changes in Net Assets
| |
Year Ended
8/31/25 |
|
Year Ended
8/31/24 |
| INCREASE (DECREASE) IN NET ASSETS FROM OPERATIONS: |
|
|
|
Net investment income (loss)
|
$3,786,406 |
|
$3,578,720 |
Net realized gain (loss)
|
17,464,470 |
|
9,308,377 |
Net change in unrealized appreciation/depreciation
|
10,341,676 |
|
11,451,073 |
Net increase (decrease) in net assets resulting from operations
|
31,592,552 |
|
24,338,170 |
| DISTRIBUTIONS TO SHAREHOLDERS: |
|
|
|
Class A
|
(4,959) |
|
(2,111) |
Class I
|
(111,914) |
|
(138,906) |
Class K
|
(1,651,465) |
|
(2,507,061) |
Class N
|
(2,776,249) |
|
(4,563,615) |
Total distributions to shareholders
|
(4,544,587) |
|
(7,211,693) |
| FROM BENEFICIAL INTEREST TRANSACTIONS: |
|
|
|
| Class A |
|
|
|
Proceeds from shares sold
|
544,345 |
|
24,800 |
Reinvestment of distributions
|
4,959 |
|
2,111 |
Cost of shares redeemed
|
(81,828) |
|
(12,906) |
Net increase (decrease) from capital share transactions
|
467,476 |
|
14,005 |
| Class I |
|
|
|
Proceeds from shares sold
|
2,651,381 |
|
1,328,948 |
Reinvestment of distributions
|
111,481 |
|
135,635 |
Cost of shares redeemed
|
(2,300,651) |
|
(976,950) |
Net increase (decrease) from capital share transactions
|
462,211 |
|
487,633 |
| Class K |
|
|
|
Proceeds from shares sold
|
22,739,892 |
|
10,404,594 |
Reinvestment of distributions
|
1,651,465 |
|
2,507,061 |
Cost of shares redeemed
|
(33,152,079) |
|
(15,568,949) |
Net increase (decrease) from capital share transactions
|
(8,760,722) |
|
(2,657,294) |
| Class N |
|
|
|
Proceeds from shares sold
|
38,825,159 |
|
2,069,848 |
Reinvestment of distributions
|
2,745,752 |
|
4,517,055 |
Cost of shares redeemed
|
(19,968,600) |
|
(16,030,445) |
Net increase (decrease) from capital share transactions
|
21,602,311 |
|
(9,443,542) |
Net increase (decrease) in net assets from beneficial interest transactions
|
13,771,276 |
|
(11,599,198) |
Net increase (decrease) in net assets during the period
|
40,819,241 |
|
5,527,279 |
Net assets at beginning of period
|
139,639,104 |
|
134,111,825 |
NET ASSETS AT END OF PERIOD
|
$180,458,345 |
|
$139,639,104 |
| SHARES OF BENEFICIAL INTEREST: |
|
|
|
| Class A |
|
|
|
Shares sold
|
41,633 |
|
2,094 |
Reinvestment of distributions
|
440 |
|
197 |
Shares redeemed
|
(5,989) |
|
(1,155) |
Net increase (decrease) from capital share transactions
|
36,084 |
|
1,136 |
| Class I |
|
|
|
Shares sold
|
212,526 |
|
119,388 |
Reinvestment of distributions
|
10,237 |
|
13,118 |
Shares redeemed
|
(179,575) |
|
(90,231) |
Net increase (decrease) from capital share transactions
|
43,188 |
|
42,275 |
| Class K |
|
|
|
Shares sold
|
1,894,598 |
|
941,261 |
Reinvestment of distributions
|
151,650 |
|
242,462 |
Shares redeemed
|
(2,738,922) |
|
(1,433,868) |
Net increase (decrease) from capital share transactions
|
(692,674) |
|
(250,145) |
| Class N |
|
|
|
Shares sold
|
3,016,471 |
|
188,555 |
Reinvestment of distributions
|
251,212 |
|
435,169 |
Shares redeemed
|
(1,617,731) |
|
(1,491,000) |
Net increase (decrease) from capital share transactions
|
1,649,952 |
|
(867,276) |
See accompanying notes to financial statements.
8
STATE STREET INTERNATIONAL STOCK SELECTION FUND
FINANCIAL HIGHLIGHTS
Selected data for a share outstanding throughout each period
| |
Class A |
| |
Year Ended
8/31/25 |
|
Year Ended
8/31/24 |
|
Year Ended
8/31/23 |
|
Year Ended
8/31/22 |
|
Year Ended
8/31/21 |
Net asset value, beginning of period
|
$12.22 |
|
$10.41 |
|
$9.11 |
|
$11.84 |
|
$9.46 |
| Income (loss) from investment operations: |
|
|
|
|
|
|
|
|
|
Net investment income (loss) (a)(b)
|
0.32 |
|
0.26 |
|
0.17 |
|
0.32 |
|
0.25 |
Net realized and unrealized gain (loss)
|
2.36 |
|
1.78 |
|
1.16 |
|
(2.57) |
|
2.31 |
Total from investment operations
|
2.68 |
|
2.04 |
|
1.33 |
|
(2.25) |
|
2.56 |
| Distributions to shareholders from: |
|
|
|
|
|
|
|
|
|
Net investment income
|
(0.39) |
|
(0.23) |
|
(0.03) |
|
(0.48) |
|
(0.18) |
Net asset value, end of period
|
$14.51 |
|
$12.22 |
|
$10.41 |
|
$9.11 |
|
$11.84 |
Total return (c)
|
22.83% |
|
19.89% |
|
14.68% |
|
(19.76)% |
|
27.33% |
| Ratios and Supplemental Data: |
|
|
|
|
|
|
|
|
|
Net assets, end of period (in 000s)
|
$673 |
|
$126 |
|
$95 |
|
$3,725 |
|
$4,642 |
| Ratios to Average Net Assets: |
|
|
|
|
|
|
|
|
|
Total expenses (b)
|
1.42% |
|
1.49% |
|
1.67% |
|
1.44% |
|
1.55% |
Net expenses (b)
|
1.18% |
|
1.24% |
|
1.43% |
|
1.20% |
|
1.29% |
Net investment income (loss) (b)
|
2.49% |
|
2.40% |
|
1.87% |
|
3.05% |
|
2.30% |
Portfolio turnover rate
|
131% |
|
98% |
|
106% |
|
120% |
|
111% |
| (a) |
Average daily shares outstanding were used for this calculation. |
| (b) |
May reflect amounts waived and/or reimbursed by the investment adviser and for certain funds, custody credit arrangements. |
| (c) |
Total return is calculated assuming a purchase of shares at net asset value on the first day and a sale at net asset value on the last day of each period reported. Distributions are assumed, for the purpose of this calculation, to be reinvested at net asset value per share on the respective payment dates of the Fund. Results represent past performance and are not indicative of future results. |
See accompanying notes to financial statements.
9
STATE STREET INTERNATIONAL STOCK SELECTION FUND
FINANCIAL HIGHLIGHTS (continued)
Selected data for a share outstanding throughout each period
| |
Class I |
| |
Year Ended
8/31/25 |
|
Year Ended
8/31/24 |
|
Year Ended
8/31/23 |
|
Year Ended
8/31/22 |
|
Year Ended
8/31/21 |
Net asset value, beginning of period
|
$11.85 |
|
$10.43 |
|
$9.17 |
|
$11.93 |
|
$9.51 |
| Income (loss) from investment operations: |
|
|
|
|
|
|
|
|
|
Net investment income (loss) (a)(b)
|
0.34 |
|
0.30 |
|
0.34 |
|
0.37 |
|
0.31 |
Net realized and unrealized gain (loss)
|
2.30 |
|
1.73 |
|
1.27 |
|
(2.59) |
|
2.32 |
Total from investment operations
|
2.64 |
|
2.03 |
|
1.61 |
|
(2.22) |
|
2.63 |
| Distributions to shareholders from: |
|
|
|
|
|
|
|
|
|
Net investment income
|
(0.42) |
|
(0.61) |
|
(0.35) |
|
(0.54) |
|
(0.21) |
Net asset value, end of period
|
$14.07 |
|
$11.85 |
|
$10.43 |
|
$9.17 |
|
$11.93 |
Total return (c)
|
23.20% |
|
20.44% |
|
17.82% |
|
(19.47)% |
|
27.94% |
| Ratios and Supplemental Data: |
|
|
|
|
|
|
|
|
|
Net assets, end of period (in 000s)
|
$4,515 |
|
$3,291 |
|
$2,456 |
|
$2,604 |
|
$3,419 |
| Ratios to Average Net Assets: |
|
|
|
|
|
|
|
|
|
Total expenses (b)
|
1.05% |
|
1.09% |
|
1.11% |
|
1.04% |
|
1.11% |
Net expenses (b)
|
0.82% |
|
0.84% |
|
0.87% |
|
0.81% |
|
0.85% |
Net investment income (loss) (b)
|
2.76% |
|
2.81% |
|
3.42% |
|
3.46% |
|
2.88% |
Portfolio turnover rate
|
131% |
|
98% |
|
106% |
|
120% |
|
111% |
| (a) |
Average daily shares outstanding were used for this calculation. |
| (b) |
May reflect amounts waived and/or reimbursed by the investment adviser and for certain funds, custody credit arrangements. |
| (c) |
Total return is calculated assuming a purchase of shares at net asset value on the first day and a sale at net asset value on the last day of each period reported. Distributions are assumed, for the purpose of this calculation, to be reinvested at net asset value per share on the respective payment dates of the Fund. Results represent past performance and are not indicative of future results. |
See accompanying notes to financial statements.
10
STATE STREET INTERNATIONAL STOCK SELECTION FUND
FINANCIAL HIGHLIGHTS (continued)
Selected data for a share outstanding throughout each period
| |
Class K |
| |
Year Ended
8/31/25 |
|
Year Ended
8/31/24 |
|
Year Ended
8/31/23 |
|
Year Ended
8/31/22 |
|
Year Ended
8/31/21 |
Net asset value, beginning of period
|
$11.85 |
|
$10.43 |
|
$9.17 |
|
$11.93 |
|
$9.52 |
| Income (loss) from investment operations: |
|
|
|
|
|
|
|
|
|
Net investment income (loss) (a)(b)
|
0.35 |
|
0.31 |
|
0.36 |
|
0.35 |
|
0.32 |
Net realized and unrealized gain (loss)
|
2.30 |
|
1.73 |
|
1.25 |
|
(2.57) |
|
2.31 |
Total from investment operations
|
2.65 |
|
2.04 |
|
1.61 |
|
(2.22) |
|
2.63 |
| Distributions to shareholders from: |
|
|
|
|
|
|
|
|
|
Net investment income
|
(0.43) |
|
(0.62) |
|
(0.35) |
|
(0.54) |
|
(0.22) |
Net asset value, end of period
|
$14.07 |
|
$11.85 |
|
$10.43 |
|
$9.17 |
|
$11.93 |
Total return (c)
|
23.38% |
|
20.45% |
|
18.01% |
|
(19.42)% |
|
27.97% |
| Ratios and Supplemental Data: |
|
|
|
|
|
|
|
|
|
Net assets, end of period (in 000s)
|
$47,857 |
|
$48,521 |
|
$45,320 |
|
$66,731 |
|
$76,748 |
| Ratios to Average Net Assets: |
|
|
|
|
|
|
|
|
|
Total expenses (b)
|
0.99% |
|
1.00% |
|
0.99% |
|
0.98% |
|
1.01% |
Net expenses (b)
|
0.75% |
|
0.75% |
|
0.75% |
|
0.75% |
|
0.75% |
Net investment income (loss) (b)
|
2.90% |
|
2.87% |
|
3.70% |
|
3.25% |
|
2.93% |
Portfolio turnover rate
|
131% |
|
98% |
|
106% |
|
120% |
|
111% |
| (a) |
Average daily shares outstanding were used for this calculation. |
| (b) |
May reflect amounts waived and/or reimbursed by the investment adviser and for certain funds, custody credit arrangements. |
| (c) |
Total return is calculated assuming a purchase of shares at net asset value on the first day and a sale at net asset value on the last day of each period reported. Distributions are assumed, for the purpose of this calculation, to be reinvested at net asset value per share on the respective payment dates of the Fund. Results represent past performance and are not indicative of future results. |
See accompanying notes to financial statements.
11
STATE STREET INTERNATIONAL STOCK SELECTION FUND
FINANCIAL HIGHLIGHTS (continued)
Selected data for a share outstanding throughout each period
| |
Class N |
| |
Year Ended
8/31/25 |
|
Year Ended
8/31/24 |
|
Year Ended
8/31/23 |
|
Year Ended
8/31/22 |
|
Year Ended
8/31/21 |
Net asset value, beginning of period
|
$11.87 |
|
$10.45 |
|
$9.18 |
|
$11.94 |
|
$9.53 |
| Income (loss) from investment operations: |
|
|
|
|
|
|
|
|
|
Net investment income (loss) (a)(b)
|
0.30 |
|
0.29 |
|
0.33 |
|
0.35 |
|
0.29 |
Net realized and unrealized gain (loss)
|
2.33 |
|
1.72 |
|
1.27 |
|
(2.60) |
|
2.32 |
Total from investment operations
|
2.63 |
|
2.01 |
|
1.60 |
|
(2.25) |
|
2.61 |
| Distributions to shareholders from: |
|
|
|
|
|
|
|
|
|
Net investment income
|
(0.40) |
|
(0.59) |
|
(0.33) |
|
(0.51) |
|
(0.20) |
Net asset value, end of period
|
$14.10 |
|
$11.87 |
|
$10.45 |
|
$9.18 |
|
$11.94 |
Total return (c)
|
23.09% |
|
20.09% |
|
17.79% |
|
(19.61)% |
|
27.63% |
| Ratios and Supplemental Data: |
|
|
|
|
|
|
|
|
|
Net assets, end of period (in 000s)
|
$127,414 |
|
$87,702 |
|
$86,241 |
|
$86,569 |
|
$117,474 |
| Ratios to Average Net Assets: |
|
|
|
|
|
|
|
|
|
Total expenses (b)
|
1.24% |
|
1.25% |
|
1.24% |
|
1.23% |
|
1.26% |
Net expenses (b)
|
1.00% |
|
1.00% |
|
1.00% |
|
1.00% |
|
1.00% |
Net investment income (loss) (b)
|
2.48% |
|
2.64% |
|
3.34% |
|
3.25% |
|
2.64% |
Portfolio turnover rate
|
131% |
|
98% |
|
106% |
|
120% |
|
111% |
| (a) |
Average daily shares outstanding were used for this calculation. |
| (b) |
May reflect amounts waived and/or reimbursed by the investment adviser and for certain funds, custody credit arrangements. |
| (c) |
Total return is calculated assuming a purchase of shares at net asset value on the first day and a sale at net asset value on the last day of each period reported. Distributions are assumed, for the purpose of this calculation, to be reinvested at net asset value per share on the respective payment dates of the Fund. Results represent past performance and are not indicative of future results. |
See accompanying notes to financial statements.
12
SSGA FUNDS
STATE STREET INTERNATIONAL STOCK SELECTION FUND
Notes to Financial Statements — August 31, 2025
1. Organization
The SSGA Funds (the “Trust”), a Massachusetts business trust registered under the Investment Company Act of 1940, as amended (the “1940 Act”), is an open-end management investment company.
As of August 31, 2025, the Trust consists of two (2) series (and corresponding classes, each of which have the same rights and privileges, including voting rights), each of which represents a separate series of beneficial interest in the Trust. The Declaration of Trust permits the Board of Trustees of the Trust (the “Board” and each member thereof, a “Trustee”) to authorize the issuance of an unlimited number of shares of beneficial interest at $0.001 par value. The financial statements herein relate to the following series (the “Fund”):
| Fund |
Classes |
Commencement of
Operations |
Diversification
Classification |
| State Street International Stock Selection Fund |
Class A
Class I
Class K
Class N |
July 7, 2014
July 7, 2014
July 7, 2014
March 7, 1995 |
Diversified |
Class A shares are available to the general public for investment through transaction-based financial intermediaries. Class A shares impose a sales charge (as a percentage of offering price) and may be subject to a 1.00% contingent deferred sales charge (“CDSC”) if no initial sales charge was paid at the time of purchase of an investment of $1,000,000 or more and the shares are redeemed within 18 months of purchase. Class I, Class K and Class N shares are sold without a sales charge and only to certain eligible investors.
Under the Trust’s organizational documents, its officers and Trustees are indemnified against certain liabilities arising out of the performance of their duties to the Trust. Additionally, in the normal course of business, the Trust enters into contracts with service providers that contain general indemnification clauses. The Trust’s maximum exposure under these arrangements is unknown as this would involve future claims that may be made against the Trust that have not yet occurred.
2. Segment Reporting
The Fund has one reportable segment. Business activities are managed on a consolidated basis and revenues are derived primarily through the Fund's investments in accordance with its investment objective. The Fund's chief operating decision maker (“CODM”) is the President of the Trust. The CODM assesses performance based on the Fund's Total Return as reported in the Financial Highlights, and the same accounting policies are applied as described in the summary of significant accounting policies. The Fund's Total Return is utilized by the CODM to compare results, including the impact of the Fund's costs, to the Fund's competitors and to the Fund's benchmark index.
3. Summary of Significant Accounting Policies
The following is a summary of significant accounting policies followed by the Trust in the preparation of its financial statements:
The preparation of financial statements in accordance with U.S. generally accepted accounting principles (“U.S. GAAP”) requires management to make estimates and assumptions that affect the reported amounts and disclosures in the financial statements. Actual results could differ from those estimates. The Fund is an investment company under U.S. GAAP and follows the accounting and reporting guidance applicable to investment companies.
Security Valuation
The Fund's investments are valued at fair value each day that the New York Stock Exchange (“NYSE”) is open and, for financial reporting purposes, as of the report date should the reporting period end on a day that the NYSE is not open. Fair value is generally defined as the price the Fund would receive to sell an asset or pay to transfer a liability in an orderly transaction between market participants at the measurement date. By its nature, a fair value price is a good faith estimate of the valuation in a current sale and may not reflect an actual market price. The investments of the Fund are valued pursuant to the policy and procedures developed by the Oversight Committee (the “Committee”) and approved by the Board. The Committee provides oversight of the valuation of investments for the Fund. The Board has responsibility for overseeing the determination of the fair value of investments.
SSGA FUNDS
STATE STREET INTERNATIONAL STOCK SELECTION FUND (continued)
Notes to Financial Statements — August 31, 2025
Valuation techniques used to value the Fund's investments by major category are as follows:
• Equity investments traded on a recognized securities exchange for which market quotations are readily available are valued at the last sale price or official closing price, as applicable, on the primary market or exchange on which they trade. Equity investments traded on a recognized exchange for which there were no sales on that day are valued at the last published sale price or at fair value.
• Investments in registered investment companies (including money market funds) or other unitized pooled investment vehicles that are not traded on an exchange are valued at that day’s published net asset value (“NAV”) per share or unit.
• Exchange-traded futures contracts are valued at the closing settlement price on the primary market on which they are traded most extensively. Exchange-traded futures contracts traded on a recognized exchange for which there were no sales on that day are valued at the last reported sale price obtained from independent pricing services or brokers or at fair value.
In the event prices or quotations are not readily available or that the application of these valuation methods results in a price for an investment that is deemed to be not representative of the fair value of such investment, fair value will be determined in good faith by the Committee, in accordance with the valuation policy and procedures approved by the Board.
A “significant event” is an event that the Board believes, with a reasonably high degree of certainty, has caused the closing market prices of the Fund’s portfolio securities to no longer reflect their value at the time of the Fund’s net asset value calculation. Fair value may be determined using an independent fair value service under valuation procedures approved by the Board. The independent fair value service takes into account multiple factors including, but not limited to, movements in the U.S. securities markets, certain depositary receipts, futures contracts and foreign currency exchange rates that have occurred subsequent to the close of foreign securities exchanges. The use of the independent fair value service or alternative fair valuation methods would result in the investments being classified within Level 2 of the fair value hierarchy.
Various inputs are used in determining the value of the Fund's investments.
The Fund values its assets and liabilities at fair value using a fair value hierarchy consisting of three broad levels that prioritize the inputs to valuation techniques giving the highest priority to readily available unadjusted quoted prices in active markets for identical assets or liabilities (Level 1 measurements) and the lowest priority to unobservable inputs (Level 3 measurements) when market prices are not readily available or reliable. The categorization of a value determined for an investment within the hierarchy is based upon the pricing transparency of the investment and is not necessarily an indication of the risk associated with investing in it.
The three levels of the fair value hierarchy are as follows:
• Level 1 – Unadjusted quoted prices in active markets for an identical asset or liability;
• Level 2 – Inputs other than quoted prices included within Level 1 that are observable for the asset or liability either directly or indirectly, including quoted prices for similar assets or liabilities in active markets, quoted prices for identical or similar assets or liabilities in markets that are not considered to be active, inputs other than quoted prices that are observable for the asset or liability (such as exchange rates, financing terms, interest rates, yield curves, volatilities, prepayment speeds, loss severities, credit risks and default rates) or other market-corroborated inputs; and
• Level 3 – Unobservable inputs for the asset or liability, including the Committee’s assumptions used in determining the fair value of investments.
The value of the Fund’s investments according to the fair value hierarchy as of August 31, 2025 is disclosed in the Fund’s Schedule of Investments.
Investment Transactions and Income Recognition
Investment transactions are accounted for on trade date for financial reporting purposes. Realized gains and losses from the sale or disposition of investments and foreign exchange transactions, if any, are determined using the identified cost method.
SSGA FUNDS
STATE STREET INTERNATIONAL STOCK SELECTION FUND (continued)
Notes to Financial Statements — August 31, 2025
Dividend income and capital gain distributions, if any, are recognized on the ex-dividend date, or when the information becomes available, net of any foreign taxes withheld at source, if any. Interest income is recorded daily on an accrual basis. All premiums and discounts are amortized/accreted for financial reporting purposes.
Non-cash dividends received in the form of stock are recorded as dividend income at fair value. Distributions received by the Fund may include a return of capital that is estimated by management. Such amounts are recorded as a reduction of the cost of investments or reclassified to capital gains.
Expenses
Certain expenses, which are directly identifiable to a specific Fund, are applied to that Fund within the Trust. Other expenses which cannot be attributed to a specific Fund are allocated in such a manner as deemed equitable, taking into consideration the nature and type of expense and the relative net assets of the Funds within the Trust. Class specific expenses are borne by each class.
Foreign Currency Translation
The accounting records of the Fund are maintained in U.S. dollars. Foreign currencies as well as investment securities and other assets and liabilities denominated in a foreign currency are translated to U.S. dollars using exchange rates at period end. Purchases and sales of securities, income receipts and expense payments denominated in foreign currencies are translated into U.S. dollars at the prevailing exchange rate on the respective dates of the transactions.
The effects of exchange rate fluctuations on investments are included with the net realized and unrealized gain (loss) on investment securities. Other foreign currency transactions resulting in realized and unrealized gain (loss) are disclosed separately.
Foreign Taxes
The Fund may be subject to foreign taxes (a portion of which may be reclaimable) on income, stock dividends, realized and unrealized capital gains on investments or certain foreign currency transactions. Foreign taxes are recorded in accordance with SSGA Funds Management, Inc.’s (the “Adviser” or “SSGA FM”) understanding of the applicable foreign tax regulations and rates that exist in the foreign jurisdictions in which the Fund invests. These foreign taxes, if any, are paid by the Fund and are reflected in the Statement of Operations, if applicable. Foreign taxes payable or deferred as of August 31, 2025, if any, are disclosed in the Fund's Statement of Assets and Liabilities.
As a result of several court cases, in certain countries across the European Union ("EU"), the Fund filed for additional tax reclaims for previously withheld taxes on dividends earned in those countries. These additional filings are subject to various administrative proceedings by the local jurisdictions’ tax authorities within the EU, as well as a number of related judicial proceedings. Income recognized for such EU reclaims is reflected in the Statement of Operations. When uncertainty exists as to the ultimate resolution of these proceedings, the likelihood of receipt of these EU reclaims, and the potential timing of payment, no amounts are reflected in the financial statements.
For U.S. income tax purposes, EU reclaims received by the Fund, if any, during a fiscal year reduce the amounts of foreign taxes that the Fund passes through to its shareholders for their use as foreign tax credits on their individual income tax returns. In the event that EU reclaims received by the Fund during the fiscal year exceed foreign withholding taxes paid, and the Fund previously passed through those refunded EU taxes to its shareholders for their use as foreign tax credits on prior year individual income tax returns the Fund will enter into a closing agreement with the Internal Revenue Service (the "IRS") in order to pay the associated tax liability on behalf of the Fund's shareholders, payable by the Fund to the IRS as a compliance fee.
Distributions
Distributions from net investment income, if any, are declared and paid annually. Net realized capital gains, if any, are distributed annually, unless additional distributions are required for compliance with applicable tax regulations. The amount and character of income and capital gains to be distributed are determined in accordance with applicable tax regulations which may differ from net investment income and realized gains recognized for U.S. GAAP purposes.
SSGA FUNDS
STATE STREET INTERNATIONAL STOCK SELECTION FUND (continued)
Notes to Financial Statements — August 31, 2025
4. Derivative Financial Instruments
Futures Contracts
The Fund may enter into futures contracts to meet the Fund's objectives. A futures contract is a standardized, exchange-traded agreement to buy or sell a financial instrument at a set price on a future date. Upon entering into a futures contract, the Fund is required to deposit with the broker, cash or securities in an amount equal to the minimum initial margin requirements of the clearing house. Securities deposited, if any, are designated on the Schedule of Investments and cash deposited, if any, is included in Net cash at broker on the Statement of Assets and Liabilities. Subsequent payments are made or received by the Fund equal to the daily change in the contract value, accumulated, exchange rates and or other transactional fees. The accumulation of those payments are recorded as variation margin receivable or payable with a corresponding offset to unrealized gains or losses. The Fund recognizes a realized gain or loss when the contract is closed.
Losses may arise if the value of a futures contract decreases due to unfavorable changes in the market rates or values of the underlying instrument during the term of the contract or if the counterparty does not perform under the contract. The use of futures contracts also involves the risk that the movements in the price of the futures contracts do not correlate with the movement of the assets underlying such contracts.
For the year ended August 31, 2025, the Fund entered into futures contracts in order to equitize cash.
The following tables summarize the value of the Fund's derivative instruments as of August 31, 2025, and the related location in the accompanying Statement of Assets and Liabilities and Statement of Operations, presented by primary underlying risk exposure:
| |
Asset Derivatives |
| |
Interest
Rate
Risk |
|
Foreign
Exchange
Risk |
|
Credit
Risk |
|
Equity
Risk |
|
Commodity
Risk |
|
Total |
| State Street International Stock Selection Fund |
|
|
|
|
|
|
|
|
|
|
|
Futures Contracts
|
$— |
|
$— |
|
$— |
|
$25,365 |
|
$— |
|
$25,365 |
| |
Net Realized Gain (Loss) |
| |
Interest
Rate
Risk |
|
Foreign
Exchange
Risk |
|
Credit
Risk |
|
Equity
Risk |
|
Commodity
Risk |
|
Total |
| State Street International Stock Selection Fund |
|
|
|
|
|
|
|
|
|
|
|
Futures Contracts
|
$— |
|
$— |
|
$— |
|
$41,342 |
|
$— |
|
$41,342 |
| |
Net Change in Unrealized Appreciation/Depreciation |
| |
Interest
Rate
Risk |
|
Foreign
Exchange
Risk |
|
Credit
Risk |
|
Equity
Risk |
|
Commodity
Risk |
|
Total |
| State Street International Stock Selection Fund |
|
|
|
|
|
|
|
|
|
|
|
Futures Contracts
|
$— |
|
$— |
|
$— |
|
$(124,434) |
|
$— |
|
$(124,434) |
5. Fees and Transactions with Affiliates
Advisory Fees
SSGA FM manages the Fund pursuant to an Investment Advisory Agreement between the Trust and the Adviser. The Adviser is a wholly-owned subsidiary of State Street Global Advisors, Inc., which itself is a wholly owned subsidiary of State Street Corporation. The Adviser and other advisory affiliates of State Street Corporation make up State Street Global Advisors, the investment management arm of State Street Corporation and its affiliated companies. The Adviser directs the investments of the Fund in accordance with its investment objectives, policies and limitations. For its services, the Fund pays the Adviser a management fee at an annual rate of 0.75% of its average daily net assets. The fees are accrued daily and paid monthly.
SSGA FUNDS
STATE STREET INTERNATIONAL STOCK SELECTION FUND (continued)
Notes to Financial Statements — August 31, 2025
The Adviser is contractually obligated until December 31, 2025 to waive up to the full amount of its management fee and/or to reimburse the Fund for expenses to the extent that total annual Fund operating expenses (exclusive of non-recurring account fees, extraordinary expenses, acquired fund fees and expenses, and distribution, shareholder servicing and sub-transfer agency fees) exceed 0.75% of average daily net assets on an annual basis. This waiver and/or reimbursement may not be terminated prior to December 31, 2025 except with the approval of the Board. During the year ended August 31, 2025, SSGA FM agreed to reimburse fees of $329,021.
Administrator, Sub-Administrator and Custodian Fees
SSGA FM serves as administrator and State Street Bank and Trust Company (“State Street”), an affiliate of the Adviser, serves as custodian and sub-administrator. For its administrative services, the Fund pays SSGA FM a fee at an annual rate of 0.05% of its average daily net assets. The fees are accrued daily and paid monthly. SSGA FM has contractually agreed to waive 0.01% of its administration fee. The waiver may not be terminated or modified except with the approval of the Board and shall continue until at least December 31, 2025. For the year ended August 31, 2025, SSGA FM waived fees in the amount of $14,438.
The Adviser and the Fund each bear a portion of the fee paid to State Street for providing sub-administration and custodian services with respect to the Fund.
Distribution and Shareholder Servicing Fees
State Street Global Advisors Funds Distributors, LLC (“SSGA FD” or the “Distributor”) an affiliate of the Adviser, serves as the distributor of the Trust.
The Fund adopted a distribution plan pursuant to Rule 12b-1 under the 1940 Act, under which the Fund may compensate the Distributor (or others) for services in connection with the distribution of the Fund’s Class A and Class N shares and for services provided to shareholders in those classes (the “Plan”).
The Plan calls for payments at an annual rate (based on average daily net assets) of 0.25% of the Fund’s net assets attributable to its Class A shares and 0.25% of the Fund’s net assets attributable to its Class N shares. In addition to payments under the Plan, the Fund may reimburse the Distributor or its affiliates for payments it makes to financial intermediaries that provide certain administrative, recordkeeping and account maintenance services. The amount of the reimbursement and the manner in which it is calculated are reviewed by the Trustees periodically.
Other Transactions with Affiliates - Securities Lending
State Street, an affiliate of the Fund, acts as the securities lending agent for the Fund, pursuant to an amended and restated securities lending authorization agreement dated January 6, 2017, as amended.
Net proceeds collected by State Street on investment of cash collateral or any fee income less rebates payable to borrowers are paid as follows: If the calendar year to date net proceeds are below a specified threshold across participating affiliated funds, the Fund retains eighty five percent (85%) of the net proceeds and fifteen percent (15%) of such net proceeds is payable to State Street. Starting the business day following the date that calendar year to date net proceeds exceeds a specified threshold, the Fund retains ninety percent (90%) of the net proceeds and ten percent (10%) of such net proceeds is payable to State Street.
In addition, cash collateral from lending activities is invested in the State Street Navigator Securities Lending Portfolio II, an affiliated fund, for which SSGA FM serves as investment adviser. See Note 9 for additional information regarding securities lending.
Other Transactions with Affiliates
The Fund may invest in affiliated entities, including securities issued by State Street Corporation, affiliated funds, or entities deemed to be affiliates as a result of the Fund owning more than five percent of the entity’s voting securities or outstanding shares. Amounts relating to these transactions during the year ended August 31, 2025 are disclosed in the Fund's Schedule of Investments.
6. Trustees’ Fees
The fees and expenses of the Trustees, who are not “interested persons” of the Trust, as defined in the 1940 Act (“Independent Trustees”), are paid directly by the Fund. The Independent Trustees are reimbursed for travel and other out-of-pocket expenses in connection with meeting attendance and industry seminars.
SSGA FUNDS
STATE STREET INTERNATIONAL STOCK SELECTION FUND (continued)
Notes to Financial Statements — August 31, 2025
7. Investment Transactions
Purchases and sales of investments (excluding in-kind transactions, derivative contracts and short term investments) for the year ended August 31, 2025 were as follows:
| |
Purchases |
|
Sales |
State Street International Stock Selection Fund
|
$197,721,564 |
|
$185,267,972 |
8. Income Tax Information
The Fund has qualified and intends to continue to qualify as a regulated investment company under Subchapter M of the Internal Revenue Code of 1986, as amended. The Fund will not be subject to federal income taxes to the extent it distributes its taxable income, including any net realized capital gains, for each fiscal year. Therefore, no provision for federal income tax is required.
The Fund files federal and various state and local tax returns as required. No income tax returns are currently under examination. Generally, the federal returns are subject to examination by the Internal Revenue Service for a period of three years from date of filing, while the state returns may remain open for an additional year depending upon jurisdiction. SSGA FM has analyzed the Fund's tax positions taken on tax returns for all open years and does not believe there are any uncertain tax positions that would require recognition of a tax liability.
Distributions to shareholders are recorded on ex-dividend date. Income dividends and gain distributions are determined in accordance with income tax rules and regulations, which may differ from generally accepted accounting principles.
Certain capital accounts in the financial statements have been adjusted for permanent book-tax differences. These adjustments have no impact on net asset values or results of operations. Temporary book-tax differences will reverse in the future. These book-tax differences are primarily due to foreign currencies, passive foreign investment companies, wash sale loss deferrals, and futures contracts. In addition, the Fund has claimed a portion of the payments made to redeeming shareholders as a distribution for income tax purposes.
The tax character of distributions paid during the year ended August 31, 2025 was as follows:
| |
Ordinary
Income |
|
Long-Term
Capital Gains |
|
Total |
State Street International Stock Selection Fund
|
$4,544,587 |
|
$— |
|
$4,544,587 |
The tax character of distributions paid during the year ended August 31, 2024 was as follows:
| |
Ordinary
Income |
|
Long-Term
Capital Gains |
|
Total |
State Street International Stock Selection Fund
|
$ 7,211,693 |
|
$ — |
|
$ 7,211,693 |
At August 31, 2025, the components of distributable earnings on a tax basis were as follows:
| |
Undistributed
Ordinary Income |
|
Capital Loss
Carryforwards |
|
Undistributed
Long-Term
Capital Gains |
|
Net Unrealized
Gains (Losses) |
|
Total |
State Street International Stock Selection Fund
|
$2,833,291 |
|
$— |
|
$2,189,116 |
|
$29,327,548 |
|
$34,349,955 |
As of August 31, 2025, gross unrealized appreciation and gross unrealized depreciation of investments and other financial instruments based on cost for federal income tax purposes were as follows:
| |
Tax
Cost |
|
Gross
Unrealized
Appreciation |
|
Gross
Unrealized
Depreciation |
|
Net Unrealized
Appreciation
(Depreciation) |
State Street International Stock Selection Fund
|
$158,182,296 |
|
$30,368,943 |
|
$1,084,548 |
|
$29,284,395 |
SSGA FUNDS
STATE STREET INTERNATIONAL STOCK SELECTION FUND (continued)
Notes to Financial Statements — August 31, 2025
9. Securities Lending
The Fund may lend securities to qualified broker-dealers or institutional investors. The loans are secured at all times by cash, cash equivalents or U.S. government securities in an amount at least equal to the market value of the securities loaned, plus accrued interest and dividends, determined on a daily basis and adjusted accordingly. The value of the collateral with respect to a loaned security may be temporarily more or less than the value of a security due to market fluctuations of securities values. With respect to each loan, if on any U.S. business day the aggregate market value of securities collateral plus cash collateral is less than the aggregate market value of the securities which are subject to the loan, the borrower will be notified to provide additional collateral on the next business day.
The Fund will regain record ownership of loaned securities to exercise certain beneficial rights; however, the Fund may bear the risk of delay in recovery of, or even loss of rights in the securities loaned should the borrower fail financially. In addition, the Fund will bear the risk of loss of any cash collateral that it may invest. The Fund receives compensation for lending its securities from interest or dividends earned on the cash, cash equivalents or U.S. government securities held as collateral, net of fee rebates paid to the borrower and net of fees paid to State Street as the lending agent. Additionally, the Fund will receive a fee from the borrower for non-cash collateral equal to a percentage of the market value of the loaned securities.
The market value of securities on loan as of August 31, 2025, and the value of the invested cash collateral are disclosed in the Fund's Statement of Assets and Liabilities. Non-cash collateral is not disclosed in the Fund's Statement of Assets and Liabilities as it is held by the lending agent on behalf of the Fund, and the Fund does not have the ability to re-hypothecate those securities. Securities lending income, as disclosed in the Fund's Statement of Operations, represents the income earned from the non-cash collateral and the investment of cash collateral, net of fee rebates paid to the borrower and net of fees paid to State Street as lending agent.
The following is a summary of the Fund's securities lending agreements and related cash and non-cash collateral received as of August 31, 2025:
| Fund |
|
Market Value of
Securities on Loan |
|
Cash
Collateral
Received |
|
Non-Cash
Collateral
Received* |
|
Total
Collateral
Received |
State Street International Stock Selection Fund
|
|
$ 5,991,138 |
|
$ 4,505,110 |
|
$ 1,857,776 |
|
$ 6,362,886 |
| * |
The non-cash collateral includes U.S. Treasuries and U.S. Government Agency securities. |
The following table reflects a breakdown of transactions accounted for as secured borrowings, the gross obligation by the type of collateral pledged or securities loaned, and the remaining contractual maturity of those transactions as of August 31, 2025:
| |
|
|
|
Remaining Contractual Maturity of the Agreements
as of August 31, 2025 |
| Fund |
|
Securities
Lending
Transactions |
|
Overnight
and
Continuous |
|
<30 Days |
|
Between
30 & 90
Days |
|
>90 Days |
|
Total
Borrowings |
|
Gross Amount
of Recognized
Liabilities for
Securities Lending Transactions |
State Street International Stock Selection Fund
|
|
Common Stocks |
|
$4,505,110 |
|
$— |
|
$— |
|
$— |
|
$4,505,110 |
|
$4,505,110 |
10. Line of Credit
The Fund and other affiliated funds (each, a “Participant” and collectively, the “Participants”) have access to $194.29 million of a $1.36 billion ($180 million of $1.26 billion prior to November 1, 2024 and $180 million of $960 million prior to October 3, 2024) revolving credit facility, provided by a syndication of banks under which the Participants may borrow to fund shareholder redemptions.
Effective October 2, 2025, the Fund and other Participants have access to $210 million of a $1.425 billion revolving credit facility, provided by a syndication of banks under which the Participants may borrow to fund shareholder redemptions. This agreement expires in October 2026 unless extended or renewed.
SSGA FUNDS
STATE STREET INTERNATIONAL STOCK SELECTION FUND (continued)
Notes to Financial Statements — August 31, 2025
The Participants are charged an annual commitment fee which is calculated based on the unused portion of the shared credit line. Commitment fees are allocated among each of the Participants based on relative net assets. Commitment fees are ordinary fund operating expenses. A Participant incurs and pays the interest expense related to its borrowing. Interest is calculated at a rate per annum equal to the sum of 1.00% plus the greater of the New York Fed Bank Rate and the one-month SOFR Rate.
The Fund had no outstanding loans as of August 31, 2025.
11. Risks
Concentration Risk
As a result of the Fund's ability to invest a large percentage of its assets in obligations of issuers within the same country, state, region, currency or economic sector, an adverse economic, business or political development may affect the value of the Fund's investments more than if the Fund was more broadly diversified.
Foreign and Emerging Markets Risk
Investing in foreign markets involves risks and considerations not typically associated with investing in the U.S. Foreign securities may be subject to risk of loss because of government regulation, economic, political and social instability in the countries in which the Fund invests. Foreign markets may be less liquid than investments in the U.S. and may be subject to the risks of currency fluctuations. To the extent that the Fund invests in securities of issuers located in emerging markets, these risks may be even more pronounced.
Credit Risk
The Fund may be exposed to credit risk in the event that an issuer or guarantor fails to perform or that an institution or entity with which the Fund has unsettled or open transactions defaults.
Market Risk
The Fund’s investments are subject to changes in general economic conditions, general market fluctuations and the risks inherent in investment in securities markets. Investment markets can be volatile and prices of investments can change substantially due to various factors including, but not limited to, economic growth or recession, changes in interest rates, changes in the actual or perceived creditworthiness of issuers, and general market liquidity. The Fund is subject to the risk that geopolitical events will disrupt securities markets and adversely affect global economies and markets. Local, regional or global events such as war, acts of terrorism, the spread of infectious illness, such as COVID-19, or other public health issues, or other events could have a significant impact on the Fund and its investments.
12. Subsequent Events
Management has evaluated the impact of all subsequent events on the Fund through the date the financial statements were issued and has determined that there were no subsequent events requiring adjustment or disclosure in the financial statements.
SSGA FUNDS
REPORT OF INDEPENDENT REGISTERED PUBLIC
ACCOUNTING FIRM
To the Shareholders and the Board of Trustees of State Street International Stock Selection Fund
Opinion on the Financial Statements
We have audited the accompanying statement of assets and liabilities of State Street International Stock Selection Fund (the “Fund”) (one of the funds constituting SSGA Funds (the “Trust”)), including the schedule of investments, as of August 31, 2025, and the related statement of operations for the year then ended, the statements of changes in net assets for each of the two years in the period then ended, the financial highlights for each of the five years in the period then ended and the related notes (collectively referred to as the “financial statements”). In our opinion, the financial statements present fairly, in all material respects, the financial position of the Fund (one of the funds constituting SSGA Funds) at August 31, 2025, the results of its operations for the year then ended, the changes in its net assets for each of the two years in the period then ended and its financial highlights for each of the five years in the period then ended, in conformity with U.S. generally accepted accounting principles.
Basis for Opinion
These financial statements are the responsibility of the Trust’s management. Our responsibility is to express an opinion on the Fund’s financial statements based on our audits. We are a public accounting firm registered with the Public Company Accounting Oversight Board (United States) (“PCAOB”) and are required to be independent with respect to the Trust in accordance with the U.S. federal securities laws and the applicable rules and regulations of the Securities and Exchange Commission and the PCAOB.
We conducted our audits in accordance with the standards of the PCAOB. Those standards require that we plan and perform the audit to obtain reasonable assurance about whether the financial statements are free of material misstatement, whether due to error or fraud. The Trust is not required to have, nor were we engaged to perform, an audit of the Trust’s internal control over financial reporting. As part of our audits, we are required to obtain an understanding of internal control over financial reporting but not for the purpose of expressing an opinion on the effectiveness of the Trust’s internal control over financial reporting. Accordingly, we express no such opinion.
Our audits included performing procedures to assess the risks of material misstatement of the financial statements, whether due to error or fraud, and performing procedures that respond to those risks. Such procedures included examining, on a test basis, evidence regarding the amounts and disclosures in the financial statements. Our procedures included confirmation of securities owned as of August 31, 2025, by correspondence with the custodian, brokers and others; when replies were not received from brokers and others, we performed other auditing procedures. Our audits also included evaluating the accounting principles used and significant estimates made by management, as well as evaluating the overall presentation of the financial statements. We believe that our audits provide a reasonable basis for our opinion.
We have served as the auditor of one or more State Street Investment Management (formerly State Street Global Advisors) investment companies since 2000.
Boston, Massachusetts
October 21, 2025
SSGA FUNDS
State Street International Stock Selection Fund
Other Information — August 31, 2025 (Unaudited)
Tax Information
For federal income tax purposes, the following information is furnished with respect to the distributions of the Fund for its fiscal year ended August 31, 2025.
Qualified Business Income Deduction
The Fund reports the maximum amount allowable of qualified REIT dividends eligible for the qualified business income deduction under Section 199A.
Qualified Dividend Income
A portion of dividends distributed by the Fund during the fiscal year ended August 31, 2025 is considered qualified dividend income and is eligible for reduced tax rates. The Fund reports the maximum amount allowable of its net taxable income as qualified dividend income as provided in the Jobs and Growth Tax Relief Reconciliation Act of 2003.
Capital Gain Dividend
Long term capital gains dividends were paid from the following Fund during the year ended August 31, 2025:
| |
Amount |
State Street International Stock Selection Fund
|
$217,898 |
Foreign Tax Credit
The Fund has made an election under Internal Revenue Code Section 853 to pass through foreign taxes paid by the Fund to its shareholders. For the year ended August 31, 2025, the total amount of foreign taxes that will be passed through are:
| |
Amount |
State Street International Stock Selection Fund
|
$314,090 |
The amount of foreign source income earned on the Fund during the year ended August 31, 2025 was as follows:
| |
Amount |
State Street International Stock Selection Fund
|
$5,460,674 |
SSGA FUNDS
STATEMENT REGARDING BASIS FOR APPROVAL OF INVESTMENT ADVISORY CONTRACT
August 31, 2025 (Unaudited)
TRUSTEE CONSIDERATIONS IN APPROVING CONTINUATION OF INVESTMENT ADVISORY AGREEMENT1
Overview of the Contract Review Process
Under the Investment Company Act of 1940, as amended (the “1940 Act”), an investment advisory agreement between a mutual fund and its investment adviser may continue in effect from year to year only if its continuance is approved at least annually by the fund’s board of trustees or its shareholders, and by a vote of a majority of those trustees who are not “interested persons” of the fund (the “Independent Trustees”) cast in person at a meeting called for the purpose of considering such approval.
Consistent with these requirements, the Board of Trustees (the “Board”) of the SSGA Funds (the “Trust”), met in person on April 2, 2025 and May 7-8, 2025, including in executive sessions attended by the Independent Trustees, to consider a proposal to approve, with respect to State Street International Stock Selection Fund (the “Fund”), the continuation of the investment advisory agreement (the “Advisory Agreement”) with SSGA Funds Management, Inc. (“SSGA FM” or the “Adviser”). Prior to voting on the proposal, the Independent Trustees reviewed information furnished by the Adviser and others reasonably necessary to permit the Board to evaluate the proposal fully. The Independent Trustees were separately represented by counsel who are independent of the Adviser (“Independent Counsel”) in connection with their consideration of approval of the Advisory Agreement. In advance of the meetings held on April 2, 2025 and May 7-8, 2025, the Independent Trustees met with their Independent Counsel on March 27, 2025, in a private session to review and discuss the information provided by the Adviser in connection with the proposal. Following the April 2, 2025 meeting, the Independent Trustees submitted questions and requests for additional information to management, and considered management’s responses thereto prior to and at the May 7-8, 2025 meeting. The Independent Trustees considered, among other things, the following:
Information about Performance, Expenses and Fees
A report prepared by an independent third-party provider of investment company data, which includes for the Fund:
| o |
Comparisons of the Fund’s performance over the past one-, three-, five- and ten-year periods ended December 31, 2024, to the performance of an appropriate benchmark provided by Broadridge Financial Solutions, Inc. (“Broadridge”) for the Fund (the “Benchmark”) and a universe of other mutual funds with similar investment objectives and policies (the “Performance Group” and/or the “Performance Universe”) constructed by Broadridge; |
| o |
Comparisons of the Fund’s expense ratio (with detail of component expenses) to the expense ratios of a group of comparable mutual funds selected by the independent third-party data provider (the “Expense Group” and/or “Expense Universe”); |
| o |
A chart showing the Fund’s historical average net assets relative to its total expenses, management fees, and non-management expenses over the past five calendar years; and |
| o |
Comparisons of the Fund’s contractual management fee to the contractual management fees of comparable mutual funds at different asset levels. |
______________________________________________
1 Over the course of many years overseeing the Fund and other investment companies, the Independent Trustees have identified numerous relevant issues, factors and concerns ("issues, factors and concerns") that they consider each year in connection with the proposed continuation of the advisory agreement, the administration agreement, the distribution plans, the distribution agreement and various related-party service agreements (the "annual review process"). The statement of issues, factors and concerns and the related conclusions of the Independent Trustees may not change substantially from year to year. However, the information requested by, and provided to, the Independent Trustees with respect to the issues, factors and concerns and on which their conclusions are based is updated annually and, in some cases, may differ substantially from the previous year. The Independent Trustees schedule annually a separate in-person meeting that is dedicated to the annual review process (the "special meeting"). At the special meeting and throughout the annual review process, the Independent Trustees take a fresh look at each of the issues, factors and concerns in light of the latest available information and each year present one or more sets of comments and questions to management with respect to specific issues, factors and concerns. Management responds to such comments and questions to the satisfaction of the Independent Trustees before the annual review process is completed and prior to the Independent Trustees voting on proposals to approve continuation of the agreements and plans.
SSGA FUNDS
STATEMENT REGARDING BASIS FOR APPROVAL OF INVESTMENT ADVISORY CONTRACT (continued)
August 31, 2025 (Unaudited)
| • |
Comparative information concerning fees charged by the Adviser for managing institutional accounts using investment strategies and techniques similar to those used in managing the Fund, as applicable; and |
| • |
Profitability analyses for (a) the Adviser with respect to the Fund and (b) affiliates of the Adviser that provide services to the Fund (“Affiliated Service Providers”). |
Information about Portfolio Management
| • |
Descriptions of the investment management services provided by the Adviser, including its investment strategies and processes; |
| • |
Information concerning the allocation of brokerage; and |
| • |
Information regarding the procedures and processes used to value the assets of the Fund. |
Information about the Adviser
| • |
Reports detailing the financial results and condition of the Adviser and its affiliates; |
| • |
Descriptions of the qualifications, education and experience of the individual investment and other professionals responsible for managing the portfolios of the Fund and for Fund operations; |
| • |
Information relating to compliance with and the administration of the Code of Ethics adopted by the Adviser; |
| • |
Information about the Adviser’s proxy voting policies and procedures and information regarding the Adviser’s practices for overseeing proxy vendors; |
| • |
Information concerning the resources devoted by the Adviser to overseeing compliance by the Fund and its service providers, including information concerning compliance with investment policies and restrictions and other operating policies of the Fund; |
| • |
A description of the adequacy and sophistication of the Adviser’s technology and systems with respect to investment and administrative matters and a description of any material improvements or changes in technology or systems in the past year; |
| • |
A description of the business continuity and disaster recovery plans of the Adviser; and |
| • |
Information regarding the Adviser’s risk management processes. |
Other Relevant Information
| • |
Information concerning the nature, extent, quality and cost of services provided to the Fund by SSGA FM in its capacity as the Fund’s administrator (the “Administrator”); |
| • |
Information concerning the nature, extent, quality and cost of various non-investment management services provided to the Fund by affiliates of the Adviser, including the custodian, sub-administrator, fund accountant and securities lending agent of the Fund, as applicable, and the role of the Adviser in managing the Fund’s relationship with these service providers; |
| • |
Copies of the Advisory Agreement and agreements with other service providers of the Fund; |
| • |
Responses to a request for information reviewed prior to the April 2, 2025 and May 7-8, 2025 meetings by Independent Counsel, requesting specific information from each of: |
| o |
SSGA FM, in its capacity as the Fund’s Adviser and Administrator, with respect to its operations relating to the Fund and its approximate profit margins from such operations for the calendar year ended December 31, 2024; and the relevant operations of other Affiliated Service Providers to the Fund, together with their approximate profit margins from such relevant operations for the calendar year ended December 31, 2024; |
| o |
State Street Bank and Trust Company (“State Street”), the sub-administrator, custodian and securities lending agent for the Fund, with respect to its operations relating to the Fund; and |
| o |
State Street Global Advisors Funds Distributors, LLC, the principal underwriter and distributor of the shares of the Fund (the “Distributor”), with respect to its operations relating to the Fund, together with the Fund’s related distribution plans and arrangements under Rule 12b-1 of the 1940 Act; |
SSGA FUNDS
STATEMENT REGARDING BASIS FOR APPROVAL OF INVESTMENT ADVISORY CONTRACT (continued)
August 31, 2025 (Unaudited)
| • |
Information from SSGA FM, State Street and the Distributor with respect to the Trust providing any material changes to the previous information supplied in response to the letter from Independent Counsel prior to the executive session of the Board on May 7-8, 2025; and |
| • |
Materials provided by Broadridge, circulated to the Independent Trustees and to Independent Counsel. |
In addition to the information identified above, the Board considered information provided from time to time by the Adviser, and other service providers of the Fund throughout the year at meetings of the Board and its committees. At such meetings, the Trustees received, among other things, presentations by the portfolio managers and other investment professionals of the Adviser relating to the performance of the Fund and the investment strategies used in pursuing the Fund’s investment objective.
The Independent Trustees were assisted throughout the contract review process by their Independent Counsel. The Independent Trustees relied upon the advice of such counsel and their own business judgment in determining the material factors to be considered in evaluating the Advisory Agreement, and the weight to be given to each such factor. The conclusions reached with respect to the Advisory Agreement were based on a comprehensive evaluation of all the information provided and not any single factor. Moreover, each Trustee may have placed varying emphasis on particular factors in reaching conclusions with respect to the Fund.
Results of the Process
Based on a consideration of the foregoing and such other information as deemed relevant, including the factors and conclusions described below, at the meeting held on May 7-8, 2025 the Board, including a majority of the Independent Trustees, voted to approve the continuation of the Advisory Agreement effective June 1, 2025, for an additional year with respect to the Fund.
Nature, Extent and Quality of Services
In considering whether to approve the Advisory Agreement, the Board evaluated the nature, extent and quality of services provided to the Fund by the Adviser.
The Board considered the Adviser’s management capabilities and investment process with respect to the types of investments held by the Fund, including the education, experience and number of investment professionals and other personnel who provide portfolio management, investment research, and similar services to the Fund. The Board evaluated, where relevant, the abilities and experience of such investment personnel in analyzing particular markets, industries and specific issuers of securities in these markets and industries. The Board also considered the substantial expertise of the Adviser in developing and applying proprietary quantitative models for managing the Fund. The Board considered the extensive experience and resources committed by the Adviser to risk management, including with respect to investment risk, liquidity risk, operational risk, counterparty risk and model risk. Further, the Board considered material enhancements made to the risk management processes and systems over the past year. The Trustees also considered the significant risks assumed by the Adviser in connection with the services provided to the Fund, including reputational and entrepreneurial risks. The Board also took into account the compensation paid to recruit and retain investment personnel, and the time and attention devoted to the Fund by senior management, as well as the Adviser’s succession planning process.
The Board had previously reviewed the compliance programs of SSGA FM and various Affiliated Service Providers. Among other things, the Board considered compliance and reporting matters relating to personal trading by investment personnel, selective disclosure of portfolio holdings, late trading, frequent trading, portfolio valuation, business continuity, the allocation of investment opportunities and the voting of proxies. The Board also considered the role of the Adviser in overseeing the Fund’s securities lending activities.
On the basis of the foregoing and other relevant information, the Board concluded that the Adviser can be expected to continue to provide high quality investment management and related services for the Fund.
Fund Performance
The Board compared the Fund’s investment performance to the performance of an appropriate benchmark and universe of comparable mutual funds for various time periods ended December 31, 2024. For purposes of these comparisons the Independent Trustees relied on the Performance Group, Performance Universe and Benchmark and the analyses of the related data provided by Broadridge. It was noted that while the Board found the Broadridge data generally useful, they recognized its limitations, including that the data may vary depending on the end date selected and that the results of the performance comparisons may vary depending on the selection of the peer group and its composition over time. The Board also noted that it had received and discussed with management information throughout the year at periodic intervals comparing the Fund’s performance against its benchmark and against the Fund’s peers. The Board also considered the Fund’s performance in light of overall
SSGA FUNDS
STATEMENT REGARDING BASIS FOR APPROVAL OF INVESTMENT ADVISORY CONTRACT (continued)
August 31, 2025 (Unaudited)
financial market conditions. Among other information, the Board considered the following performance information in its evaluation of the Fund:
State Street International Stock Selection Fund. The Board considered that the Fund’s performance was above the median of its Performance Group for the 1-, 3-, 5- and 10-year periods. The Board also considered that the Fund’s performance was above the median of its Performance Universe for the 1- and 5-year periods and was below the median of its Performance Universe for the 3- and 10-year periods. The Board also considered that the Fund’s performance was above the Benchmark for the 1-, 3- and 5-year periods and was below the Benchmark for the 10-year period.
On the basis of the foregoing and other relevant information, the Board concluded that the performance of the Fund is satisfactory.
Management Fees and Expenses
The Board reviewed the contractual investment advisory fee rates payable by the Fund and actual fees paid by the Fund, net of waivers. As part of its review, the Board considered the Fund’s management fee and total expense ratio, including the portion attributable to administrative services provided by SSGA FM (both before and after giving effect to any expense caps), as compared to its Expense Group and Expense Universe, as constructed by Broadridge, and the related Broadridge analysis for the Fund. The Board also considered the comparability of the fees charged and the services provided to the Fund by the Adviser to the fees charged and services provided to other clients of the Adviser, including institutional accounts. In addition, the Board considered the willingness of the Adviser to provide undertakings from time to time to waive fees or pay expenses of the Fund to limit the total expenses borne by shareholders of the Fund. Among other information, the Board considered the following expense information in its evaluation of the Fund:
State Street International Stock Selection Fund. The Board considered that the Fund’s actual management fee was below the medians of its Expense Group and Expense Universe. The Board also considered that the Fund’s total expenses were below the median of its Expense Group and were equal to the median of its Expense Universe.
On the basis of the foregoing and other relevant information, and in light of the nature, extent and quality of the services provided by the Adviser, the Board concluded that the fees and the expense ratio of the Fund compare favorably to the fees and expenses of the Expense Group and Expense Universe and are reasonable in relation to the services provided.
Profitability
The Board reviewed the level of profits realized by the Adviser and its affiliates in providing investment advisory and other services to the Fund and to all funds within the fund complex. The Board considered other direct and indirect benefits received by the Adviser and Affiliated Service Providers in connection with their relationships with the Fund, together with the profitability of each of the Affiliated Service Providers with respect to their services to the Fund and/or fund complex. The Board also considered the various risks borne by SSGA FM and State Street in connection with their various roles in servicing the Trust, including reputational and entrepreneurial risks.
The Board concluded that the profitability of the Adviser with respect to the Fund, and the profitability range of each of the Affiliated Service Providers with respect to its services to the Fund, were reasonable in relation to the services provided.
Economies of Scale
In reviewing management fees and profitability, the Board also considered the extent to which the Adviser and its affiliates, on the one hand, and the Fund and the fund complex, on the other hand, can expect to realize benefits from economies of scale as the assets of the Fund and the fund complex increase. The Board acknowledged the difficulty in accurately measuring the benefits resulting from the economies of scale with respect to the management of the Fund or the fund complex taken as a whole. The Board concluded that, in light of the current size of the Fund and the fund complex, the level of profitability of the Adviser and its affiliates with respect to the Fund and the fund complex over various time periods, and the comparative management fee and expense ratio of the Fund during these periods, it does not appear that the Adviser or its affiliates has realized benefits from economies of scale in managing the assets of the Fund to such an extent that previously agreed advisory fees should be reduced or that breakpoints in such fees should be implemented for the Fund at this time.
SSGA FUNDS
STATEMENT REGARDING BASIS FOR APPROVAL OF INVESTMENT ADVISORY CONTRACT (continued)
August 31, 2025 (Unaudited)
Conclusions
In reaching its decision to approve the Advisory Agreement, the Board did not identify any single factor as being controlling, but based its recommendation on each of the factors it considered. Each Trustee may have contributed different weight to the various factors. Based upon the materials reviewed, the representations made and the considerations described above, and as part of its deliberations, the Board, including the Independent Trustees, concluded that the Adviser possesses the capability and resources to perform the duties required of it under the Advisory Agreement.
Further, based upon its review of the Advisory Agreement, the materials provided, and the considerations described above, the Board, including the Independent Trustees, concluded that (1) the terms of the Advisory Agreement are reasonable, fair, and in the best interests of the Fund and its shareholders, and (2) the rates payable under the Advisory Agreement are fair and reasonable in light of the usual and customary charges made for services of the same nature and quality.
Item 8. Changes in and Disagreements with Accountants for Open-End Management Investment Companies
Not applicable.
Item 9. Proxy Disclosures for Open-End Management Investment Companies
Not applicable.
Item 10. Remuneration Paid to Directors, Officers, and Others of Open-End Management Investment Companies
Renumeration Paid to Directors, Officers, and Others of Open-End Management Investment Companies is included as part of the Financial Statements filed under Item 7(a) of this Form N-CSR.
Item 11. Statement Regarding Basis for Approval of Investment Advisory Contract
The Registrant’s Statement Regarding Basis for Approval of Investment Advisory Contract is included as part of the Financial Statements filed under Item 7(a) of this Form N-CSR.
Item 12. Disclosure of Proxy Voting Policies and Procedures for Closed-End Management Investment Companies.
Not applicable to the Registrant.
Item 13. Portfolio Managers of Closed-End Management Investment Companies.
Not applicable to the Registrant.
Item 14. Purchases of Equity Securities by Closed-End Management Investment Company and Affiliated Purchasers.
Not applicable to the Registrant.
Item 15. Submission of Matters to a Vote of Security Holders.
There were no material changes to the procedures by which shareholders may recommend nominees to the Registrant’s Board of Trustees.
Item 16. Controls and Procedures.
(a) The Registrant’s principal executive officer and principal financial officer have concluded that the Registrant’s disclosure controls and procedures (as defined in Rule 30a-3(c) under the Investment Company Act of 1940, as amended (the “1940 Act”)) are effective to provide reasonable assurance that information required to be disclosed by the Registrant on Form N-CSR is recorded, processed, summarized and reported as of a date within 90 days of the filing date of this report, based on their evaluation of these controls and procedures required by Rule 30a-3(b) under the 1940 Act and Rules 13a-15(b) or 15d-15(b) under the Securities Exchange Act of 1934, as amended.
(b) There were no changes in the Registrant’s internal control over financial reporting (as defined in Rule 30a-3(d) under the 1940 Act) that occurred during the period covered by this report that have materially affected, or are reasonably likely to materially affect, the Registrant’s internal control over financial reporting.
Item 17. Disclosure of Securities Lending Activities for Closed-End Management Investment Companies.
(a) Not applicable to the Registrant.
(b) Not applicable to the Registrant.
Item 18. Recovery of Erroneously Awarded Compensation
Not applicable to the Registrant.
Item 19. Exhibits.
(a)(1) Code of Ethics referred to in Item 2.
(a)(2) Not applicable to the Registrant.
(a)(3) A separate certification for each principal executive and principal financial officer of the Registrant as required by Rule 30a-2(a) under the 1940 Act.
(a)(4) Not applicable to the Registrant.
(a)(5) Not applicable.
(b) A single certification required by Rule 30a-2(b) under the 1940 Act, Rule 13a-14(b) or Rule 15d-14(b) under the Securities Exchange Act of 1934, as amended, and Section 1350 of Chapter 63 of Title 18 of the United States Code for the principal executive officer and principal financial officer of the Registrant.
(101) Inline Interactive Data File - the instance document does not appear in the Interactive Data File because its XBRL tags are embedded within the inline XBRL document.
SIGNATURES
Pursuant to the requirements of the Securities Exchange Act of 1934 and the Investment Company Act of 1940, the Registrant has duly caused this report to be signed on its behalf by the undersigned, thereunto duly authorized.
|
|
|
| SSGA FUNDS |
|
|
| By: |
|
/s/ Ann M. Carpenter |
|
|
Ann M. Carpenter |
|
|
President (Principal Executive Officer) |
|
|
| Date: |
|
November 3, 2025 |
Pursuant to the requirements of the Securities Exchange Act of 1934 and the Investment Company Act of 1940, this report has been signed below by the following persons on behalf of the Registrant and in the capacities and on the dates indicated.
|
|
|
| By: |
|
/s/ Ann M. Carpenter |
|
|
Ann M. Carpenter |
|
|
President (Principal Executive Officer) |
|
|
| Date: |
|
November 3, 2025 |
|
|
| By: |
|
/s/ Bruce S. Rosenberg |
|
|
Bruce S. Rosenberg |
|
|
Treasurer (Principal Financial and Accounting Officer) |
|
|
| Date: |
|
November 3, 2025 |


