Exhibit 99.3
EXHIBIT A
EXCERPTS FROM THE PRELIMINARY OFFERING MEMORANDUM
The following summary highlights certain information contained elsewhere in this offering memorandum and is qualified in its entirety by the more detailed information and historical financial statements included herein. Because this is a summary, it is not complete and may not contain all of the information that may be important to you in making a decision to invest in the Notes. Before making an investment decision, you should carefully read this entire offering memorandum, including the information presented under “Risk Factors,” “—Summary Historical Financial Information,” “Unaudited Pro Forma Condensed Combined Financial Information” and the historical financial statements included in this offering memorandum.
Our Company
Genmab is an international biotechnology company with a core purpose of improving the lives of patients with innovative and differentiated antibody therapeutics. For more than 25 years, its passionate, innovative and collaborative team has invented next-generation antibody technology platforms and leveraged translational, quantitative and data sciences, resulting in a proprietary pipeline including bispecific T-cell engagers, antibody-drug conjugates, next-generation immune checkpoint modulators and effector function-enhanced antibodies. Genmab’s antibody technology platforms have given rise to eight commercialised products and a pipeline of novel antibody-based products and product candidates designed to address medical needs and improve treatment outcomes for patients with cancer and other serious diseases. Our pipeline includes both wholly owned and partnered programs, with several compounds in late-stage clinical development. Our goal in building our pipeline is to bring medicines to market ourselves in geographic areas where we believe we will be able to maximize their value. By 2030, our vision is to transform the lives of people with cancer and other serious diseases with knock-your-socks-off antibody medicines®.
Since Genmab’s founding in 1999 we have been dedicated to creating innovative and differentiated antibody therapeutics, initially as a research and development (“R&D”) innovation powerhouse out-licensing novel candidates to large cap pharma partners, including Janssen Biotech, Inc (“Janssen”), F. Hoffmann-La Roche AG (“Roche”), GlaxoSmithKline (“GSK”) and Novo Nordisk A/S (“Novo Nordisk”), for upfront, milestone and royalty payments. Early partnerships yielded six U.S. Food and Drug Administration (“FDA”) approved, commercialized, royalty-bearing products: DARZALEX, Kesimpta, TEPEZZA, RYBREVANT, TALVEY, and TECVAYLI. In full-year 2024, these products generated approximately $18 billion in aggregate partner net sales, providing a strong, recurring royalty revenue foundation for Genmab. Given the constantly evolving oncology landscape, our antibody platforms and our expertise and know-how in antibody development, we have shifted our model into a fully integrated biotech company through commercialization and co-commercialization of proprietary products such as EPKINLY and Tivdak in certain geographies, allowing Genmab to retain a greater share of the economic potential of these products. We are focused on the development of our proprietary, wholly owned pipeline, including through high potential growth opportunities such as our acquisition of ProfoundBio, Inc. (“ProfoundBio”) in 2024 and the Acquisition, which has resulted in a significant portfolio that incorporates the next wave of innovation in oncology indications with high medical needs.
Our current priorities are the commercial or late-stage programs epcoritamab and wholly owned rinatabart sesutecan (“Rina-S”) and acasunlimab. Epcoritamab, marketed as EPKINLY in the U.S. and Japan and as TEPKINLY outside of those territories, is being developed and commercialized in collaboration with AbbVie Inc. (“AbbVie”).
Epcoritamab is the only bispecific antibody approved with a dual indication for the treatment of certain B-cell malignancies in the U.S., Europe and Japan. Rina-S entered Phase III clinical development for platinum-resistant ovarian cancer (“PROC”) in 2024 and Endometrial Cancer (“EC”) in 2025, and acasunlimab entered Phase III clinical development for Non-Small Cell Lung Cancer (“NSCLC”) in 2024.
8
The table below summarizes key data points on our six approved royalty products and our two approved proprietary products, respectively.
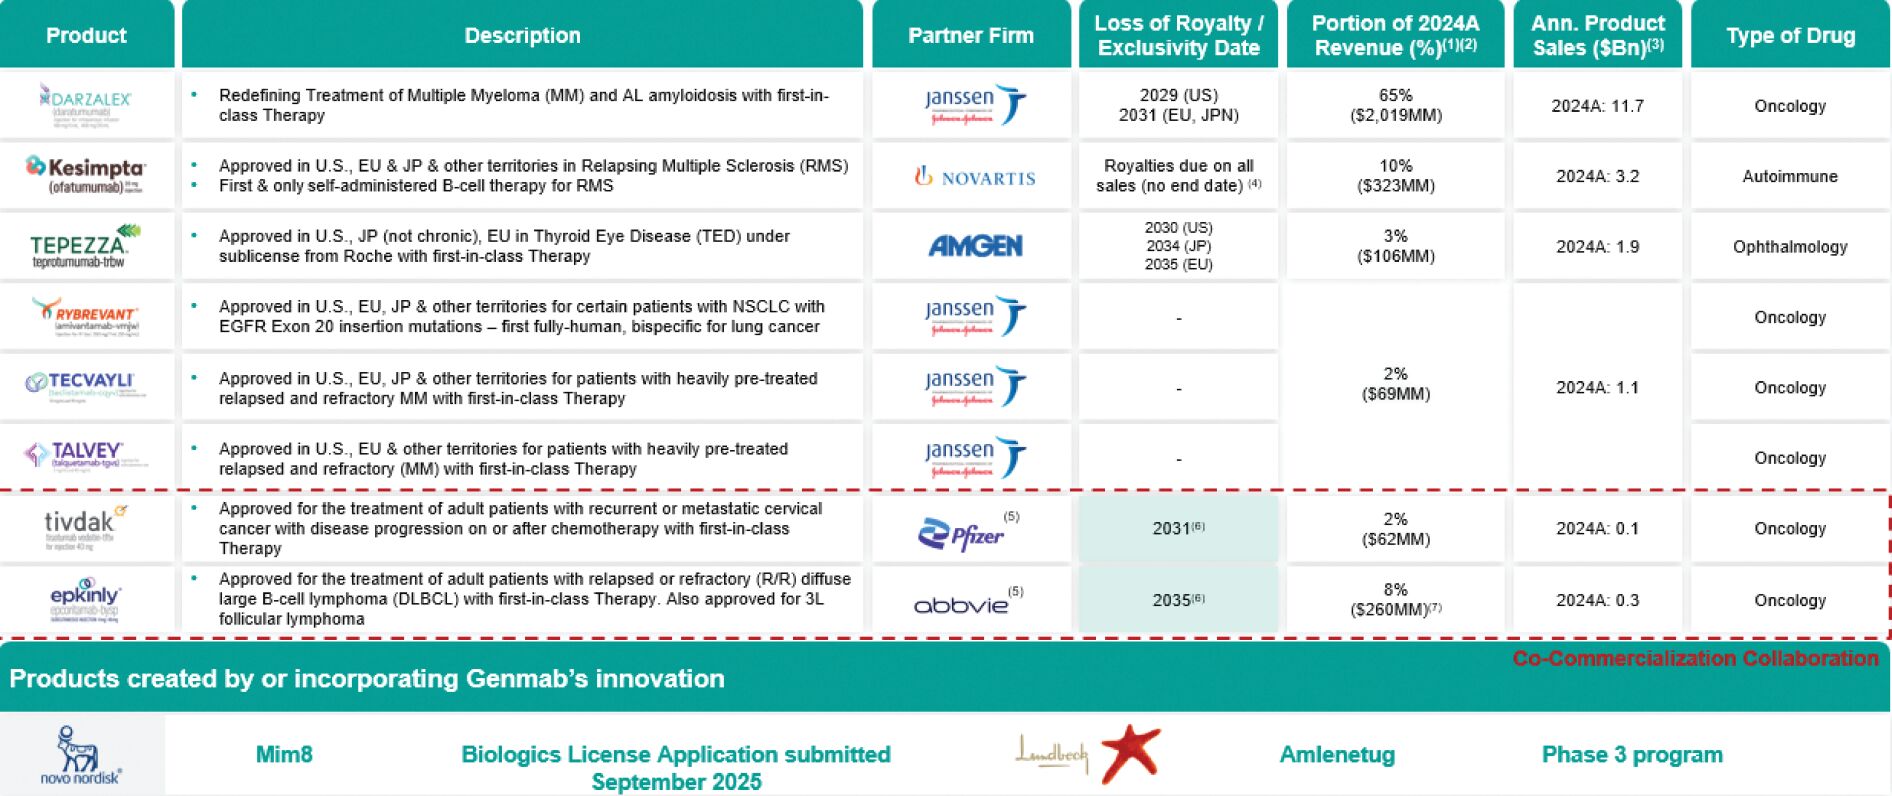
| (1) | To the extent available and reported; RYBREVANT®, TECVAYLI® and TALVEY® are not owned products. |
| (2) | Remaining 10% of revenue attributable to milestones and reimbursements and licensing. |
| (3) | Source: For DARZALEX® and TECVAYLI® 2024 sales, Johnson & Johnson (“J&J”) FY 2024 financial results; for KESIMPTA® 2024 sales, Novartis AG (“Novartis”) FY 2024 financial results; for TEPEZZA® 2024 sales, Amgen Inc. (“Amgen”) FY 2024 results; for TIVDAK® and EPKINLY® 2024 sales, GMAB FY 2024 presentation. |
| (4) | Exclusivity protection provided by Genmab patents (exp. 2031) and Novartis owned patents (exp. 2037). Royalties continue to be paid on all sales after patent expirations. |
| (5) | Co-commercialization collaboration. |
| (6) | U.S., European and Japanese patents for EPKINLY® and TIVDAK® do not begin to expire until the dates shown, however requests for patent term extensions have been filed for both which, if approved, would provide protection beyond the displayed end dates. |
| (7) | Includes $253M in EPKINLY® net product sales and $7M in TEPKINLY® royalties. |
Innovation and Proprietary Technology Platform
Our portfolio includes five proprietary antibody technology platforms: (i) our DuoBody platform, which can be used for the creation and development of bispecific antibodies; (ii) our HexaBody platform, which can be used to increase the potential potency of antibodies through hexamerization; (iii) our DuoHexaBody platform, which enhances the potential potency of bispecific antibodies through hexamerization; (iv) our HexElect platform, which combines two HexaBody molecules to maximize potential potency while minimizing potential toxicity by more selective binding to desired target cells; and (v) our antibody drug conjugate (“ADC”) platforms, acquired through the purchase of ProfoundBio in May 2024. Antibody products created with these technologies may be used in a wide variety of indications including cancer as well as autoimmune, central nervous system and infectious diseases. These platforms play a key role in building our product pipeline, enhancing our collaborations and generating revenue. We selectively enter into collaborations with other biotechnology and pharmaceutical companies that build our network in the biotechnology space and give us access to complementary novel technologies or products that move us closer to achieving our vision and fulfilling our core purpose.
9
Our innovation and proprietary technology platforms are used in the pipelines of global pharmaceutical and biotechnology companies. These companies are running clinical development programs with antibodies created by Genmab or created using Genmab’s proprietary DuoBody bispecific antibody technology platform. The six approved medicines created by Genmab or that incorporate Genmab’s innovation or technology platforms are: daratumumab, marketed by J&J as DARZALEX (intravenous (“IV”) formulation) and DARZALEX FASPRO or DARZALEX SC (SC formulation), approved in the U.S., Europe, Japan and other territories for the treatment of certain indications of MM and AL amyloidosis; amivantamab, marketed in the U.S., Europe, Japan and other territories by J&J as RYBREVANT for the treatment of certain adult patients with locally-advanced or metastatic NSCLC with epidermal growth factor receptor (“EGFR”) exon 20 insertion mutations; teclistamab, marketed in the U.S., Europe, Japan and other territories by J&J as TECVAYLI for certain indications of MM; talquetamab, marketed in the U.S., Europe, Japan and other territories by J&J as TALVEY for certain indications of MM; SC ofatumumab, marketed in the U.S., Europe, Japan and other territories as Kesimpta by Novartis for the treatment of relapsing multiple sclerosis (“RMS”); and teprotumumab, marketed in the U.S. and Japan as TEPEZZA by Amgen for the treatment of thyroid eye disease (“TED”). Under the agreements for these products we are entitled to certain royalties based on net sales and potential milestone payments.
Our proprietary commercial products are EPKINLY and Tivdak. Net Sales from these products continue to grow and strengthen.
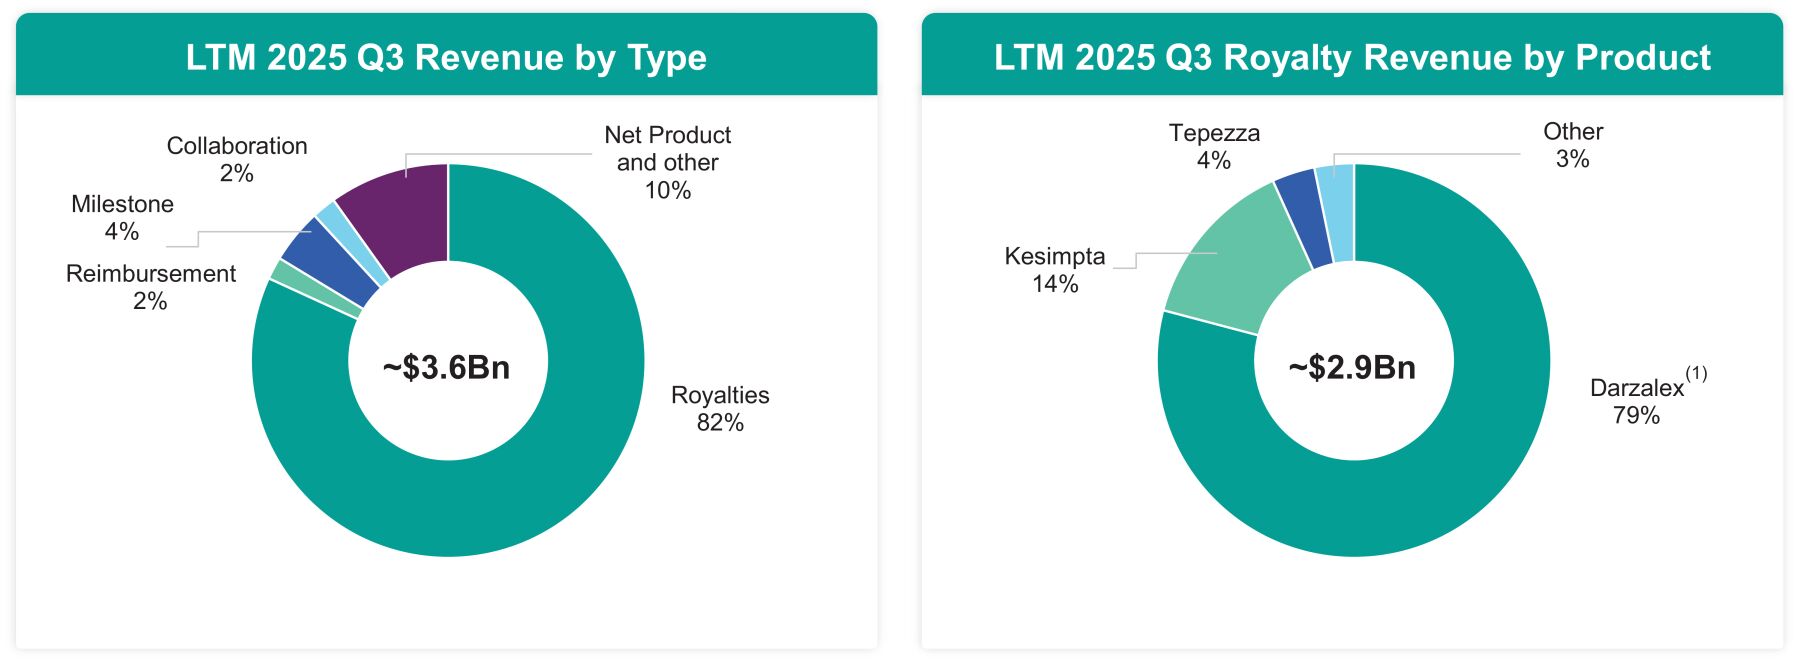
For the twelve months ended September 30, 2025, Genmab generated approximately $3.6 billion of revenue, of which $2.9 billion were royalty revenues, $1.5 billion of net income (loss), and $1.5 billion of Adjusted EBITDA. Adjusted EBITDA is a non-IFRS measure. See “Use of Non-IFRS and Non-GAAP Financial Information” and “Summary Historical Financial Information—Company Summary Financial Information—Company Adjusted EBITDA” for a discussion of the limitations of Adjusted EBITDA and a reconciliation to Net Profit.
| (1) | “DARZALEX®” refers to both DARZALEX® and DARZALEX FASPRO® (trade name in the U.S.)/DARZALEX SC (trade name in Europe). |
Business Strategy
Key elements of our strategy to achieve our vision and fulfill our core purpose include:
| | Actively advance and expand our proprietary product pipeline. We are actively advancing our promising proprietary product candidates, and specifically our commercial or late-stage programs epcoritamab, Rina-S and acasunlimab, through development and commercialization. |
10
| | Grow our commercialization capabilities. We are continuing to develop and expand our commercialization capabilities to enable us to bring our own products to market for the indications and in the geographies that we determine are most likely to create value for patients and our investors. Our primary focus for commercialization has been in the U.S. and in Japan, with the commercialization of Tivdak and EPKINLY. More recently, we have expanded our commercial footprint to the EU. |
| | Strengthen our product portfolio with strategic collaborations and acquisitions. We enter into strategic product and technology collaborations to build our network in the biotechnology space and to strengthen our portfolio with complementary technologies and products, and we seek to expand our proprietary product pipeline by developing new products in-house and through selective collaborations. We monitor for potential collaborations and acquisitions that would advance our overall strategy, such as the Acquisition and our 2024 acquisition of ProfoundBio. |
| | Leverage our proprietary technology platforms. Our leading proprietary antibody technology platforms play a key role in building our product pipeline, enhancing our collaborations and generating revenue. Multiple new product candidates are currently being developed by us using our technology platforms, including proprietary product candidates created with our DuoBody and ADC technologies. We actively seek collaboration partners interested in developing potential antibody therapeutics using our technologies. |
| | Leverage recurring revenue streams from collaborations. There are six medicines on the market, developed and commercialized by partners, that were created by Genmab or created using our DuoBody technology. Under the agreements for these medicines, Genmab is entitled to certain royalties and potential milestone payments. Originally, this strategy allowed us to bring our innovative products to the market and create a stable revenue stream. Over time, it has allowed us to build and expand our own proprietary pipeline. |
Transaction Overview
On September 29, 2025, we agreed to acquire Merus pursuant to a Transaction Agreement (as defined herein) among Merus, the Purchaser (as defined herein), and us. Pursuant to the Transaction Agreement, on October 21, 2025, the Purchaser commenced the Offer (as defined herein) to purchase any and all of the issued and outstanding common shares of Merus at a purchase price of $97.00 per share, payable in cash, less any applicable withholding taxes and without interest. The Offer will expire at 5:00 p.m. New York City time on December 11, 2025, unless earlier terminated or extended in accordance with the Transaction Agreement.
Merus is a clinical-stage biotechnology company with a late-stage breakthrough therapy asset, petosemtamab, which is in Phase III development. The Acquisition, if consummated, will further strengthen our late-stage product pipeline with the addition of petosemtamab where we believe our expertise and leadership in antibody-based innovations will assist in unlocking petosemtamab’s full potential.
Merus N. V.
Merus is an oncology company developing innovative antibody therapeutics. Merus’ lead product candidate is MCLA-158 (petosemtamab), in clinical development for the potential treatment of solid tumors, including first line (“1L”) programmed death-ligand 1 positive (“PD-L1+”) recurrent/metastatic (“r/m”) head and neck squamous cell carcinoma (“HNSCC”) in combination with pembrolizumab, and second line (“2L”) or third line (“3L”) r/m HNSCC as monotherapy; and in metastatic colorectal cancer (“mCRC”) in 1L and 2L in combination with standard chemotherapy and 3L+ mCRC as monotherapy. Merus has also developed BIZENGRI® (zenocutuzumab-zbco), the first and only FDA-approved treatment indicated for adults with pancreatic adenocarcinoma or NSCLC that are advanced, unresectable or metastatic and harbor a neuregulin 1 (“NRG1”)
11
gene fusion who have disease progression on or after prior systemic therapy. Merus has a pipeline of full-length human multispecific antibody candidates generated from its proprietary technology platforms, Biclonics and Triclonics.
Strategic Rationale for the Acquisition
We believe that the Acquisition further strengthens our position as a leader in the biotechnology space, and is underpinned by the following four strategic rationales:
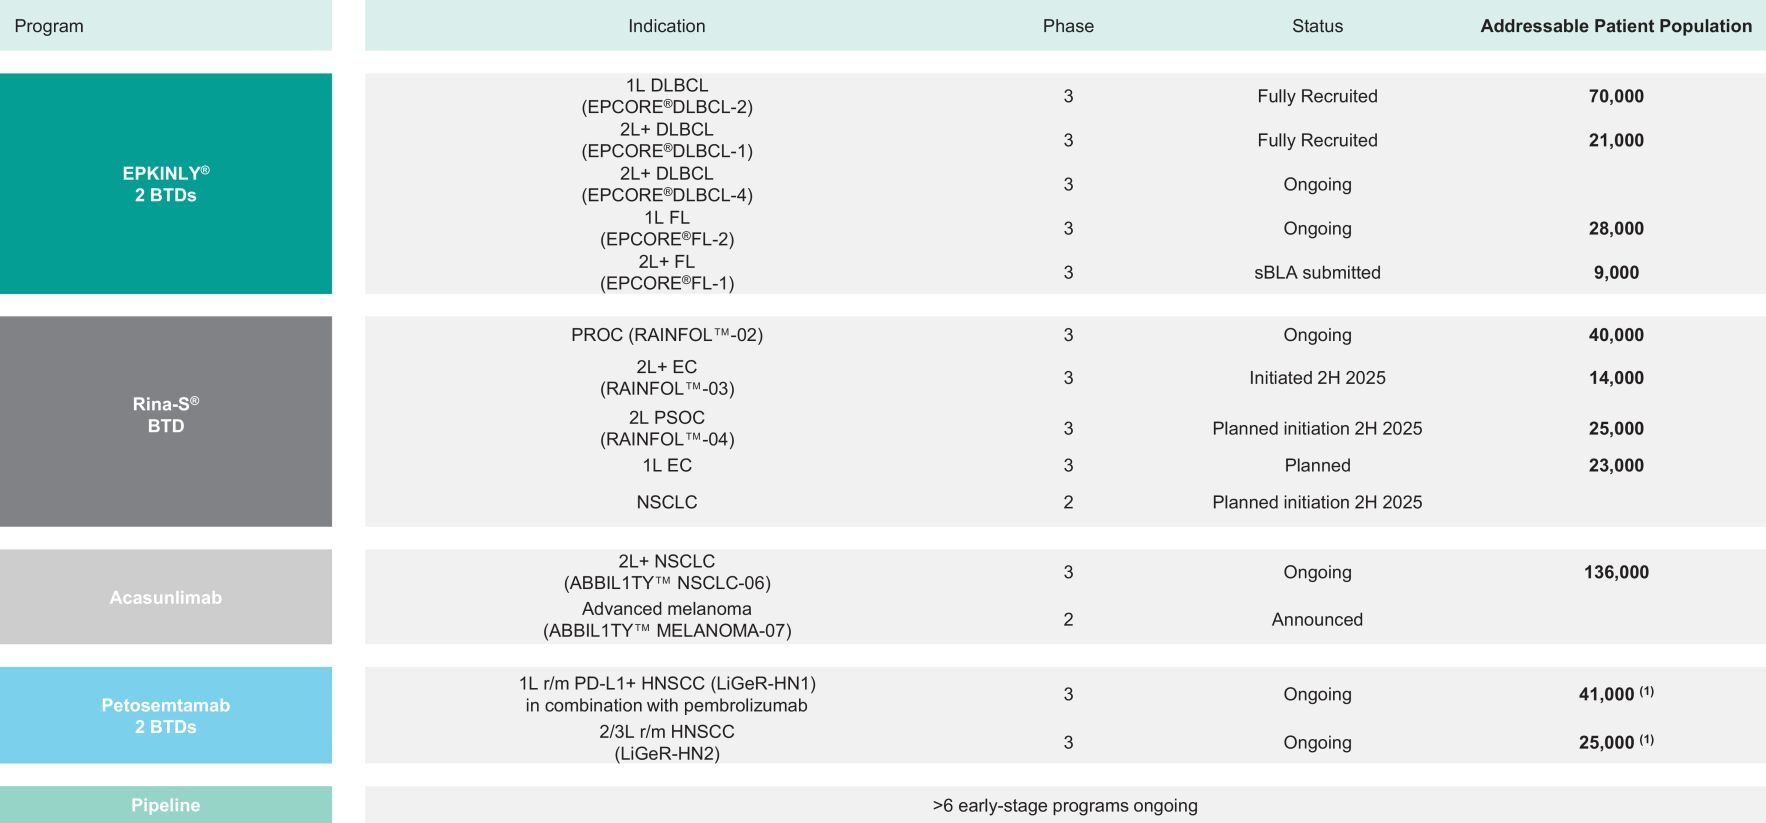
| | Enhancing Genmab’s late-stage pipeline with a high-potential asset. Acquiring Merus adds its lead asset, petosemtamab, to Genmab’s late-stage pipeline, an EGFRxLGR5 bispecific antibody with the potential to become the first and best-in-class therapy for head and neck cancer. There are two petosemtamab Phase III trials ongoing, one in 1L and one in 2L and 3L head and neck. The product candidate has demonstrated meaningful clinical benefits in 1L and later line settings with the FDA granting BTD (as defined herein) for both the 1L PD-L1+ and 2L+ recurrent or metastatic head and neck cancer. |
| | Meaningfully accelerating Genmab’s shift to a 100% owned model. The Acquisition is in line with and advances our long-term strategy of transitioning from a royalty-based business to an end-to-end biotech company that fully owns, develops, and commercializes medicines. With the addition of petosemtamab to EPKINLY and Rina-S, Genmab strengthens its position as an antibody-driven biotechnology powerhouse, supported by a robust, diverse, wholly owned late-stage portfolio. |
| | Driving sustainable and profitable growth. As launch revenues build and investment levels stabilize, we expect meaningful growth for petosemtamab in the medium term, subject to clinical results and regulatory approvals. We expect the Acquisition to provide a high-potential wholly owned revenue stream that supports continued investment in our innovative R&D pipeline. We believe this strategic positioning will enable us to build a robust foundation for sustainable growth and profitability into the next decade and beyond. |
| | Leveraging Genmab’s expertise in antibody innovation and clinical development. We believe our established leadership in antibody-based therapeutics and proven track record in rapid, broad clinical development are central to unlocking the full value of petosemtamab. Our strong commercial infrastructure in the U.S., Japan and Europe provides a robust platform for the launch and expansion of petosemtamab and positions us to maximize the impact of this high-potential asset, supporting both patient outcomes and long-term value creation. |
Industry Overview
The biotechnology and pharmaceutical industries generally, and the cancer drug sector specifically, are characterized by evolving understanding of causes of disease, rapidly advancing technologies, intense competition and a strong emphasis on intellectual property. Both sectors are subject to significant regulatory oversight and substantial investment in R&D. Within this landscape, oncology remains one of the most dynamic and innovative therapeutic areas, driven by unmet medical needs, scientific breakthroughs, and robust market growth.
The Oncology Biopharmaceuticals Industry
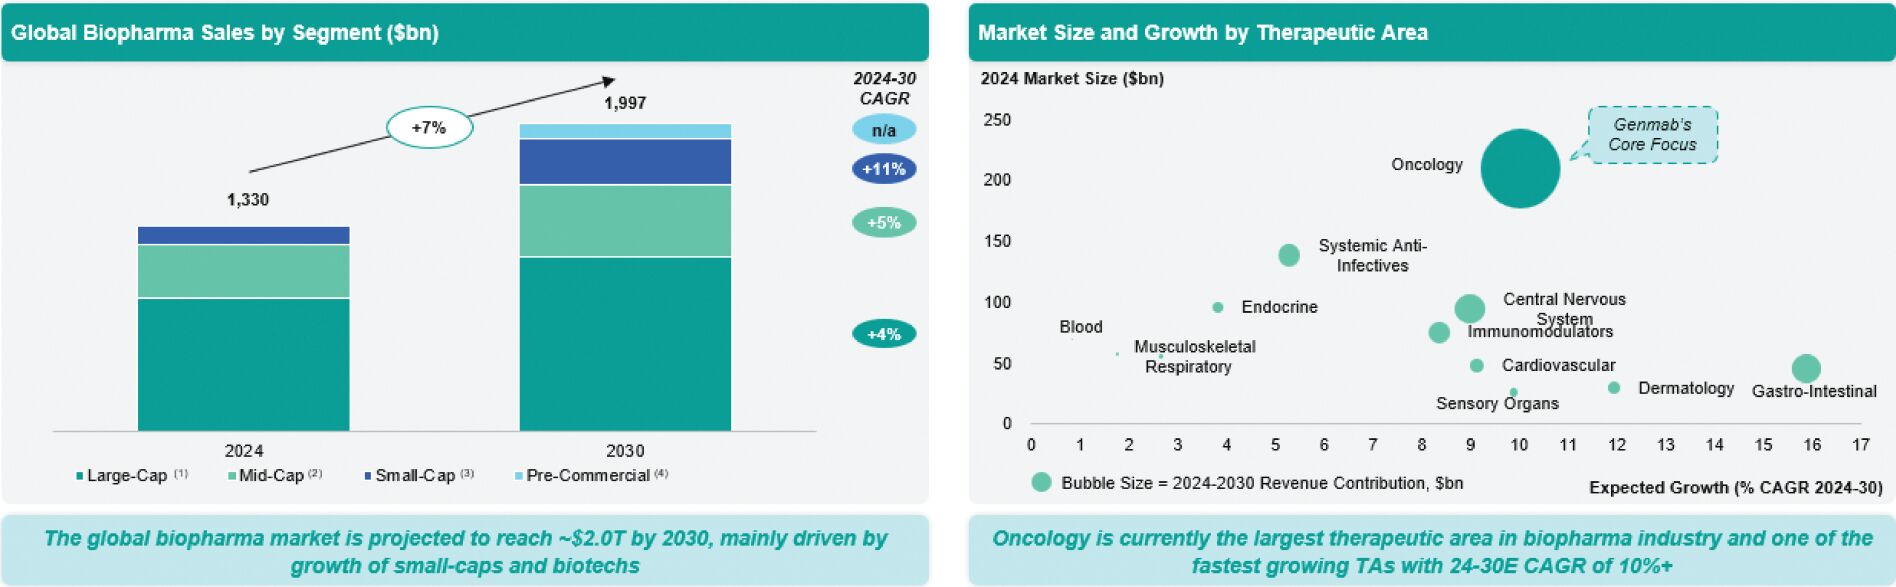
We operate within the global oncology biopharmaceutical sector, which is one of the largest and fastest-growing segments of the pharmaceutical industry. The oncology market is driven by several secular trends, including an aging population, increased cancer incidence, and ongoing innovation in targeted therapies, immuno-oncology, and antibody-based treatments. According to Evaluate Pharma, the global biopharma market
12
is projected to reach $1.8 trillion by 2030, driven largely by innovation from small-cap and biotech companies. Per Evaluate Pharma, oncology remains the largest therapeutic area, expected to grow at a compound annual growth rate of over 10% through 2030 to $350 billion driven by the launch of novel therapies and expanded indications for existing drugs.
Generally, the sector is marked by:
| | Rapid innovation. Advances in antibody engineering, bispecifics, cell therapy, and precision medicine are transforming the treatment paradigm for many cancers. |
| | Regulatory complexity. Oncology drugs often benefit from expedited regulatory pathways, such as breakthrough therapy or fast track designation and accelerated approval, but must demonstrate meaningful clinical benefit above available therapy and a tolerable safety profile. |
| | Intense competition. Large multinational pharmaceutical companies and innovative biotechs compete for leadership in key indications, with significant investment in R&D and business development. |
Merus’ Industry: Head and Neck Squamous Carcinoma and Colorectal Cancer
Merus’ lead asset petosemtamab is being evaluated in two Phase III trials for head and neck squamous cell carcinoma, with expansion opportunities for colorectal cancer in three Phase II trials.
Key characteristics of Merus’ target market include:
| | The addressable market for head and neck squamous cell cancer has a significant unmet need. HNSCC remains an area of high unmet medical need. Despite advances in standard of care, prognosis for recurrent or metastatic HNSCC remains poor, with limited effective treatment options and high rates of disease progression. According to results from the KEYNOTE-048 trial, pembrolizumab, the 1L standard of care, achieved median progression free survival of 3.2 months and overall survival of approximately one year. Based on internal market research, we believe there are nearly 70,000 patients with locally advanced or metastatic head and neck cancer in the U.S., the European Union (“EU”) and Japan combined. We believe there are approximately 41,000 patients in the U.S., EU and Japan eligible for 1L treatment. For 2L treatment and beyond, we believe there are an approximate additional 25,000 patients in the U.S., EU and Japan. In the Phase II trial in the 1L setting, petosemtamab demonstrated an overall response rate and median progression free survival of approximately three times better than pembrolizumab monotherapy. |
| | Innovation in bispecifics. EGFRxLGR5 bispecific antibodies, such as petosemtamab, offer the potential for enhanced efficacy by simultaneously targeting multiple pathways. Petosemtamab has demonstrated a significant clinical benefit in both 1L and 2L+ HNSCC, with a 63% overall response rate and nine months median progression-free survival in combination with pembrolizumab, and a 36% overall response rate as monotherapy in later lines. |
| | Regulatory momentum. Therapies addressing high unmet need in head and neck cancer, such as petosemtamab, may benefit from expedited regulatory review. Petosemtamab has received BTD from the FDA for both 1L and 2L+ HNSCC indications, reflecting the promise of its clinical data and the urgency of the need. |
| | Competitive landscape. The late-stage development landscape in HNSCC includes programmes with limited clinical evidence or focus on subpopulations, providing an opportunity for differentiation for bispecific antibodies like petosemtamab. Success in this field depends on clinical differentiation, safety, and the ability to demonstrate meaningful benefit over existing therapies. |
13
| | Expansion into colorectal cancer. Petosemtamab is also being developed for colorectal cancer, with ongoing Phase II studies in 1L, 2L and 3L settings, representing further expansion opportunities in solid tumours with significant unmet need. |
Our Competitive Strengths
We are a leader in antibody innovation, with a portfolio of wholly owned and partnered assets addressing high unmet medical needs in hematological malignancies and solid tumours. Our focus on proprietary, differentiated antibody platforms and our track record of successful product launches positions us to capture value in a market that rewards innovation, clinical differentiation, and commercial execution.
Top Player in Oncology, One of the Fastest Growing Segments Within Pharma
Genmab is a leading antibody company and one of the largest European biotechs. It stands out as a strong player in oncology, one of the most dynamic and fastest-growing segments within the pharmaceutical industry; and has established itself as a leader in antibody innovation, with a portfolio of wholly owned and partnered assets addressing high unmet needs in hematological malignancies and solid tumors. Genmab’s focus on proprietary, differentiated antibody platforms and its track record of successful product launches position it to capture value in a market that rewards innovation, clinical differentiation, and commercial execution. We believe we are uniquely positioned to capitalize on the momentum of the industry, leveraging our deep expertise in B-cell lymphomas and multiple myeloma, diseases that primarily affect older populations. Our leadership in antibody engineering and bispecific platforms has yielded four late-stage assets, collectively earning three BTDs.
| (1) | Companies with 2024 sales >$10bn. |
| (2) | Companies with 2024 sales $10bn-$1bn. |
| (3) | Companies with 2024 sales $1-$0bn. |
| (4) | Companies with no sales in 2024. |
World-Class R&D Powerhouse with an Innovation Track-Record
We are a world-class leader with antibody R&D and commercialization expertise, distinguished by our consistent track record of innovation and successful delivery of transformative antibody-based therapies. With approximately 1,840 of our 2,681 employees dedicated to R&D as of September 30, 2025, we offer a fully integrated value chain—from early-stage discovery to global commercialization—designed to maximize innovation, ensure product quality, and optimize market reach. We have built a streamlined enterprise that coordinates antibody discovery, preclinical testing, clinical development, contractual manufacturing, and regulatory submissions across our international footprint. We continue to expand our scientific capabilities by
14
integrating data science and artificial intelligence to identify novel targets and biomarkers, enhancing our precision medicine and translational research efforts. Our suite of pioneering antibody platforms, including DuoBody, enables the creation of differentiated, potentially first- or best-in-class investigational medicines with the potential to significantly improve patient outcomes.
With the successful launches of Tivdak (2021, with Pfizer Inc. (“Pfizer”)) and EPKINLY/TEPKINLY (2023, with AbbVie) and two wholly owned Phase III programs (Rina-S and acasunlimab), we continue to transform into a fully integrated biotech innovator.
Strong and Differentiated Pipeline of Potential Best-in-Class and First-in-Class Therapies
Our full pipeline includes bispecific T-cell engagers, next-generation immune checkpoint modulators, effector function enhanced antibodies and ADCs. We currently have nine proprietary products or product candidates in clinical development, which comprise programs where we retain at least 50% of product rights in collaboration with partners. Our key, late-stage clinical programs are EPKINLY, Rina-S and acasunlimab.
Substantial Cash Flow Generation from Royalty Income
Genmab continues to demonstrate substantial cash flow generation, underpinned by a long-standing track record of profitable growth and revenue diversification. For the twelve months ended September 30, 2025, Genmab had revenues of approximately $3.6 billion and Adjusted EBITDA of $1.5 billion, reflecting a strong Adjusted EBITDA margin of 42.2%. Genmab also achieved Free Cash Flow of $1.2 billion. Adjusted EBITDA, Adjusted EBITDA margin and Free Cash Flow are non-IFRS measures. See “Use of Non-IFRS and Non-GAAP Financial Information” and “Summary Historical Financial Information—Company Summary Financial Information—Company Adjusted EBITDA” and “Summary Historical Financial Information—Company Summary Financial Information—Company Free Cash Flow” for discussions of the limitations of Adjusted EBITDA, Adjusted EBITDA Margin and Free Cash Flow and a reconciliation to Net Profit and Net Cash Provided by Operating Activities. We expect this robust financial performance to enable Genmab to service and reduce its debt obligations while continuing to invest significantly in R&D to drive innovation. Importantly, our growth is de-risked by recurring royalty income from DARZALEX, which is currently the second-largest oncology drug worldwide by net sales, providing a stable and high-margin income stream that supports long-term strategic initiatives.
15
Founder-led and Experienced Management Team with Significant Tenure in Biotech
Our management team is led by our visionary founder and Chief Executive Officer, Jan van de Winkel, whose leadership has been instrumental in shaping Genmab’s strategic direction and global success. The team brings deep industry expertise, having held senior roles across leading biotech and pharmaceutical organizations, and has successfully executed large-scale M&A transactions while building a high-performing, innovation-driven organization. To maintain its competitive edge, we have consistently recruited and retained top talent, forming a deep bench of experienced leaders. This includes Anthony Pagano, Chief Financial Officer; Judith Klimovsky, Chief Development Officer; Martine J. van Vugt, Chief Strategy Officer; Bradley Bailey, Chief Commercial Officer; Tahamtan Ahmadi, Chief Medical Officer; Greg Mueller, General Counsel & Chief Legal Officer; Rayne Waller, Chief Technical Operations Officer and Christopher Cozic, Chief People Officer—each contributing to our continued growth and operational excellence. Their collective expertise enables us to remain at the forefront of antibody therapeutics and global biotech innovation.
The Transactions
The Acquisition
The Tender Offer
On September 29, 2025, Genmab agreed to acquire (the “Acquisition”) Merus pursuant to a Transaction Agreement (the “Transaction Agreement”) among Merus, Genmab Holding II B.V., a private limited liability company organized under the laws of the Netherlands and a wholly owned subsidiary of Genmab (the “Purchaser”), and us. Pursuant to the Transaction Agreement, on October 21, 2025, the Purchaser commenced a tender offer (the “Offer”) to purchase any and all of the issued and outstanding common shares of Merus at a purchase price of $97.00 per share, payable in cash, less any applicable withholding taxes and without interest. The Offer will expire at 5:00 p.m. New York City time on December 11, 2025, unless earlier terminated or extended in accordance with the Transaction Agreement.
The Offer is subject to the satisfaction or waiver of various customary conditions for similar transactions, including the valid tendering in accordance with the terms of the Offer, and not properly withdrawing, of a number of Merus common shares that, together with the common shares then owned by us, the Purchaser and our respective affiliates, and any common shares irrevocably and unconditionally (or conditionally only on the closing of the Offer having occurred) sold and committed to be transferred, but not yet transferred, to the Purchaser in writing, representing at least 80% of Merus’ issued and outstanding share capital immediately prior to the expiration of the Offer. Under certain circumstances, the Purchaser may reduce this condition to 75% of the Merus issued and outstanding share capital. The conditions also include receipt of required approvals relating to U.S. and foreign competition filings, or the expiration or termination of their respective waiting periods (including under the Hart-Scott-Rodino Antitrust Improvements Act of 1976). Finally, the conditions include, among other matters, the adoption of resolutions by shareholders of Merus at an extraordinary meeting convened for this purpose approving certain transactions relating to the Offer, including the Back-End Transactions described below.
If all of the conditions to the completion of the Offer have been satisfied or waived, the Purchaser expects to purchase all Merus common shares tendered in the Offer prior to the expiration time promptly following the expiration time. We refer to this as the “Acquisition Closing” and the date of purchase as the “Acquisition Closing Date”.
Following the Acquisition Closing, the Purchaser will commence a subsequent offering period for a period of at least ten business days to purchase additional Merus common shares at the same price as during the initial offer period.
16
The Back-End Transactions
We expect that, promptly following completion of the subsequent offering period, Merus will become an indirect wholly owned subsidiary of Genmab through certain back-end reorganization transactions involving Genmab, the Purchaser, Merus and their subsidiaries. The form that such back-end reorganization transactions take will depend on the receipt of a certain tax ruling as set forth in the Transaction Agreement. Assuming receipt of such tax ruling by the completion of the subsequent offer period described above, the back-end mechanics will be implemented by means of a Dutch legal merger of Merus with and into a newly formed wholly owned Dutch subsidiary of Merus, followed by the cancellation of all outstanding class A shares of such subsidiary to be issued to the remaining minority shareholders other than Genmab in such merger in exchange for a cancellation consideration in cash equal to the price per share paid in the Offer, less any applicable withholding taxes and without interest. If such tax ruling is not obtained prior to the completion of the subsequent offer period described above, Merus will, if necessary, issue such number of additional common shares to the Purchaser at an issue price per share equal to the price paid in the Offer in order to permit the Purchaser to commence statutory buy-out proceedings under Dutch law and obtain ownership of all Merus common shares not tendered pursuant to the Offer (including during the subsequent offering period). In that case, holders of those Merus common shares will receive an amount per share determined in court proceedings under Dutch law. We refer to the foregoing merger and cancellation transactions or share issuance and buy-out proceedings, as applicable, as the “Back-End Transactions” and to the completion of those transactions as the “Back-End Closing.”
Financing Transactions
In connection with the Acquisition Closing, we intend to enter into new senior secured credit facilities consisting of (i) a $1 billion senior secured term loan “A” facility (the “Term Loan A Facility”), (ii) a $2 billion senior secured term loan “B” facility (the “Term Loan B Facility” and, together with the Term Loan A Facility, the “Term Facilities”), and (iii) a $500 million senior secured revolving credit facility (the “New Revolving Facility” and, together with the Term Facilities, the “New Senior Secured Credit Facilities”).
There can be no assurance that these financing transactions will be completed on the terms we anticipate, or at all. The terms and conditions of these financing transactions described herein have not been finalized and are therefore subject to change. Investors are encouraged not to place undue reliance on the descriptions in deciding to invest in the Notes offered hereby, as changes may be made after the date of this offering memorandum.
For further details regarding the New Senior Secured Credit Facilities, see “Description of Certain Other Indebtedness.”
We plan to fund the total consideration payable in the Acquisition and related fees and expenses through a combination of cash on hand, including from the liquidation of substantially all of our marketable securities portfolio, from borrowings under the Term Facilities and from the proceeds of the Notes offered hereby. See “Use of Proceeds.” We refer to the Acquisition, including the Back-End Transactions, the borrowings under the Term Facilities and the issuance of the Notes offered hereby and the use of the proceeds therefrom, together with cash on hand as described above, to fund the consideration payable in the Acquisition and related fees and expenses collectively as the “Transactions.”
We are currently party to that certain facility agreement, dated as of October 24, 2024, by and among Genmab, the Arrangers (as defined therein), the Coordinator (as defined therein), the Original Lenders (as defined therein) and Dansk Bank A/S as the Agent (the “Existing Credit Agreement”), which provides for $300 million in commitments of revolving borrowings. We are seeking consent under the Existing Credit Agreement to permit the consummation of this offering. If this consent is obtained, we expect to terminate the Existing Credit Agreement at the Acquisition Closing Date. If this consent is not obtained, we will terminate the Existing Credit Agreement on the date of the settlement of this offering.
17
The table below sets forth the estimated sources and uses of funds in connection with the Acquisition. Actual amounts will vary from the estimated amounts shown below. You should read the following in conjunction with the information included under the sections entitled “Capitalization” and “Summary—Summary Historical Financial Information” included elsewhere in this offering memorandum. See “Use of Proceeds” for further details on the table below, including additional notes to each source and use.
| Sources of funds |
Uses of funds |
|||||||||
| ($ in millions) | ||||||||||
| Term Loan A Facility(1) |
$ | 1,000 | Acquisition Consideration(5) | $ | 8,014 | |||||
| Term Loan B Facility(1) |
2,000 | Acquisition Fees and Expenses(6) | 381 | |||||||
| Secured Notes Offered Hereby(2) |
1,500 | |||||||||
| Unsecured Notes Offered Hereby(3) |
1,000 | |||||||||
| Cash from Balance Sheet(4) |
2,895 | |||||||||
|
|
|
|
|
|||||||
| Total Sources of Funds |
8,395 | Total uses of funds | 8,395 | |||||||
|
|
|
|
|
|||||||
| (1) | Concurrently with the closing of the Acquisition, the Issuers expect to enter into the Term Loan A Facility and the Term Loan B Facility, as further described in “Summary—The Transactions—Financing Transactions”, each of which will be fully drawn at the closing of the Acquisition. |
| (2) | Represents the aggregate principal amount of Secured Notes offered hereby. Assumes the Secured Notes are issued at par. If we do not consummate the Acquisition, the Secured Notes will be subject to a special mandatory redemption. See “Description of the Secured Notes—Segregation of Proceeds; Special Mandatory Redemption.” |
| (3) | Represents the aggregate principal amount of Unsecured Notes offered hereby. Assumes the Unsecured Notes are issued at par. If we do not consummate the Acquisition, the Unsecured Notes will be subject to a special mandatory redemption. See “Description of the Unsecured Notes—Segregation of Proceeds; Special Mandatory Redemption.” |
| (4) | Represents estimated cash on our balance sheet immediately prior to the closing of the Acquisition, including from the liquidation of substantially all of our marketable securities. The actual amount of cash and cash equivalents and marketable securities that will be used as a source of funds in connection with the Acquisition will vary depending on, among other things, our cash balance on the Acquisition Closing Date, transaction fees and expenses and the timing of the Acquisition Closing Date. |
| (5) | Represents the estimated aggregate consideration payable to equity holders of Merus pursuant to the Acquisition, calculated based on Genmab’s offer of $97.00 per Merus common share pursuant to the tender offer. |
| (6) | Represents estimated fees and expenses associated with the Acquisition, including financing fees, advisory fees and other costs and legal, accounting and other professional fees relating to the Acquisition. Actual fees and expenses may vary. To the extent any fees and expenses exceed the estimated amounts, we expect to fund such amounts with cash on our balance sheet at the closing of the Acquisition. |
18
SUMMARY HISTORICAL FINANCIAL INFORMATION
Company Summary Financial Information
The following tables summarize certain of our consolidated financial data for the periods ended on and as of the dates indicated below and are presented in U.S. dollars.
We have extracted our summary financial information (i) as of January 1, 2023, December 31, 2023 and December 31, 2024 and for the years ended December 31, 2022, 2023 and 2024 from the audited consolidated financial statements (the “Genmab Consolidated Financial Statements”) which have been updated as described in notes 1.1, 1.4, 4.2 and 4.5 in the Genmab Consolidated Financial Statements, which are included in this offering memorandum, and reissued compared to the previously announced consolidated financial statements as of the end of and for such years and (ii) as of and for the nine months ended September 30, 2024 and 2025 from the unaudited interim condensed consolidated financial statements (the “Genmab Unaudited Interim Condensed Consolidated Financial Statements”), which are included in this offering memorandum, each prepared in accordance with International Financial Reporting Standards (“IFRS”), as issued by the International Accounting Standards Board (“IASB”) and as endorsed by the EU (“IFRS Accounting Standards”) and IAS 34 Financial Information, respectively.
Our historical results are not necessarily indicative of our future results, and our results for any interim period are not necessarily indicative of the results to be expected for a full year.
The summary financial information below includes Adjusted EBITDA, Adjusted EBITDA Margin and Free Cash Flow, which are non-IFRS measures that we believe are widely used by investors as supplemental measures of performance or, in the case of Free Cash Flow, liquidity. Adjusted EBITDA, Adjusted EBITDA Margin, Free Cash Flow and our unaudited historical financial information for the twelve months ended September 30, 2025 are not an accounting measures presented in accordance with IFRS and therefore should not be considered a substitute for, or superior to, measures of our operating performance and liquidity presented in accordance with IFRS. Our unaudited historical financial information for the twelve months ended September 30, 2025 has been calculated by adding together (i) the audited financial information for the year ended December 31, 2024 and (ii) the unaudited interim condensed consolidated financial information for the nine months ended September 30, 2025 and then subtracting the unaudited interim condensed consolidated financial information for the nine months ended September 30, 2024. See “Presentation of Financial and Other Information—Use of Non-IFRS And Non-GAAP Financial Information”.
Prospective investors should read the summary financial information presented below in conjunction with “Presentation of Financial and Other Information,” “Use of Proceeds,” “Capitalization,” “Management’s Discussion and Analysis of Financial Condition and Results of Operations” and the Genmab Consolidated Financial Statements and the Genmab Unaudited Interim Condensed Consolidated Financial Statements, included elsewhere in this offering memorandum.
28
Select Consolidated Income Statement Data of the Company
| Year Ended December 31, | Nine Months Ended September 30, |
Last Twelve Months Ended September 30, |
||||||||||||||||||||||
| ($ million) | 2022* Restated |
2023* Restated |
2024* Restated |
2024* Restated |
2025 | 2025 | ||||||||||||||||||
| Revenue |
$ | 2,031 | $ | 2,390 | $ | 3,121 | $ | 2,198 | $ | 2,662 | 3,585 | |||||||||||||
| Cost of product sales |
— | (33 | ) | (143 | ) | (95 | ) | (157 | ) | (205 | ) | |||||||||||||
| Research and development expenses |
(787 | ) | (1,107 | ) | (1,414 | ) | (1,032 | ) | (1,080 | ) | (1,462 | ) | ||||||||||||
| Selling, general and administrative expenses |
(379 | ) | (478 | ) | (549 | ) | (370 | ) | (418 | ) | (597 | ) | ||||||||||||
| Acquisition and integration related charges |
— | — | (43 | ) | (39 | ) | — | (4 | ) | |||||||||||||||
|
|
|
|
|
|
|
|
|
|
|
|
|
|||||||||||||
| Total costs and operating expenses |
$ | (1,166 | ) | $ | (1,618 | ) | $ | (2,149 | ) | $ | (1,536 | ) | $ | (1,655 | ) | $ | (2,268 | ) | ||||||
|
|
|
|
|
|
|
|
|
|
|
|
|
|||||||||||||
| Operating profit |
$ | 865 | $ | 772 | $ | 972 | $ | 662 | $ | 1,007 | $ | 1,317 | ||||||||||||
|
|
|
|
|
|
|
|
|
|
|
|
|
|||||||||||||
| Financial income |
443 | 299 | 645 | 328 | 312 | 629 | ||||||||||||||||||
| Financial expenses |
(347 | ) | (254 | ) | (291 | ) | (181 | ) | (170 | ) | (280 | ) | ||||||||||||
|
|
|
|
|
|
|
|
|
|
|
|
|
|||||||||||||
| Net profit before tax |
961 | 817 | 1,326 | 809 | 1,149 | 1,666 | ||||||||||||||||||
|
|
|
|
|
|
|
|
|
|
|
|
|
|||||||||||||
| Corporate tax |
(211 | ) | (186 | ) | (193 | ) | (228 | ) | (217 | ) | (182 | ) | ||||||||||||
|
|
|
|
|
|
|
|
|
|
|
|
|
|||||||||||||
| Net profit |
$ | 750 | $ | 631 | $ | 1,133 | $ | 581 | $ | 932 | $ | 1,484 | ||||||||||||
|
|
|
|
|
|
|
|
|
|
|
|
|
|||||||||||||
| * | Genmab changed its presentation currency from DKK to USD effective January 1, 2025. Accordingly, management has translated the consolidated financial statements and related notes into USD for all periods presented. Refer to the Genmab Consolidated Financial Statements for more information. |
Select Consolidated Balance Sheet Data of the Company
| As of January 1, |
As of December 31, | As of September 30, | ||||||||||||||||||
| ($ million) | 2023* Restated |
2023* Restated |
2024* Restated |
2024 | 2025 | |||||||||||||||
| Marketable securities |
$ | 1,783 | $ | 1,967 | $ | 1,574 | $ | 1,648 | $ | 1,650 | ||||||||||
| Cash and cash equivalents |
1,419 | 2,204 | 1,380 | 952 | 1,761 | |||||||||||||||
| Total non-current assets |
273 | 320 | 2,514 | 2,397 | 2,550 | |||||||||||||||
| Shareholders’ equity |
3,915 | 4,687 | 5,137 | 4,793 | 5,751 | |||||||||||||||
| Share capital |
10 | 10 | 10 | 10 | 10 | |||||||||||||||
| * | Genmab changed its presentation currency from DKK to USD effective January 1, 2025. Accordingly, management has translated the consolidated financial statements and related notes into USD for all periods presented. Refer to the Genmab Consolidated Financial Statements for more information. |
29
Company Adjusted EBITDA
| Year Ended December 31, | Nine Months Ended September 30, |
Last Twelve Months Ended September 30, |
||||||||||||||||||||||
| ($ million) | 2022 | 2023 | 2024 | 2024 | 2025 | 2025 | ||||||||||||||||||
| Adjusted EBITDA(1) |
$ | 978 | $ | 900 | $ | 1,197 | $ | 833 | $ | 1,150 | $ | 1,514 | ||||||||||||
| (1) | We present Adjusted EBITDA because we believe that it is widely used by investors as a supplemental measure of performance. We believe that Adjusted EBITDA provides useful information to investors about our results of operations because it allows a comparison of our results across periods on a consistent basis by removing the effects on our operating performance of our asset base and capital investment cycle (such as depreciation and amortization) and items largely outside the control of management (such as corporate taxes). We calculate Adjusted EBITDA as net profit for the period as adjusted for corporate tax, depreciation, amortization, share-based compensation expense, impairment charges, acquisition and integration related charges, financial income and financial expense. In addition, you should be aware that we may incur expenses similar to the adjustments in this presentation in the future and that certain of these items could be considered recurring in nature. Our presentation of Adjusted EBITDA should not be construed as an implication that our future results will be unaffected by unusual or non-recurring items. Adjusted EBITDA should not be considered in isolation or as a substitute for measures of our operating performance presented in accordance with IFRS. For a description of the limitations of Adjusted EBITDA, see “Presentation of Financial and Other Information—Use of Non-IFRS and Non-GAAP Financial Information.” The following table reconciles our Net Profit to Adjusted EBITDA for the periods indicated below: |
| Year Ended December 31, | Nine Months Ended September 30, |
Last Twelve Months Ended September 30, |
||||||||||||||||||||||
| ($ million) | 2022 | 2023 | 2024 | 2024 | 2025 | 2025 | ||||||||||||||||||
| Net profit |
$ | 750 | $ | 631 | $ | 1,133 | $ | 581 | $ | 932 | $ | 1,484 | ||||||||||||
| Plus: Corporate tax |
211 | 186 | 193 | 228 | 217 | 182 | ||||||||||||||||||
| Plus: Depreciation |
30 | 40 | 49 | 36 | 39 | 52 | ||||||||||||||||||
| Plus: Amortization |
20 | 3 | 11 | 7 | 11 | 15 | ||||||||||||||||||
| Plus: Share-based-compensation expense |
63 | 85 | 105 | 78 | 92 | 119 | ||||||||||||||||||
| Plus: Impairment charges |
— | — | 17 | 11 | 1 | 7 | ||||||||||||||||||
| Plus: Acquisition and integration related charges |
— | — | 43 | 39 | — | 4 | ||||||||||||||||||
| Less: Financial income |
(443 | ) | (299 | ) | (645 | ) | (328 | ) | (312 | ) | (629 | ) | ||||||||||||
| Plus: Financial expense |
347 | 254 | 291 | 181 | 170 | 280 | ||||||||||||||||||
| Adjusted EBITDA |
$ | 978 | $ | 900 | $ | 1,197 | $ | 833 | $ | 1,150 | $ | 1,514 | ||||||||||||
| Divided by: Revenue |
$ | 2,031 | $ | 2,390 | $ | 3,121 | $ | 2,198 | $ | 2,662 | 3,585 | |||||||||||||
| Adjusted EBITDA Margin |
48 | % | 38 | % | 38 | % | 38 | % | 43 | % | 42 | % | ||||||||||||
30
Company Free Cash Flow
| Year Ended December 31, | Nine Months Ended September 30, |
Last Twelve Months Ended September 30, |
||||||||||||||||||
| ($ million) | 2022 | 2023 | 2024 | 2025 | 2025 | |||||||||||||||
| Cash from Operating Activities |
$ | 555 | $ | 1,071 | $ | 1,126 | $ | 885 | $ | 1,274 | ||||||||||
|
|
|
|
|
|
|
|
|
|
|
|||||||||||
| Less: Tangible Capital Expenditures |
(45 | ) | (53 | ) | (27 | ) | (24 | ) | (38 | ) | ||||||||||
|
|
|
|
|
|
|
|
|
|
|
|||||||||||
| Free Cash Flow(2) |
510 | 1,018 | 1,099 | 861 | 1,236 | |||||||||||||||
| (2) | We present Free Cash Flow because we believe that it is widely used by investors as a supplemental measure of performance. We also believe Free Cash Flow is a meaningful measure as it is utilized by management and investors to assess our ability to generate cash flow from business operations to repay debt and return capital to our shareholders. We believe Free Cash Flow provides useful information to investors about our results of operations. We calculate Free Cash Flow as cash from operating activities minus tangible capital expenditures. Free Cash Flow should not be considered in isolation or as a substitute for measures of our operating performance presented in accordance with IFRS. For a description of the limitations of Free Cash Flow, see “Presentation of Financial and Other Information—Use of Non-IFRS and Non-GAAP Financial Information.” |
Merus Summary Financial Information
The following tables summarize certain financial information of Merus for the periods indicated below and are presented in U.S. dollars. We have extracted Merus’ summary financial information (i) as of and for the years ended December 31, 2023 and 2024 from Merus’ audited consolidated financial statements (“Merus’ Consolidated Financial Statements”) and (ii) as of and for the nine months ended September 30, 2024 and 2025 from Merus’ unaudited interim condensed consolidated financial statements (“Merus’ Unaudited Interim Condensed Consolidated Financial Statements”), each prepared in accordance with accounting principles generally accepted in the United States (“U.S. GAAP”) and set forth elsewhere in this offering memorandum.
The unaudited historical financial information for Merus for the twelve months ended September 30, 2025 has been calculated by adding together (i) the financial information for the year ended December 31, 2024 and (ii) the unaudited interim condensed consolidated financial information for the nine months ended September 30, 2025 and then subtracting the unaudited interim condensed consolidated financial information for the nine months ended September 30, 2024 from Merus’ Unaudited Interim Condensed Consolidated Financial Statements.
The summary financial information below includes Adjusted EBITDA, which is a non-GAAP measure that we believe is widely used by investors as a supplemental measure of performance. Adjusted EBITDA is not an accounting measure presented in accordance with U.S. GAAP and therefore should not be considered a substitute for, or superior to, measures of Merus’ operating performance presented in accordance with U.S. GAAP. See “Presentation of Financial and Other Information—Use of Non-IFRS and Non-GAAP Financial Information.”
Prospective investors should read the summary financial information of Merus presented below in conjunction with Merus’ Consolidated Financial Statements included elsewhere in this Offering Memorandum.
31
Select Consolidated Income Statement Data of Merus
| Year Ended December 31, | Nine Months Ended September 30, |
Last Twelve Months Ended September 30, |
||||||||||||||||||
| ($ thousands) | 2023 | 2024 | 2024 | 2025 | 2025 | |||||||||||||||
| Commercial material revenue |
$ | — | $ | — | $ | — | $ | 13,331 | $ | 13,331 | ||||||||||
| Collaboration revenue |
43,947 | 36,133 | 26,993 | 33,843 | 42,983 | |||||||||||||||
| Royalty revenue |
— | — | — | 292 | 292 | |||||||||||||||
|
|
|
|
|
|
|
|
|
|
|
|||||||||||
| Total revenue |
$ | 43,947 | $ | 36,133 | $ | 26,993 | $ | 47,466 | $ | 56,606 | ||||||||||
|
|
|
|
|
|
|
|
|
|
|
|||||||||||
| Operating expenses: |
||||||||||||||||||||
| Research and development |
140,658 | 225,368 | 150,942 | 254,059 | 328,485 | |||||||||||||||
| General and administrative |
59,836 | 82,832 | 59,466 | 75,975 | 99,341 | |||||||||||||||
|
|
|
|
|
|
|
|
|
|
|
|||||||||||
| Total operating expenses |
$ | 200,494 | $ | 308,200 | $ | 210,408 | $ | 330,034 | $ | 427,826 | ||||||||||
|
|
|
|
|
|
|
|
|
|
|
|||||||||||
| Operating loss |
$ | (156,547 | ) | $ | (272,067 | ) | $ | (183,415 | ) | $ | (282,568 | ) | $ | (371,220 | ) | |||||
|
|
|
|
|
|
|
|
|
|
|
|||||||||||
| Other income (loss), net: |
||||||||||||||||||||
| Interest income, net |
14,510 | 30,789 | 22,301 | 23,152 | 31,640 | |||||||||||||||
| Foreign exchange (losses) gains, net |
(9,710 | ) | 34,103 | (16,897 | ) | (78,342 | ) | (27,342 | ) | |||||||||||
| Other (losses) gains, net |
— | — | — | (2,912 | ) | (2,912 | ) | |||||||||||||
|
|
|
|
|
|
|
|
|
|
|
|||||||||||
| Total other income (loss), net |
$ | 4,800 | $ | 64,892 | $ | 5,404 | $ | (58,102 | ) | $ | 1,386 | |||||||||
|
|
|
|
|
|
|
|
|
|
|
|||||||||||
| Loss before income tax expense |
$ | (151,747 | ) | $ | (207,175 | ) | $ | (178,011 | ) | $ | (340,670 | ) | $ | (369,834 | ) | |||||
|
|
|
|
|
|
|
|
|
|
|
|||||||||||
| Income tax expense |
3,192 | 8,151 | 6,392 | 9,542 | 11,301 | |||||||||||||||
|
|
|
|
|
|
|
|
|
|
|
|||||||||||
| Net loss |
$ | (154,939 | ) | $ | (215,326 | ) | $ | (184,403 | ) | $ | (350,212 | ) | $ | (381,135 | ) | |||||
|
|
|
|
|
|
|
|
|
|
|
|||||||||||
Select Consolidated Balance Sheet Data of Merus
| As of December 31, | As of September 30, | |||||||||||
| ($ thousands) | 2023 | 2024 | 2025 | |||||||||
| Cash and cash equivalents |
$ | 204,246 | $ | 293,294 | $ | 367,491 | ||||||
| Marketable securities |
150,130 | 243,733 | 268,441 | |||||||||
| Total current assets |
368,814 | 569,072 | 691,929 | |||||||||
| Total non-current assets |
86,680 | 213,621 | 212,267 | |||||||||
| Total assets |
455,494 | 782,693 | 904,196 | |||||||||
| Total liabilities |
99,151 | 134,766 | 129,264 | |||||||||
| Total shareholders’ equity |
356,343 | 647,927 | 774,932 | |||||||||
32
Merus Adjusted EBITDA
| Year Ended December 31, | Nine Months Ended September 30, |
Last Twelve Months Ended September 30, |
||||||||||||||||||
| ($ thousands) | 2023 | 2024 | 2024 | 2025 | 2025 | |||||||||||||||
| Adjusted EBITDA(1) |
(127,781 | ) | (223,762 | ) | (151,562 | ) | (224,566 | ) | (296,766 | ) | ||||||||||
| (1) | Merus does not report Adjusted EBITDA in its public disclosures and it is calculated differently than Adjusted EBITDA of Genmab. Genmab is presenting this measure using U.S. GAAP measures reported in Merus’ public disclosures and based on corresponding adjustments that Genmab applies to its own Adjusted EBITDA. We present Adjusted EBITDA because we believe that it is widely used by investors as a supplemental measure of performance. We believe that Adjusted EBITDA provides useful information to investors about Merus’ results of operations because it allows a comparison of Merus’ results across periods on a consistent basis by removing the effects on Merus’ operating performance of its asset base and capital investment cycle (such as depreciation and amortization) and items largely outside the control of management (such as income taxes). We calculate Merus Adjusted EBITDA as net loss for the period as adjusted for income tax expense, depreciation of property and equipment, amortization of intangible assets, share-based compensation expense and total other income (loss), net. Adjusted EBITDA is not an accounting measure presented in accordance with U.S. GAAP and therefore should not be considered in isolation or as a substitute for measures of Merus’ operating performance presented in accordance with U.S. GAAP. For a description of the limitations of Adjusted EBITDA, see “Presentation of Financial and Other Information—Use of Non-IFRS and Non-GAAP Financial Information.” The following table reconciles Merus’ net loss to Adjusted EBITDA for the periods indicated below: |
| Year Ended December 31, |
Nine Months Ended September 30, |
Last Twelve Months Ended September 30, |
||||||||||||||||||
| ($ thousands) | 2023 | 2024 | 2024 | 2025 | 2025 | |||||||||||||||
| Net loss |
$ | (154,939 | ) | $ | (215,326 | ) | $ | (184,403 | ) | $ | (350,212 | ) | $ | (381,135 | ) | |||||
| Plus: Income tax expense |
3,192 | 8,151 | 6,392 | 9,542 | 11,301 | |||||||||||||||
| Plus: Depreciation of property and equipment |
2,325 | 2,294 | 1,749 | 1,720 | 2,265 | |||||||||||||||
| Plus: Amortization of intangible assets |
215 | 177 | 133 | 139 | 183 | |||||||||||||||
| Plus: Share-based compensation expense |
26,226 | 45,834 | 29,971 | 56,143 | 72,006 | |||||||||||||||
| Plus/(Less): Total other income (loss), net(1) |
(4,800 | ) | (64,892 | ) | (5,404 | ) | 58,102 | (1,386 | ) | |||||||||||
|
|
|
|
|
|
|
|
|
|
|
|||||||||||
| Adjusted EBITDA |
$ | (127,781 | ) | $ | (223,762 | ) | $ | (151,562 | ) | $ | (224,566 | ) | $ | (296,766 | ) | |||||
|
|
|
|
|
|
|
|
|
|
|
|||||||||||
| (1) | Total other income (loss), net includes net interest income and foreign exchange loss. |
33
Risks Related to the Acquisition
The pending Acquisition may not be completed on the currently contemplated timeline or terms, or at all.
The consummation of the Acquisition is subject to the satisfaction or waiver of certain conditions. Satisfaction of a number of the conditions is not within our control, and it is possible that such conditions may prevent or delay or otherwise materially adversely affect our ability to complete the Acquisition. These conditions include (i) the expiration or termination of the relevant waiting period (as it may be extended) under the Hart-Scott-Rodino Antitrust Improvements Act of 1976 and the rules and regulations promulgated thereunder, (ii) a ‘no further questions’ response following submission of a briefing paper to the UK Competition and Markets Authority (the “UK CMA”), if this is the most recent response from the UK CMA as at the date all other conditions to the Offer are satisfied or, alternatively, clearance from the UK CMA following the submission of a notice to the CMA in the prescribed form as contemplated by Section 96 of the Enterprise Act 2002 in relation to the Offer, (iii) the valid tendering of a sufficient number of Merus common shares and (iv) adoption of resolutions by shareholders of Merus at an extraordinary meeting convened for the purpose of approving certain transactions related to the Offer, including the Back-End Transactions. Neither we nor Merus can provide assurance that the conditions to completing the Acquisition will be satisfied or waived, and accordingly, that the Acquisition will be completed on the timeline that the parties anticipate or at all. If any condition to the Acquisition is not satisfied, it could delay or prevent the Acquisition from occurring, which could negatively impact us and our growth prospects.
63
We may not realize the anticipated benefits from the pending Acquisition.
The Acquisition involves the combination of two companies that currently operate as independent companies. While we and Merus will continue to operate independently until the Acquisition Closing Date, the success of the Acquisition will depend, in part, on our ability to realize the anticipated benefits from successfully combining our and Merus’ businesses after closing. We plan on devoting substantial management attention and resources to integrating our and Merus’ businesses so that we can fully realize the anticipated benefits of the Acquisition. Nonetheless, the acquired Merus business, including petosemtamab, may not be successful, may require greater resources and investments than originally anticipated or may result in the assumption of unknown or contingent liabilities, which could have an adverse effect on us or our results of operations.
Potential difficulties we may encounter following closing include the following:
| | the inability to successfully combine our and Merus’ businesses in a manner that permits us to realize the anticipated benefits of the Acquisition in the timeframe currently anticipated, or at all; |
| | the failure to integrate internal systems, programs and internal controls, or applying different accounting policies, assumptions or judgments to Merus’ operational results than Merus applied in the past; |
| | effectively and efficiently integrating information technology and other systems; |
| | issues not discovered as part of the transactional due diligence process or unanticipated liabilities or contingencies of Merus, including employment or severance-related obligations under applicable law or other benefits arrangements, claims by or amounts owed to vendors or other commercial disputes, cyber incidents and information technology failures or delays, matters related to data privacy, data localization and the handling of personally identifiable information, and other unknown or contingent liabilities; |
| | preserving the important licensing, marketing, and other commercial relationships of Merus; |
| | the complexities associated with managing the combined company; |
| | the failure to retain key employees of either of the two companies who may be difficult to replace; |
| | the disruption of each company’s ongoing businesses or inconsistencies in services, standards, controls, procedures and policies; |
| | potential unknown liabilities and unforeseen increased expenses, delays or regulatory conditions associated with the Acquisition; and |
| | performance shortfalls at one or both of the two companies as a result of the diversion of management’s attention caused by completing the Acquisition and integrating our and Merus’ operations. |
Any of these risks could adversely affect our ability to maintain relationships with collaboration partners, vendors, employees and other commercial relationships or adversely affect our or Merus’ future operational results. As a result, the anticipated benefits of the Acquisition may not be realized or at all or may take longer to realize or cost more than expected, which could adversely affect our business, financial condition, results of operations and growth prospects. In addition, changes in laws and regulations could adversely impact our business, financial condition, results of operations and growth prospects after the Acquisition.
The pendency of the Acquisition could adversely affect our and/or Merus’ businesses and operations.
In connection with the pending Acquisition, some collaboration partners, vendors or other parties with commercial relationships with either of us or Merus may delay or defer decisions, which could adversely affect the revenues, earnings, cash flows and expenses of us or Merus, regardless of whether the Acquisition is
64
completed. In addition, due to operating covenants in the Transaction Agreement, Merus may be unable (without our prior written consent), during the pendency of the Acquisition, to pursue strategic transactions, undertake significant capital projects or otherwise pursue other actions outside the ordinary course, even if such actions would prove beneficial.
We expect to incur material expenses related to the Acquisition.
We expect to incur material expenses in connection with the Acquisition and the subsequent integration of the business, operations, practices, policies and procedures of Merus. These additional expenses could have an adverse effect on us or our results of operations. While we have assumed that a certain level of transaction and integration expenses would be incurred, there are a number of factors beyond our control that could affect the total amount or the timing of integration expenses. Many of the expenses that will be incurred, by their nature, are difficult to estimate accurately at the present time.
The Transaction Agreement and related documents may be amended or modified without your consent.
Between the time of the issuance of the notes and the consummation of the Acquisition, the parties to the Transaction Agreement may agree to modify or waive the terms or conditions of such documents without noteholder consent. The terms of the notes will not preclude the parties to the Transaction Agreement from making certain changes to the terms of the Acquisition or from waiving certain conditions to the Acquisition, which may adversely affect your investment in the notes.
Genmab’s ability to realize the anticipated benefits of the Acquisition will depend on its ability to effectively conduct clinical development of, obtain regulatory approvals for, and profitably commercialize, petosemtamab.
We may fail to realize the anticipated benefits of the Acquisition if we are unable to successfully develop, obtain regulatory approval for, and commercialize petosemtamab on the currently anticipated timeline, for all of the currently anticipated therapeutic indications, or at all.
While petosemtamab delivered positive data in certain HNSCC indications in prior Phase I/II trials, there is no assurance that the currently ongoing Phase III trials will ultimately demonstrate the efficacy of petosemtamab in those indications at a level that will be sufficient to obtain regulatory approval. A number of companies in the pharmaceutical, biopharmaceutical and biotechnology industries have suffered significant setbacks in advanced clinical trials even after obtaining promising results in earlier trials, and we cannot be certain that we will not face similar setbacks with petosemtamab.
In addition, while petosemtamab has received BTD from the FDA with respect to two HNSCC indications, this designation does not assure ultimate approval by the FDA. BTD is a process designed to expedite the development and review of drugs that are intended to treat a serious condition and preliminary clinical evidence indicates that the drug may demonstrate substantial improvement over available therapy on a clinically significant endpoint. Drugs that receive BTD are eligible for certain procedural benefits as part of the FDA review process, including more frequent meetings with FDA staff to discuss the drug’s development plan and ensure collection of appropriate data needed to support drug approval, more frequent written communication from FDA staff, rolling review of BLA or NDA submissions, intensive guidance on an efficient drug development program, and organizational commitment involving senior managers. BTD does not, however, change the scientific and medical standard for approval or the quality of evidence necessary to support approval. As a result, applications for product candidates granted expedited review or BTD designation may be ultimately denied based on trial data, trial design or other factors.
Furthermore, even though the available data from petosemtamab Phase I/II trials in certain HNSCC indications may seem stronger in certain respects than data for certain alternative therapies, there is no completed
65
head-to-head trial that actually compared the safety and efficacy of petosemtamab with any alternative therapy as part of the same investigational setting. Separate clinical trials for alternative therapies may differ in trial design and duration, patient population, treatment protocols and investigators and other important factors, making it difficult to compare data across trials or to draw reliable conclusions from such cross-trial comparisons. It is possible that petosemtamab may turn out not to be superior to alternative therapies in the currently ongoing Phase III trials in HNSCC.
Even if we can successfully progress the clinical development of petosemtamab and obtain the anticipated marketing approvals, we may not be able to commercialize it on the currently anticipated timeline or at all, or to realize its expected revenue potential. For more information about the risks involved in clinical development, regulatory approval and commercialization of new products generally, please see “—Risks Related to Product Development.” Our ability to realize petosemtamab’s potential is also subject to all of the other risks affecting our business described in this “Risk Factors” section.
Genmab’s and Merus’ actual financial positions and results of operations may differ materially from the unaudited pro forma condensed combined financial information included in this offering memorandum.
The unaudited pro forma condensed combined financial information contained in this offering memorandum is presented for illustrative purposes only and may differ materially from what Genmab’s actual financial position or results of operations would have been had the Acquisition been completed on the dates indicated. The unaudited pro forma condensed combined financial information has been derived from the audited and unaudited historical financial statements of Genmab and Merus and certain adjustments and assumptions have been made regarding the combined company after giving effect to the Transactions. The assets and liabilities of Merus have been measured at fair value based on various preliminary estimates using assumptions that Genmab management believes are reasonable utilizing information currently available. The process for estimating the fair value of acquired assets and assumed liabilities requires the use of judgment in determining the appropriate assumptions and estimates. These estimates may be revised as additional information becomes available and as additional analyses are performed. Differences between preliminary estimates in the unaudited pro forma condensed combined financial information and the final acquisition accounting will occur and could have a material impact on the unaudited pro forma condensed combined financial information and the combined company’s financial position and future results of operations.
In addition, the assumptions used in preparing the unaudited pro forma condensed combined financial information may not prove to be accurate, and other factors may affect Genmab’s financial condition or results of operations following the completion of the Acquisition. Furthermore, while Genmab’s financial statements are prepared in accordance with IFRS, Merus’ financial statements have historically been prepared in accordance with U.S. GAAP. We have provided adjustments to present these reported results on a basis consistent with Genmab’s accounting policies under IFRS; however, there may be additional differences in the accounting standards that were not captured in such adjustments which would have altered the results.
66
The following table sets forth our cash and cash equivalents and marketable securities and capitalization as of September 30, 2025 on (i) an actual basis and (ii) on an as adjusted basis after giving effect to the Transactions. The information in this table should be read in conjunction with “Use of Proceeds,” “Unaudited Pro Forma Condensed Combined Financial Information” and “Management’s Discussion and Analysis of Financial Condition and Results of Operations,” as well as the historical consolidated financial statements included in this offering memorandum. For purposes of this presentation, the as adjusted debt amounts are presented at their full principal amounts, without giving effect to any capitalization of debt issuance costs under IFRS.
| As of September 30, 2025 | ||||||||
| Actual | As Adjusted | |||||||
| ($ in millions) | ||||||||
| Cash and cash equivalents and marketable securities(1) |
$ | 3,411 | $ | 1,153 | ||||
|
|
|
|
|
|||||
| Total long-term debt: |
||||||||
| New Revolving Facility(2) |
— | — | ||||||
| Existing Revolving Facility(3) |
— | — | ||||||
| Term Loan A Facility(4) |
— | 1,000 | ||||||
| Term Loan B Facility(4) |
— | 2,000 | ||||||
| Secured Notes offered hereby(5) |
— | 1,500 | ||||||
| Unsecured Notes offered hereby(5) |
— | 1,000 | ||||||
|
|
|
|
|
|||||
| Total long-term debt, including current portion |
— | 5,500 | ||||||
| Total shareholders’ equity |
5,751 | 5,751 | ||||||
|
|
|
|
|
|||||
| Total capitalization |
$ | 5,751 | $ | 11,251 | ||||
|
|
|
|
|
|||||
| (1) | Approximately $2,895 million of cash and cash equivalents and marketable securities is expected to be used as a source of funds in connection with the Acquisition. The actual amount of cash and cash equivalents and marketable securities that will be used as a source of funds in connection with the Acquisition will vary depending on, among other things, our cash balance on the Acquisition Closing Date, transaction fees and expenses and the Acquisition Closing Date. The as adjusted column reflects Merus cash and cash equivalents and marketable securities of $637 million as of September 30, 2025 as presented under IFRS, which involved a reclassification of $181 million of Merus non-current marketable securities under U.S. GAAP to other investments under IFRS. See Note 2 in “Unaudited Pro Forma Condensed Combined Financial Information” for further information. Assumes the Notes are issued at par. |
| (2) | The New Revolving Facility is expected to provide for commitments for $500 million of revolving borrowings, which would constitute secured indebtedness when drawn. The Issuers expect the New Revolving Facility to be undrawn at the closing of the Acquisition. See “Description of Certain Other Indebtedness.” |
| (3) | Our Existing Credit Agreement provides for $300 million in commitments of revolving borrowings. As of September 30, 2025, there were $0 million in borrowings under our Existing Credit Agreement. We expect to terminate the existing revolving credit facility prior to or concurrently with the closing of the Acquisition. See “Description of Certain Other Indebtedness.” |
| (4) | Concurrently with the closing of the Acquisition, the Issuers expect to enter into the Term Loan A Facility and the Term Loan B Facility, as further described in “Summary—The Transactions—Financing Transactions”, each of which will be fully drawn at the closing of the Acquisition. “Description of Certain Other Indebtedness.” |
| (5) | Assumes the Notes are issued at par. |
90
MANAGEMENT’S DISCUSSION AND ANALYSIS OF FINANCIAL CONDITION AND RESULTS OF OPERATIONS
The following discussion and analysis of Genmab’s financial condition and results of operations covers periods prior to the consummation of the Acquisition, except for the subsections “Acquisition of Merus,” “Key Components of Our Results and Related Trends—Impact of the Acquisition of Merus” and “Liquidity and Capital Resources—Liquidity and Capital Resources Following the Acquisition”. Accordingly, the discussion and analysis of historical periods do not reflect the impact that the Acquisition will have on us. You should read the following discussion of Genmab’s financial condition and results of operations in conjunction with the Genmab Consolidated Financial Statements and the Genmab Unaudited Interim Condensed Consolidated Financial Statements included in this offering memorandum. This discussion contains forward-looking statements and involves numerous risks and uncertainties, including, but not limited to, those described in the “Forward-Looking Statements” ands “Risk Factors” sections of this offering memorandum. Actual results may differ materially from those contained in any forward-looking statements. Unless otherwise indicated or the context otherwise requires, references in this management’s discussion and analysis of financial condition and results of operations to “we,” “us,” “our,” “Genmab” and the “Company” refer to Genmab and its consolidated subsidiaries over which Genmab has control before giving effect to the consummation of the Acquisition.
Overview
Genmab is an international biotechnology company with a core purpose of improving the lives of patients with innovative and differentiated antibody therapeutics. For more than 25 years, its passionate, innovative and collaborative team has invented next-generation antibody technology platforms and leveraged translational, quantitative and data sciences, resulting in a proprietary pipeline including bispecific T-cell engagers, antibody-drug conjugates, next-generation immune checkpoint modulators and effector function-enhanced antibodies. Genmab’s antibody technology platforms have given rise to eight commercialised products and a pipeline of novel antibody-based products and product candidates designed to address medical needs and improve treatment outcomes for patients with cancer and other serious diseases. Our pipeline includes both wholly owned and partnered programs, with several compounds in late-stage clinical development. Our goal in building our pipeline is to bring medicines to market ourselves in geographic areas where we believe we will be able to maximize their value. By 2030, our vision is to transform the lives of people with cancer and other serious diseases with knock-your-socks-off antibody medicines®.
Since Genmab’s founding in 1999 we have been dedicated to creating innovative and differentiated antibody therapeutics, initially as a R&D innovation powerhouse out-licensing novel candidates to large cap pharma partners, including Janssen, Roche, GSK and Novo Nordisk, for upfront, milestone and royalty payments. Early partnerships yielded six FDA-approved, commercialized, royalty-bearing products: DARZALEX, Kesimpta, TEPEZZA, RYBREVANT, TALVEY, and TECVAYLI. In full-year 2024, these products generated approximately $18 billion in aggregate partner net sales, providing a strong, recurring royalty revenue foundation for Genmab. Given the constantly evolving oncology landscape, our antibody platforms and our expertise and know-how in antibody development, we have shifted our model into a fully integrated biotech company through commercialization and co-commercialization of proprietary products such as EPKINLY and Tivdak in certain geographies, allowing Genmab to retain a greater share of the economic potential of these products. We are focused on the development of our proprietary, wholly owned pipeline, including through high potential growth opportunities such as our acquisition of ProfoundBio in 2024 and the Acquisition, which has resulted in a significant portfolio that incorporates the next wave of innovation in oncology indications with high medical needs.
Our current priorities are the commercial or late-stage programs epcoritamab and wholly owned Rina-S and acasunlimab. Epcoritamab, marketed as EPKINLY in the U.S. and Japan and as TEPKINLY outside of those territories, is being developed and commercialized in collaboration with AbbVie.
109
Epcoritamab is the only bispecific antibody approved with a dual indication for the treatment of certain B-cell malignancies in the U.S., Europe and Japan. Rina-S entered Phase III clinical development for PROC in 2024 and EC in 2025, and acasunlimab entered Phase III clinical development for NSCLC in 2024.
The table below summarizes key data points on our six approved royalty products and our two approved proprietary products, respectively.
| (1) | To the extent available and reported; RYBREVANT®, TECVAYLI® and TALVEY® are not owned products. |
| (2) | Remaining 10% of revenue attributable to milestones and reimbursements and licensing. |
| (3) | Source: For DARZALEX® and TECVAYLI® 2024 sales, J&J FY 2024 financial results; for KESIMPTA® 2024 sales, Novartis FY 2024 financial results; for TEPEZZA® 2024 sales, Amgen FY 2024 results; for TIVDAK® and EPKINLY® 2024 sales, GMAB FY 2024 presentation. |
| (4) | Exclusivity protection provided by Genmab patents (exp. 2031) and Novartis owned patents (exp. 2037). Royalties continue to be paid on all sales after patent expirations. |
| (5) | Co-commercialization collaboration. |
| (6) | U.S., European and Japanese patents for EPKINLY® and TIVDAK® do not begin to expire until the dates shown, however requests for patent term extensions have been filed for both which, if approved, would provide protection beyond the displayed end dates. |
| (7) | Includes $253M in EPKINLY® net product sales and $7M in TEPKINLY® royalties. |
Innovation and Proprietary Technology Platform
Our portfolio includes five proprietary antibody technology platforms: (i) our DuoBody platform, which can be used for the creation and development of bispecific antibodies; (ii) our HexaBody platform, which can be used to increase the potential potency of antibodies through hexamerization; (iii) our DuoHexaBody platform, which enhances the potential potency of bispecific antibodies through hexamerization; (iv) our HexElect platform, which combines two HexaBody molecules to maximize potential potency while minimizing potential toxicity by more selective binding to desired target cells; and (v) our ADC platforms, acquired through the purchase of ProfoundBio in May 2024. Antibody products created with these technologies may be used in a wide variety of indications including cancer as well as autoimmune, central nervous system and infectious diseases. These platforms play a key role in building our product pipeline, enhancing our collaborations and generating revenue. We selectively enter into collaborations with other biotechnology and pharmaceutical companies that build our network in the biotechnology space and give us access to complementary novel technologies or products that move us closer to achieving our vision and fulfilling our core purpose.
110
Our innovation and proprietary technology platforms are used in the pipelines of global pharmaceutical and biotechnology companies. These companies are running clinical development programs with antibodies created by Genmab or created using Genmab’s proprietary DuoBody bispecific antibody technology platform. The six approved medicines created by Genmab or that incorporate Genmab’s innovation or technology platforms are: daratumumab, marketed by J&J as DARZALEX (IV formulation) and DARZALEX FASPRO or DARZALEX SC (SC formulation), approved in the U.S., Europe, Japan and other territories for the treatment of certain indications of MM and AL amyloidosis; amivantamab, marketed in the U.S., Europe, Japan and other territories by J&J as RYBREVANT for the treatment of certain adult patients with locally-advanced or metastatic NSCLC with EGFR exon 20 insertion mutations; teclistamab, marketed in the U.S., Europe, Japan and other territories by J&J as TECVAYLI for certain indications of MM; talquetamab, marketed in the U.S., Europe, Japan and other territories by J&J as TALVEY for certain indications of MM; SC ofatumumab, marketed in the U.S., Europe, Japan and other territories as Kesimpta by Novartis for the treatment of RMS; and teprotumumab, marketed in the U.S. and Japan as TEPEZZA by Amgen for the treatment of TED. Under the agreements for these products we are entitled to certain royalties based on net sales and potential milestone payments.
For our proprietary commercial products EPKINLY and Tivdak, our commercialization rights and related revenues and expenses vary by jurisdiction as further described below:
| | EPKINLY collaboration with AbbVie. Genmab shares commercial responsibilities for epcoritamab, marketed as EPKINLY, with AbbVie in the U.S. and Japan, while AbbVie is responsible for global commercialization outside of the U.S. and Japan. We are the principal for net sales of epcoritamab in the U.S. and Japan and receive tiered royalties on remaining global sales outside these territories. We are entitled to tiered royalties between 22% and 26% on net sales for epcoritamab outside the U.S. and Japan, subject to certain royalty reductions. Except for these royalty-bearing sales, we share with AbbVie profits from the sale of epcoritamab on a 50:50 basis. We and AbbVie split 50:50 the development costs related to epcoritamab, while we will be responsible for 100% of the costs for the discovery research programs up to the stage at which AbbVie elects whether to participate in co-development and co-commercialization of a compound or licensed product. |
| | Tivdak collaboration with Pfizer. Genmab is co-promoting tisotumab vedotin, marketed as Tivdak, in the U.S. with Pfizer, with Pfizer recording U.S. sales and Genmab receiving a 50% share of profit on such sales. Genmab is co-promoting tisotumab vedotin, marketed as Tivdak, in the U.S., and we lead commercial operational activities and record sales in Japan, where the product has been approved. Effective January 1, 2025, Genmab and Pfizer agreed to amend the Pfizer License and Collaboration Agreement (as defined herein) and the Tivdak Joint Commercialization Agreement (as defined herein), assigning Genmab sole responsibility for the development and commercialization of Tivdak for second line plus recurrent or metastatic cervical cancer in Europe and all other regions globally, excluding the U.S. and the China region. Pfizer will lead operational commercial activities in China, if and when approved in connection with the sublicense of its right to develop and commercialize Tivdak in China to Zai Lab, with a 50:50 profit split. |
Our results of operations have been, and we expect them to continue to be, affected by our collaboration with J&J for the development and commercialization of daratumumab. Since inception, we have funded our operating requirements primarily through proceeds from equity financing and milestone payments and royalties from our collaboration partners. We expect to continue to fund a significant portion of our development expenses for our proprietary product candidates as well as our planned commercialization activities with funds received from royalties and milestone payments from our collaboration partners.
For a description of certain of our product and technology collaborations including relevant royalty tiers, milestones and expense sharing provisions, please refer to “Business of Genmab—Product and Technology Collaborations”.
111
Acquisition of Merus
We announced the proposed Acquisition of Merus on September 29, 2025. Following the Back-End Closing Date, Merus will become our wholly owned subsidiary. The Acquisition, if consummated, will give us worldwide rights to Merus’ approved product, BIZENGRI (zenocutuzumab), as well as to its candidates in clinical development, including its lead product candidate, petosemtamab. In addition, we will acquire Merus’ Biclonics and Triclonics technology platforms. Petosemtamab is an investigational antibody-dependent cell-mediated cytotoxicity (ADCC)-enhanced Biclonics® for the potential treatment of solid tumors that is designed to bind to cancer stem cells expressing EGFR and LGR5.
We intend to continue the clinical development of petosemtamab in the LiGeR-HN1 Phase III clinical trial for the treatment of 1L PD-L1+ r/m HNSCC with pembrolizumab; the LiGeR-HN2 Phase III clinical trial for the treatment of 2/3L r/m HNSCC and the ongoing Phase I/II clinical trial in mCRC. We also intend to commence a Phase III clinical trial of petosemtamab in locally advanced HNSCC.
The FDA granted petosemtamab BTD in combination with pembrolizumab for the first-line treatment of adult patients with r/m PD-L1 positive HNSCC with CPS ≥ 1 in February 2025, and for the treatment of patients with r/m HNSCC whose disease has progressed following treatment with platinum based chemotherapy and an anti-PD-1 or anti-PD-L1 antibody. This designation followed receipt of FTD for petosemtamab for the treatment of patients with r/m HNSCC whose disease has progressed following treatment with platinum-based chemotherapy and an anti-programmed cell death protein 1 antibody announced in August 2023.
See “Summary—The Transactions—The Acquisition” for more information about the Acquisition, and “Business of Merus” for more information about Merus and petosemtamab.
Acquisition of ProfoundBio Inc.
On May 21, 2024, we completed the acquisition of all of the outstanding shares of ProfoundBio, resulting in ProfoundBio becoming a wholly owned subsidiary of Genmab. The acquisition of ProfoundBio gave us worldwide rights to three candidates in clinical development, including ProfoundBio’s lead drug candidate, Rina-S. In addition, we acquired ProfoundBio’s novel ADC technology platforms. Rina-S is a clinical-stage, FRa-targeted, TOPO1 ADC, currently in a Phase III clinical trial for the treatment of PROC. Based on the data from the ongoing Phase I/II clinical trial we intend to continue to broaden the development plans for Rina-S within ovarian cancer and other FRa-expressing solid tumors. In January 2024, the U.S. FDA granted FTD to Rina-S for the treatment of patients with FRa-expressing high-grade serous or endometrioid platinum-resistant ovarian cancer. In August 2025, the FDA granted BTD to Rina-S for the treatment of adult patients with recurrent or progressive endometrial cancer who have disease progression on or following prior treatment with a platinum-containing regimen and a PD-L1 therapy. A Phase III trial in endometrial cancer, RAINFOL-03, has been initiated.
See Note 5.5 in the Genmab Consolidated Financial Statements and Note 2 to the Genmab Unaudited Interim Condensed Consolidated Financial Statements included in this offering memorandum for additional details regarding our acquisition of ProfoundBio.
Key Components of Our Results and Related Trends
Impact of the Acquisition of Merus
We expect that, after consummation of the Acquisition, our research and development expenses, as well as our selling, general and administrative expenses, will increase in the short to medium term as compared to our own recent historical levels, and as compared to such historical expenses pro forma for the Acquisition as presented in our unaudited pro forma financial statements included elsewhere in this offering memorandum. We expect an increase in these expenses primarily as a result of our planned development and commercialization
112
activities for petosemtamab. Following the Acquisition, we intend to expand Merus’ current development plan for petosemtamab in additional HNSCC settings and other potential tumor types. Such expanded development will involve increased research and development and selling, general and administrative expenses as we support related manufacturing, clinical trial activities, and commercialization activities. See “—Liquidity and Capital Resources—Liquidity.”
While we expect to record additional royalty revenues following the Acquisition because we will acquire zenocutuzumab from Merus, we do not expect such revenues to be material. Considering the costs of development of petosemtamab and other Merus product candidates, we expect to maintain positive operating earnings and positive cash flow generation driven by our royalty business and proprietary products.
In addition, we recorded acquisition-related costs in the nine months ended September 30, 2025 and expect to record acquisition-related costs in the year ending December 31, 2025 related to the Acquisition. We also expect to record integration-related charges related to the Acquisition in the years ending December 31, 2025 and December 31, 2026. Such acquisition and integration-related charges may be significant.
Revenues
Our revenues are currently comprised of royalties, milestone revenue, reimbursement revenue, collaboration revenue, license fees, and net product sales. Royalty revenue from licenses is based on third-party sales of licensed products. Milestone revenue is typically related to reaching particular stages in product development, regulatory approval or a certain level of net sales. Reimbursement revenue is mainly comprised of the reimbursement of certain research and development expenses related to the development work under our collaboration agreements. Collaboration revenue reflects profit sharing arrangements for the sale of commercial products by our collaboration partners. License fees are non-refundable, upfront fees for our intellectual property received from our collaboration partners. Net product sales represent sales of products when Genmab is determined to be the principal in sales to the end customers.
The majority of our revenue is recognized from our collaboration partners under our collaboration agreements. In particular, our ability to generate revenue significantly depends on the success of J&J’s continued ability to effectively maintain and grow sales of DARZALEX for its approved indications, expand its indications, and successfully compete with existing and potential new investigational agents and technologies that are currently being marketed or studied for the same indications as DARZALEX. In addition, the royalties payable by J&J are limited in time. Pursuant to the terms of the agreement, J&J’s obligation to pay royalties to us will expire on a country-by-country basis on the later of the date that is 13 years after the first sale of daratumumab in such country or upon the expiration or invalidation of the last-to-expire relevant Genmab patent covering daratumumab in such country. The first U.S., European and Japanese sales of daratumumab occurred in 2015, 2016 and 2017, respectively. We have issued patents and pending patent applications covering daratumumab in numerous jurisdictions, including patents issued in the U.S., Europe and Japan. J&J owns a separate patent portfolio related to the subcutaneous formulation of daratumumab used in DARZALEX FASPRO/DARZALEX SC, but a binding arbitration determined that we are not entitled to royalties based on these separate patents. Our issued U.S., European and Japanese patents covering daratumumab, after giving effect to issued U.S., European and Japanese PTEs and SPCs, expire in 2029, 2031 and begin to expire in 2030, respectively. Assuming constant underlying sales of DARZALEX, we expect that our royalties from sales of DARZALEX will begin to decline materially in 2029 following expiration of our U.S. patent rights on daratumumab. We have also received, and in the future may from time to time receive, revenues from milestones and other payments relating to our collaborations.
In addition to revenue recognized from our collaboration partners, we also record revenue for sales of our proprietary commercial products. Epcoritamab was approved by the FDA and Japan MHLW in May 2023 and September 2023, respectively, and is marketed in the U.S. and Japan under the tradename EPKINLY. Our net product sales are currently almost exclusively derived from EPKINLY. Tisotumab vedotin was approved by the
113
FDA in September 2021, and is currently marketed in the U.S. as Tivdak. Pfizer records net product sales in the U.S. and shares 50% of the profit of such sales with us, and we record this profit share as collaboration revenue. Our ability to generate revenue from our proprietary commercial products, including EPKINLY and Tivdak, depends on the commercial potential of such products as well as our ability to successfully commercialize them.
Our ability to generate revenue from our proprietary and partnered product candidates depends on our and our collaboration partners’ ability to successfully complete clinical trials for our product candidates receive regulatory approvals, and effectively commercialize, all of which could impact the commercial potential of such products and our potential to receive milestone payments, royalties, net sales and other revenues for these products in the future.
For more information on our revenues, including for the breakdown of our revenues by type, collaboration partner and product, see Note 2.1 of the Genmab Consolidated Financial Statements and Note 3 of the Genmab Unaudited Interim Condensed Consolidated Financial Statements included in this offering memorandum.
Cost of Product Sales
Cost of product sales includes direct and indirect costs relating to the manufacture of inventory mainly from third-party providers of manufacturing as well as costs related to internal resources and distribution and logistics. Cost of product sales also includes product costs, royalty expense and profit-sharing amounts owed to collaboration partners for the sale of commercial products when Genmab is determined to be the principal in sales to end customers. For the year ended December 31, 2024 and the nine months ended September 30, 2025, the only profit-sharing amounts recorded as cost of product sales relate to 50:50 sharing of sales and related cost of product sales of EPKINLY in the U.S. and Japan pursuant to the collaboration agreement with AbbVie.
Research and Development Expenses
We are currently advancing our proprietary product candidates through clinical development and are conducting pre-clinical trials with respect to other programs. Developing product candidates is expensive, time-intensive and risky, and we expect our research and development expenses to increase over the next few years, particularly as we seek to advance our proprietary product candidates toward commercialization. Our research and development expenses include internal costs relating to our research and development departments, as well as external costs relating to trials performed by external suppliers and collaboration partners. Internal research and development expenses consist primarily of salaries and benefits for our research and development staff and related expenses, including expenses related to cash bonuses, warrant and restricted stock unit (“RSU”) programs as applicable to such personnel, costs of related facilities, equipment and other overhead expenses that have been determined to be directly attributable to research and development, costs associated with obtaining and maintaining patents for intellectual property, amortization of licenses and rights, amortization and impairment of intangible assets and depreciation and impairment of property and capital assets used to develop our product candidates.
Major components of the external costs are fees and other costs paid to CROs in conjunction with preclinical trials and the performance of clinical trials, milestone payments for in-licensed technology, as well as fees paid to CMOs in conjunction with the production of clinical compounds, drug substances and drugs. This includes (i) antibody clinical material for use in clinical trials and (ii) preparation for production of process validation batches for potential future regulatory submissions and related activities. These costs are expensed as incurred, because they do not qualify to be capitalized as inventory under IFRS Accounting Standards since the technical feasibility of the materials is not proven and no alternative use for them exists in the absence of marketing approval. Research and development expenses include amortization of intangible assets only in connection with licenses and rights we have acquired and capitalized. We do not capitalize intellectual property generated through our internal development activities. We expect to incur higher research and development expenses in future periods, including increasing costs for clinical trials and manufacturing as our proprietary
114
product candidates advance in clinical development and we increase the number of product candidates under active clinical development. Our research and development expenses may vary substantially from period to period based on the timing of our research and development activities, including timing due to regulatory approvals and enrollment of patients in clinical trials. See “Liquidity and Capital Resources—Liquidity and Capital Resources Following the Acquisition” below.
Selling, General and Administrative Expenses
Our selling, general and administrative expenses consist primarily of wages and salaries for personnel other than research and development staff. Also included are expenses related to pre-launch commercialization activities, depreciation, amortization and impairment of property and equipment, to the extent such expenses are related to the administrative functions, and co-promotion expenses related to commercial sales of Tivdak in the U.S. in accordance with our Tivdak Joint Commercialization Agreement with Pfizer. Lastly, selling, general and administrative expenses include our 50% share of the aggregate costs incurred by us and AbbVie in relation to sales and commercialization of EPKINLY in the U.S. and Japan. We expect our selling, general and administrative expenses to increase over the next few years as we continue to expand our commercialization capabilities in a number of jurisdictions. Such expenses may also increase over time as a result of inflation and other factors.
Overhead expenses are allocated to research and development expenses or selling, general and administrative expenses based on the number of employees and their relevant functions. The Dutch Research and Development Act (“WBSO”) provides compensation for a part of research and development wages and other costs at our Utrecht facility through a reduction in payroll taxes in the Netherlands. WBSO grant amounts are offset against wages and salaries included in research and development expenses.
Our ongoing research and development and, increasingly, commercialization activities will require substantial amounts of capital and may not ultimately be successful. Over the next several years, we expect that we will continue to incur substantial selling, general and administrative expenses, primarily as a result of activities related to the continued development of our proprietary pipeline and developing our commercial capabilities. Our proprietary product candidates will require significant further development, financial resources and personnel to pursue and obtain regulatory approval and develop them into commercially viable products, if they are approved and commercialized at all. Our commitment of resources to the research and continued development of our product candidates and expansion of our proprietary pipeline will likely result in our selling, general and administrative expenses increasing and/or fluctuating as a result of such activities in future periods. We may also incur significant milestone payment obligations to certain of our licensors as our product candidates progress through clinical trials towards potential commercialization.
Acquisition and Integration Related Charges
In the year ended December 31, 2024, acquisition related charges comprised payments to holders of outstanding ProfoundBio equity awards related to post-combination services. The remaining expenses are integration related charges, which comprise professional fees incurred to assist with the integration of ProfoundBio into our operations post-acquisition. See Note 5.5 in the Genmab Consolidated Financial Statements and Note 2 in the Genmab Unaudited Interim Condensed Consolidated Financial Statements included in this offering memorandum for additional details regarding our acquisition of ProfoundBio.
115
Results of Operations
Results of Operations for the Nine Months Ended September 30, 2025 and 2024
The following table sets forth our results of operations for the periods presented.
| Nine Months Ended September 30, | ||||||||
| ($ million) | 2025 | 2024 | ||||||
| Revenue |
$ | 2,662 | $ | 2,198 | ||||
| Cost of product sales |
(157 | ) | (95 | ) | ||||
| Research and development expenses |
(1,080 | ) | (1,032 | ) | ||||
| Selling, general and administrative expenses |
(418 | ) | (370 | ) | ||||
| Acquisition and integration related charges |
— | (39 | ) | |||||
|
|
|
|
|
|||||
| Total costs and operating expenses |
$ | (1,655 | ) | $ | (1,536 | ) | ||
|
|
|
|
|
|||||
| Operating profit |
$ | 1,007 | $ | 662 | ||||
|
|
|
|
|
|||||
| Financial income |
312 | 328 | ||||||
| Financial expenses |
(170 | ) | (181 | ) | ||||
|
|
|
|
|
|||||
| Net profit before tax |
$ | 1,149 | $ | 809 | ||||
|
|
|
|
|
|||||
| Corporate tax |
(217 | ) | (228 | ) | ||||
|
|
|
|
|
|||||
| Net profit |
$ | 932 | $ | 581 | ||||
|
|
|
|
|
|||||
Revenue
Genmab’s revenue was $2,662 million for the nine months ended September 30, 2025 compared to $2,198 million for the same period in 2024. The increase of $464 million, or 21%, was primarily driven by higher DARZALEX and Kesimpta royalties achieved under our collaborations with J&J and Novartis, respectively, and increased EPKINLY net product sales. This increase was partly offset by reduced reimbursement revenue associated with Genmab assuming full control of development, as well as future commercialization, of the acasunlimab program, effective in the second half of 2024.
| Nine Months Ended September 30, | ||||||||||||||||
| ($ million) | 2025 | 2024 | ||||||||||||||
| Royalties |
$ | 2,219 | 83 | % | $ | 1,802 | 82 | % | ||||||||
| Reimbursement Revenue |
43 | 2 | % | 121 | 6 | % | ||||||||||
| Milestone Revenue |
66 | 2 | % | 51 | 2 | % | ||||||||||
| Collaboration Revenue |
54 | 2 | % | 45 | 2 | % | ||||||||||
| Net Product Sales |
280 | 11 | % | 179 | 8 | % | ||||||||||
|
|
|
|
|
|
|
|
|
|||||||||
| Total revenue |
$ | 2,662 | 100 | % | $ | 2,198 | 100 | % | ||||||||
|
|
|
|
|
|
|
|
|
|||||||||
116
Royalty revenue amounted to $2,219 million for the nine months ended September 30, 2025 compared to $1,802 million for the same period in 2024. The increase of $417 million, or 23%, was primarily driven by higher DARZALEX and Kesimpta royalties achieved under our daratumumab collaboration with J&J and ofatumumab collaboration with Novartis. The table below summarizes Genmab’s royalty revenue by product.
| Nine Months Ended September 30, | ||||||||
| ($ million) | 2025 | 2024 | ||||||
| DARZALEX |
$ | 1,744 | $ | 1,442 | ||||
| Kesimpta |
320 | 228 | ||||||
| TEPEZZA |
75 | 78 | ||||||
| Other |
80 | 54 | ||||||
|
|
|
|
|
|||||
| Total royalties |
$ | 2,219 | $ | 1,802 | ||||
|
|
|
|
|
|||||
DARZALEX
J&J’s net sales of DARZALEX were $10,448 million for the nine months ended September 30, 2025 compared to $8,586 million for the same period in 2024. The increase of $1,862 million, or 22%, was driven by market share gains in all regions.
Royalty revenue on net sales of DARZALEX was $1,744 million for the nine months ended September 30, 2025 compared to $1,442 million for the same period in 2024, an increase of $302 million. The percentage increase in royalties of 21% is in line with the percentage increase in the underlying net sales.
Kesimpta
Novartis’ net sales of Kesimpta were $3,198 million for the nine months ended September 30, 2025 compared to $2,274 million for the same period in 2024. The increase of $924 million, or 41%, was primarily driven by increased demand and strong access.
Royalty revenue on net sales of Kesimpta was $320 million for the nine months ended September 30, 2025 compared to $228 million for the same 2024, an increase of $92 million, or 40%, which is in line with the percentage increase in net sales.
TEPEZZA
Amgen’s net sales of TEPEZZA were $1,446 million for the nine months ended September 30, 2025 and $1,391 million for the same period in 2024. Royalty revenue on net sales of TEPEZZA was $75 million for the nine months ended September 30, 2025 compared to $78 million for the same period in 2024, a decrease of $3 million, or 4% which is in line with the slight reduction of net sales.
Other royalties
Other royalties consist of royalties from net sales of RYBREVANT, TECVAYLI, TALVEY and TEPKINLY.
J&J was granted U.S. FDA approval for RYBREVANT during the second quarter of 2021, and Genmab subsequently started recognizing royalties on net sales of RYBREVANT. Royalties were not material for the nine months ended September 30, 2025 or the nine months ended September 30, 2024.
J&J was granted conditional approval for TECVAYLI for the treatment of R/R multiple myeloma during the third quarter of 2022 in Europe and approval in the fourth quarter of 2022 in the U.S. Royalties were not material for the nine months ended September 30, 2025 or the nine months ended September 30, 2024.
117
During the third quarter of 2023, J&J was granted approval in the U.S. and conditional approval in Europe for TALVEY for the treatment of relapsed or refractory multiple myeloma. Royalties were not material for the nine months ended September 30, 2025 or the nine months ended September 30, 2024.
The EC granted conditional marketing authorization for TEPKINLY as a monotherapy for the treatment of adult patients with relapsed or refractory DLBCL after two or more lines of systemic therapy during the third quarter of 2023. Royalties from AbbVie were not material for the nine months ended September 30, 2025 or the nine months ended September 30, 2024.
Royalty revenue fluctuations from period to period are driven by the level of product net sales and more specifically to DARZALEX, the contractual arrangement related to the annual currency hedge rate under our agreement with J&J, at which sales of DARZALEX for non-U.S. dollar denominated currencies are translated to U.S. dollars, Genmab’s share of J&J’s royalty payments to Halozyme in connection with SC product net sales and royalty deductions on net sales in countries and territories where there is no patent protection.
Reimbursement Revenue
Reimbursement revenue, mainly comprised of the reimbursement of certain research and development costs related to the development work under Genmab’s collaboration agreements, amounted to $43 million for the nine months ended September 30, 2025 and $121 million for the same period in 2024. The decrease of $78 million, or 64%, was primarily driven by Genmab assuming full control of development, as well as future commercialization, of the acasunlimab program, effective in the second half of 2024.
Milestone Revenue
Milestone revenue was $66 million for the nine months ended September 30, 2025 compared to $51 million for the same period in 2024, an increase of $15 million, or 29%, primarily driven by the following:
Nine Months Ended September 30, 2025 milestones:
| | AbbVie milestone of $30 million due to the acceptance for filing of a BLA by the FDA in the third indication of epcoritamab in the U.S. |
| | Janssen milestones of $10 million due to the BLA approval for Talvey in China and $10 million due to the European Commission’s approval of a new indication of DARZALEX formulation as a monotherapy for the treatment of patients with smoldering multiple myeloma (“SMM”), and |
| | Novo Nordisk milestone of $13 million due to the filing of a BLA in the U.S. for Mim8. |
Nine Months Ended September 30, 2024 milestones:
| | AbbVie milestone of $50 million due to the acceptance for filing of a BLA by the FDA in the second indication of epcoritamab in the U.S. |
Milestone revenue may fluctuate significantly from period to period due to both the timing of achievements and the varying amount of each individual milestone under our license and collaboration agreements.
Collaboration Revenue
Collaboration revenue, which reflects 50% of gross profit from net sales of Tivdak in the U.S. by Pfizer, was $54 million for the nine months ended September 30, 2025 compared to $45 million for the same period in 2024. The increase of $9 million, or 20%, primarily driven by an increase in net sales by Pfizer in the U.S. of Tivdak, which was approved in April 2024.
118
Net Product Sales
Genmab’s net product sales include sales of EPKINLY in the U.S. and Japan and Tivdak in Japan and Germany. Global net product sales of EPKINLY/TEPKINLY were $333 million in the first nine months ended September 30, 2025 compared to $203 million for the same period in 2024, an increase of $130 million or 64%, driven by strong growth in 3L+ DLBCL and the expansion to address a second indication, 3L+ FL, which was approved in the U.S. in June 2024. Net product sales of EPKINLY in the U.S. and Japan recorded by Genmab were $272 million in the first nine months of 2025 compared to $179 million in the first nine months of 2024. EPKINLY was approved in the U.S. in May 2023 and in Japan in September 2023.
Net sales of TEPKINLY in territories where Genmab receives royalty revenue were $61 million in the first nine months ended September 30, 2025 compared to $24 million for the same period in 2024.
Net product sales of Tivdak by Genmab were $8 million in the first nine months ended September 30, 2025 with no net product sales for the same period in 2024. Tivdak was approved in Japan in May 2025 and became available for prescribing in Germany in September 2025.
Refer to Note 3 of the Genmab Unaudited Interim Condensed Consolidated Financial Statements included in this offering memorandum for further details about revenue.
Cost of Product Sales
Genmab recognized cost of product sales of $157 million for the nine months ended September 30, 2025 compared to $95 million for the same period in 2024. Cost of product sales includes product costs, royalty expense and profit-sharing amounts payable to AbbVie. The profit-sharing amount paid to AbbVie related to EPKINLY was $128 million for the nine months ended September 30, 2025 compared to $86 million for the same period in 2024.
Research and Development Expenses
Research and development expenses amounted to $1,080 million in the first nine months of 2025 compared to $1,032 million in the first nine months of 2024. The increase of $48 million, or 5%, was driven by the addition of ProfoundBio related research and development expenses, primarily Rina-S, and the increase in team members to support the continued expansion of our product portfolio. The acquisition of ProfoundBio occurred in the second quarter of 2024 and therefore there were minimal ProfoundBio related research and development expenses during the first nine months of 2024. These increases were partly offset by decreased research and development expenses related to Epcoritamab under our collaboration with AbbVie, primarily due to lower chemistry, manufacturing and controls (“CMC”) costs in the first nine months of 2025 compared to the first nine months of 2024.
Research and development expenses accounted for 72% of total research and development expenses & selling, general and administrative expenses in the first nine months of 2025 compared to 74% in the first nine months of 2024.
Selling, General and Administrative Expenses
Selling, general and administrative expenses were $418 million for the nine months ended September 30, 2025 compared to $370 million in the same period in 2024. The increase from the nine months ended September 30, 2024 to the same period in 2025 of $48 million, or 13%, was driven primarily by the expansion of Genmab’s global commercialization capabilities, primarily associated with the expansion of epcoritamab and investment in commercialization related activities related to the anticipated launch of Rina-S.
119
Selling, general and administrative expenses accounted for 28% of total research and development expenses and selling, general and administration expenses for the nine months ended September 30, 2025 compared to 26% in the same period in 2024.
Acquisition and Integration Related Charges
Acquisition and integration related charges for the acquisition of ProfoundBio were $39 million in the first nine months of 2024. There were $0 million acquisition and integration related charges in the first nine months of 2025.
Refer to Note 5.5 of the Genmab Consolidated Financial Statements and Note 2 to the Genmab Unaudited Interim Condensed Consolidated Financial Statements included in this offering memorandum for further details about the acquisition of ProfoundBio.
Operating Profit
Operating profit was $1,007 million for the nine months ended September 30, 2025 compared to $662 million for the same period in 2024, an increase of $345 million, or 52%.
Financial Income and Expense
Financial income and expense was comprised of the following:
| Nine Months Ended September 30, | ||||||||
| ($ million) | 2025 | 2024 | ||||||
| Financial income: |
||||||||
| Interest and other financial income |
$ | 90 | $ | 112 | ||||
| Gain on marketable securities |
87 | 139 | ||||||
| Gain on other investments, net |
— | 5 | ||||||
| Foreign exchange rate gain |
135 | 72 | ||||||
|
|
|
|
|
|||||
| Total financial income |
$ | 312 | $ | 328 | ||||
|
|
|
|
|
|||||
| Financial expenses: |
||||||||
| Interest and other financial expenses |
$ | (17 | ) | $ | (10 | ) | ||
| Loss on marketable securities |
(24 | ) | (131 | ) | ||||
| Loss on other investments, net |
(1 | ) | — | |||||
| Foreign exchange rate loss |
(128 | ) | (40 | ) | ||||
|
|
|
|
|
|||||
| Total financial expenses |
$ | (170 | ) | $ | (181 | ) | ||
|
|
|
|
|
|||||
| Net Financial Items |
$ | 142 | $ | 147 | ||||
Interest and Other Financial Income
Interest and other financial income was $90 million for the nine months ended September 30, 2025 compared to $112 million for the same period in 2024. The decrease of $22 million, or 20%, from the nine months ended September 2024 to the same period in 2025 was primarily driven by lower average cash and cash equivalents and marketable securities as a result of the ProfoundBio acquisition in the second quarter of 2024, as well as lower interest rates on USD denominated marketable securities in the first nine months of 2025 compared to the first nine months of 2024.
120
Foreign Exchange Rate Gains and Losses
Foreign exchange rate gain, net, which excludes foreign exchange rate movements on marketable securities, was $7 million in the first nine months of 2025 compared to foreign exchange rate gain, net of $32 million in the first nine months of 2024. The decrease in foreign exchange rate gain, net is primarily driven by a lower foreign exchange rate impact due to the change in functional currency of Genmab from DKK to USD on January 1, 2025.
Marketable Securities Gains and Losses
Gain on marketable securities, net was $63 million for the nine months ended September 30, 2025 compared to $8 million for the same period in 2024. The increase was primarily driven by the change in the functional currency of Genmab A/S effective January 1, 2025. As the majority of Genmab’s investment portfolio is denominated in U.S. dollars, these securities were adversely affected by the weakening of the USD against the DKK during the first nine months of 2024. In contrast, during the first nine months of 2025, Genmab’s DKK and EUR denominated securities benefited from the strengthening of those currencies against the USD, resulting in a higher overall gain on marketable securities.
Refer to Note 6 of the Genmab Unaudited Interim Condensed Consolidated Financial Statements included in this offering memorandum for further details regarding net financial items.
Corporate Tax
Corporate tax expense was $217 million for the nine months ended September 30, 2025 compared to $228 million for the same period in 2024. The decrease in corporate tax expense is primarily the result of Genmab’s lower estimated annual effective tax rate in the first nine months of 2025 of 18.9% compared to 28.1% in the first nine months of 2024.
Net Profit
Net profit for nine months ended September 30, 2025 was $932 million compared to $581 million for the same period in 2024. The changes in net profit between the periods were driven by the items described above.
Results of Operations for the Year Ended December 31, 2024 and 2023
The following table sets forth our results of operations for the periods presented.
| Year Ended December 31, | ||||||||
| ($ million) | 2024 | 2023 | ||||||
| Revenue |
$ | 3,121 | $ | 2,390 | ||||
| Cost of product sales |
(143 | ) | (33 | ) | ||||
| Research and development expenses |
(1,414 | ) | (1,107 | ) | ||||
| Selling, general and administrative expenses |
(549 | ) | (478 | ) | ||||
| Acquisition and integration related charges |
(43 | ) | — | |||||
|
|
|
|
|
|||||
| Total costs and operating expenses |
$ | (2,149 | ) | $ | (1,618 | ) | ||
|
|
|
|
|
|||||
| Operating profit |
$ | 972 | $ | 772 | ||||
|
|
|
|
|
|||||
| Financial income |
645 | 299 | ||||||
| Financial expense |
(291 | ) | (254 | ) | ||||
|
|
|
|
|
|||||
| Net profit before tax |
$ | 1,326 | $ | 817 | ||||
|
|
|
|
|
|||||
| Corporate Tax |
(193 | ) | (186 | ) | ||||
|
|
|
|
|
|||||
| Net Profit |
$ | 1,133 | $ | 631 | ||||
121
Revenue
Genmab’s revenue was $3,121 million in 2024 compared to $2,390 million in 2023. The increase of $731 million, or 31%, was primarily driven by higher DARZALEX and Kesimpta royalties achieved under our collaborations with J&J and Novartis, respectively. Increased EPKINLY net product sales, driven by a strong product launch in 2023 with a full year of net sales in 2024, also contributed to increased revenue in 2024.
| Year Ended December 31, | ||||||||||||||||
| ($ million) | 2024 | 2023 | ||||||||||||||
| Royalties |
$ | 2,517 | 80 | % | $ | 1,989 | 83 | % | ||||||||
| Reimbursement Revenue |
144 | 5 | % | 124 | 5 | % | ||||||||||
| Milestone Revenue |
145 | 5 | % | 171 | 7 | % | ||||||||||
| Collaboration Revenue |
62 | 2 | % | 45 | 2 | % | ||||||||||
| Net Product Sales |
253 | 8 | % | 61 | 3 | % | ||||||||||
| License Revenue |
— | — | % | — | — | % | ||||||||||
|
|
|
|
|
|
|
|
|
|||||||||
| Total revenue |
$ | 3,121 | 100 | % | $ | 2,390 | 100 | % | ||||||||
|
|
|
|
|
|
|
|
|
|||||||||
Royalties
Royalty revenue amounted to $2,517 million in 2024 compared to $1,989 million in 2023. The increase of $528 million, or 27%, was primarily driven by higher DARZALEX and Kesimpta royalties achieved under our daratumumab collaboration with J&J and ofatumumab collaboration with Novartis, respectively. The table below summarizes Genmab’s royalty revenue by product.
| Year Ended December 31, | ||||||||
| ($ million) | 2024 | 2023 | ||||||
| DARZALEX |
2,019 | 1,635 | ||||||
| Kesimpta |
323 | 217 | ||||||
| TEPEZZA |
106 | 102 | ||||||
| Other |
69 | 35 | ||||||
|
|
|
|
|
|||||
| Total royalties |
$ | 2,517 | $ | 1,989 | ||||
|
|
|
|
|
|||||
DARZALEX
J&J’s net sales of DARZALEX were $11,670 million in 2024 compared to $9,744 million in 2023. The increase from 2023 to 2024 of $1,926 million, or 20%, was driven by share gains in all regions.
Royalty revenue on net sales of DARZALEX was $2,019 million in 2024 compared to $1,635 million in 2023, an increase of $384 million.
The percentage increase in royalties of 23% from 2023 to 2024 is higher than the percentage increase in the underlying net sales of 20% primarily due to a higher effective royalty rate for 2024 and other positive foreign exchange rate impacts, partially offset by the increase in Genmab’s Halozyme royalty reductions in connection with the increase in SC product net sales and an increase in royalty reductions on net sales in countries and territories where there is no Genmab patent coverage as well as lower average exchange rate between the USD and DKK in 2024. Under our license agreement with Janssen for DARZALEX, for purposes of calculating royalties due to Genmab, DARZALEX net sales for non-U.S. dollar denominated currencies are translated to U.S. dollars at a specified annual Currency Hedge Rate. This contractual arrangement is the driver for the other foreign exchange impacts discussed elsewhere in this offering memorandum.
122
Kesimpta
Novartis’ net sales of Kesimpta were $3,224 million in 2024 compared to $2,171 million in 2023. The increase of $1,053 million from 2023 to 2024, or 49%, was primarily driven by increased demand and strong access.
Royalty revenue on net sales of Kesimpta was $323 million in 2024 compared to $217 million in 2023, an increase of $106 million, or 49%.
TEPEZZA
Amgen’s net sales of TEPEZZA were $1,851 million in 2024 compared to $1,771 million in 2023. Royalty revenue on net sales of TEPEZZA was $106 million in 2024 compared to $102 million in 2023, an increase of $4 million, or 4%.
Other royalties
Other royalties consist of royalties from net sales of RYBREVANT, TECVAYLI, TALVEY and TEPKINLY.
J&J was granted FDA approval for RYBREVANT during the second quarter of 2021, and Genmab subsequently started recognizing royalties on net sales of RYBREVANT. Royalties were not material for 2024 or 2023.
J&J was granted conditional approval for TECVAYLI for the treatment of relapsed or refractory multiple myeloma during the third quarter of 2022 in Europe and approval in the fourth quarter of 2022 in the U.S. Royalties were not material for 2024 or 2023.
During the third quarter of 2023, J&J was granted approval in the U.S. and conditional approval in Europe for TALVEY for the treatment of relapsed or refractory multiple myeloma. Royalties were not material for 2024 or 2023.
The EC granted conditional marketing authorization for TEPKINLY as a monotherapy for the treatment of adult patients with relapsed or refractory DLBCL after two or more lines of systemic therapy during the third quarter of 2023. Royalties from AbbVie, related to European net sales, were not material for 2024 or 2023.
Royalty revenue fluctuations from period to period are driven by the level of product net sales, foreign currency exchange rate movements and more specifically to DARZALEX, the contractual arrangement related to annual Currency Hedge Rate, Genmab’s share of J&J’s royalty payments to Halozyme in connection with SC product net sales and royalty deductions on net sales in countries and territories where there is no patent protection.
Reimbursement Revenue
Reimbursement revenue, mainly comprised of the reimbursement of certain research and development costs related to the development work under Genmab’s collaboration agreements, amounted to $144 million in 2024 compared to $124 million in 2023. The increase of $20 million, or 16%, from 2023 to 2024 was primarily driven by higher activities under our collaboration agreements with BioNTech for DuoBody-CD40x4-1BB and acasunlimab, prior to Genmab assuming full ownership, as well as by higher activities under our collaboration agreement with Pfizer for Tivdak.
123
Milestone Revenue
Milestone revenue was $145 million in 2024 compared to $171 million in 2023, a decrease of $26 million, or 15%, primarily driven by the following:
2024 milestones:
| | Novartis milestone of $84 million (DKK 582 million) driven by worldwide net sales for Kesimpta, first exceeding $2.5 billion (DKK 17.4 billion) in 2024, and |
| | AbbVie milestone of $50 million due to the acceptance for filing of a BLA by the U.S. FDA in the second indication of epcoritamab in the U.S. |
2023 milestones:
| | AbbVie milestone of $50 million driven by the first commercial sale of EPKINLY in the U.S., |
| | AbbVie milestone of $30 million due to the acceptance of the marketing authorization application (MAA) filing by the EMA of the type II variation for marketing authorization of TEPKINLY, |
| | AbbVie milestone of $25 million due to the first commercial sale of TEPKINLY in Europe, and |
| | J&J milestone of $25 million related to the BLA approval in the U.S. for talquetamab. |
Milestone revenue may fluctuate significantly from period to period due to both the timing of achievements and the varying amount of each individual milestone under our license and collaboration agreements.
Collaboration Revenue
Collaboration revenue, which reflects 50% of gross profit from net sales of Tivdak in the U.S. by Pfizer, was $62 million in 2024 compared to $45 million in 2023. The increase of $17 million, or 38%, from 2023 to 2024 was primarily driven by increased sales of Tivdak.
Net Product Sales
Global net sales of EPKINLY/TEPKINLY were $281 million in 2024. Net product sales in the U.S. and Japan by Genmab were $253 million in 2024 compared to $61 million in 2023. EPKINLY was approved in the U.S. in May 2023 and in Japan in September 2023.
Net sales of TEPKINLY in territories where Genmab receives royalty revenue were $28 million in 2024, with immaterial net sales in 2023 due to regulatory approvals in such territories not occurring until late 2023.
Refer to Note 2.1 of the Genmab Consolidated Financial Statements included in this offering memorandum for further details about revenue.
Cost of Product Sales
Genmab recognized cost of product sales of $143 million in 2024 compared to $33 million in 2023. Cost of product sales related to EPKINLY sales is primarily comprised of profit-sharing amounts payable to AbbVie of $122 million in 2024 compared to $28 million in 2023, as well as product costs. Aside from these items, there are no other costs included within cost of product sales.
Refer to Notes 2.3, 3.5 and 5.6 of the Genmab Consolidated Financial Statements in this offering memorandum for further details about cost of product sales.
124
Research and Development Expenses
Research and development expenses amounted to $1,414 million in 2024 compared to $1,107 million in 2023. The increase from 2023 to 2024 of $307 million, or 28%, was driven by the increased and accelerated advancement of epcoritamab under our collaboration with AbbVie, the addition of ProfoundBio related research and development expenses, primarily Rina-S, advancement of acasunlimab and DuoBody- CD40x4-1BB under our collaboration with BioNTech, further progression of pipeline products, and the increase in team members to support the continued expansion of our product portfolio.
Research and development costs accounted for 72% of total research and development expenses and selling, general and administration expenses in 2024 compared to 70% in 2023.
The following table provides information regarding our research and development expenses for 2024 as compared to 2023.
| December 31, | Percentage Change |
|||||||||||
| ($ million) | 2024 | 2023 | ||||||||||
| Research(1) |
$ | 310 | $ | 219 | 42 | % | ||||||
| Development and contract manufacturing(2) |
516 | 337 | 53 | % | ||||||||
| Clinical(3) |
478 | 476 | — | % | ||||||||
| Other(4) |
110 | 75 | 47 | % | ||||||||
|
|
|
|
|
|
|
|||||||
| Total research and development expenses |
$ | 1,414 | $ | 1,107 | 28 | % | ||||||
|
|
|
|||||||||||
| (1) | Research expenses include, among other things, personnel, occupancy and laboratory expenses, technology access fees associated with identification of new monoclonal antibodies (mAbs), expenses associated with the development of new proprietary technologies and research activities associated with our product candidates, such as in vitro and in vivo studies, translational research, and IND enabling toxicology studies. |
| (2) | Development and contract manufacturing expenses include personnel and occupancy expenses, external contract manufacturing costs for the scaleup and pre-approval manufacturing of drug product used in research and our clinical trials, costs for drug product supplied to our collaborators, costs related to preparation for the production of process validation batches to be used in potential future regulatory submissions, quality control and assurance activities, and storage and shipment of our product candidates. |
| (3) | Clinical expenses include personnel, travel, occupancy costs, and external clinical trial costs including contract research organizations (CROs), investigator fees, clinical site fees, contractors and regulatory activities associated with conducting human clinical trials. |
| (4) | Other research and development expenses primarily include share-based compensation, depreciation, amortization and impairment expenses. |
125
The following table shows third-party costs incurred for research, contract manufacturing of our product candidates and clinical and regulatory services for 2024 as compared to 2023. The table also presents unallocated costs and overhead consisting of third-party costs for our preclinical stage programs, personnel, facilities, and other indirect costs not directly charged to development programs.
| December 31, | Percentage Change |
|||||||||||
| ($ million) | 2024 | 2023 | ||||||||||
| Epcoritamab |
$ | 414 | $ | 192 | 116 | % | ||||||
| Rina-S |
46 | — | N/A | |||||||||
| Tisotumab vedotin |
38 | 41 | (7 | )% | ||||||||
| Acasunlimab |
102 | 80 | 28 | % | ||||||||
| DuoBody-CD40x4-1BB |
75 | 59 | 27 | % | ||||||||
| Other clinical stage programs |
73 | 109 | (33 | )% | ||||||||
|
|
|
|
|
|
|
|||||||
| Total third-party costs for clinical stage programs |
$ | 748 | $ | 481 | 56 | % | ||||||
|
|
|
|
|
|
|
|||||||
| Preclinical projects |
216 | 164 | 32 | % | ||||||||
| Personnel, unallocated costs and overhead |
450 | 462 | (3 | )% | ||||||||
|
|
|
|
|
|
|
|||||||
| Total research and development expenses |
$ | 1,414 | $ | 1,107 | 28 | % | ||||||
|
|
|
|
|
|
|
|||||||
Third-party costs for epcoritamab increased by $222 million, or 116%, in 2024 as compared to 2023, primarily due to the advancement and acceleration of the epcoritamab program under Genmab’s collaboration with AbbVie.
Third-party costs for Rina-S were $46 million in 2024. Rina-S was acquired through the acquisition of ProfoundBio in the second quarter of 2024.
Third-party costs for tisotumab vedotin decreased by $3 million, or 7%, in 2024 as compared to 2023, primarily due to the completion of certain clinical study activities in 2024.
Third-party costs for acasunlimab increased by $22 million, or 28%, in 2024 as compared to 2023, primarily due to the continued advancement of the program, which Genmab obtained sole ownership during the third quarter of 2024.
Third-party costs for DuoBody-CD40x4-1BB increased by $16 million, or 27%, in 2024 as compared to 2023, primarily due to the continued advancement and expansion of the program under Genmab’s collaboration with BioNTech.
Third-party costs for Genmab’s other clinical stage programs decreased by $36 million, or 33%, in 2024 as compared to 2023, primarily related to advancements of DuoBody-CD3xB7H4 and DuoBody-CD3xCD30 in 2024.
Research and development expenses related to our preclinical projects increased by $52 million, or 32%, in 2024 as compared to 2023, driven by the continued investment in new and existing preclinical programs. An IND was submitted for DuoBody-FAPaxDR4 and a CTA was submitted for GEN1078.
Personnel, unallocated costs and overhead decreased by $12 million, or 3%, in 2024 as compared to 2023, primarily due to travel costs, which were higher in 2023 due to the upcoming launch of EPKINLY in 2023. Our research and development full time equivalents increased from 1,541 at the end of 2023 to 1,886 at the end of 2024.
Refer to Note 2.3, 3.1, 3.2 and 5.5 of the Genmab Consolidated Financial Statements included in this offering memorandum for further details about staff costs, intangible assets, property and equipment and the acquisition of ProfoundBio.
126
Selling, General and Administrative Expenses
Selling, general and administrative expenses were $549 million in 2024 compared to $478 million in 2023. The increase from 2023 to 2024 of $71 million, or 15%, was driven by the continued expansion of Genmab’s commercialization capabilities through the increase in team members to support the continued launch of EPKINLY in the U.S. and Japan in 2023, and the investment in Genmab’s broader organizational capabilities. Selling, general and administration expense growth has been moderating during 2024 reflecting a focus on driving efficiency. We continue to increase team members and commercial support in a strategic manner.
$263 million, or 48% of selling, general and administrative expenses in 2024 was related to compensation of Genmab team members associated with selling, general and administrative activities, as compared to $224 million, or 47% in 2023.
Refer to Note 2.3 and 3.2 for further details about staff costs and property and equipment.
Selling, general and administrative expenses accounted for 28% of total research and development expenses and selling, general and administration expenses in 2024 compared to 30% in 2023.
Acquisition and Integration Related Charges
Acquisition and integration related charges for the acquisition of ProfoundBio were $43 million in 2024 compared to $0 million acquisition and integration related charges for 2023 as there were no acquisitions during 2023.
Refer to Note 5.5 of the Genmab Consolidated Financial Statements included in this offering memorandum for further details about the acquisition of ProfoundBio.
Operating Profit
Operating profit was $972 million in 2024 compared to $772 million in 2023, an increase of $200 million, or 26%.
Financial Income and Expense
Financial income and expense was comprised of the following:
| ($ million) | 2024 | 2023 | ||||||
| Financial income: |
||||||||
| Interest and other financial income |
144 | 142 | ||||||
| Gain on marketable securities |
237 | 157 | ||||||
| Gain on other investments |
6 | — | ||||||
| Foreign exchange rate gain |
258 | — | ||||||
|
|
|
|
|
|||||
| Total financial income |
645 | 299 | ||||||
|
|
|
|
|
|||||
| Financial expenses: |
||||||||
| Interest and other financial expenses |
(18 | ) | (10 | ) | ||||
| Loss on marketable securities |
(107 | ) | (174 | ) | ||||
| Loss on other investments |
— | (4 | ) | |||||
| Foreign exchange rate loss |
(166 | ) | (66 | ) | ||||
|
|
|
|
|
|||||
| Total financial expenses |
(291 | ) | (254 | ) | ||||
|
|
|
|
|
|||||
| Net financial items |
354 | 45 | ||||||
|
|
|
|
|
|||||
127
Interest and Other Financial Income
Interest and other financial income was $144 million in 2024 compared to $142 million in 2023. The increase of $2 million, or 1% from 2023 to 2024, was primarily driven by the higher cash and cash equivalents and marketable securities in the first half of 2024 compared to 2023, almost entirely offset by lower cash and cash equivalents and marketable securities in the second half of 2024 compared to 2023 as a result of liquidating marketable securities and using cash to purchase ProfoundBio.
Foreign Exchange Rate Gains and Losses
Foreign exchange rate gain, net of $92 million in 2024 compared to the foreign exchange rate loss, net of $66 million in 2023 were primarily driven by foreign exchange movements impacting Genmab’s USD denominated assets (excluding marketable securities) and liabilities; in particular, the USD/DKK foreign exchange rates were as follows for each period:
| December 31, 2024 |
December 31, 2023 |
|||||||
| USD/DKK Foreign Exchange Rates |
7.1429 | 6.7447 | ||||||
| % Increase/(Decrease) |
6 | % | (3 | )% | ||||
Marketable Securities Gains and Losses
Gain on marketable securities, net was $130 million in 2024 compared to loss on marketable securities, net of $17 million in 2023. The net change is a function of increase in marketable securities balances as well as the position of the portfolio in the changing interest rates environment, primarily in the U.S.
Other Investments
Gains on other investments, net were $6 million in 2024, and losses on other investments, net were $4 million in 2023. The net gains and losses in 2024 and 2023 were primarily driven by changes in fair value of Genmab’s investments in certain strategic investment funds.
Refer to Notes 4.2 and 4.5 of the Genmab Consolidated Financial Statements included in this offering memorandum for further details regarding foreign currency risk and net financial items, respectively.
Corporate Tax
Corporate tax expense was $193 million in 2024 compared to $186 million in 2023. Genmab’s estimated annual effective tax rate was 14.6% in 2024 compared to 22.8% in 2023. The decrease from 2023 to 2024 in Genmab’s effective tax rate was primarily due to the integration of ProfoundBio which allowed for the deduction of previously unrecognized deferred tax assets in 2024.
Refer to Note 2.4 of the Genmab Consolidated Financial Statements included in this offering memorandum for additional information regarding the corporate tax, deferred tax assets and deferred tax liabilities including management’s significant judgments and estimates.
Net Profit
Net profit for 2024 was $1,133 million compared to $631 million in 2023. The changes in net profit for the periods were driven by the items described above.
128
Liquidity and Capital Resources
Cash Flows
Cash Flows for the Nine Months Ended September 30, 2025 and 2024
The following table provides information regarding Genmab’s cash flow for the nine months ended September 30, 2025 and 2024.
| Nine Months Ended September 30, | ||||||||
| Cash Flow ($ million) |
2025 | 2024 | ||||||
| Net cash provided by operating activities |
$ | 885 | $ | 737 | ||||
| Net cash (used in) investing activities |
(71 | ) | (1,459 | ) | ||||
| Net cash (used in) financing activities |
(440 | ) | (564 | ) | ||||
|
|
|
|
|
|||||
| Increase (decrease) in cash and cash equivalents |
$ | 374 | $ | (1,286 | ) | |||
| Exchange rate adjustments |
$ | 7 | $ | 34 | ||||
Net cash provided by operating activities is primarily related to our operating profit, changes in operating assets and liabilities, reversal of net financial items, and adjustments related to non-cash transactions. The $148 million increase in net cash provided by operating activities is primarily driven by a $340 million increase in net profit before tax and a $69 million increase related to changes in receivables and other current assets, partly offset by an increase in corporate taxes paid of $268 million.
Net cash used in investing activities primarily reflects differences between the proceeds received from the sale and maturity of our investments and amounts invested, and the cash paid for investments in tangible and intangible assets. The $1,388 million decrease in net cash used in investing activities is primarily driven by the acquisition of ProfoundBio during the second quarter of 2024.
Net cash used in financing activities is primarily related to the purchase of treasury shares, exercise of warrants, lease payments, and payment of withholding taxes on behalf of employees on net settled RSUs. The $124 million decrease in net cash used in financing activities between the periods is primarily driven by $130 million decreased cash paid for the purchase of treasury shares during the first nine months of 2025 compared to the first nine months of 2024 due to the timing of share repurchases. This decrease was partly offset by lower proceeds from the exercise of warrants of $2 million, with $16 million received in the first nine months of 2025 as compared to $18 million in the first nine months of 2024.
Exchange rate adjustments represent foreign currency gains or losses on Genmab’s cash and cash equivalents.
Cash Flows for the Years ended December 31, 2024 and 2023
The following table provides information regarding Genmab’s cash flow for the year ended December 31, 2024 and 2023.
| Cash Flow ($ million) |
2024 | 2023 | ||||||
| Net cash provided by operating activities |
$ | 1,126 | $ | 1,071 | ||||
| Net cash (used in) investing activities |
(1,447 | ) | (185 | ) | ||||
| Net cash (used in) financing activities |
(566 | ) | (89 | ) | ||||
|
|
|
|
|
|||||
| Increase in cash and cash equivalents |
$ | (887 | ) | $ | 797 | |||
| Exchange rate adjustments |
$ | 63 | $ | (12 | ) | |||
129
Net cash provided by operating activities is primarily related to our operating profit, changes in operating assets and liabilities, reversal of net financial items, and adjustments related to non-cash transactions. Net cash provided by operating activities increased in 2024 compared to 2023 primarily driven by an increase in net profit before tax of $509 million, an increase in non-cash transactions of $54 million, and a decrease in taxes paid of $105 million in 2024 compared to 2023, partly offset by significant AbbVie milestones achieved during the fourth quarter of 2022 with related cash received during 2023 and an increase in DARZALEX royalty receivables in the fourth quarter of 2024 compared to the fourth quarter of 2023.
Net cash (used in) investing activities primarily reflects cash used in making acquisitions, differences between the proceeds received from the sale and maturity of our investments and amounts invested, and the cash paid for investments in tangible and intangible assets. The increase from 2023 to 2024 in net cash (used in) investing activities is primarily driven by the acquisition of ProfoundBio.
Net cash (used in) financing activities is primarily related to the purchase of treasury shares, exercise of warrants, lease payments, and payment of withholding taxes on behalf of employees on net settled RSUs. The increase from 2023 to 2024 in net cash (used in) financing activities is primarily driven by cash payments for the purchase of treasury shares of $560 million in 2024 compared to $81 million in 2023.
Exchange rate adjustments represent foreign currency gains or losses on Genmab’s cash and cash equivalents, primarily driven by our cash and cash equivalents holdings denominated in USD. The USD/DKK foreign exchange rate increased 6% in 2024, decreased 3% in 2023.
Cash, Cash Equivalents and Marketable Securities
| September 30, | ||||||||
| ($ million) |
2025 | 2024 | ||||||
| Marketable securities |
$ | 1,650 | $ | 1,648 | ||||
| Cash and cash equivalents |
1,761 | 952 | ||||||
As of September 30, 2025, cash and cash equivalents and marketable securities denominated in USD represented 87% of Genmab’s total cash and cash equivalents and marketable securities compared to 80% of September 30, 2024.
Marketable securities are invested in highly secure and liquid investments with short effective maturities. As of September 30, 2025, 70% of Genmab’s marketable securities were long-term A rated or higher, or short-term rated A-1 / P-1 by S&P, Moody’s or Fitch compared to 70% as of September 30, 2024.
As of September 30, 2025, $1,761 million was held as cash and cash equivalents, and $1,650 million was held as liquid investments in short-term government and other debt instruments compared to $952 million held as cash and cash equivalents and $1,648 million held as liquid investments in short-term government and other debt instruments as of September 30, 2024.
Cash and cash equivalents included short-term marketable securities of $140 million at the end of September 2025. In accordance with Genmab’s accounting policy, securities purchased with a maturity of less than 90 days at the date of acquisition are classified as cash and cash equivalents.
Liquidity and Capital Resources Following the Acquisition
Funding of the Acquisition
We expect that the Transactions will require total cash in U.S dollars of approximately $8,395 million, which will be used to fund the Acquisition and to pay fees and expenses associated with the Transactions. We
130
expect the cash requirements of the Transactions to be financed through the net proceeds from the issuance of the notes offered hereby, together with borrowings under the Term Credit Facilities, as well as our cash on hand, including cash from the sale of substantially all of our marketable securities. See “Use of Proceeds” for more information.
Debt
Currently, we have $0 million in debt as of September 30, 2025. Following consummation of the Transactions, our long-term debt will consist of the notes and indebtedness under the Term Credit Facilities. In connection with this offering, we will also enter into the New Revolving Facility, which we do not expect to draw in connection with the Transactions.
We are seeking consent under the Existing Credit Agreement to permit the consummation of this offering. If this consent is obtained, we expect to terminate the Existing Credit Agreement at the Acquisition Closing Date. If this consent is not obtained, we will terminate the Existing Credit Agreement on the date of the settlement of this offering.
On a pro forma basis giving effect to the Transactions, as of September 30, 2025, we would have had outstanding $5,263 million in aggregate indebtedness for borrowed money, including the Term Credit Facilities and the Notes offered hereby. On a pro forma basis giving effect to the Transactions, assuming the blended interest rate used in the presentation of our pro forma financial statements included elsewhere in this offering memorandum, our cash interest expense would have been $423 million for the twelve months ended December 31, 2024 and $321 million for the nine months ended September 30, 2025.
From time to time, depending upon market and other conditions, as well as upon our cash balances and liquidity, we may acquire our outstanding debt securities or our other indebtedness through open market purchases, privately negotiated transactions, tender offers, redemption or otherwise, upon such terms and at such prices as we may determine, for cash or other consideration.
For additional information regarding our material indebtedness upon the completion of the Transactions, see “Summary—The Transactions,” “Description of Other Indebtedness”, “Description of the Unsecured Notes” and “Description of the Secured Notes”
Liquidity
Prior to consummation of the Transactions, we will require cash to meet our operating expenses and capital expenditures. We have funded our cash requirements since inception, including through September 30, 2025, primarily with royalty and milestone payments from our partners, upfront payments, and equity financing. We expect to continue to fund a significant portion of our development costs for proprietary product candidates as well as commercialization activities prior to consummation of the Transactions with cash received from royalties and milestone payments from partners, and net sales of Genmab products.
After the consummation of the Transactions, our primary sources of liquidity will be cash received from royalties and milestone payments from partners and net sales of our products, our remaining cash, cash equivalents and marketable securities, and our New Revolving Facility, which will permit aggregate borrowings of up to $500 million. Our primary uses of cash after the consummation of the Transactions will be our development costs for our proprietary product candidates, commercialization activities, capital expenditures and debt service obligations.
Based on our current level of operations, our available cash, cash equivalents and marketable securities, we believe our cash flows from operating activities, combined with availability under the New Revolving Facility, will provide sufficient liquidity to fund our development and commercialization activities, current obligations,
131
projected working capital requirements, debt service requirements and capital spending requirements over the next twelve months and the foreseeable future.
Our expenditures on current and future preclinical and clinical development programs are subject to numerous uncertainties in timing and cost to completion. In order to advance our product candidates toward commercialization, the product candidates are tested in numerous preclinical safety, toxicology and efficacy studies. Genmab then conducts clinical trials for those product candidates that take several years or more to complete. The length of time varies substantially based upon the type, complexity, novelty and intended use of a product candidate. The cost of clinical trials may vary significantly over the life of a project as a result of a variety of factors, including: the number of patients required in the clinical trials; the length of time required to enroll trial participants; the number and location of sites included in the trials; the costs of producing supplies of the product candidates needed for clinical trials and regulatory submissions; the safety and efficacy profile of the product candidate; the use of CROs to assist with the management of the trials; and the costs and timing of, and the ability to secure, regulatory approvals.
Our expenses also fluctuate from period to period based on the degree of activities with collaborative partners, timing of manufacturing campaigns, numbers of patients enrolled in clinical trials and the outcome of each clinical trial event. As a result, we are unable to determine with any degree of certainty the anticipated completion dates, duration and completion costs of research and development projects, or when and to what extent we will receive cash inflows from the commercialization and sale of any product candidates. We also cannot predict the actual amount or timing of future royalties and milestone payments, and these may differ from estimates.
We expect to increase operating expenditures and make additional capital outlays over the next several years as we support preclinical development, manufacturing, clinical trial activities, product collaborations, commercialization activities and additional hiring of staff. The adequacy of our available funds will depend on many factors, including the level of DARZALEX and other royalty streams, progress in our research and development programs, the magnitude of those programs, our commitments to existing and new clinical collaborators, our ability to establish commercial and licensing arrangements, our capital expenditures, market developments, and any future acquisitions. Accordingly, Genmab may require additional funds and may attempt to raise additional funds through equity or debt financings, collaborative agreements with partners, or from other sources. During the fourth quarter of 2024, Genmab entered into the Existing Credit Agreement. The Existing Credit Agreement is an unsecured three-year revolving credit facility of up to $300 million with a syndicate of lenders. Genmab intends to use the Existing Credit Agreement to finance working capital needs, and for general corporate purposes, of Genmab and its subsidiaries. The Existing Credit Agreement includes options to increase the size of the facility up to $500 million as well as the ability to extend for an additional two years. The Existing Credit Agreement contains certain customary financial covenants. As of December 31, 2024, there were no outstanding amounts due on, nor any usage of, the Existing Credit Agreement and Genmab was in compliance with all financial covenants. We expect to terminate the Existing Credit Agreement prior to or concurrently with the closing of the Acquisition
For a discussion on the impact of the Acquisition, please see “—Key Components of Our Results and Related Trends—Impact of the Acquisition of Merus.”
Please also see Note 9 of the Genmab Unaudited Interim Condensed Consolidated Financial Statements included in this offering memorandum for a description of our lease obligations; and Note 5.6 of the Genmab Consolidated Financial Statements for a description of our contractual obligations related to a number of agreements, primarily related to research and development activities, as well as a description of our contingent commitments under our license and collaboration agreements that may become due for future payments.
In addition to the above obligations, we enter into a variety of agreements and financial commitments in the normal course of business. The terms generally allow us the option to cancel, reschedule and adjust our
132
requirements based on our business needs prior to the delivery of goods or performance of services. It is not possible to predict the maximum potential amount of future payments under these agreements due to the conditional nature of our obligations and the unique facts and circumstances involved in each particular agreement.
Significant Accounting Policies
Refer to Note 1.1 of the Genmab Consolidated Financial Statements and Note 1 of the Genmab Unaudited Interim Condensed Consolidated Financial Statements included in this offering memorandum for information about our significant accounting policies and how estimates are involved in the preparation of our financial statements.
Implementation of New and Revised Standards and Interpretations
For information related to new and revised standards and interpretations, see Note 1.2 to the Genmab Consolidated Financial Statements and Note 1 to the Genmab Unaudited Interim Condensed Consolidated Financial Statements included in this offering memorandum.
Standards and Interpretations Not Yet in Effect
For information related to standards and interpretations not yet in effect, see Note 1.2 to the Genmab Consolidated Financial Statements and Note 1 to the Genmab Unaudited Interim Condensed Consolidated Financial Statements included in this offering memorandum.
Qualitative and Quantitative Disclosures about Market Risks
For information related to qualitative and quantitative disclosures about market risks including foreign currency risk, interest rate risk, and credit risk, see Note 4.2 to the Genmab Consolidated Financial Statements.
133
DESCRIPTION OF CERTAIN OTHER INDEBTEDNESS
The following is a summary of certain provisions of the expected terms of the New Senior Secured Credit Facilities in which the Issuers intend to enter in connection with the Acquisition Closing. The terms and conditions of the New Senior Secured Credit Facilities described herein have not been finalized, and are therefore subject to change. Investors are encouraged not to place undue reliance on such descriptions in deciding to invest in the Notes offered hereby, as changes may be made after the date of this offering memorandum.
In connection with the Acquisition, the Issuers expect to enter into a credit agreement governing the New Senior Secured Credit Facilities with Morgan Stanley Senior Funding Inc., as administrative agent and collateral agent and various financial institutions as lenders thereunder. Merus and its wholly owned subsidiaries are expected to become guarantors under the New Senior Secured Credit Facilities and provide applicable collateral which will be required under the New Senior Secured Credit Facilities after the Back-End Closing.
Maturity and Amortization
The Term Loan A Facility will mature on the fifth anniversary of the Acquisition Closing and amortize in equal quarterly installments in aggregate annual amounts equal to 5.0% of the original principal amount of the Term Loan A Facility, with the balance of the original principal amount of the Term Loan A Facility payable at maturity. The Term Loan B Facility will mature on the seventh anniversary of the Acquisition Closing and amortize in equal quarterly installments in aggregate annual amounts equal to 10% in 2026, 15% in 2027 and 2028, 10% in 2029, and 5% in 2030, 2031, and 2032, in each case, of the original principal amount of the Term Loan B Facility, with the balance of the original principal amount of the Term Loan B Facility payable at maturity. The Revolving Facility will mature, and the commitments thereunder will terminate, on the fifth anniversary of the Acquisition Closing.
Interest
The interest rate on each of the Term Loan A Facility and the Revolving Facility is expected to be based on, at the option of the Issuers, either Term SOFR (as will be defined in New Senior Secured Credit Facilities and subject to a 0% floor) or alternate base rate (subject to a 1% floor), in each case, plus an applicable margin that will initially be fixed and, after the delivery of financial statements for the first full fiscal quarter completed after the Acquisition Closing, will vary based on our first lien secured net leverage ratio. The interest rate on the Term Loan B Facility is expected to be based on, at the option of the Issuers, either Term SOFR (subject to a 0% floor) or alternate base rate (subject to a 1% floor), in each case, plus an applicable margin.
Mandatory Prepayments
Subject to certain important exceptions and thresholds, it is expected that the Issuers will be required to make mandatory prepayments under certain circumstances, with excess cash flow, the net proceeds of asset sales and casualty events (subject to customary reinvestment rights) and the incurrence of indebtedness that is not permitted under the New Senior Secured Credit Facilities.
Voluntary Prepayments
The Issuers may voluntarily repay outstanding loans under the Term Loan A Facility and Term Loan B Facility at any time without prepayment premium or penalty, except in connection with a repricing event in respect of the term loans under the Term Loan B Facility as described below, subject to customary “breakage” costs with respect to loans bearing interest at Term SOFR.
187
It is expected that any refinancing through the issuance of certain debt or any repricing amendment, in either case, that constitutes a “repricing event” applicable to the term loans under the Term Loan B Facility resulting in a lower yield occurring at any time during the first six months after the closing date of the Term Loan B Facility will be accompanied by a 1.00% prepayment premium or fee, as applicable.
Guarantees and Security
The obligations of the Issuers under the New Senior Secured Credit Facilities will be guaranteed, on a joint and several basis, by the Guarantors. The obligations of the Issuers under the New Senior Secured Credit Facilities will be secured, on a joint and several basis, by first-priority liens (subject to permitted liens) on certain of the Issuers’ and the Guarantors’ existing and future assets (subject to certain exclusions and agreed guarantee and security principles in line with customary practices in the relevant jurisdiction), which will rank pari passu with the liens securing the Secured Notes offered hereby pursuant to a customary intercreditor agreement governing relative priority and creditor rights. See “Description of the Secured Notes—Equal Priority Intercreditor Agreement.” On the Acquisition Closing, security jurisdictions will be limited to the U.S., Denmark and the Netherlands.
Representations, Warranties and Covenants
The New Senior Secured Credit Facilities will contain representations and warranties and affirmative covenants that are usual and customary for facilities of this nature and subject to important limitations and exceptions. The New Senior Secured Credit Facilities will also contain customary negative covenants (subject to important limitations and exceptions) that include limitations on indebtedness, liens, asset sales, investments, restricted payments, restricted debt prepayments, affiliate transactions, fundamental changes, material changes in nature of business, negative pledge clauses, and changes to fiscal year. Solely with respect to the Term Loan A Facility and the Revolving Facility, the Issuers will be subject to quarterly-tested maintenance financial covenants that require compliance with a maximum First Lien Secured Net Leverage Ratio (as will be defined in the New Senior Secured Credit Facilities) and a minimum Interest Coverage Ratio (as will be defined in the New Senior Secured Credit Facilities).
Events of Default
The New Senior Secured Credit Facilities will contain customary events of default (subject to important limitations and exceptions), including with respect to non-payment of principal, non-payment of interest and fees subject to a grace period, covenant breaches subject to a grace period for certain covenants, material misrepresentations subject to a grace period for certain representations, cross-defaults to material indebtedness above a materiality threshold, monetary judgments above a materiality threshold, insolvency or bankruptcy events, change of control, certain ERISA (as defined herein) events, and invalidity of a material portion of guarantees or security. If an event of default occurs, the lenders under the New Senior Secured Credit Facilities will be entitled to take various actions, including the acceleration of amounts due under the New Senior Secured Credit Facilities and all actions permitted to be taken by secured creditors.
188