Performance Management - REX FANG & Innovation Equity Premium Income ETF |
Nov. 26, 2025 |
||||||||||||||||||
|---|---|---|---|---|---|---|---|---|---|---|---|---|---|---|---|---|---|---|---|
| Prospectus [Line Items] | |||||||||||||||||||
| Bar Chart and Performance Table [Heading] | PERFORMANCE HISTORY | ||||||||||||||||||
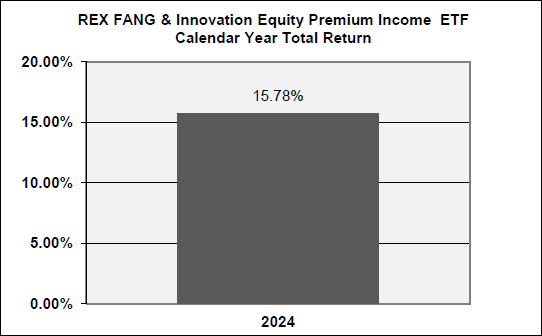
| Performance Narrative [Text Block] | The bar chart and table below provide some indication of the risks of investing in the Fund by showing changes in the Fund’s performance from year to year and by showing the Fund’s average annual returns for certain time periods as compared to a broad measure of market performance. Investors should be aware that past performance before and after taxes is not necessarily an indication of how the Fund will perform in the future.
Updated performance information for the Fund, including its current net asset value per share, is available by calling toll-free at (844) 802-4004.
|
||||||||||||||||||
| Performance Past Does Not Indicate Future [Text] | Investors should be aware that past performance before and after taxes is not necessarily an indication of how the Fund will perform in the future. | ||||||||||||||||||
| Performance Information Illustrates Variability of Returns [Text] | The bar chart and table below provide some indication of the risks of investing in the Fund by showing changes in the Fund’s performance from year to year and by showing the Fund’s average annual returns for certain time periods as compared to a broad measure of market performance. | ||||||||||||||||||
| Bar Chart [Heading] | Annual Total Returns (calendar year ended 12/31) | ||||||||||||||||||
| Bar Chart [Table] |
|
||||||||||||||||||
| Bar Chart Closing [Text Block] | For the period January 1, 2025 through September 30, 2025, the total return for the Fund was 14.28%.
During the periods shown, the highest quarterly return was 7.13% (quarter ended 3/31/2024) and the lowest quarterly return was -0.06% (quarter ended 9/30/2024).
|
||||||||||||||||||
| Year to Date Return, Label [Optional Text] | For the period January 1, 2025 through September 30, 2025, the total return for the Fund | ||||||||||||||||||
| Bar Chart, Year to Date Return | 14.28% | ||||||||||||||||||
| Bar Chart, Year to Date Return, Date | Sep. 30, 2025 | ||||||||||||||||||
| Highest Quarterly Return, Label [Optional Text] | highest quarterly return | ||||||||||||||||||
| Highest Quarterly Return | 7.13% | ||||||||||||||||||
| Highest Quarterly Return, Date | Mar. 31, 2024 | ||||||||||||||||||
| Lowest Quarterly Return, Label [Optional Text] | lowest quarterly return | ||||||||||||||||||
| Lowest Quarterly Return | (0.06%) | ||||||||||||||||||
| Lowest Quarterly Return, Date | Sep. 30, 2024 | ||||||||||||||||||
| Performance Table Heading | Average Annual Returns for Periods Ended December 31, 2024 | ||||||||||||||||||
| Performance [Table] |
|
||||||||||||||||||
| Index No Deduction for Fees, Expenses, or Taxes [Text] | (reflects no deduction for fees, expenses, or taxes) | ||||||||||||||||||
| Performance Availability Phone [Text] | (844) 802-4004 |