Performance Management - Sovereign's Capital Flourish Fund
|
Nov. 28, 2025 |
| Prospectus [Line Items] |
|
| Bar Chart and Performance Table [Heading] |
Performance
|
| Performance Narrative [Text Block] |
The following performance information
indicates some of the risks of investing in the Fund. The table shows the Fund’s average annual total return over time compared
to one or more broad measures of market performance. Both the bar chart and table assume that all dividends and distributions
are reinvested in the Fund. The Fund’s past performance (before and after taxes) may not indicate future results.
Updated performance information is
available on the Fund’s website at http://www.scetfs.com (the website does not form
a part of this prospectus) or at no charge by calling the Fund at 1-800-465-1403.
|
| Performance Past Does Not Indicate Future [Text] |
The Fund’s past performance (before and after taxes) may not indicate future results.
|
| Performance Information Illustrates Variability of Returns [Text] |
The table shows the Fund’s average annual total return over time compared
to one or more broad measures of market performance.
|
| Bar Chart [Heading] |
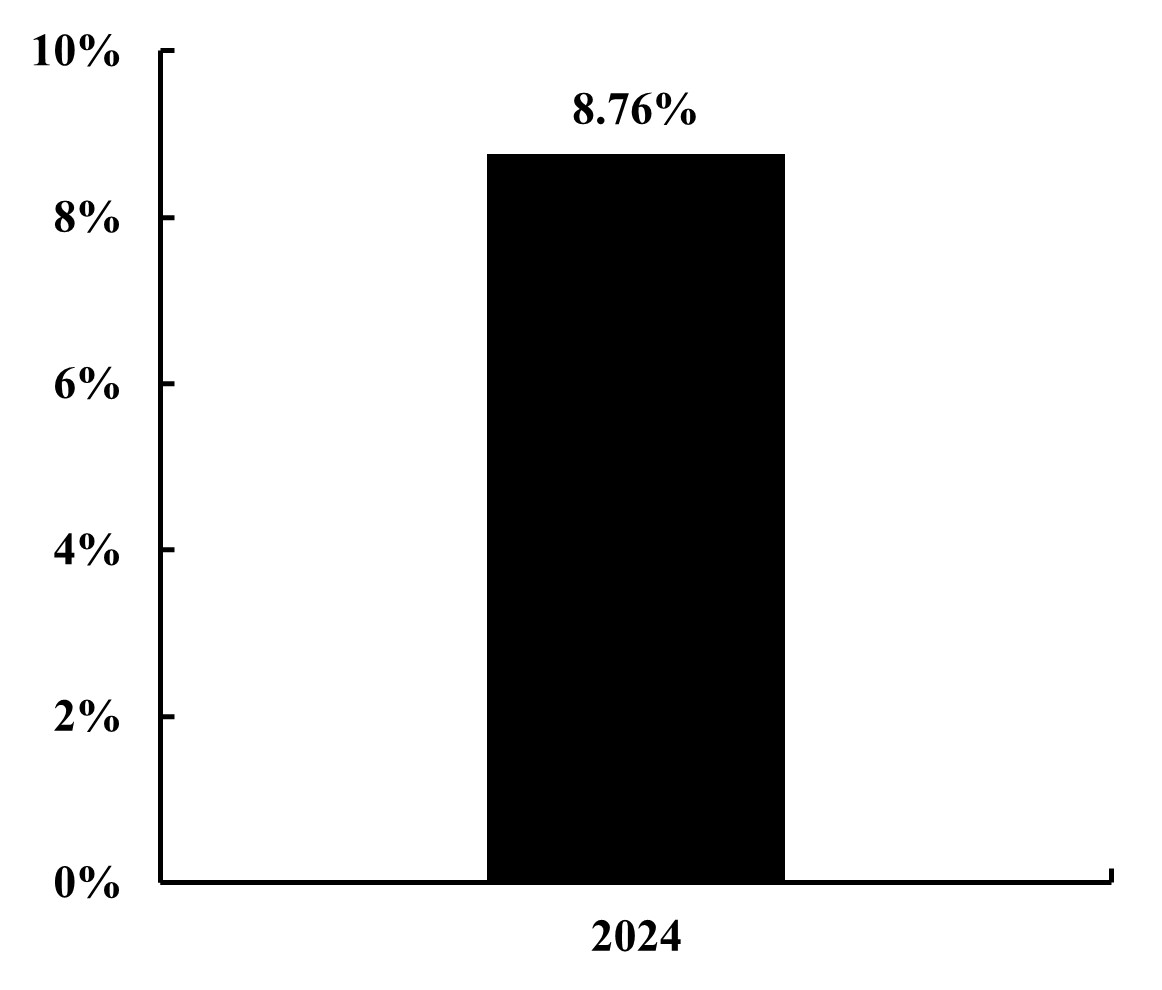
Annual Total Returns (For
the Calendar Years ended 12/31)*
|
| Bar Chart [Table] |
|
| Bar Chart Footnotes [Text Block] |
| * | | The Fund’s 2025 year-to-date total return through September 30, 2025 was -1.46%. |
|
| Bar Chart Closing [Text Block] |
| Best and Worst Quarter Returns (for the period reflected in the bar chart above) |
|
|
| |
Return |
Quarter/Year |
| Highest Return |
6.01% |
Q3/2024 |
| Lowest Return |
-3.70% |
Q2/2024 |
|
| Year to Date Return, Label [Optional Text] |
year-to-date total return
|
| Bar Chart, Year to Date Return |
(1.46%)
|
| Bar Chart, Year to Date Return, Date |
Sep. 30, 2025
|
| Highest Quarterly Return, Label [Optional Text] |
Highest Return
|
| Highest Quarterly Return |
6.01%
|
| Highest Quarterly Return, Date |
Sep. 30, 2024
|
| Lowest Quarterly Return, Label [Optional Text] |
Lowest Return
|
| Lowest Quarterly Return |
(3.70%)
|
| Lowest Quarterly Return, Date |
Jun. 30, 2024
|
| Performance Table Heading |
Average Annual Total Returns as of December
31, 2024
|
| Performance Table Uses Highest Federal Rate |
After-tax returns are calculated using
the historical highest individual federal marginal income tax rates and do not reflect the impact of state and local taxes.
|
| Performance Table Not Relevant to Tax Deferred |
The after-tax return information
shown above does not apply to Fund shares held through tax-deferred or tax-exempt arrangements such as 401(k) plans or individual
retirement accounts (“IRAs”).
|
| Performance [Table] |
|
Average Annual Total Returns as of December
31, 2024
|
|
|
| |
1 Year |
Since Inception
(September 29, 2023) |
| Returns before taxes |
8.76% |
23.50% |
| Returns after taxes on distributions |
8.68% |
23.33% |
| Returns after taxes on distributions and sale of Fund shares |
5.24% |
17.87% |
S&P Composite 1500 Equal Weight Total Return Index
(reflects no deduction for fees, expenses or taxes) |
9.76% |
18.80% |
|
| Index No Deduction for Fees, Expenses, or Taxes [Text] |
(reflects no deduction for fees, expenses or taxes)
|
| Performance Table Closing [Text Block] |
After-tax returns are calculated using
the historical highest individual federal marginal income tax rates and do not reflect the impact of state and local taxes. Actual
after-tax returns depend on your tax situation and may differ from those shown in the preceding table. The after-tax return information
shown above does not apply to Fund shares held through tax-deferred or tax-exempt arrangements such as 401(k) plans or individual
retirement accounts (“IRAs”).
|
| Performance Availability Website Address [Text] |
http://www.scetfs.com
|
| Performance Availability Phone [Text] |
1-800-465-1403
|