The bar chart and performance table below show the variability of the Fund’s returns, which is some indication of the risks of investing in the Fund. The bar chart shows performance of the Fund’s Class I shares for each calendar year since the Fund’s inception. Class A, Class C, and Class R shares, which are not presented in the bar chart, would have similar returns to Class I shares because the classes are invested in the same portfolio of securities and would differ only to the extent that Class A, Class C, and Class R shares have different expenses than Class I shares. Sales loads or account fees are not reflected in the bar chart. If these amounts were reflected, returns would be less than those shown. The performance table compares the performance of the Fund over time to the performance of a broad-based market index. You should be aware that the Fund’s past performance (before and after taxes) may not be an indication of how the Fund will perform in the future. Updated performance information will be available at no cost by visiting www.VGIMFunds.com or by calling 1-844-828-3212.
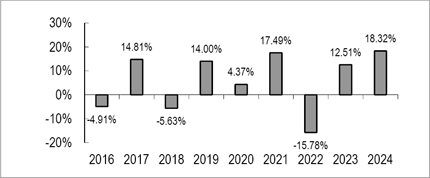
| Highest Quarter: | 12/31/2020 | 10.06% |
| Lowest Quarter: | 12/31/2018 | -12.75% |
The Fund’s year to date return for the period ended September 30, 2025 was: 12.31%
| One
Year |
Five
Years |
Since
Inception(1) | |
| Class I Shares | |||
| Return before taxes | 18.32% | 6.57% | 5.14% |
| Return after taxes on Distributions | 18.32% | 5.78% | 4.61% |
| Return after taxes on Distributions and Sale of Fund Shares | 10.85% | 5.02% | 3.98% |
| Class A Shares | |||
| Return before taxes | 11.27% | 5.08% | 4.25% |
| Class C Shares | |||
| Return before taxes | 17.17% | 5.51% | 4.13% |
| Class R Shares | |||
| Return before taxes | 17.95% | 6.19% | 4.71% |
| S&P
500 Total Return Index(2) (reflects no deduction for fees, expenses or taxes) |
25.02% | 14.53% | 14.68% |
| (1) | The inception date of the Fund is September 9, 2015. |
| (2) | The S&P 500 Total Return Index is an unmanaged free-float capitalization-weighted index which measures the performance of 500 large-cap common stocks actively traded in the United States. Unlike a mutual fund, an index does not reflect any trading costs or management fees. Investors cannot directly invest in an index. |