The investment objective of the fund is to provide you with a way to earn income on your cash reserves while preserving capital and maintaining liquidity. The fund is a government money market fund that seeks to preserve the value of your investment at $1.00 per share.
This table describes the fees and expenses that you may pay if you buy, hold and sell shares of the fund. You may pay other fees, such as brokerage commissions and other fees to financial intermediaries, which are not reflected in the tables and examples below. For example, in addition to the fees and expenses described below, you may also be required to pay brokerage commissions on purchases and sales of Class F-2, F-3, 529-F-2, 529-F-3 or ABLE-F-2 shares of the fund. Upon selling shares of the fund or exchanging those shares for shares of the American Funds, Capital Group KKR Public-Private+ Funds and/or Emerging Markets Equities Fund, Inc. (collectively “Capital Group Funds”), you may qualify for certain sales charge discounts. More information about these and other discounts is available from your financial professional and in the sales charge waiver appendix to this prospectus.
| Shareholder fees (fees paid directly from your investment) | |||||||
| Share class: | A | 529-A and ABLE-A | C and 529-C | 529-E | T and 529-T | All F, 529-F and ABLE-F-2 share classes | All R share classes |
| Maximum sales charge (load) imposed on purchases (as a percentage of offering price) | none | none | none | none | none | none | none |
| Maximum deferred sales charge (load) (as a percentage of the amount redeemed) | none | none | 1.00% | none | none | none | none |
| Maximum sales charge (load) imposed on reinvested dividends | none | none | none | none | none | none | none |
| Redemption or exchange fees | none | none | none | none | none | none | none |
| Annual fund operating expenses (expenses that you pay each year as a percentage of the net asset value of your investment) | ||||||||
| Share class: | A | C | T | F-1 | F-2 | F-3 | 529-A | 529-C |
| Management fees | 0.26% | 0.26% | 0.26% | 0.26% | 0.26% | 0.26% | 0.26% | 0.26% |
| Distribution and/or service (12b-1) fees | 0.13 | 0.24 | 0.00 | 0.24 | none | none | 0.13 | 0.24 |
| Other expenses | 0.10 | 0.11 | 0.10 | 0.15 | 0.12 | 0.04 | 0.15 | 0.16 |
| Total annual fund operating expenses | 0.49 | 0.61 | 0.36 | 0.65 | 0.38 | 0.30 | 0.54 | 0.66 |
| Share class: | 529-E | 529-T | 529-F-1 | 529-F-2 | 529-F-3 | ABLE-A | ABLE-F-2 | R-1 |
| Management fees | 0.26% | 0.26% | 0.26% | 0.26% | 0.26% | 0.26% | 0.26% | 0.26% |
| Distribution and/or service (12b-1) fees | 0.25 | 0.00 | 0.25 | none | none | 0.11 | none | 0.00 |
| Other expenses | 0.14 | 0.15 | 0.21 | 0.15 | 0.09 | 0.14 | 0.14 | 0.10 |
| Total annual fund operating expenses | 0.65 | 0.41 | 0.72 | 0.41 | 0.35 | 0.51 | 0.40 | 0.36 |
| Fee waiver | – | – | – | – | – | 0.05* | 0.05* | – |
| Total annual fund operating expenses after fee waiver | 0.65 | 0.41 | 0.72 | 0.41 | 0.35 | 0.46 | 0.35 | 0.36 |
| Share class: | R-2 | R-2E | R-3 | R-4 | R-5E | R-5 | R-6 | |
| Management fees | 0.26% | 0.26% | 0.26% | 0.26% | 0.26% | 0.26% | 0.26% | |
| Distribution and/or service (12b-1) fees | 0.75 | 0.60 | 0.50 | 0.25 | none | none | none | |
| Other expenses | 0.38 | 0.24 | 0.19 | 0.14 | 0.19 | 0.09 | 0.04 | |
| Total annual fund operating expenses | 1.39 | 1.10 | 0.95 | 0.65 | 0.45 | 0.35 | 0.30 |
* Commonwealth Savers Plan, as program administrator of ABLEAmerica, is currently waiving the fee owed to it as compensation for its oversight and administration of ABLEAmerica. This waiver will be in effect through at least December 1, 2026. Subject to the terms of its contractual arrangement with the investment adviser, Commonwealth Savers Plan may elect to extend, modify or terminate the waiver at that time.
This example is intended to help you compare the cost of investing in the fund with the cost of investing in other mutual funds.
The example assumes that you invest $10,000 in the fund for the time periods indicated and then redeem or hold all of your shares at the end of those periods. The example also assumes that your investment has a 5% return each year and that the fund’s operating expenses remain the same. The example reflects the fee waiver described above through the expiration date of such fee waiver and total annual fund operating expenses thereafter. You may be required to pay brokerage commissions on your purchases and sales of Class F-2, F-3, 529-F-2, 529-F-3 or ABLE-F-2 shares of the fund, which are not reflected in the example.
| Share class: | A | C | T | F-1 | F-2 | F-3 | 529-A | 529-C | 529-E | 529-T |
| 1 year | $50 | $162 | $286 | $66 | $39 | $31 | $55 | $167 | $66 | $291 |
| 3 years | 157 | 195 | 363 | 208 | 122 | 97 | 173 | 211 | 208 | 378 |
| 5 years | 274 | 340 | 447 | 362 | 213 | 169 | 302 | 368 | 362 | 474 |
| 10 years | 616 | 727 | 694 | 810 | 480 | 381 | 677 | 741 | 810 | 755 |
| Share class: | 529-F-1 | 529-F-2 | 529-F-3 | ABLE-A | ABLE-F-2 | R-1 | R-2 | R-2E | R-3 | R-4 |
| 1 year | $74 | $42 | $36 | $47 | $36 | $37 | $142 | $112 | $97 | $66 |
| 3 years | 230 | 132 | 113 | 159 | 123 | 116 | 440 | 350 | 303 | 208 |
| 5 years | 401 | 230 | 197 | 280 | 219 | 202 | 761 | 606 | 525 | 362 |
| 10 years | 894 | 518 | 443 | 636 | 500 | 456 | 1,669 | 1,340 | 1,166 | 810 |
| Share class: | R-5E | R-5 | R-6 | For the share classes listed to the right, you would pay the following if you did not redeem your shares: | Share class: | C | 529-C |
| 1year | $46 | $36 | $31 | 1year | $62 | $67 | |
| 3years | 144 | 113 | 97 | 3years | 195 | 211 | |
| 5years | 252 | 197 | 169 | 5years | 340 | 368 | |
| 10years | 567 | 443 | 381 | 10years | 727 | 741 |
| Share class: | R-5E | R-5 | R-6 | For the share classes listed to the right, you would pay the following if you did not redeem your shares: | Share class: | C | 529-C |
| 1year | $46 | $36 | $31 | 1year | $62 | $67 | |
| 3years | 144 | 113 | 97 | 3years | 195 | 211 | |
| 5years | 252 | 197 | 169 | 5years | 340 | 368 | |
| 10years | 567 | 443 | 381 | 10years | 727 | 741 |
The fund will invest at least 99.5% of its total assets in cash, U.S. Treasury securities and other government securities guaranteed or issued by an agency or instrumentality of the U.S. government, and repurchase agreements that are fully collateralized by cash or government securities. Additionally, at least 80% of the fund’s assets will normally be invested in securities that are issued or guaranteed by the U.S. government, its agencies and instrumentalities, and repurchase agreements that are fully collateralized by government securities.
Repurchase agreements are agreements under which the fund purchases a security from a bank or broker-dealer and obtains a simultaneous commitment from the seller to repurchase the security at a specified time and price. Because the security purchased by the fund constitutes collateral for the seller’s repurchase obligation, a repurchase agreement is effectively a loan by the fund that is collateralized by the security purchased. The fund will only enter into repurchase agreements involving securities of the type (excluding any maturity limitations) in which it could otherwise invest. In practice, the fund expects to enter only into repurchase agreements that are fully collateralized by cash or U.S. government securities.
The fund relies on the professional judgment of its investment adviser to make decisions about the fund’s portfolio investments. The basic investment philosophy of the investment adviser is to seek to provide current income while preserving capital and maintaining liquidity.
The following bar chart shows how the fund’s investment results have varied from year to year, and the following table shows how the fund’s average annual total returns for various periods compare with a broad measure of securities market results and, if applicable, other measures of market results that reflect the fund’s investment universe. This information provides some indication of the risks of investing in the fund. Past investment results are not predictive of future investment results. Prior to October 30, 2020, certain fees, such as 12b-1 fees, were not charged on Class 529-F-1 shares. If these expenses had been deducted, results would have been lower. Updated information on the fund’s investment results can be obtained by visiting capitalgroup.com.
The following bar chart shows how the fund’s investment results have varied from year to year, and the following table shows how the fund’s average annual total returns for various periods compare with a broad measure of securities market results and, if applicable, other measures of market results that reflect the fund’s investment universe.
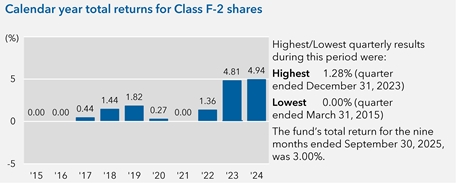
Highest/Lowest quarterly results during this period were:
Highest 1.28% (quarter ended December 31, 2023)
Lowest 0.00% (quarter ended March 31, 2015)
The fund's total return for the nine months ended September 30, 2025, was 3.00%.
| Average annual total returns For the periods ended December 31, 2024: | ||||||
| Share classes (before taxes) | Inception date | 1 year | 5 years | 10 years | Lifetime | |
| A | 5/1/2009 | 4.80% | 2.20% | 1.48% | 0.94% | |
| C | 5/1/2009 | 3.68 | 2.15 | 1.46 | 0.94 | |
| F-1 | 5/1/2009 | 4.64 | 2.08 | 1.32 | 0.84 | |
| F-2 | 5/1/2009 | 4.94 | 2.25 | 1.49 | 0.95 | |
| F-3 | 1/27/2017 | 5.01 | 2.29 | N/A | 1.94 | |
| 529-A | 5/1/2009 | 4.75 | 2.16 | 1.43 | 0.91 | |
| 529-C | 5/1/2009 | 3.62 | 2.11 | 1.43 | 0.91 | |
| 529-E | 5/1/2009 | 4.64 | 2.12 | 1.41 | 0.90 | |
| 529-F-1 | 5/1/2009 | 4.82 | 2.19 | 1.44 | 0.92 | |
| 529-F-2 | 10/30/2020 | 4.89 | N/A | N/A | 2.61 | |
| 529-F-3 | 10/30/2020 | 4.95 | N/A | N/A | 2.64 | |
| ABLE-A | 7/13/2018 | 4.84 | 2.21 | N/A | 2.12 | |
| ABLE-F-2 | 10/30/2020 | 4.96 | N/A | N/A | 2.65 | |
| R-1 | 5/1/2009 | 4.94 | 2.25 | 1.48 | 0.94 | |
| R-2 | 5/1/2009 | 3.88 | 1.66 | 0.95 | 0.60 | |
| R-2E | 8/29/2014 | 4.18 | 1.83 | 1.09 | 1.06 | |
| R-3 | 5/1/2009 | 4.34 | 1.91 | 1.17 | 0.74 | |
| R-4 | 5/1/2009 | 4.65 | 2.08 | 1.33 | 0.85 | |
| R-5E | 11/20/2015 | 4.86 | 2.20 | N/A | 1.58 | |
| R-5 | 5/1/2009 | 4.96 | 2.26 | 1.50 | 0.96 | |
| R-6 | 5/1/2009 | 5.01 | 2.29 | 1.54 | 0.98 | |
| Indexes | 1 year | 5 years | 10 years | Lifetime (from Class F-2 inception) |
| USTREAS T-Bill Auction Ave 3 Mon (reflects no deductions for sales charges, account fees, expenses or U.S. federal income taxes) | 5.28% | 2.63% | 1.86% | 1.21% |
| For current 7-day yield information, please call American Funds Service Company at (800) 421-4225 or visit capitalgroup.com. | ||||