The Fund was reorganized on July 15, 2019, from a series of Northern Lights Fund Trust (the “Predecessor Short Duration Fund”) to a series of Leader Funds Trust (the “Reorganization”). As a result of the Reorganization, the Fund is the accounting successor of the Predecessor Short Duration Fund. The bar chart and table below provide some indication of the risks of investing in the Fund. The bar chart shows the annual returns of the Predecessor Short Duration Fund’s Investor Class shares performance for each calendar year since the Predecessor Short Duration Fund’s inception, as well as the performance of the Fund’s Investor Class after the Reorganization. Returns for the Fund’s other Classes of shares would be substantially similar because the shares are invested in the same portfolio of securities and the annual returns would differ only to the extent that the Classes do not have the same expenses. The performance table compares the performance of the Fund’s shares over time to the performance of one or more broad measures of market performance. The Fund’s past performance, before and after taxes, is not necessarily an indication of how the Fund will perform in the future. Updated performance information is available at no cost by visiting www.leadercapital.com under “Our Products” or by calling (800) 711-9164.
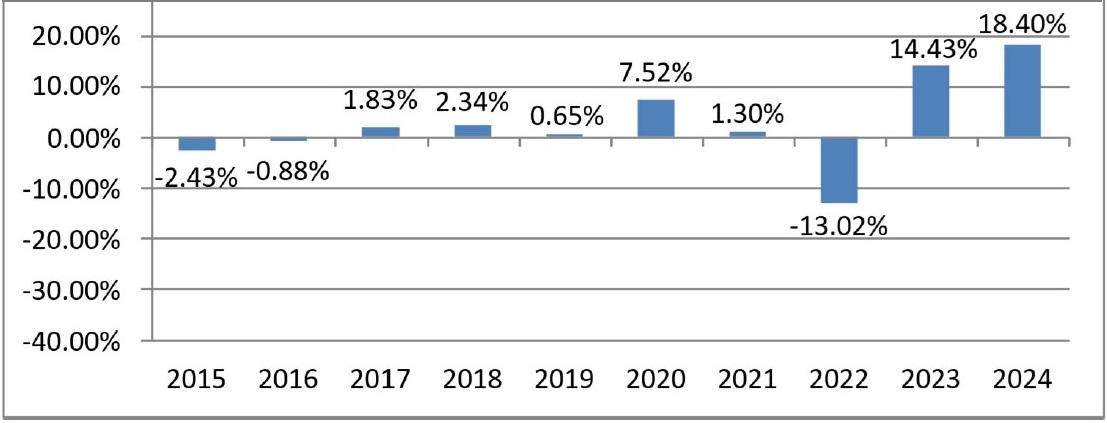
| Best Quarter: | 12/31/2020 | 15.28% |
| Worst Quarter: | 03/31/2020 | (18.67)% |
The Fund’s Investor Class shares had a total return of 6.76% during the period January 1, 2025 to September 30, 2025.
| One Year | Five Years | 10 Years | |
| Investor Class Return Before Taxes | 18.40% | 5.27% | 2.71% |
| Investor Class Return After Taxes on Distributions | 18.40% | 5.27% | 2.71% |
| Investor Class Return After Taxes on Distributions and Sale of Fund Shares | 15.89% | 5.39% | 2.95% |
| Institutional Class Return Before Taxes | 16.84% | 5.37% | 3.02% |
| Class A Return Before Taxes(1) | N/A | N/A | N/A |
| Class C Return Before Taxes(1) | N/A | N/A | N/A |
| Bloomberg U.S. Aggregate Bond Index(2) | 1.25% | -0.33% | 1.35% |
| BofA Merrill Lynch 1-3 Year U.S. Corporate/Government Index Index(3) | 4.44% | 1.59% | 1.64% |
| (1) | The Fund’s Class A and Class C shares inception date was November 28, 2024. |
| (2) | This index replaced the prior broad-based securities market index in order to satisfy a change in regulatory requirements. The Bloomberg US Aggregate Bond Index measures the performance of investment grade, fixed-rate taxable bond market and includes government and corporate bonds, agency mortgage-backed, asset-backed and commercial mortgage-backed securities (agency and non-agency). Unlike a mutual fund, an index does not reflect any trading costs or management fees. Investors cannot directly invest in an index. |
| (3) | The BofA Merrill Lynch 1-3 Year U.S. Corporate/Government Index is an index tracking short-term U.S. government and corporate securities with maturities between 1 and 2.99 years. The index is produced by BofA Merrill Lynch. The index does not reflect the deduction of fees, expenses or taxes that mutual fund investors bear. Unlike a mutual fund, an index does not reflect any trading costs or management fees. Investors cannot directly invest in an index. |
After tax returns are calculated using the historical highest individual federal marginal income tax rates and do not reflect the effect of state and local taxes. Actual after-tax returns depend on an investor’s tax situation and may differ from those shown, and after-tax returns shown are not relevant to investors who hold shares of the Fund through tax-deferred arrangements, such as 401(k) plans or individual retirement accounts (“IRAs”). After-tax returns are shown for only Investor Class shares, and after-tax returns for other classes will vary.
The Fund was reorganized on July 15, 2019, from a series of Northern Lights Fund Trust (the “Predecessor Fund”) to a series of Leader Funds Trust (the “Reorganization”). As a result of the Reorganization, the Fund is the accounting successor of the Predecessor Fund. The bar chart and table below provide some indication of the risks of investing in the Fund. The bar chart shows the annual returns of the Predecessor Fund’s Investor Class shares performance for each calendar year since the Predecessor Fund’s inception, as well as the performance of the Fund’s Investor Class shares after the Reorganization. Returns for the Fund’s other Classes of shares would be substantially similar because the shares are invested in the same portfolio of securities and the annual returns would differ only to the extent that the Classes do not have the same expenses. The performance table compares the performance of the Fund’s shares over time to the performance of one or more broad measures of market performance.. The Fund’s past performance, before and after taxes, is not necessarily an indication of how the Fund will perform in the future. Updated performance information is available at no cost by visiting www.leadercapital.com under “Our Products” or by calling (800) 711-9164.
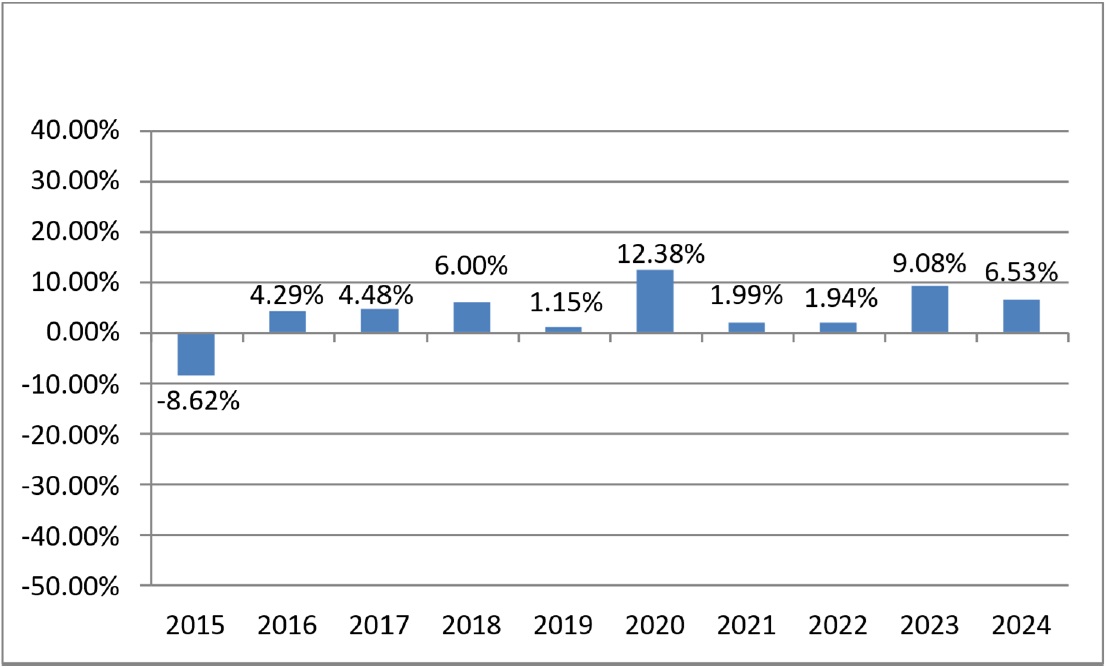
| Best Quarter: | 12/31/2020 | 13.38% |
| Worst Quarter: | 3/31/2020 | (13.92)% |
The Fund’s Investor Class shares had a total return of 3.84% during the period January 1, 2025 to September 30, 2025.
| One Year | Five Years | 10
Years or Since Inception | |
| Investor Class Return Before Taxes | 6.53% | 6.46% | 3.92% |
| Investor Class Return After Taxes on Distributions | 6.53% | 6.46% | 3.92% |
| Investor Class Return After Taxes on Distributions and Sale of Fund Shares | 6.43% | 6.00% | 3.82% |
| Institutional Class Return Before Taxes | 7.03% | 6.92% | 4.38% |
| Class A Return Before Taxes(1) | 3.49% | N/A | 8.06% |
| Class C Return Before Taxes(1) | N/A | N/A | N/A |
| Bloomberg U.S. Aggregate Bond Index(2) | 1.25% | -0.33% | 1.35% |
| (1) | The Fund’s Class A and Class C shares inception date was November 28, 2024. |
| (2) | The Bloomberg US Aggregate Bond Index measures the performance of investment grade, fixed-rate taxable bond market and includes government and corporate bonds, agency mortgage-backed, asset-backed and commercial mortgage-backed securities (agency and non-agency).Unlike a mutual fund, an index does not reflect any trading costs or management fees. Investors cannot directly invest in an index. |
After tax returns are calculated using the historical highest individual federal marginal income tax rates and do not reflect the effect of state and local taxes. Actual after-tax returns depend on an investor’s tax situation and may differ from those shown, and after-tax returns shown are not relevant to investors who hold shares of the Fund through tax-deferred arrangements, such as 401(k) plans or IRAs. After-tax returns are shown for only Investor Class shares, and after-tax returns for other classes will vary.